
Abstract
As financial institutions increasingly offer robo‐advisors (RAs) as a service, the empirical evidence on their performance, particularly during market downturns, remains limited. We study the impact of using RAs on investment performance during the 2020 financial crisis caused by the COVID‐19 global pandemic. We obtain daily portfolio and transaction data of investors on an online investment platform. Besides making investment decisions by themselves, investors can also leverage an RA system offered by the platform. We match RA users with other investors who did not use the RA with similar investor and portfolio characteristics before the market crash, then compare their portfolio returns after the crash. We find that RA users experienced significantly fewer losses during the market downturn, and this performance advantage came from the RA‐managed assets (rather than assets managed by RA users themselves). We further show that the RA system adjusted its portfolios to hold less risky funds, whereas human investors stayed with their status quo and did not reduce the risk of their portfolios, which partly accounted for the performance discrepancy. Importantly, the RA’s superior performance was not simply a continuation of its performance in a normal market; in fact, we find RA users to have similar portfolio returns as non‐RA investors during normal markets, and the benefits of RA's risk‐reduction trading strategy only manifested during the financial crisis. Our work offers an empirical assessment of RAs’ performance under different market conditions and advances the understanding of algorithmic decision making in financial markets.
INTRODUCTION
With the advances in machine learning and artificial intelligence, automated investment systems such as robo‐advisors (henceforth referred to as RAs) are increasingly used for investment decision support (Abraham et al., 2019; D'Acunto et al., 2019). A typical RA can manage portfolios on behalf of a human investor and make automated investment decisions based on the investor's preferences and goals. RAs represent a disruptive technology in investment management (Shanmuganathan, 2020). In 2019, over $820 billion of assets were managed by RAs, and the size of RA‐managed assets is projected to have a 26% annual growth rate between 2020 and 2024.1
Despite the increasing popularity of RAs and their potentially disruptive role in the financial service industry, there are also several doubts about whether this technology can benefit its users in practice. First, although previous research highlights a few theoretical advantages of RAs, such as their efficiency in taking actions and sophisticated, model‐based investment strategies (Abraham et al., 2019; D'Acunto et al., 2019), RAs’ actual performances have received some criticism (Clarke, 2020; Ji, 2017). Under normal market conditions, RAs do not seem to systematically outperform human investors. For example, analyses of Betterment (a leading RA provider) showed that RA‐managed portfolios earned lower annual returns both in the short and long term than the returns of Vanguard's Target 2050 fund, which is a common investment choice of many people for their retirement savings (Muller, 2023). In fact, RAs are often marketed as tools that bring investors “convenience” and “peace of mind,” rather than superior returns (Muller, 2023). Second, empirical evidence of RA's performance during a financial crisis is highly limited. The first RAs were introduced
In this paper, we seek to examine the investment performance of an RA system and human investors before, during, and after the COVID‐19 market crash (i.e., the first global financial crisis for modern RAs), thereby offering much needed empirical evidence of RAs’ performance under different market conditions (i.e., normal market, downturn, and recovery). The COVID‐19 pandemic has created profound impacts on almost all aspects of human activities (Collis et al., 2022). The global economy suffered a 3.5% GDP reduction in 2020 (Yeyati & Filippini, 2021). As economic activities staggered, the pandemic also caused substantial turmoil in the financial markets. Beginning in late February 2020, the global stock market witnessed the fastest crash in history (Reinicke, 2020; Smith, 2020). With rapid increases in case numbers, various lockdown restrictions, and the resulting uncertainty, and pessimistic assessments of firms’ prospects, the global stock market suffered $6 trillion losses within one week between February 24 and 28, and the S&P 500 index lost over $5 trillion in the same week (Ozili & Arun, 2023). The devastating decline persisted until the US Federal Reserve Board announced policies to support the flow of credit to large corporations on March 23, and the approval of the CARES Act, a $2 trillion relief bill from the US Senate on March 27.2 COVID‐19 offers an advantageous empirical context because, unlike other financial crises that were induced by preexisting human factors or economic conditions (e.g., financial malpractices and manipulations), the global pandemic imposed an exogenous shock to the market (Albuquerque et al., 2020).
We collaborate with a leading online investment platform in Taiwan where people can invest in mutual funds. The platform has also offered an RA system since April 2019, which can make investment decisions for its users. The RA system resembles most other typical RAs on the market, which collect investors’ risk preferences and investment goals based on the questionnaires they fill out during initial registration on the platform, based on which the systems build portfolios and rebalance over time (Alsabah et al., 2021, Grealish & Kolm, 2023). We create a dataset of daily portfolio and transaction information for each investor on the platform from January to April 2020. Following prior work (Albuquerque et al., 2020; Ramelli & Wagner, 2020), we treat February 24, 2020 as the date that marked the beginning of COVID‐19 market crash, and then include 4 weeks before and 4 weeks after February 24 as our observation window. Because the decision to adopt the RA system can be correlated with various investors’ characteristics and affects their investment performance in a nonrandom manner, we rely on a matching approach to identify RA users and other investors who did not use the RA (non‐RA investors hereafter), which are otherwise similar in terms of demographics, risk preferences, portfolio characteristics, and trading patterns before market crash. Using the matched sample, we compare the investment performance and behaviors of RA users versus non‐RA investors during the market crash.
Our analyses reveal several important findings. First, during the 4‐week period after February 24, non‐RA investors lost 1.46% per day (equivalent to a 29.2% drop in total). Our results show that RA users experienced 0.185%
We also conduct several additional analyses to extend our findings and provide more nuanced insights. Notably, we demonstrate that RA's performance advantage in our study cannot be attributed to other common types of investor decision biases, such as trend‐chasing or rank effect biases (considered in D'Acunto et al., 2019), or simply buying more funds to diversify a portfolio. These analyses further highlight the RA's risk‐reduction trading strategy as a unique mechanism underlying its performance advantage during market downturn. Additionally, not all users relied on the RA to the same extent, and further analyses show that those who delegated a larger proportion of their assets to be managed by the RA (e.g., younger or less experienced investors) also benefited more during the market downturn.
We contribute novel theoretical insights and evidence toward a more holistic understanding of RAs. RA services are offered by an increasing number of financial institutions, but their performances, especially during market downturns, have received limited empirical evaluations. Our work demonstrates RAs’ ability to benefit their users during a market crash. More importantly, unlike many algorithmic systems whose advantages stem from more efficient information process or task automation, the RA system in our study outperformed human investors not because of higher trading frequency, but due to its more effective adjustments of portfolio risks. When the market headed to a crash, while human investors continued to trade at similar risk levels, RA instead traded adaptively to reduce risks and mitigate losses. While the RA's risk‐conscious trading strategy was also present under normal market conditions, its benefits manifested only during the crash. Moreover, our work also contributes to the financial services and operations literature, by providing empirical evidence on RA's resilience under unusual market conditions and showing the power of digital technologies in risk/disaster management (Gupta et al., 2016; Yan & Pedraza‐Martinez, 2019). This can encourage wider adoption of RAs and bring operational value to financial institutions.
RELEVANT LITERATURE
Our work lies at the intersection of technology, financial services, and operations management (Hatzakis et al., 2010; Wang et al., 2021; Zhang et al., 2022). It is informed by several streams of relevant literature, which we briefly discuss in this section. First, we review the literature on RAs and summarize key findings on the antecedents of RA adoption and the impacts of RA usage. Second, our evaluation of RA would likely be incomplete without an understanding of how human investors make financial decisions; thus, we review the literature on behavioral patterns of human investors, with a focus on different types of investment decision biases. Third, we also briefly discuss the literature on algorithmic decision making and highlight how our study of RAs contributes to this emerging stream.
Robo‐advisors
RAs are quantitative algorithmic systems designed to manage investors’ portfolios and support financial investment decisions. Beketov et al. (2018) analyzed 219 RAs worldwide and summarized some commonalities in their designs. An RA typically consists of five main building blocks: asset selection, investor profile identification, asset allocation and portfolio optimization, monitoring and rebalancing, as well as performance review and reporting. Put differently, an RA works by soliciting its users’ investment goals and preferences, based on which it assembles a proper portfolio and makes adjustments over time.
One stream of existing research on RAs has focused on understanding the factors that drive RA adoption and use. First, users’ perceptions of RAs affect their adoption tendency. Tauchert and Mesbah (2019) found that the perceived expertise of RAs and the ability to make decisions efficiently are significant antecedents to adoption. Users who are more familiar with robots tend to have higher perceived usefulness and more favorable attitudes toward RAs, which also lead to adoption (Belanche et al., 2019). Second, the design and presentation of RA tools can influence users’ decisions to rely on RAs. Hodge et al. (2021) found that investors are more likely to rely on the recommendations of an unnamed RA, especially when the RA is perceived to be performing a complex task. Third, how users can interact with RAs also plays an important role. For example, allowing users to retain control over RAs’ decisions can reduce the perceived risk associated with full automation and thereby increase reliance on RAs (Rühr et al., 2019).
Another set of literature instead discusses the impacts and implications of RAs on individual investors and the finance industry. Abraham et al. (2019) suggested that RAs create several benefits for investors, including making investment more accessible and automated, reducing the cost of financial advising, and mitigating behavioral biases that often present in human decision making. However, investors also need to understand common drawbacks of RAs, such as having only limited and partial knowledge of investors’ risk profiles and reducing their engagement in investment activities (Abraham et al., 2019; Tertilt & Scholz, 2018). Finally, the increasing popularity of RAs in the finance industry has also received regulatory attention. For instance, Ji (2017) discussed several regulatory concerns with RAs and argued that regulations should focus on how RAs can be programmed to reconcile potential conflicts of interests between the investors and the RA providers.
An important gap in the RA literature is a lack of understanding of RAs’ performance during market downturns (Deschemes & Hammond, 2019; Jung et al., 2019). The adoption and use of RAs are still in the early stage (Clarke, 2020, p. 16), and there is a lack of clear scientific evidence regarding their performance (Tertilt & Scholz, 2018, p. 71). RAs are often treated as tools that bring “convenience” and “peace of mind” to investors (Muller, 2023), with limited performance benchmarking. Importantly, because modern RAs were developed and popularized after the 2008 financial crisis, both their pros and cons are insufficiently understood during market turmoil (Jung et al., 2019), and observing RAs’ performance during market downturns is a necessary test of their robustness (Deschemes & Hammond, 2019, p. 185; Lopez et al., 2015, p. 15). Prior literature on other types of algorithmic trading systems (e.g., high‐frequency trading algorithms) suggests that their impact on investors and markets is complex. While algorithmic trading might benefit investors via cost savings and efficiency improvement, it can also magnify the damages to financial systems during crises because of feedback loops or errors (Kirilenko & Lo, 2013). Such concerns are exemplified by the infamous Flash Crash on May 6, 2010, caused by algorithmic trading, which resulted in a 9% loss of stock indexes within 36 min (Jung et al., 2019). In the same vein, potential errors in RAs’ trading systems triggered by unusual market conditions can adversely impact investors on a large scale (Clements, 2019). Our work, by measuring RAs’ performance during the COVID‐19 financial crisis, provides necessary empirical evidence toward a more comprehensive understanding of RAs.
Behavioral patterns of human investors
Conventional finance theories often assume investors are rational and would consider all available information when making financial decisions, yet research in behavioral finance has indicated that individual investors largely deviate from such a rational assumption (Agarwal et al., 2017; Barber & Odean, 2013). A large body of empirical research has extensively studied the behavioral patterns of human investors, with a focus on identifying and understanding potential decision biases and irrational behaviors. Human investors with bounded rationality are known to suffer from various forms of biases when making financial decisions under uncertainty. Table A1 in the Supporting Information summarizes a few representative types of decision biases. During a financial crisis, due to the substantial uncertainty (e.g., drastic short‐term fluctuations) in market conditions and the frequent arrival of new information, investors may become more susceptible to decision biases. For example, Michayluk and Neuhauser (2006) found evidence of overreaction during the 1997 Asian financial crisis, where investors engaged in excessive trading in response to fast‐changing market information. Hoffmann et al. (2013) also showed that trading frequency increased during the 2008–2009 financial crisis, but investors maintained a similar level of portfolio risk.
How would information technologies affect investor biases? Studies have shown mixed results. One set of research suggests that IT‐enabled platforms do not necessarily reduce biases, and may even magnify them. Park et al. (2013) found evidence of confirmation bias (preference of messages that supported their beliefs) when investors used online stock message boards. Lin and Viswanathan (2016) showed that investors in the online crowdfunding market demonstrated substantial home bias (preference to transact with parties that were geographically closer to them). Meanwhile, other research indicates that IT can reduce biases. Emery and Gulen (2020) found that information access over the Internet can lead to a decrease in investors’ home bias. D'Acunto et al. (2019) also showed that adoption of RA can help reduce investors’ trend‐chasing, rank effect, and disposition effect biases. Thus, information technologies may serve as a double‐edged sword that can be beneficial or harmful depending on how investors use them.
Algorithmic decision making
Beyond the application of RAs in the financial industry, algorithmic systems based on machine learning or artificial intelligence models have increasingly been used to support decision making in various domains. To name a few examples, predictive machine learning tools, such as deep learning models, can enhance cancer diagnosis and classification (Fakoor et al., 2013), recidivism prediction (Chouldechova, 2017), fraud detection (Wang & Xu, 2018), and stock market forecasting (Fischer & Krauss, 2018)
The benefits of using algorithmic systems in decision making can be attributed to several ways in which algorithms may outperform humans. First, algorithmic systems are typically equipped with large information processing capacities, whereas humans are cognitively more constrained (Simon, 1997). Second, algorithmic systems can act with higher efficiency than what is humanly possible. High‐frequency trading systems that execute trades within milliseconds provide a case in point. Despite receiving a negative reputation for their roles in the 2010 “Flash Crash” (Kirilenko & Lo, 2013), these systems generally make the market more efficient (Brogaard et al., 2014; Conrad et al., 2015). Third, carefully designed algorithms can be less bias‐prone than their human counterparts. For example, Kleinberg et al. (2018) designed a predictive machine learning model to make jail/bail decisions, which achieved higher accuracy and lower racial bias than human judges. A similar pattern was found in lab experiments (Green & Chen, 2019). Informed by these insights, we also seek to identify the factors that drive RAs’ performance during the market downturn, by examining the RAs’ trading strategies.
THEORY AND HYPOTHESES DEVELOPMENT
In this section, we develop two sets of hypotheses, respectively, describing the investment performance as well as the trading strategies of RAs and human investors during a financial crisis. In general, we expect RA users to endure fewer losses than those who do not use RAs, and that the RAs’ performance advantages during a financial crisis can (partly) be attributed to their more
Investment performance
Can RAs benefit their users during a financial market crash? The answer to this question is not immediately clear. Different from prior work that typically evaluates RAs under regular market conditions (e.g., Abraham et al., 2019; D'Acunto et al., 2019), we study an RA's performance during an unprecedented financial crisis, thereby offering a much‐needed holistic test of its robustness (Deschemes & Hammond, 2019; Jung et al., 2019; Lopez et al., 2015). Specifically, a financial crisis usually comes with an overwhelming inflow of information, dramatic market movements in short periods of time, and generally very high uncertainty (Hoffmann et al., 2013). We argue that RAs are indeed capable of mitigating losses during such an unusual market condition for a few reasons.
First, RAs can more efficiently process large amounts of market information than human investors. Human investors with limited information processing and cognitive capacities will likely suffer from information overload and rely heavily on heuristics to make decisions (Kahneman et al., 1982). Engaging in trading activities with only partial information about the market can result in suboptimal investment decisions. For instance, studies have shown that investors have only limited attention and processing power (Hirshleifer et al., 2003), which can lead to inappropriate reactions to the market (You & Zhang, 2011) or concentrated investments in attention‐grabbing stocks (Barber & Odean, 2008). In contrast, RAs typically leverage computational algorithms and systems with sufficient processing powers, and also have access to market information from multiple sources (Beketov et al., 2018). Through 24/7 automated operations, RAs can engage in active portfolio management in response to market movements (Grealish & Kolm, 2023).
Second, RAs typically employ more systematic and principled investment strategies and can be less vulnerable to decision biases than human investors. Modern RAs are designed to make investment decisions using mathematical models of the market. For instance, a comprehensive review of over 200 RAs by Beketov et al. (2018) revealed that most RAs use the MPT as the methodological framework for asset allocation. They select assets from a large pool of financial products and rely on optimization methods to build portfolios that achieve return targets given an acceptable risk level. In comparison, average human investors are typically less sophisticated and make decisions based on heuristics and past experiences (Shah et al., 2018). It is known in the psychology literature that heuristic decision making may fall victim to decision biases under uncertainty (Kahneman et al., 1982; Tversky & Kahneman, 1974), stress (Yu, 2016), and time pressure (Lehner et al., 1997). A financial crisis magnifies all of these adversarial factors and, therefore, may make investors even more vulnerable to biases. In contrast, prior literature (e.g., Abraham et al., 2019; D'Acunto et al., 2019) has shown that RAs can be more robust against some common decision biases such as trend chasing, rank effect, and disposition effect.
Although RAs’ advantages in more efficient processing of market information, model‐based strategies, and fewer decision biases are arguably also present during normal times, the payoff of having these advantages may be limited (e.g., one could achieve decent returns simply by following the market). However, they will likely become much more important during a financial crisis due to escalated uncertainty and information overload. We expect that a financial crisis elevates the need to make decisions that are informed, principled, and less bias‐prone, and as a result, RAs can gain an edge over human investors. Therefore, we posit:
Trading strategies
We next formulate several hypotheses regarding the potential mechanisms behind RAs’ performance advantage over human investors. We argue that RAs’ advantage may be associated with two specific characteristics of their trading strategies, namely
We expect RAs to engage in more frequent trading activities than human investors during a financial crisis. Hoffmann et al. (2013) showed that market turmoil during a financial crisis is not just about losses—it also presents plenty of opportunities to trade (e.g., buying assets at lower prices than usual). We argue that, owing to their superior efficiency in information processing and 24/7 automated operations, RAs will engage in more trading activities than human investors in order to take advantage of market movements or react to abnormal market conditions. Human investors may still trade actively (compared to themselves in the past; Hoffmann et al., 2013), but will comparatively execute fewer trades than RAs.
We also expect RAs to hold less risky portfolios than human investors during a financial crisis. For typical modern RAs, risk control is an important part of their portfolio optimization procedure (Beketov et al., 2018). RAs engage in portfolio risk management via rebalancing, which involves buying and selling assets in order to maintain a desired level of risk. Disciplined rebalancing is a key strength of RAs (Grealish & Kolm, 2023), and can provide systematic performance enhancement (Bouchey et al., 2012). During a financial crisis, risk level of the entire market is on the rise, and lower risk assets tend to endure fewer losses than higher risk assets. As a result, we expect an RA to actively reduce the portfolio risk level (e.g., by selling highly risky assets and buying less risky ones) in order to mitigate losses. In contrast, human investors relying on heuristic decision‐making processes that are potentially bias‐prone are likely less effective in risk management, for example, they may fail to adjust the risks of their portfolios (Hoffmann et al., 2013).
We further note that these expected changes in trading frequency and portfolio risk are aligned with predictions of MPT. The key idea of MPT is to maximize expected portfolio return for a given risk level. During a market downturn, asset prices may see a rapid decline and generally experience more volatility. If an investor does nothing, their portfolio performance will be exposed to higher uncertainty as a result of being in a systematically riskier market. As a result, one has to engage in active trading to manage portfolio risk. This naturally (1) increases trading frequency and (2) decreases portfolio risk level. Overall, we posit:
Finally, in addition to measuring the differences between RA and human investors in terms of trading frequency and portfolio risk, we also seek to test whether these differences, if any, can help explain the RA's performance advantage over human investors during a financial crisis. Therefore, we posit (and later empirically test) the following two mediation hypotheses:
RESEARCH CONTEXT AND METHOD
Research context
To answer our research questions, we collaborate with a leading mutual fund investment platform in Taiwan. The platform provides an online marketplace where individual investors can invest in over 2900 mutual funds sold by asset management companies around the world (e.g., Morgan Stanley, Fidelity, PIMCO). Investors engage in serious, nontrivial investments on this platform.3 They can screen mutual funds based on various characteristics, such as regions, industries, past performances, and risk levels, as well as execute transactions and manage their portfolios in real‐time through an easy‐to‐use web interface, which also hosts comprehensive and timely information on available funds (net value, return history, risk level, etc.). As a two‐sided platform that facilitates transactions between individual investors and asset management companies, it profits by charging commission fees from asset management companies and compensates individual investors by waiving the transaction fees. At the time of registration, each investor fills out a questionnaire to indicate their risk preferences (details discussed later).
After more than a year of research and development and in collaboration with the Industrial Technology Research Institute in Taiwan, the platform launched an RA system in April 2019. To encourage adoption, the platform offered the RA for free. While the RA system's design and implementation details are proprietary to the platform, it is highly similar to other representative RAs on the market (e.g., Vanguard Digital Advisor, Wealthfront, and Betterment). We provide a high‐level overview of its key functional components in the following Table 1. Specifically, the RA system follows the common practice of using the questionnaire that investors fill out during registration to gauge their risk preferences (Alsabah et al., 2021). An RA user decides the amount of money delegated to the RA, and the RA automatically selects funds to invest in and builds a portfolio based on the MPT to maximize expected return rate given an acceptable risk level (Beketov et al., 2018). Over time, in response to changes in market conditions, the RA also makes automatic adjustments to the portfolio via rebalancing (Grealish & Kolm, 2023), that is, by selling overweighted assets and buying underweighted ones in order to maintain a target asset allocation. Conveniently, the RA automatically selects which funds to sell and buy when rebalancing a portfolio. Finally, RA users can also sell their entire RA‐managed portfolios at any time if they wish to.4
Key functional components of the ra system.
Empirical setting and data
In Figure 1, we plot the S&P 500 index from January to April 2020. The graph illustrates the market's sharp decline in the third week of February as COVID‐19 cases surged globally. It was not until late March, after the signing of the second Coronavirus Emergency Aid Package, that the market began to recover.5
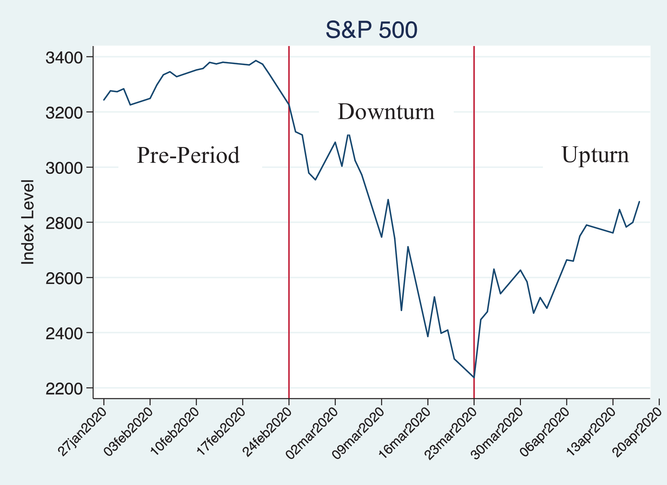
S&P 500 index between January and April 2020.
The COVID‐19 pandemic, therefore, serves as a natural shock to the financial market and investors because the market crash is the consequence of an unexpected public health crisis rather than other economic conditions or activities. Following prior research (Albuquerque et al., 2020; Ramelli & Wagner, 2020), we treat February 24 as the financial crisis shock date because it marked the beginning of the accelerated market decline, and the market saw a huge downturn by almost 30% in merely 1 month. We further treat March 23 as the beginning of market recovery due to fiscal stimulation policies. For the empirical analyses, we include 4 weeks before February 24 as the “pre‐period” (i.e., before the market crash took place), 4 weeks between February 24 and March 22 as “downturn” (i.e., market crash due to COVID‐19), and 4 weeks after March 23 as “upturn” (i.e., market recovery due to fiscal stimulation and relief packages). Our main analyses focus on the 8‐week time window of preperiod and market downturn, and we consider the upturn period in an extended analysis.
We obtain data on investors and funds from the platform. For each investor, our data include (1) each trading activity (buy or sell) and trading amount; (2) whether each trading activity was conducted by the RA or not; (3) investor demographics (age, gender, occupation, and residency); and (4) risk preferences that were self‐reported by the investor in the registration questionnaire (investment experience, proportion of income used for investment, time to redeem investment, acceptable volatility, risk‐seeking behaviors, and capabilities to handle loss). For each fund, our data include its name, daily net value, fund trading currency, daily currency exchange rate,6 and fund risk score.7
Table 2 lists the key variables used in our analyses and their definitions, and Table 3 presents the summary statistics. In total, we have 14,122 investors who held portfolios during the 8‐week time window that we studied. Investors in our sample are 45.2 years old on average, among which 55.2% are females, and 80.4% live in metropolitan areas. They tend to be risk seeking, as indicated by their self‐reported risk preferences. Notably, because RA is a relatively new service offered by the platform, only 2.3% of investors in this platform have ever used it since the service became available (some of them are excluded from our analyses because we restrict our sample to users who hold portfolios during our observational window). We further construct a binary indicator, 


Descriptions of key variables.
Summary statistics (
A small proportion of investors who are younger than 20 can also open investment accounts with guardians’ approval. Our results are robust with the exclusion of these investors.
Empirical models
Under the natural shock of the COVID‐19 pandemic to the financial market, our main identification strategy leverages a matching‐based approach in combination with panel data regressions. Specifically, to understand the effect of RA on investment performance during the COVID‐19 market downturn, we carry out analyses both at the user level (comparing performance of RA users vs. non‐RA investors) and at the asset level (comparing performance of RA‐managed assets vs. human‐managed assets). We specifically rely on asset‐level analyses to test our hypotheses.
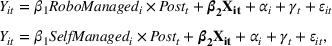
First, at the user level, we compare the daily portfolio return between investors who used RA and those who did not in both preperiod and market downturn with the following regression specification:


The validity of regression (2) hinges on removing systematic differences between RA users and non‐RA investors before the market downturn (which, if present, may drive the performance gap during market downturn). As our main identification strategy, we use a matching approach to construct the groups of RA users and non‐RA investors who were statistically indifferent during the preperiod. This ensures that the observed performance gap in the postshock downturn period is not a result of preexisting differences. We perform a one‐to‐one nearest neighbor based propensity score matching without replacement (Rosenbaum & Rubin, 1983), based on four sets of variables: (1) investors’ demographics (age, gender, occupation, and residency); (2) investors’ self‐reported risk preferences; (3) preperiod portfolio information (portfolio net value, portfolio risk scores, and percentage of funds trading in US dollars); and (4) investors’ preperiod trading patterns (average daily trading frequency and trading amount).8 In other words, we match each investor who used RA to another non‐RA investor (
To test our hypotheses and make sense of any effects of RA at the user level, we drill down to the asset level and separate an RA user's portfolio into RA‐managed assets and self‐managed assets. For each part of the portfolio, we follow the same matching procedure as described above to match it with a portfolio held by an investor who did not use the RA system. This creates two different matching samples: one where RA‐managed assets are matched with non‐RA investors’ portfolios (


MAIN RESULTS
Impact of RA on investment performance during market downturn (user‐level results)
We begin by conducting a formal test of parallel trends to show that the daily portfolio returns of RA users and non‐RA investors do not differ during the preperiod. Having parallel pretrends is important in order to conclude that any observed performance changes during market downturn is not merely a continuation of preexisting differences. Similar to the common practice in the literature (e.g., Cui, 2022; Kumar & Telang, 2012; Reher & Sokolinski, 2023), we use a relative time model where 

Estimation of regression specification (2) shows that investors who used RA endured significantly fewer losses during the market downturn than matched non‐RA investors (
Asset‐level results for hypotheses testing
We next present asset‐level estimation results of specification (3) for hypotheses testing. We carry out similar parallel trend tests for the two matching samples that involve RA‐ and self‐managed assets, respectively (Table A4 in the Supporting Information). Based on Table 4, RA‐managed assets significantly outperformed matched non‐RA portfolios during market downturn (
RA‐managed and self‐managed assets’ performance during market downturn.
To make sense of the RA system's performance advantage during market downturn and to test our hypotheses H2a and H2b, we examine the trading strategies of the RA system and human investors in terms of the number of daily transactions and portfolio risk score. The results are presented in columns (1)–(4) of Table 5. Interestingly, results in column (1) suggest that there were no significant differences in the number of daily transactions between RA‐managed assets and matched non‐RA portfolios (
Trading strategies during market downturn and portfolio risk mediation analysis.
In contrast, analyses on portfolio risk in columns (2) reveal that RA‐managed assets had lower risks in the downturn period (
To test whether the RA system's trading strategies can help explain its performance advantage over human investors (i.e., H2c and H2d), we carry out mediation analyses (Baron & Kenny, 1986). Take mediation by portfolio risk as an example; a complete mediation analysis consists of three steps: (1) establish significant impact of RA on portfolio return (column (1), Table 4); (2) establish significant impact of RA on the potential mediator, portfolio risk score (column (2), Table 5); and (3) check whether controlling for portfolio risk would reduce the effect of RA on portfolio return. Note that for step (3), we need to add the portfolio risk as well as its interaction with 


To summarize, our results suggest that the RA system did not trade more frequently than human investors during the market downturn. However, it traded
RA performance during normal market condition
So far, we have established that RA system outperformed human investors during the market downturn, partly due to its risk‐reduction trading strategy. However, this finding would be less interesting if RA was already outperforming human investors even during the normal market. Since the platform launched the RA system in April 2019, we used the entire 2019 data to explore the impact of RA system during the normal market condition.
For each RA user, we consider a 4‐week window before their RA adoption time as the pre‐period, and a 12‐week window after their adoption time as the postperiod (in order to gather enough observations). Our results are robust under other choices of time windows or using the full 2019 data. Each RA user is matched with an investor who did not adopt the RA system, based on the same set of preperiod matching variables as in our main analyses.10 This matching process identified 111 pairs of RA users and matched non‐RA investors. Balance tests of the matching sample are included in Supporting Information Table E1. To quantify the effect of RA adoption during normal market, we estimate the following regression specification:


We find no significant difference between RA users and matched non‐RA investors in terms of daily portfolio return during the normal market condition (

Summary of RA's impact on portfolio performance during all three market conditions.
RA performance during market upturn
Admittedly, RA's advantage during market downturn would be short‐lived if RA users started to perform worse than non‐RA investors during the subsequent market upturn. For instance, while the RA's risk‐reduction trading strategies were beneficial during market downturn, they might lead to underperformance during the upturn where more aggressive strategies may be warranted.
To evaluate the impact of RA on investment performance during market upturn, we extend our observation window by another 4 weeks, to April 20. Empirically, we use the same matched sample as in our main analyses, and interact the dummy indicator 


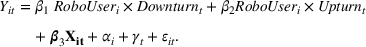
We again find a positive and significant coefficient on 

Robustness checks
In addition to our main analyses, we also conduct a number of robustness checks with identification strategy, alternative event dates, time windows, sample choices, and variable operationalization. We summarize these robustness checks as follows and include the detailed results in Supporting Information EC.B.
First, to check the validity of our results against unobserved or endogenous selection to adopt the RA system, we compute the Rosenbaum sensitivity bound (Rosenbaum, 2002) associated with our main user‐level result (column (2) in Table 6). The Rosenbaum sensitivity bound is 1.6 at a significance level of 5%. In other words, any unobserved factors would have to alter the odds of selection into the treated group (i.e., RA users) by as much as 160% in order to invalidate our main effect. We further run a Heckman two‐stage selection model and again obtain consistent results (Supporting Information Table B1). In fact, while we have relied on matching as the identification strategy in the main analyses, we can also replicate our main findings using the full sample (i.e., without matching; Supporting Information Table B2, column (1)). The results show that RA users would suffer 0.192% fewer loss than non‐RA investors per day during the market downturn.
Second, although we follow previous literature (Albuquerque et al., 2020; Ramelli & Wagner, 2020) to treat February 24 as the beginning of market downturn, other choices of shock dates are also plausible. For example, February 19 is an alternative event date because the S&P 500 index reached a historically high level of 3386.15, after which it started declining. Therefore, we repeat our main analyses with two alternative shock dates that are roughly one week before or after February 24 (i.e., February 19 and March 2, respectively). The results are included in columns (2) and (3) of Supporting Information Table B2. We observe similar results, indicating that our findings are not driven by a specific choice of shock date.
Third, we have used a 4‐week time window before and after the shock date in our main analyses, and we repeat the analyses with a shorter, 2‐week window, as well as a longer, 6‐week window. The results, which are included in columns (4) and (5) of Supporting Information Table B2, are again similar to our main findings, indicating that our findings are not driven by a specific choice of time window either.
Fourth, our main sample includes investors who held portfolios both before and after the shock date for the entire 8 weeks, which facilitates meaningful temporal comparison of portfolios. However, one could imagine that some investors who anticipated the market downturn may have cleaned their portfolios right after the shock. Excluding these agile investors could result in an unfair comparison between RA users and non‐RA investors. To alleviate this concern, we relax our sampling restriction to include both RA users and non‐RA investors who held portfolios during the entire preperiod and at least 1 day during the market downturn. We obtain similar findings (Supporting Information Table B2, column (6)). In the same vein, we perform another check where we relax the criteria for identifying RA users by keeping investors who adopted the RA
Fifth, we match a sample by treating 4 weeks in 2019 that were prior to the
Finally, we also test the robustness of our findings against several alternative measurements of portfolio returns and portfolio risk. We first follow Kramer (2012) to consider a weekly measure of portfolio return rate based on a weighted version of the
EXTENDED ANALYSES AND EXPLORATIONS
Beyond the main findings we have discussed so far, our rich dataset also enables us to explore some additional topics. In this section, we report exploratory findings on three sets of extended analyses that further explore the nuances and insights of RA's use and impact.
Differential use of the RA
As we mentioned before, not all of RA users’ portfolios are managed by the RA system, and different users delegate different proportions of their portfolios to RA. Depending on the degree of reliance (e.g., how much of an investor's portfolio is delegated to the RA), the investment performance outcome during a financial crisis could also be different. To understand the impact of the differential use of RA, we construct a new independent variable, 


Finally, investors’ reliance on RAs may also be associated with their demographic characteristics as well as experience levels. For example, research in the algorithm reliance literature has shown that younger people are more likely to rely on algorithms than older people (Ben‐David & Sade, 2018). Logg et al. (2019) found that people with expertise in forecasting were more likely to rely on their own judgments than that of an algorithm in a forecasting task. We find that older or more experienced investors tend to rely less on the RA system, and subsequently gain less benefit from using the RA system during the market downturn. Details of these analyses are included in Supporting Information Section EC.C.
Alternative decision biases
Our main analyses have shown that investors who did not use RA during market downturn failed to adjust the risk levels of their portfolio despite active trading, which is indicative of status quo bias. In this section, we explore whether investors may be under the influence of other types of decision biases as well. Specifically, we consider trend‐chasing bias and rank effect, both of which have been studied extensively in the behavioral finance literature (e.g., Bailey et al., 2011; Baker & Ricciardi, 2014) and also in the specific context of RAs (D'Acunto et al., 2019). If we find evidence of these biases, then they may also partly account for the lower performance of non‐RA investors compared to RA users.
Both trend chasing and rank effect are measured based on transactions histories. Under trend‐chasing bias, investors may falsely believe that the price of a fund is more likely to increase than decrease after observing an upward trend in the past, and buy the fund based on that belief. Rank effect, on the other hand, is investors’ tendency to sell best performing or worst performing assets but keep the ones in the middle. We adopt their measurements based on prior literature (D'Acunto et al., 2019; Hartzmark, 2015). For brevity, we include detailed descriptions and illustrations of the measurements in Supporting Information Section EC.D.
We run the specification with investor fixed effects and present the results in Supporting Information Table D1. We do not observe any significant difference in trend‐chasing or rank effect biases, which rules out these two types of decision biases as drivers of the performance discrepancy between the two groups of investors.
Portfolio diversification
One of the most widely used investment strategies (and a key idea in MPT) is portfolio diversification, namely owning multiple assets with weak correlations to control the overall portfolio risk (Markowitz et al., 2009). In this section, we examine whether diversification can also explain RA's performance advantage the during market downturn.12 We consider three standard diversification measures, namely Shannon Index, Blau Index, and Marfels Index (Woerheide & Persson, 1992). Formulas to calculate these indices are summarized in Supporting Information Section EC.G. Using them as dependent variables, we run the main regression specification to understand whether RA users and matched non‐RA investors differed on the degree of diversification during market downturn. The results are reported in Supporting Information Table G1, and RA users were not significantly different from matched non‐RA investors on any of the three diversification indices. Additionally, we compare the portfolio 

DISCUSSIONS
Discussion of main findings
In this paper, we seek to examine RAs' performance under different market conditions, with a focus on market downturn—a question that has been repeatedly raised by prior work (e.g., Deschemes & Hammond, 2019; Jung et al., 2019) and yet lacks empirical investigations. Specifically, we investigate the impact of using RAs on portfolio performance before, during, and after the financial crisis that took place in February 2020 because of the COVID‐19 global pandemic. The exogenous nature of COVID‐19 provides an unfortunate but precious empirical opportunity to examine RAs’ and non‐RA investors’ performance during market turmoil. Through our collaboration with an online mutual fund investment platform in Taiwan, we obtained daily portfolio and transaction data of individual investors, some of which had leveraged the RA system provided by the platform both before and during the crisis. We match RA users with non‐RA investors who had statistically comparable investor's and portfolio characteristics before the market crash, and then estimate the performance gap between them during the market crash. Our analyses have uncovered several major findings that are worth discussing.
First, we find that RA users outperformed non‐RA investors during the market downturn by having 0.185% fewer
Second, we dig into the potential mechanisms of the RA's performance advantage, with a focus on its efficiency and risk management strategy. By comparing the trading frequency and portfolio risk between RA‐managed assets and matched non‐RA portfolios, we find that even though they did not differ on trading frequency, RA‐managed assets had significantly lower risks than non‐RA portfolios during market downturn. Further mediation test shows that the difference in portfolio risk levels partly accounts for the performance discrepancy between RA and human investors. Based on insights from the behavioral finance literature, we point out that human investors did not actively reduce the risk of their portfolios, potentially due to the
Third, to understand whether the RA's superior performance during market downturn was simply a continuation of its performance in a normal market, we repeat the main analyses using data from 2019 (i.e., 1 year before the financial crisis). We match RA users with non‐RA investors who had similar characteristics prior to their adoption of the RA, and find no significant performance difference after RA adoption. In other words, RA did not outperform human investors in a normal market, and its performance benefits manifested only during a financial crisis.13 Finally, by extending our window to include 4 weeks of market upturn period, we demonstrate that RA users not only gained an edge in performance during the market downturn, but were also able to maintain that edge in the subsequent upturn. Overall, the results greatly endorse the practical value of using the RA to manage investors’ portfolios during financial crises.
Besides the above main findings, a few extended analyses have also revealed additional insights. Notably, RA's performance advantage during market downturn cannot be attributed to other common types of decision biases (namely trend chasing and rank effect), or to simply buying more funds to diversify a portfolio without explicitly managing the risk level. This further highlights RA's risk‐reduction trading strategy (and the absence of it among human investors) as a unique mechanism in our context. Furthermore, not all users relied on the RA to the same extent, and asset‐level analyses show that those who delegated a greater proportion of their portfolios to be managed by the RA (e.g., younger or less experienced investors) also benefitted more during the market downturn.
Theoretical and practical implications
Our work offers theoretical implications for financial services and operations management. First, our work confirms the positive impacts of RAs during the financial market turmoil induced by COVID‐19. In the context of financial decision making, we show that using an RA system can significantly mitigate losses for investors, and that RA's adaptivity is an important contributor to its robustness. Our findings also speak to a long‐standing debate over the past few years to evaluate whether RAs perform well during a severe market downturn (Deschemes & Hammond, 2019; Jung et al., 2019). To the best of our knowledge, our work is among the first to examine RAs’ effectiveness during a market crash, a period of the financial cycle that modern RAs have not experienced before. Moreover, our work joins prior literature in risk/disaster management (e.g., Gupta et al., 2016; Yan & Pedraza‐Martinez, 2019) to shed light on how modern digital technologies powered by machine learning and artificial intelligence can help investors properly manage risks during financial crises. Although our findings are established in the COVID‐19 financial crisis, we believe they would likely generalize to future crises, as long as portfolio risk remains meaningfully correlated with performance and a risk‐reduction trading strategy is beneficial.14
Second, current literature on algorithmic decision making has primarily focused on the automation aspect of algorithms (e.g., Brynjolfsson & Mitchell, 2017), attributing much of algorithms’ advantage to their abilities to work faster and in larger scales. However, our findings highlight that automation is not the whole story. The RA users outperformed non‐RA investors during the market downturn not because the RA system traded more frequently but because it traded more adaptively. Therefore, a joint consideration of automation and decision strategy is necessary to understand the benefits of algorithms.
Third, our work contributes to the intersection between technology and financial services. By demonstrating
From a practical perspective, our work can inform the design and use of RA systems. Future work can consider incorporating insights from behavioral finance (e.g., recommending beneficial portfolio adjustments as default options) into RAs to nudge investors out of decision inertia (Jung & Weinhardt, 2018). In addition, different investors may not benefit from the RA equally. Especially for investors who may be unfamiliar with the RA technology, they may have a lower tendency to rely on RA, and even less if the RA's investment decisions or recommendations are at odds with their own judgments (e.g., as a result of confirmation bias). Accordingly, the practical design of RAs may also benefit from trust‐enhancing features, such as providing greater transparency for their actions.
Limitations and future research directions
Our work has a few limitations, which open up directions for future research. First, our study was conducted using a single platform's data. Although the platform attracts a decent number of investors and enables transactions across major global financial markets and the RA's key features are similar to other representative RAs on the market, it is still advisable to take caution when generalizing our findings to other platforms or contexts. Future research should consider leveraging alternative methodologies (e.g., field experiments) on other platforms to enhance our findings. Second, although the RA in our study is representative of typical RA systems on the market, we do not have access to its implementation and, therefore, cannot fully examine the algorithmic design of the RA system (e.g., exact algorithms used, hyperparameter values, set of features, characteristics of training data). Fortunately, our key result is primarily driven by the RA system's adaptive, risk‐reduction portfolio adjustments via automatic rebalancing, which is a standard feature among RA systems. Nevertheless, future studies with access to RA designs or using simulation methods can help to deepen our understanding on this issue. Third, besides RA, other popular sources of investment support include financial advisors or expert peer investors. Future research can try to compare the performance of RAs with that of personalized professional financial advisors or experienced investors on social trading platforms (Yang et al., 2022). Finally, the RA system in our research context is designed to be a convenient investment tool and has relatively simple interactions with its users—namely, a user can delegate a specific amount of their portfolio to be managed by the RA, and the RA makes automatic investment and rebalancing decisions on behalf of the user. This is in line with most mainstream commercial RA systems currently on the market (e.g., Vanguard Digital Advisor, Fidelity Go, Wealthfront, and Betterment). We believe that in contexts where richer interaction modes exist between humans and RAs (e.g., joint investment decision making), it would be important to study human‐RA interactions and design strategies that facilitate productive collaborations.
To conclude, we take a step toward understanding the impact of using RAs on investment performance during financial market turmoil. We demonstrate that an RA system, by adaptively adjusting the portfolio risk levels, can partially mitigate losses during market downturn and benefit its users.
Footnotes
1
See
2
See
3
An average investor in our matched sample held a portfolio with a net value of 1,312,558 New Taiwan Dollar (NTD), which is worth approximately 2.6 years of annual wage in Taiwan. In addition, around 55% of investors are willing to invest more than 31% of their incomes, and 54% of them report “investing for retirement” as one of their investment goals. Therefore, investors’ portfolios on this platform represent serious, non‐trivial investments for those investors.
4
We acknowledge that an investor may own other assets outside the platform. However, because outside assets were unobservable to the RA system, any investment decisions made by the RA were solely based on an investor's portfolio within the platform.
5
President Trump signed Coronavirus Emergency Aid Package on March 18, 2020:
6
One unit of other currencies (e.g., USD) to NTD.
7
The Securities Investment Trust & Consulting Association in Taiwan defines a risk score standard between 1 and 5 for the mutual funds. A higher score implies a higher risk level. For example, a risk score of 1 means that a fund has low risk, pursues stable income, and usually invests in short‐term money market (e.g., short‐term bills and bank deposits), whereas a risk score of 5 represents a high‐risk fund on aggressive growth stocks. The complete definition of each risk score is available at
8
Note that we do not match based on preperiod portfolio returns because research has shown that matching on pretreatment outcome variables may bias subsequent estimations (Chabé‐Ferret, ![]() ). Nonetheless, our test of parallel trends (Supporting Information Table A4) confirms that there was no significant difference in daily portfolio returns between RA users and matched non‐RA investors before the market crash.
). Nonetheless, our test of parallel trends (Supporting Information Table A4) confirms that there was no significant difference in daily portfolio returns between RA users and matched non‐RA investors before the market crash.
9
The average monthly salary is close to 39,191 NTD (1290 USD, based on the exchange rate of 1 USD = 30.378 NTD on February 24, 2020) in Taiwan; source:
10
The results in this section are also consistent by using the full sample without matching. In addition, we adopt a stacked difference‐in‐differences strategy (Baker et al., ![]() ; Cengiz et al. 2019). Because different RA users adopted the RA system at different points in time, the empirical setting under the normal market amounts to a “staggered adoption” scenario. Stacked DID can be more robust than the standard DID with two‐way fixed effects under the staggered adoption case because it constructs a unique dataset for each treated event (i.e., each time a user adopted RA). For each treatment cohort, it identifies the “clean” control cohort that is never an adopter during the observed window, both before and after the focal treated event (Baker et al., 2022). The Stacked DID results (omitted for simplicity) are also consistent with our findings.
; Cengiz et al. 2019). Because different RA users adopted the RA system at different points in time, the empirical setting under the normal market amounts to a “staggered adoption” scenario. Stacked DID can be more robust than the standard DID with two‐way fixed effects under the staggered adoption case because it constructs a unique dataset for each treated event (i.e., each time a user adopted RA). For each treatment cohort, it identifies the “clean” control cohort that is never an adopter during the observed window, both before and after the focal treated event (Baker et al., 2022). The Stacked DID results (omitted for simplicity) are also consistent with our findings.
11
We note that the asset‐level analyses comparing RA‐managed versus self‐managed assets that we carried out before are not applicable here because the RA‐managed assets would not have performance measures during the preperiod, before the RA system was launched. Nevertheless, as a descriptive exploration, we also compare the RA‐managed assets with self‐managed assets within RA users within the postperiod based on a
12
We thank an anonymous reviewer for suggesting this portfolio diversification perspective.
13
This result does not suggest that the RA system is “not useful.” Being able to automate investments and earn reasonable returns can be very appealing to regular people who may not necessarily have the time or skills to do so themselves. This is consistent with the value proposition of popular RAs on the market, which aims to bring investors “convenience” and “peace of mind.” In addition, this result also does not contradict D'Acunto et al. (![]() ). We note several key differences between our study and D'Acunto et al. (2019): (1) they study RA's performance in a stock market whereas the platform in our study hosts only mutual funds; (2) the RA system in D'Acunto et al. (2019) cannot trade automatically and its users decide whether to accept and carry out its trading advice; and (3) it focuses on comparing the performance of RA users before versus after their adoption of RA, rather than comparing the performance of RA users with non‐RA investors.
). We note several key differences between our study and D'Acunto et al. (2019): (1) they study RA's performance in a stock market whereas the platform in our study hosts only mutual funds; (2) the RA system in D'Acunto et al. (2019) cannot trade automatically and its users decide whether to accept and carry out its trading advice; and (3) it focuses on comparing the performance of RA users before versus after their adoption of RA, rather than comparing the performance of RA users with non‐RA investors.
14
Take the 2008 Global Financial Crisis as an example. Failures of credit rating agencies to properly assess the risks of complex financial products contributed partly to the crisis. Our results may not directly generalize to such a setting, where the RA system may engage in transactions based on highly inaccurate risk measures. In the meantime, the 2008 Global Financial Crisis also spurred new regulations that aimed at improving risk transparency and disclosure (International Monetary Fund, 2008), thereby increasing the generalizability of our findings.
15
See
References
Supplementary Material
Please find the following supplemental material available below.
For Open Access articles published under a Creative Commons License, all supplemental material carries the same license as the article it is associated with.
For non-Open Access articles published, all supplemental material carries a non-exclusive license, and permission requests for re-use of supplemental material or any part of supplemental material shall be sent directly to the copyright owner as specified in the copyright notice associated with the article.