
Abstract
Carbon emissions reduction initiatives have received considerable attention at the corporate level. Companies such as Daimler, Apple, and Amazon have publicly declared their goal of becoming carbon neutral or “net zero” in a near future. They are responding to a growing demand for sustainable products and services. Companies have a variety of options for carbon emission reductions available to them, including internal reductions such as adopting renewable energy as well as buying carbon offsets. This raises the question of whether consumers perceive the different types of carbon emission reductions as equivalent, or whether they favor the implementation of internal measures. We investigate this issue empirically through surveys and incentive‐compatible discrete choice experiments. We find clear consumer preferences and willingness to pay for companies to reduce their carbon footprint when companies internally reduce their controllable emissions rather than buying carbon offsets for these emissions, and it is especially true for eco‐conscious consumers. Consumers place roughly the same value, however, on internal reductions in controllable emissions and buying offsets for the same amount of uncontrollable emissions.
INTRODUCTION
Consumers are increasingly becoming more socially and environmentally conscious and carefully choosing the types of products they buy as a result (CDP, 2019). In one estimate, 40% of American consumers participate in the $300 billion conscious consumer market (Cohen & Muñoz, 2017), while another study estimates that sustainable products (i.e., those that have environmental labels and/or are certified by a third party) would have accounted for 25% of total retail sales in the United States in 2021 (Nielsen, 2018b). Similarly, in Europe about 26% of consumers can be classified as “pro‐environmentalists,” who are willing to pay more for sustainable products (Golob & Kronegger, 2019). Globally, about 81% of respondents in a survey feel that companies should contribute to helping the environment (Nielsen, 2018a). The COVID‐19 pandemic appears to have accelerated these trends. According to studies conducted by IBM and the National Retail Federation, purpose‐driven consumers (who are willing to change their shopping habits to reduce their environmental impact) already account for the largest segment of the population in 2022 at 44%, from 40% in 2020, in two samples of over 19,000 consumers worldwide (Haller et al., 2022). As detailed later, there is empirical evidence that some consumers in some settings voluntarily pay more for lower carbon footprint products or services (Brouwer et al., 2008; Diederich & Goeschl, 2014; Golob & Kronegger, 2019; Lanz et al., 2018; MacKerron et al., 2009; Schwirplies & Ziegler, 2016; Schwirplies et al., 2019). Facing these trends, many large consumer products firms, such as Unilever and L'Oreal, plan to introduce carbon labeling in their products (Asad, 2021).
In accordance with these trends, we focus on a product (or service) carbon footprint as a measure of its environmental impact. A product carbon footprint includes all the greenhouse gas (GHG) emissions in the product's life cycle, including sourcing of raw materials to make the product, transportation, manufacturing, distribution, use with consumers, and end of life (Greenhouse Gas Protocol, 2011). Some GHG emissions, such as burning of fossil fuels for transportation, are direct (scope 1), whereas others, such as use of electricity (scope 2), are usually indirect. A consumer‐facing firm, such as Apple or Patagonia, has control over some GHG emissions, especially those taking place within their boundaries. For example, it can switch to renewable energy and thus avoid indirect emissions from electricity use (scope 2), which may be produced by a utility burning fossil fuels. It can also use electric vehicles for its fleet. Such firms also have 
Carbon offsets are sold by nongovernmental organizations (NGOs) directly or through brokers or retailers and are instruments, sold typically in units of one metric ton of 

Hence, both internal reductions in a firm's operations and carbon offsets are accounted for in a product carbon footprint. For example, Microsoft's Xbox gaming console has been certified carbon neutral, through a combination of low‐emission materials and operations and carbon offsets for the residual emissions in the product's life cycle.1 Because carbon dioxide is a global pollutant, it should not make a difference to consumers if one ton of 
We find that, on an average for students in a major German university, consumers value internal reductions significantly more than carbon offsets when assessing controllable emissions. However, consumers value carbon offsets for uncontrollable emissions roughly equally to internal emissions reductions for controllable emissions. We then attempt to find the driver of such behavior, which is our second research question:
We find the answer to RQ2 to be positive, and we explain the reasoning in the paper. In sum, more environmentally conscious consumers might (1) be more knowledgeable of some shortcomings with carbon offsets, such as additionality and permanence (e.g., will planted trees survive?); and (2) be more sensitive to some beliefs that carbon offsets are a form of “greenwashing” (The Guardian, 2011).
The key contribution of our paper is to investigate, using revealed as opposed to stated preferences, how consumers perceive two fundamentally different types of carbon abatement initiatives by firms: carbon offsets vs. internal reductions. As discussed in the literature review, Section 2, previous research investigates consumer behavior towards carbon offsets only, without comparison with internal reductions, and such studies use
The remainder of this paper is organized as follows. In Section 2, we review the academic literature most related to our paper. In Section 3, we formally develop our hypotheses. In Section 4, we describe the results of a stated preference survey of consumer attitudes towards carbon footprint reduction methods conducted at Amazon MTurk. In Section 5, we provide our main results for an incentivized, controlled discrete‐choice experiment. We conclude in Section 6.
LITERATURE REVIEW
Our paper empirically studies the impact of the carbon footprint of a product or service and in particular the impact of internal emissions reductions by the firm compared to offsets, on consumers' willingness to pay (WTP) for the product or service. It is thus broadly related to studies of consumer behavior towards products marketed as environmentally or socially responsible. We can distinguish three substreams of literature: environmentally friendly consumer behavior in marketing, impact on a firm's demand of social responsibility (SR) violations in its supply chain, and, more closely to our paper, impact of a product's carbon footprint on its demand.
In the marketing literature, Huang and Rust (2011) posit that consumers act to maximize their happiness, which comprises their own standard of living, psychological reward from green behavior, and charitable behavior. In terms of appealing to consumer charitable behavior, there is empirical evidence that some consumers choose products or firms associated with certain social causes, or cause marketing (Krishna & Rajan, 2009), or embedded premiums (Arora & Henderson, 2007), with some arguing that such consumers feel “warm glow” (Andreoni, 1990). In terms of appealing to consumer green behavior, White and Simpson (2013) state that firms can highlight the benefits of consumer action (benefit appeals), in addition to highlighting what one should do, or what others are doing (descriptive appeals). This is consistent with our incentivized discrete‐choice experiment, where the offered service has its carbon footprint clearly stated (and if any carbon offsets or internal reductions are used), and subjects are informed and can check later that the consumption of the service indeed produces the stated carbon emissions.
In the operations literature, many papers employ analytic models that explicitly consider the negative impact on a firm's demand of inadequate environmental or SR practices in its value chain. Such practices include packaging waste (Aydinliyim & Pangburn, 2012), child labor (Cho et al., 2019), unsafe conditions for workers at suppliers' factories (Plambeck & Taylor, 2016), unsustainable wood harvesting (Orsdemir et al. 2019)), and other SR violations at suppliers (Guo et al., 2016; Kalkanci & Plambeck, 2020). In our case, subjects have a choice of service, with at least one (more expensive) option having a voluntary carbon footprint reduction by the firm. Gao (2020) and Gao and Souza (2022) model the positive impact of cause marketing practices and carbon footprint reduction, respectively, on a segment of consumers, and the corresponding impact on the firm's investments in such practices. Empirically, some researchers have found that being transparent in SR practices can have a positive impact on a firm's demand (Buell & Kalkanci, 2021; Kraft et al., 2018; Pigors & Rockenbach, 2016; Tully & Winer, 2014). Using stated preference methods, Golob and Kronegger (2019) measure consumers' WTP for environmentally friendly products in general. Our paper is more closely related to Buell and Kalkanci (2021), who conduct a field experiment to find the impact of transparency in internal versus external (to the firm) SR practices on a customer's purchasing probability. Specifically, carbon offsets in our context loosely mirror external SR practices in their context (an investment of part of the profits in the community or removing invasive species during the company's annual volunteer day). In addition, internal carbon reductions in our paper loosely mirror internal SR initiatives in their context (paying living wages to factory workers in a developing country or composting chaff from coffee roasting). Our findings are consistent with Buell and Kalkanci (2021) in that internal SR initiatives have a positive impact on sales by as much or even more than external SR initiatives. That is, we find that consumers value internal carbon abatement reductions for controllable emissions similarly to (external) carbon offsets for uncontrollable emissions. However, consumers strongly prefer internal reductions to carbon offsets for controllable emissions. Thus, consumer preferences for carbon abatement types are fundamentally different across controllable and uncontrollable emissions, a crucial distinction. In our case, the firm is transparent about the use (or not) of carbon offsets in the service carbon footprint, and we measure the WTP by consumers for a service with a lower carbon footprint through
Indeed, some researchers have empirically found that consumers are willing to pay for voluntary emissions reductions in settings such as buying offsets for airline or train tickets (Brouwer et al., 2008; Diederich & Goeschl, 2014; Lanz et al., 2018; MacKerron et al., 2009). In such setting, a consumer's only choice is whether to buy offsets for their allocated emissions in the trip; in our case consumers have a choice of different product options, with some having emissions reductions through carbon offsets, others from internal reductions using low carbon transportation, and yet others with a combination of these options.
Finally, regarding the different options for carbon footprint reduction: voluntary internal emissions reductions or carbon offsets, a stream of research has specifically analyzed how consumers perceive the use of carbon offsets by firms. Blasch and Farsi (2014) conduct a hypothetical discrete‐choice experiment and conclude that carbon offsets are perceived as differentiated goods. Using data from an international survey, Schwirplies and Ziegler (2016) find that consumers with a higher degree of green identity, which is measured on a scale that we also use in this paper, have a higher WTP for climate friendly products, on average, and that carbon offsets are perceived with a certain degree of uncertainty. Schwirplies et al. (2019) conduct a hypothetical discrete‐choice experiment for consumers choices in travel with different types of carbon offsets and find that consumers prefer offsets that are related to regional (as opposed to global) and reforestation (as opposed to renewable energy) projects. In a stated preference study, MacKerron et al. (2009) find that consumers prefer offsets that are certified by a third party when buying airline tickets. Finally, using a hypothetical discrete‐choice experiment in the airline industry, Hardisty et al. (2019) find that consumers respond significantly more favorably to a description of upstream offsets than to downstream taxes. It is clear from this literature that consumers do not perceive all offsets to be created equal. In our experiment, we do not state the origin and type of offsets in order to cleanly separate the difference in WTP between offsets and internal emissions reductions by consumers. In addition, our experiment does not present a hypothetical scenario: the service chosen by each subject actually takes place, with carbon emissions occurring as stated to subjects.
HYPOTHESES
As previously discussed, many surveys worldwide show that a growing proportion of consumers consider sustainability of a product or service as important in their purchasing decisions (CDP, 2019; Haller et al., 2022; Nielsen, 2018a, 2018b). Firms are responding to this trend, leading to a growing market of sustainable products and services, and we focus on a product or service carbon footprint as a key component of sustainability.
We can conceptualize the different options available to a company to reduce its carbon footprint into internal reductions and carbon offsets. Internal reductions are the reduction or avoidance of carbon emissions within the boundaries of a company. Examples include the implementation of energy efficiency projects, the development/expansion of renewable energies on site, and the substitution of fossil fuels (e.g., use of hydrogen fuel cells). There are emissions that occur outside the company's boundaries (scope 3 emissions), such as emissions from suppliers in resource extraction and component production. Although the firm has some control in scope 3 emissions through design choices (e.g., low emissions materials) and sourcing, in many cases the firm has little control over how resources are extracted and processed upstream in its supply chain. Because these emissions are uncontrollable, yet part of a firm's carbon footprint, the firm must buy carbon offsets, which are carbon reduction or avoidance projects outside the company's supply chain.
Gao and Souza (2022) show how a company should choose between internal reductions and buying offsets to attract eco‐conscious consumers to buy products while maximizing profits. They conclude that companies should primarily look at the marginal cost of the reduction measure and take the cheaper one, assuming that internal reductions and the purchase of offsets are considered equivalent measures.
In a sense, eco‐conscious consumers already represent a deviation from the theoretical concept of the rational profit‐maximizing decision‐maker because such consumers take the consequences for the environment into account in their purchase decisions, that is, they have environmental preferences that impact their utility. Since the reduction of carbon emissions is the answer to a global problem, climate change, and carbon emissions are a global pollutant, it is reasonable to assume that consumers would not care where the emissions are produced or reduced. This thesis would support the assumption that consumers do not distinguish between internal reductions and the purchase of offsets. If this is the case, companies could proceed according to Gao and Souza (2022) and pursue the mix of offsets and internal reductions that maximizes their profits.
On the other hand, the topic of offsets is discussed intensively and controversially in the greenwashing debate. While many companies consider offsets as a key element to achieve their climate goals (e.g., becoming “net‐zero”), environmentalists and activists are sounding the alarm (Boyle, 2021; Greenberg, 2021; Smoot, 2022). Offsets do not per se preserve natural resources and could enable irreversible exploration while maintaining a balanced carbon footprint. In order to enable sustainable compensation, offsets have to be additional and permanent. A 2016 study published by the European Commission concluded that 85% of the projects considered did not meet the additionality criterion (Cames et al., 2016). In addition, it has become apparent that there is great uncertainty regarding the permanence of offset measures. For example, severe forest fires in California in 2021 destroyed large tracts of forest that Microsoft and BP financed as offsets (Winston, 2021). The criticism around the topic of offsets and the problems that (still) exist could have the consequence that consumers distinguish between internal reductions and the purchase of offsets.
In addition to concerns about additionality and permanence of carbon offsets, there are also ethical concerns about offsets. Even assuming that an offset has a certain and identical outcome as an internal reduction, it is questionable whether an organization or individual is fulfilling its duties to society and or the environment by buying offsets rather than reducing or avoiding its own emissions. That it can make a difference to refrain from own wrongdoings instead of paying someone else for them was demonstrated (admittedly satirically, but very illustratively) by Christian Hunt and Alex Randal in 2009. As a critique of carbon offsets, they hosted the site
As we have shown, there are arguments both for and against the assumption that offsets and internal reductions are equivalent measures (global problem vs. uncertainty and ethical concerns). Since the counterarguments are both more emotional, but also more prevalent in the media, we speculate that there is a preference for internal reductions. We examine the question with the following hypothesis: Consumers prefer to avoid emissions through internal reductions rather than by compensating for emissions through the purchase of carbon offsets.
Our core argument is that consumers' preference for products that avoid emissions is based on their belief that natural resources should be preserved rather than be exploited. This belief is reflected in the so‐called new environmental paradigm (NEP). According to Dunlap et al. (2000), the NEP can be used to reflect the ecological worldview of individuals, enabling a division into the more environmentally conscious (hereafter eco‐conscious) and the less environmentally conscious. As eco‐conscious consumers are more aware of these nuances, they might be more likely to distinguish between internal reductions and the purchase of offsets. We test this relationship with the following hypothesis: Consumers with higher levels of NEP are more likely to choose avoiding emissions (internal reductions) than compensating for emissions (buying offsets) compared to consumers with lower levels of NEP.
Since it might be considered immoral to buy offsets instead of avoiding emissions, as argued above, we further hypothesize that moral behavior translates to a preference for avoiding emissions, compared to offsets. We measure moral behavior using the “moral identity” (MI) scale by Aquino and Reed (2002), as detailed later, which measures the importance of morality to an individual and is associated with moral behavior. That is: Consumers with higher levels of MI are more likely to have a preference for avoiding emissions (internal reductions) relative to compensating for emissions (buying offsets) when compared to consumers with lower levels of MI.
We empirically investigate the hypotheses through online surveys and the incentivized, controlled discrete‐choice experiment.
PRESTUDY ON AMAZON MTURK
Design
We first conducted an online experiment on Amazon MTurk to obtain some general consumer trends. Subjects were introduced to the terms carbon footprint, controllable emissions, uncontrollable emissions, carbon offsets, and internal reductions on an instruction page. The definitions of the terms were available to the subjects for the duration of the experiment. The subjects went through six stages. In stages 1–3, subjects made hypothetical choices concerning the shipment of a parcel within the United States (from east to west coast) by airmail.
In stages 1 and 2, the subjects selected one of two alternatives. In stage 1, the alternatives differed in price and carbon footprint. Subjects chose five times (in random order) between an alternative, which had a price of $35 and a carbon footprint of 15 kg, and an alternative with a zero carbon footprint and a randomly drawn price from the set {$35, $35.20, $38, $45, $70}.
In stage 2, subjects made two choices. First, they chose between two alternatives in which uncontrollable emissions (4.5 kg) were not offset. Controllable emissions were internally reduced in alternative 1 and offset in alternative 2. Second, they chose between two carbon‐neutral alternatives (i.e., uncontrollable emissions were offset), while controllable emissions were again internally reduced (alternative 1) or offset (alternative 2).
In stage 3, subjects indicated how much more they were willing to pay for alternative 2 compared to alternative 1. There were four choices between alternatives 1 and 2, with alternative 1 remaining unchanged with a carbon footprint of 15 kg. alternative 2 took (in random order) the following characteristics once for each decision: (i) uncontrollable emissions were offset, (ii) controllable and uncontrollable emissions were offset, (iii) controllable emissions were avoided through internal reductions, and (iv) controllable emissions were avoided through internal reductions, and uncontrollable emissions were offset.
In stage 4, subjects were asked general questions regarding their attitudes and views on carbon emissions and how companies should deal with them. In stage 5, we surveyed subjects' attitudes and awareness regarding the environment according to the NEP of Dunlap et al. (2000). Thereby, subjects were presented with 15 statements on the environment and nature (see Appendix A). They indicated their agreement or disagreement on a five‐point Likert scale (from “strongly agree” to “strongly disagree”). From the information provided, a score is calculated that ranges from 1 to 5, with 5 representing a very high level of environmental awareness and 1 representing a very low level. The last stage 6 consisted of demographic and socioeconomic questions. Each subject was paid $1 for participation.
Prestudy results
A total of 197 people on Mturk participated in the study and answered all questions completely: 65% of subjects reported male as their gender, and 35% reported female. The reported average age was 35 years. Survey data were collected within 2 h on December 8, 2020.
The answers to the questions in stage 1 show a clear preference for the carbon‐neutral alternative, even if this comes at a higher cost. The proportion of subjects choosing the alternative with zero carbon footprint, versus the alternative with 15 kg, depending on the price is shown in Figure 1. Subjects show price sensitivity despite the hypothetical choice, that is, the share of the carbon‐neutral alternative decreases as the price increases.
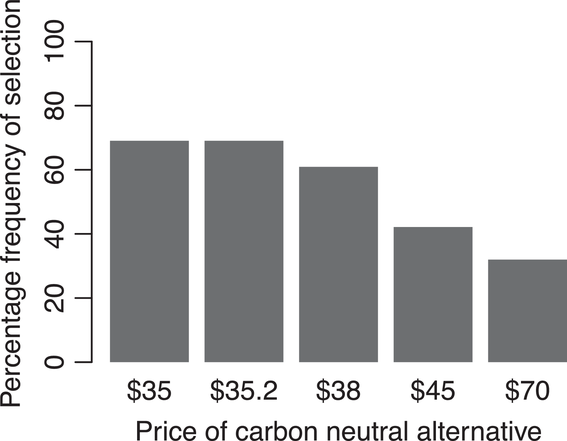
Share of carbon‐neutral alternative.
The responses in stage 2 clearly show that subjects distinguish between different measures to reduce the carbon footprint (see Table 1). In a direct comparison, internal reductions account for a larger share compared to the purchase of offsets (on average, 60% vs. 40%, binomial test, 

Percentage frequency of choice: Buying offsets versus internal reductions.
In stage 3, subjects stated a median WTP for carbon reductions of (i) $10 for uncontrollable emissions to be offset, (ii) $12 for controllable and uncontrollable emissions to be offset, (iii) $10 for controllable emissions to be avoided through internal reductions, and (iv) $10 for controllable emissions to be avoided through internal reductions and uncontrollable emissions to be offset. The average WTPs do not show a clear preference towards one of the measures (single‐factor analysis of variance), which contradicts Hypothesis 1. On average, we, therefore, do not observe that a preference for internal reductions translates to a higher WTP for this measure.
In stage 4, we observe an average NEP value of 3.34 (SD 0.61), which is significantly (
We model subjects' decision behavior with a binomial logit model. Subjects have significantly higher alternative‐specific utility from choosing the carbon‐neutral alternative (alternative 2). This utility can be translated into an implicit WTP for alternative 2 and amounts to $13.36 (


Overall, the subjects' choices are consistent with what they indicated in the final survey. Over 90% of the subjects indicated that it is important that humanity emits fewer carbon emissions. Over 80% indicated that they try to reduce their carbon emissions, and they welcome companies offering carbon‐neutral products. Furthermore, 60% stated that they consider internal reduction to be the most appropriate measure to reduce controllable emissions, 30% mentioned the purchase of offsets, and 10% stated that the two measures have the same impact from their point of view.
Summary and motivation for incentivized study
We find that subjects have on average a clear, but price‐sensitive preference for carbon‐neutral shipments. The preference is slightly but significantly more pronounced if internal reduction measures are taken. We observe that NEP is a good predictor for the (hypothetical) WTP and the means to reduce emission.
A clear drawback of this study is that it employs stated preferences only, that is, the WTP found is hypothetical. In other words, there is no cost for subjects to comply with what is considered a socially desirable behavior and to choose an environmentally friendly alternative or to indicate a high WTP (Auger & Devinney, 2007; Camerer & Hogarth, 1999; O'Rourke & Ringer, 2016). The implicit WTP of $13.36 or the explicitly stated WTP of $10 to $12 correspond to WTP between $667 and $890 per ton of 

CONTROLLED AND INCENTIVIZED DISCRETE‐CHOICE EXPERIMENT
Experimental setup
To overcome the hypothetical choice bias, we designed an experiment using oTree (Chen et al., 2016). In the experiment, subjects face a trade‐off between real monetary consequences and real carbon emissions. The experiment had an approximate duration of 75 min and was conducted with a total of 81 graduate and undergraduate students from the University of Hamburg in three sessions (27 subjects each) in December 2022. Subjects were recruited via the web‐based software
As a first task, subjects were asked to respond in writing to questions regarding studying during the COVID‐19 pandemic. A total of three questions were asked about the impact of the pandemic on students' lives in general, on their studies individually, and how they perceived their respective university's measures to deal with the pandemic. The questionnaire contained only topics that were unrelated to the actual experiment in order to avoid framing effects. The subjects had 15 min to write their answers and were then asked to put them in an envelope and seal it. As Carlsson et al. (2013) show, the endowment of subjects in experiments with windfall money can influence their behavior and they are more likely to spend more money than they would with their own, a phenomenon known as the house money effect. The house money effect can be strongly reduced or neutralized if the subjects in experiments have to work for the money endowment (Carlsson et al., 2013). In our experiment, the work performed by the subjects is the 15‐min writing task described above, and we tied the money endowment, €12, as an exchange for the envelope with the written information of the subjects.
Subsequently, the experiment was continued in a computer‐assisted manner. We collected two scales for later evaluation of the experiment. First, we replicated the well‐performing NEP scale from the prestudy. Second, we measure MI according to Aquino and Reed (2002) with 10 items on a 1–5 Likert scale (Appendix B). Thereby two constructs are formed: (i) symbolization, the degree to which the moral traits are reflected in the subjects' actions in the world, and (ii) internalization, the degree to which the moral traits are central to the self‐concept. Both constructs take values from 1 to 5, where 5 indicates high degrees and vice versa.2
We collected the scales before familiarizing the subjects with the instructions for the experiment to avoid confounding effects. Subjects were given instructions about the experiment, definitions of relevant terms (carbon footprint, controllable emissions, uncontrollable emissions, carbon offsets, and internal reductions), and 30 min to engage with the instructions. We informed the subjects that a quiz on the instructions would follow and that this quiz had to be passed in order not to be excluded from the experiment.
The quiz consisted of three blocks with several questions in each block. All questions in a block had to be answered correctly to complete the block and move on to the next block. The questions could be answered using the information from the instructions. For each block, subjects had five attempts. After three unsuccessful attempts, subjects were warned that only two attempts remained and that failure in the attempts would result in exclusion from the experiment and most of the payoff (except for a show‐up fee of €3). For each block where a subject answered all questions correctly on the first attempt, the payoff amount from the experiment was increased by €1. Subjects could generate a maximum of three additional euros from the quiz. Only subjects who successfully completed the quiz progressed to a discrete choice experiment. Subjects without success were excluded from the further course of the experiment and received a show‐up fee of €3 and eventual payments from the quiz. Subjects then decided what to do with the envelope that comprised the research data from the writing task in a discrete choice experiment. Subjects had the option of choosing to send the envelope to our research partner. The subjects were offered a €12 premium for sending their research data, minus the cost of shipping the envelope. There were six alternative shipping modes, which were associated with different costs for the subjects and with different carbon emissions3 as shown in Table 2.4 Subjects were asked to choose one of the six alternatives.
Shipping modes available to subjects, with respective costs and emissions.
As shown in Table 2, shipping modes 1–3 take place with a gasoline engine car, while shipping modes 4 and 5 occur with an electric engine car. Direct controllable emissions from gasoline combustion account for 2 kg 


Subjects started with a trial choice to familiarize themselves with the task, that is, they made a choice with no direct consequences (see Appendix D). Subsequently, each subject decided on the shipping mode a total of nine times, as follows. Each mode costs one of three possible price levels, as shown in Table 2. We used a full factorial design and generated 243 different choice sets by combining all price levels of the alternatives (three levels for each of the five shipping modes: 35 = 243 choice sets). A subject was randomly assigned to nine of the 243 possible choice sets. Over the three sessions, each possible choice set was displayed to three subjects for a decision.
After the last choice by each subject, we drew a random number to determine which decision among the nine chosen was relevant for the payoff and for the actual shipment, similarly to Ding et al. (2005). Specifically, subjects were told that one of their nine decisions determined how the envelope would be shipped, and for this (randomly chosen) decision they received €12 minus the price of the respective mode. In addition, the delivery of the envelope to the research partner through the chosen mode would cause the stated emissions. Subjects could also opt out of shipping at no cost and hence have zero emissions through the “no shipping” alternative and keep their envelope. However, by doing so, they forfeited the €12 premium.
The discrete choice task was followed by a postexperimental questionnaire (see Appendix E) on carbon emissions and measures to reduce the footprint. In addition, demographic data (age, gender, and income) were collected.
Finally, the subjects were paid according to their performance in the quiz (up to €3), their decisions regarding shipping (€12 minus the price of the chosen alternative), and which round was randomly determined for the payoff. Each subject also received a show‐up fee of €3. Taking into account the prices of the shipping alternatives, the subjects could earn between €3 and €15.25. Subjects who opted for shipment had to hand in their envelope for shipment.
We stressed that the shipments were real; therefore, the carbon emissions would actually take place. To this end, all subjects received a handout with a QR code. This led to a website provided by us in which the subjects could obtain the shipping status of their envelope and subsequent information on our experiment (total emissions caused, emissions avoided (if an electric car was used), emissions compensated by offsets, and a certificate confirming the purchase of the offsets).
Experimental results
Table 3 reports the means of the dependent and explanatory variables for our entire sample of 81 subjects (no subject failed the quiz). The subjects in our experiment earned on average €14.07 in the experiment. Overall, 66.7% of subjects identified with the female gender, 29.6% with the male gender, and the remaining 3.7% stated diverse. The average age was 25, and the reported mean monthly income was €1527 (median income €1000).
Descriptive statistics.
The most popular alternative is shipping mode 5, electric engine (avoid controllable emissions + offset uncontrollable) with 33.9% of choices and an average price of €4.36 followed by the cheapest alternative shipping mode 1 (€3.30 on average) with 32.6% of choices. The data show that the subjects decided in 67.4% of all decisions on the shipping mode in favor of more environmentally friendly alternatives, even if these were associated with a higher price. It also shows that the modes in which controllable emissions are avoided, that is, modes 4 and 5, account for a particularly high share (54.6%) of decisions. A direct comparison of shipping mode 2 with 4, as well as 3 with 5, shows that subjects chose to avoid controllable emissions, rather than purchase offsets to compensate for them, significantly more often. This shows that the two measures are not valued equally, and there appears to be a preference for carbon emission avoidance, which supports Hypothesis 1. However, the very low proportion of shipping mode 6 at 0.3% also shows that the subjects are not willing to avoid emissions at all costs. This raises the question of how much subjects' WTP differs for different measures and what the drivers are.
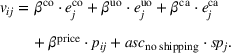
We analyze the data with a multinomial logit model (MNL), defining shipping mode 1 (no avoidance, no offsets) as the reference alternative. We investigate utility differences between the different alternatives and derive implied willingness to pay (WTP model), of the subjects in the experiment, for more environmentally friendly alternatives compared to the reference alternative.
Hereafter, we refer to 


Description of explanatory variables in the WTP model.
We estimate the coefficients βco, βuo, βca, βprice, 
MNL estimation WTP model.
Abbreviations: MNL, multinomial logit model; WTP, willingness to pay.
We find a negative and significant estimate for the price coefficient βprice. Thus, subjects in the experiment attribute lower utility to more expensive alternatives. For the influence of the different measures to reduce the carbon footprint on the choice of the subjects, we also find significant estimates and differences between the measures.
Both offsetting uncontrollable emissions through offsets and avoiding controllable emissions through internal reductions generate higher utilities than the reference alternative (shipping mode 1). This is one explanation for the overall high share of more environmentally friendly shipping modes. In contrast, we find a negative utility for offsetting controllable emissions, at a lower significance level. The utility is reflected in the estimates of the coefficients, and these can be compared with each other in terms of magnitude. Furthermore, the utility can also be expressed as a WTP.
As indicated in Table 5, subjects had an average negative WTP of −€0.22 to compensate for 2 kg of controllable emissions through offsets. If instead of compensating with offsets, the 2 kg of controllable emissions is avoided, the WTP is €0.56 (alternatively, €0.56 per 2 kg = (€0.56/2)· 1000 = €280 per t


The large, negative, and significant estimator of the alternative‐specific constant 
In sum, we observe that subjects are willing to pay a premium for more environmentally friendly alternatives. In doing so, they prefer avoiding emissions to compensation of emissions through offsets when possible. In the experiment, however, the majority of subjects were not willing to completely forgo service and thus avoid all emissions. The trade‐off between using the service, and foregoing it certainly depends on the utility derived from a service, which we controlled in our study by inducing a monetary compensation of €12 for shipping the envelope.
Drivers of observed behavior
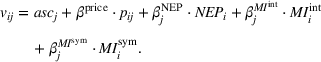
Next, we investigate possible individual characteristics of the observed preferences in a driver model. We analyze the possible drivers 


In contrast to Equation (2), we model the deterministic utility using alternative‐specific constants instead of variables for the different shipping modes. This makes it easier to interpret the influence of individual‐specific variables (e.g., NEP) on the choice of the five shipping modes and the no shipping alternative. We denote the alternative specific constants by 


Description of explanatory variables driver model.
Table 7 shows the estimates of the driver model. It can be seen from the table that NEP has a significant influence on the shipping modes that avoid controllable carbon emissions (electric engine alternatives, modes 4 and 5). In line with our prestudy and Hypothesis 2, subjects with a higher NEP value more often chose mode 5, thus appearing to derive a higher utility from it. In other words, avoiding controllable emissions in combination with offsetting uncontrollable emissions has a special appeal to eco‐conscious consumers (high NEP value). We find a significant negative estimator for the influence of the NEP on avoiding controllable emissions without compensating for uncontrollable emissions. We explain this effect by the fact that the more environmentally conscious subjects with a high NEP tend to choose alternative 5, leaving in the pool of subjects who chose alternative 4 people with an average low NEP.
MNL estimation driver model.
Abbreviations: MI, moral identity; MNL, multinomial logit model; NEP, new environmental paradigm.
The construct of moral identity refers to moral traits and is divided between symbolization and internalization. Symbolization asks how important it is to the subject that certain moral traits are attributed to him or her by the outside world. Internalization asks how important it is for the person him/herself to have certain moral traits. Subjects with a higher score on the symbolization scale derive higher utility from alternatives 3 and 5. It seems that these modes, that is, alternatives that address both types of emissions and thus the problem as a whole, are perceived as sufficient ways to symbolize moral behavior to the outside world.
The construct of internalization differs from symbolization and tends to have stronger effects. Individuals with a higher value on the internalization scale derive a higher utility from modes 4 and 5, that is, they prefer alternatives that involve avoiding controllable emissions rather than compensating for them through offsets. Here we see that a measure (such as mode 3) that is perceived as a good way to symbolize moral behavior externally does not necessarily satisfy an individual's internal moral demands on himself/herself.
As Aquino and Reed (2002) show, there is a relationship between the MI internalization construct and moral behavior. They find that subjects with a higher MI internalization value are more likely to exhibit a stronger moral behavior. In our case, this would imply that the distinction between internal reductions and compensations has a moral component (with internal reductions being perceived as the morally better alternative or vice versa). On this basis, we see a confirmation of Hypothesis 3.
As mentioned before, we have also measured subjects' ST. We find that ST does not explain the difference in choices between internal reductions and offsets. A higher value on the ST scale leads to the more environmentally friendly modes (2–5) being chosen more often to a similar degree. For the sake of parsimony, we do not present the results in Table 7 but do show them in Appendix F.
We also examined the influence of demographic and socioeconomic variables. No significant effects were found for income and age. This may also be because the subjects were relatively homogeneous in these variables. Significant effects are shown for gender. Subjects who reported identifying with the female gender showed a significant preference for more environmentally friendly alternatives, especially for modes 3 and 5. However, gender loses its statistical significance when included in the estimation together with the NEP and MI scales as explanatory variables, as shown in Table 7. One reason for this could be that subjects who reported identifying with the female gender scored higher on average on all scales (NEP, ST, MI Int, and MI Sym). Since only the scales, but not gender, are significant in the joint estimation, it seems that the effect of the gender variable is partly explained by them. We show the results of the estimation when gender is not included in Table G1 in Appendix G for completeness, and in Table H1 in Appendix H the correlation matrix of all explanatory variables.
An analysis of the influence of gender without other individual‐specific variables shows that in our experiment subjects who identify with the female gender made more environmentally friendly decisions overall. This is reflected in significantly higher implicit WTP for shipping modes 3 (€0.40) and 5 (€0.21). We found no significant effects for the other modes.
CONCLUSION
In this paper, we examine empirically how much consumers are willing to pay for a firm's carbon footprint reduction initiative, specifically, internal emissions reductions, and the purchase of carbon offsets, when buying a product/service provided by the firm. In addition, we differentiate between the purchase of carbon offsets for controllable versus uncontrollable emissions by the firm. Finally, we investigate whether such consumer behavior can be explained by their intrinsic attitudes towards the environment and their moral identity.
Using incentivized discrete‐choice experiments, we find that (i) the majority of consumers are willing to pay more for a service with a lower carbon footprint; (ii) consumers are willing to pay significantly more for internal emissions reductions compared to the purchase of carbon offsets by the firm for controllable emissions, and this effect is more pronounced for more environmentally friendly consumers; and (iii) consumers value roughly equally internal emissions reductions and the purchase of carbon offsets for uncontrollable emissions.
Two key managerial insights emerge from our findings. First, consumers are willing to pay a higher premium for products or services where the firm's controllable carbon emissions are abated by internal measures, compared to their compensation by carbon offsets. The cost–benefit assessment of sustainability initiatives should take this into account. Second, if companies implement internal reductions, they should communicate this clearly to consumers in order to differentiate from competitors who do not address emissions at all or only use offsets for controllable emissions. As previously discussed, however, marginal abatement cost curves (Blanco et al., 2020; Blanco, 2022; Kesicki & Strachan, 2011) suggest that internal reductions may become financially unfeasible beyond a certain point, and the firm may need to turn to carbon offsets to further reduce its carbon footprint. It is thus unclear if in that case the firm should reveal to consumers only the total carbon footprint or a breakdown of carbon offsets and internal reductions. By design, our study displays to participants complete transparency into the components of the service's carbon footprint. It would be interesting to address the question of transparency in communicating the carbon footprint, that is, how consumers differentiate between messages of total carbon footprint and a breakdown of the components of carbon footprint.
Another limitation of our study is that we do not describe to study participants the origin of the offsets, and we also do not describe the specific actions to achieve internal emissions reductions, in order to cleanly separate the differences between carbon offsets and internal reductions. However, several studies show that, at least in hypothetical (nonincentivized) setups, different types of carbon offsets, as well as different actions for internal emissions reduction can be evaluated differently by consumers. For example, in the context of offsets, Schwirplies et al. (2019) show a preference for regional offset projects, in particular, reforestation. Holm et al. (2015) show a general opposition to the measure of underground carbon capture. Blasch and Farsi (2014), in line with Schwirplies et al. (2019), find that reforestation projects are preferred, but so are renewable energy projects in developing countries when implemented by NGOs. An examination of the differences within types of offsets and internal reductions in incentive‐compatible decision situations would be interesting. We leave these open questions for future research.
Footnotes
ACKNOWLEDGMENTS
The authors thank the reviewers and editors for their constructive suggestions, which significantly improved the manuscript. In addition, the second author thanks seminar participants at the Poole College of Management at North Carolina State University for their helpful comments.
Open access funding enabled and organized by Projekt DEAL.
NEW ENVIRONMENTAL PARADIGM
MORAL IDENTITY
SHORT SCHWARTZ'S VALUE SURVEY (SELF‐TRANSCENDENCE)
CHOICE SET OF THE TRIAL PERIOD
POST EXPERIMENTAL SURVEY
MNL ESTIMATION DRIVER MODEL WITH SELF‐TRANSCENDENCE
MNL ESTIMATION DRIVER MODEL WITHOUT GENDER
CORRELATION MATRIX OF THE EXPLANATORY VARIABLES
1
2
We further used the short Schwartz's Value Survey according to Lindeman and Verkasalo (![]() ) to measure subjects' self‐transcendence (ST) with 11 items on a Likert scale from 1 to 6 (see Appendix C). Self‐transcendence here means enhancement of others and transcendence of selfish interests. The ST scale takes values from 1 to 6, with 6 (1) corresponding to high (low) self‐transcendence. We use this scale to assess if subjects' choices are driven by the fact that emission reductions have positive effects on others, as it is typical for (environmental) public goods.
) to measure subjects' self‐transcendence (ST) with 11 items on a Likert scale from 1 to 6 (see Appendix C). Self‐transcendence here means enhancement of others and transcendence of selfish interests. The ST scale takes values from 1 to 6, with 6 (1) corresponding to high (low) self‐transcendence. We use this scale to assess if subjects' choices are driven by the fact that emission reductions have positive effects on others, as it is typical for (environmental) public goods.
3
The data on emissions are based on a life cycle assessment (LCA) comparison between electric vehicles and vehicles with combustion engines using the example of the Smart Fortwo (a small car) from the Technical University of Cologne (Kanz, ![]() ). We used an electric and an internal combustion engine gasoline Smart Fortwo for the shipment and the LCA data as expected emissions for our experiment. However, the actual emissions caused by the transport of the envelope (shipping) may differ from the LCA data, especially due to the traffic situation on the day of delivery.
). We used an electric and an internal combustion engine gasoline Smart Fortwo for the shipment and the LCA data as expected emissions for our experiment. However, the actual emissions caused by the transport of the envelope (shipping) may differ from the LCA data, especially due to the traffic situation on the day of delivery.
4
Modes 3 and 5 do not have “round” prices like the other alternatives because we ensured that the average marginal prices for offsetting emissions were held constant. For example, from mode 2 to 3 (and from 4 to 5) the marginal cost is €0.61/1.63 kg ![]() ).
).
References


