
Abstract
Supply chains are dynamic and complex systems. This holds particularly true for humanitarian supply chains that operate under strong uncertainty. In view of an ever‐growing gap of unmet humanitarian needs, it is essential to gain a better understanding of the behavior of humanitarian supply chain systems. Despite a growing academic output in this field, there is a lack of empirical studies that take an integrated view on humanitarian supply chains and support decision makers with fact‐based evidence. Based on four extensive case studies and existing literature, we developed a system dynamics model that reflects the operational reality of humanitarian organizations in form of their centralized, hybrid and decentralized settings. The model provides a holistic supply chain view and measures the operational performance with regard to response cost, delivery lead time and impact on the local economy. Furthermore, we studied the impact of preparedness investments to enhance operational performance in the supply chain and deliver more humanitarian assistance with the limited resources available. Finally, we used our model to analyze the impact of major shocks such as the COVID‐19 pandemic to assess the vulnerability of humanitarian supply chains. The results indicate that operational settings, product and disaster characteristics have a major influence on the supply chain performance both in the noninvestment case as well as in the case where preparedness investments have been made. Specifically, for low‐value items, we find that decentralized settings have the lowest supply chain costs while for high‐value items the price difference between local and international procurement determines which setting is the most cost‐effective one. The preferability of the supply chain setting strongly depends on the indicator chosen. Hence, ultimately, the findings emphasize the need to apply appropriate indicators and identify their trade‐offs to comprehensively analyze the performance of humanitarian supply chain settings. The newly introduced Humanitarian Return‐on‐Investment concept can play an important role in this context.
Keywords
INTRODUCTION
The gap of unmet humanitarian requirements grew by 611% from USD 3.177bn in 2009 to USD 19.438bn in 2020 (Office for the Coordination of Humanitarian Affairs [OCHA], 2021). To close this gap, humanitarian actors are under immense pressure to find new ways of operating to ultimately provide more aid with the limited resources available (High‐Level Panel on Humanitarian Financing, 2016). During the World Humanitarian Summit (WHS, 2016), a group of academics and practitioners stated that improvements must be found in the supply chain if the humanitarian community is to meet the increasing needs (Garcia et al., 2016). To find and implement those improvements, empirical research that enhances transparency and provides fact‐based evidence to decision makers in the sector is key. To date, research is still lacking in providing such insights (Kunz et al., 2017, Kovács et al., 2019, Van Wassenhove, 2019). Our paper addresses some of the major reasons for this shortcoming such as the lack of systemic thinking, contextualization, empirical studies and fact‐based evidence.
To gain a better understanding of the complex behavior of humanitarian supply chains, researchers suggest more holistic, dynamic modeling approaches (Gonçalves, 2008, Jahre et al., 2016, Mishra et al., 2019, Anjomshoae et al., 2022). Here, the specific context of humanitarian organizations such as their uncertain working environment and their different operational settings has to be considered (Bhattacharya et al., 2014, Stauffer et al., 2016; Kunz et al., 2017). By building a comprehensive system dynamics (SD) model that reflects the integrated humanitarian supply chain, we are able to study the interrelationships between resources and operational performance with regard to response cost (RC), lead time and impact on the local economy. We capture two critical lead time characteristics of an effective response, namely “fast on the ground” (represented by the time in which 10% of the items needed are distributed) and “needs fulfillment” (represented by the time in which 90% of the needs are satisfied). Being fast on the ground is critical to start providing aid as swiftly as possible and it is also essential for humanitarian organizations to be visible to (potential) donors as media attention is at its peak in the early days after a disaster. However, needs fulfillment is certainly of the utmost interest for the affected population, as it reflects the time to provide relief to the majority of people in need. The local economic impact (LEI) is defined as all expenses made by the humanitarian organization (HO) in the country such as local procurement, transport, storage, and country office staffing cost. This LEI metric addresses a current development in the sector since their increasing pressures to HOs to shift their focus from delivery time and cost aspects of their operations to the (more long‐term) impact on the local population (Offenheiser, 2014, International Agency Standing Committee [IASC], 2020, Office for the Coordination of Humanitarian Affairs [OCHA], 2020a).
Through extensive case studies with four humanitarian organizations that operate in different settings, we were not only able to collect valuable supply chain data to build our model, but also to consider the structural differences of centralized, hybrid, and decentralized settings.
Investing and building capacity in the supply chain appears to be a powerful trigger to save time, cost and lives in future disaster responses (Jahre et al., 2016, HELP Logistics, Kuehne Logistics University (KLU) and Action Contre la Faim (ACF) 2018, Lewin et al., 2018). In reality, despite its potential impact, relatively few resources have been going into supply chain preparedness (Kunz et al., 2014, Jahre et al., 2016). Missing fact‐based evidence on the interconnectivities and the actual impact of preparedness investments is among the main reasons why this potential remains untapped (Jahre et al., 2016). Past literature studied predominantly individual elements of preparedness focusing on one product (e.g., Besiou et al., 2014, Kunz et al., 2014) or one specific investment element (e.g., Balcik and Ak, 2014, Kunz et al., 2014, Rodríguez‐Espíndola et al., 2017). Through our SD model, we are able to comprehensively analyze the impact of inter‐ and intraorganizational preparedness investments considering different operational settings and different disaster characteristics. We also use our model to run an analysis on the impact of major shocks (like the COVID‐19 pandemic) on humanitarian supply chains.
Our research addresses the following questions: How do the different supply chain settings (centralized, hybrid and decentralized) affect response cost, delivery lead time and local economic impact? What impact do preparedness investments have on the performance metrics of the different settings?
Our research predominantly focuses on countries with a high disaster risk profile. In this context, we are building our model on discussions of different settings in the humanitarian supply chain literature (Gatignon et al., 2010, Pedraza‐Martinez and Van Wassenhove, 2012, Bhattacharya et al., 2014, Besiou et al., 2014, Stauffer et al., 2016), on pre‐existing preparedness frameworks (Van Wassenhove, 2006, Kunz et al., 2014, Jahre et al., 2016) and on our experience from case studies we conducted with four humanitarian organizations in different operational settings.
Our findings show that in case of no investments made the decentralized setting is generally slower than the centralized and hybrid settings but has a more positive impact on the local economy. The answer to what operational setting comes with the lowest RC depends heavily on the value of the relief item (including the price difference between local and international procurement), the logistics cost and the scale of the disaster (in terms of total demand for aid). For smaller value items, the decentralized setting is generally cheaper, whereas for high‐value items the centralized setting is cheapest. Our SD model confirms that preparedness investments have tremendous potential to improve performance metrics. However, operational settings, scale and time of the disaster, the value of the relief item as well as logistics cost have a strong influence on the impact and need to be considered in investments plans. Based on our model, preparedness investments unfold a strong positive impact on the decentralized setting. But the decentralized setting is also the one most vulnerable to major shocks.
The findings of our work already created impact in the sector. The Global Logistics Cluster built a media campaign around our research to advocate for enhanced preparedness (Global Logistics Cluster [GLC], 2019) and the European Commission highlighted our findings in their new logistics policy (DG ECHO, 2022). Thanks to our contributions, organizations such as the Global Logistics Cluster, Action Contre la Faim, and the International Federation of Red Cross and Red Crescent Societies were able to raise additional funding to strengthen their preparedness efforts.
The remainder of this paper is organized as follows. Section 2 provides a literature review. In Section 3, we discuss SD methodology and its applications in the humanitarian sector. Section 4 outlines how the model was built in consideration of different operational settings and present the case studies, the Return‐on Investment concept and the disaster context. In Section 5, we present the most relevant findings. Section 6 concludes with the contributions to research and practice as well as recommendations for future research.
LITERATURE REVIEW
To position our work and reveal impactful research opportunities, we identify, summarize, and analyze existing knowledge on different operational settings, supply chain preparedness and the application of the Return‐on‐Investment (RoI) concept in the humanitarian context.
Operational settings
In 1995, Office of the United Nations High Commissioner for Refugees (UNHCR) found that “decentralizing activities and structures can be cost effective and can reduce the inefficiencies associated with a large headquarters structure. At the same time, they can hinder the organization's ability to maintain consistent policies and control activities” (UNHCR, 1995). Gatignon et al. (2010) follow the International Federation of Red Cross and Red Crescent Societies’ (IFRC) 10‐year journey from a centralized to a more decentralized setting with the intention to build a supply chain that is faster, better, and cheaper. Bhattacharya et al. (2014) compare the outcomes of resource transfer and infrastructural investment decisions in centralized and decentralized systems that include donors, humanitarian organizations, and local entities. Pedraza‐Martinez and Van Wassenhive (2012), Besiou et al. (2014), and Stauffer et al. (2016) study centralized, decentralized, and hybrid structures of vehicle supply chains in the humanitarian context. Contrary to Gatignon et al. (2010), Besiou et al. (2014) find that decentralized (vehicle) supply chains have higher costs and higher service levels than supply chains in centralized settings. Stauffer et al. (2016) conclude that a lean centralized hub setting with the flexibility to shift to a more decentralized setting with temporary hubs closer to the disaster areas can reduce the overall cost. There appears to be a common understanding that humanitarian organizations are running their supply chains in different operational settings affecting operational performance. Not so much consensus seems to exist on what setting is more favorable in what context. Through our extensive supply chain model, we provide further insights into the performance of centralized, decentralized, and hybrid settings and address existing gaps by analyzing their performance levels with and without preparedness investments.
Supply chain preparedness
Humanitarian organizations, donors and researchers call for more preparedness efforts to increase the operational performance of humanitarian programs (Van Wassenhove, 2006, Jahre et al., 2016, WFP, 2017). The Organisation for Economic Co‐operation and Development (OECD, 2017) reckons there is a “momentum for disaster preparedness” that “has grown considerably in the last few years, following several extreme climate events and health pandemics”. In supply chain management, preparedness is defined as “the implementation of processes, structures, and systems connecting local community, national and international actors by designing, planning and training for efficient, effective, and responsive mobilization of material, financial, human, and informational resources when and where needed” (Jahre et al., 2016, p. 383). In practice, the potential of preparedness investments in the supply chain has been widely discussed (United Nations Development Programme [UNDP], 2012; Boston Consulting Group [BCG], 2015; HELP Logistics, Kuehne Logistics University and Action Contre la Faim (ACF) 2018, DG ECHO, 2019). However, while there is agreement in the literature that preparedness can enhance operational performance, we still see strong underinvestment in preparedness activities in practice (Kunz et al., 2014, Jahre et al., 2016). Limited systemic thinking and fact‐based evidence on the actual impact of investments are considered as the main reasons why this potential remains untapped (Jahre et al., 2016, Anjomshoae et al., 2022). Past literature studied predominantly individual elements of preparedness focusing on one product such as vehicles (Besiou et al., 2014) and ready‐to‐use therapeutic food (RTUF; Kunz et al., 2014) or one specific investment element like the pre‐positioning of relief items (Balcik and Beamon, 2008, Kunz et al., 2014, Jahre et al., 2016, Klibi et al., 2018, Sabbaghtorkan et al., 2020), framework agreements with suppliers (Balcik and Ak, 2014, Gossler et al., 2019, Wang et al., 2019), coordination (Rodríguez‐Espíndola et al., 2017), or engagement of the local population (Sheppard et al., 2013). Recently, there have been many discussions around the impact academic research has on the humanitarian sector (e.g., Kunz et al., 2017, Besiou and Van Wassenhove, 2019). Supply chain preparedness is a field where research could play a major role if it considers the dynamic complexity of integrated humanitarian supply chain systems and the operational reality of humanitarian organizations.
Humanitarian ROI
Since the 1920s, the RoI concept has been considered as a tool for companies evaluating the payoff of their investments (Phillips, 1998) and today it is one of the most‐used metrics for profit and performance (Friedlob and Plewa, 1996, Lingane and Olsen 2004, Knight, 2015).
Even though not very present in the humanitarian sector (PricewaterhouseCoopers [PwC], 2017), there is an increasing trend of nonprofit organizations to use the RoI concept (Krlev et al., 2013). The higher demand for accountability (Kearns, 1994, Young et al., 1996, Nicholls, 2009) and the growing pressure on effectiveness of investments in times of limited funding (Murray et al., 2010, Weisbrod, 1998, Defourny, 2004) have been driving this trend. Subsequently, the public, educational and nonprofit sectors started to apply the RoI (Phillips, 2011). To enhance investments against disaster risks, the UK Department for International Development (DFID) funded a multi‐agency project. The project found that “although the humanitarian sector has made advances in risk forecasting and preparedness, it is still not equipped to systematically quantify and compare the impacts of investments in emergency preparation on future emergency response” (PwC 2017). The project suggests using the RoI concept to calculate time savings, cost reductions and other benefits achieved by preparedness investments. Subsequent to this project, the UN World Food Programme (WFP) started implementing the RoI concept using the terminology “Humanitarian Return‐on‐Investment (H‐RoI)”. Humanitarian organizations are accountable to their private and institutional donors as managers are to company shareholders and creditors. The RoI is considered to be an appropriate way to demonstrate accountability for investments in a logical and rational manner (Phillips, 2011). Since it is an easy to understand concept and makes projects more comparable, it can also serve humanitarian organizations, local governments and donors as essential decision support. We use the H‐RoI term and build on the broader RoI concept to provide a more comprehensive understanding of how humanitarian supply chains are affected by preparedness activities. Our study is the first that systematically analyzes and quantifies how investments in different network structures contribute to cost and lead time reductions, and increase the positive impact on the local economy. Furthermore, it highlights important factors that influence these relationships.
SYSTEM DYNAMICS METHODOLOGY IN THE HUMANITARIAN CONTEXT
To make research in the field of humanitarian supply chain preparedness more impactful, it has been recommended to go beyond single case studies and semistructured interviews, which were mostly used so far (Jahre et al., 2016). The “combination of in‐depth case studies and modeling establishing causal relationships” is considered to generate strong and valuable findings (Jahre et al., 2016). This is in line with Besiou and Van Wassenhove's (2015) suggestion to combine hard and soft operations research (OR) in the context of socially responsible operations to better understand how the overall system works. By being heavily dependent on data, SD brings together strong and soft OR and could therefore be one valid method to be applied (Besiou and Van Wassenhove, 2015).
When Forrester first invented SD, he was looking at inefficiencies in supply chains, which were caused by multiple feedback loops, limited information flows, delays and suboptimal decisions (Forrester, 1958, Forrester, 1961). Ever since, SD has been applied in different contexts, contributing to solving real‐world problems (Sterman, 2002). Wolstenholme (1990, p. 3) defines SD as a “rigorous method for qualitative description, exploration and analysis of complex systems in terms of their processes, information, organizational boundaries, and strategies; which facilitates quantitative simulation modeling and analysis for the design of system structure and control”.
The application of SD in humanitarian operations is still relatively new (Galindo and Batta, 2013). The humanitarian supply chain is a complex system with a high level of interconnectedness between the various actors (Guzmán Cortés et al., 2019) and a very dynamic and quickly changing situation on the ground (Van Wassenhove, 2006, Tomasini and Van Wassenhove, 2009, Besiou et al., 2011). Besiou and Van Wassenhove (2015) discuss that SD is a suitable method to study socially responsible operations because these systems are characterized by dynamic complexity due to “uncertainty, constraints and trade‐offs, unfamiliar context with multiple stakeholders with conflicting goals having to engage in uneasy alliances with new players, and unexpected and sometimes counterintuitive behavior”. SD methodology has been used in humanitarian operations. For example, Besiou et al. (2014) used it to explore the trade‐offs between different operational settings, different phases of the disaster cycle, and earmarked funding on the performance of vehicle supply chains. Kunz et al. (2014) applied SD to analyze how supply chain preparedness investments can improve the performance of the delivery process of RTUF during disaster response. The study found that best results can be achieved by investing in both pre‐positioning and customs procedures. However, the authors do not consider their findings as generalizable as they rely on a very specific model and they only include these two preparedness investments elements. Therefore, Kunz et al. (2014) suggest modeling a more realistic case setting to identify optimal preparedness investment strategies. We choose SD modeling for our research as the supply chain settings under study embody complex systems of interconnected feedback loops, lengthy time lags between needs assessment and delivery, and nonlinear relationships between many actors with different interests that can lead to unforeseen or counterintuitive results. Studying the supply chain settings in the context of preparedness investments adds further dynamics and complexities through the interconnectivity of different investment activities and the time delays between investment decision and impact generated. Detailed causal loop diagrams of the different settings are presented in Annex 1 in the Supporting Information.
BUILDING THE MODEL
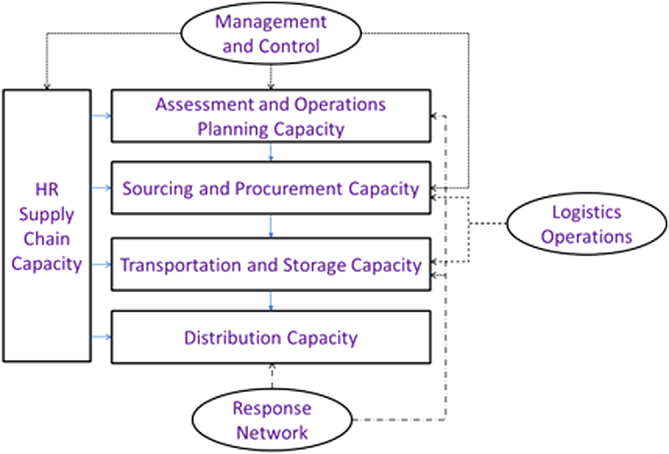
We built the model on sudden on‐set emergencies that create humanitarian needs when the disaster strikes (Balcik and Beamon, 2008). This context was chosen because of its uncertain and unpredictable nature (Van Wassenhove, 2006, Balcik et al., 2010, Kovács and Spens, 2010), which makes preparedness efforts particularly challenging. “Unpredictable demand makes it impossible to plan and prepare for everything. It is simply too risky (items can be in the wrong place, and/or expire) and costly as disasters occur at other places and other times than predicted” (Jahre, and Jahre, 2019, p. 13). Our SD model studies the relief response from humanitarian organizations operating in different settings and the flow of relief items, information, people, and funds from the moment the disaster strikes until humanitarian aid reaches the affected population. Within the model, we study five different supply chain related capacities that can be influenced by preparedness investments, namely Human Resource (HR) Supply Chain (SC) Capacity, Assessment and Operations Planning Capacity, Sourcing and Procurement Capacity, Transportation and Storage Capacity, and Distribution Capacity.
Considering different operational settings
Between 2016 and 2019, we ran extensive preparedness investment and impact measurement case studies with four humanitarian organizations (HO1, HO2, HO3, and HO4). In total, we spent more than 50 h of interviews and expert workshops with 20 senior supply chain staff members including global and country heads of logistics to collect data on supply chain capacities, lead times and costs for scenarios with and without preparedness investments. To consider the organizations’ operational settings, we classified them as per the criteria below (Table 1):
Different operational settings of humanitarian organizations in case studies
Based on the humanitarian supply chain literature on different settings (Gatignon et al., 2010, Pedraza‐Martinez and Van Wassenhove 2012, Bhattacharya et al., 2014, Besiou et al., 2014, Stauffer et al., 2016) and our experience from the case studies, we have built the differences into the model with regard to (1) different origins of supplies (global vs. local suppliers and pre‐positioning hubs), (2) different locations from where staff is deployed (Global HQ vs. Country Office), and (3) different places where supply chain processes are managed and controlled (Global HQ vs. Country Office).
In the centralized setting (Figure 1), the global headquarters takes the lead as there is either no presence in the affected country or the capacity of the national office cannot cope with the increased demand. The additional capacity in staff will be provided from a deployment pool at a global level. During the response, the organization will use global IT systems and implement global operating procedures and guidelines. Organizations operating in a centralized setting with no or very limited presence on the ground have generally no or very little knowledge on local markets at the beginning of the operation and therefore tend to source the relief items from international suppliers. The global headquarters also responds to disasters happening in other countries by deploying its resources on a needs basis.
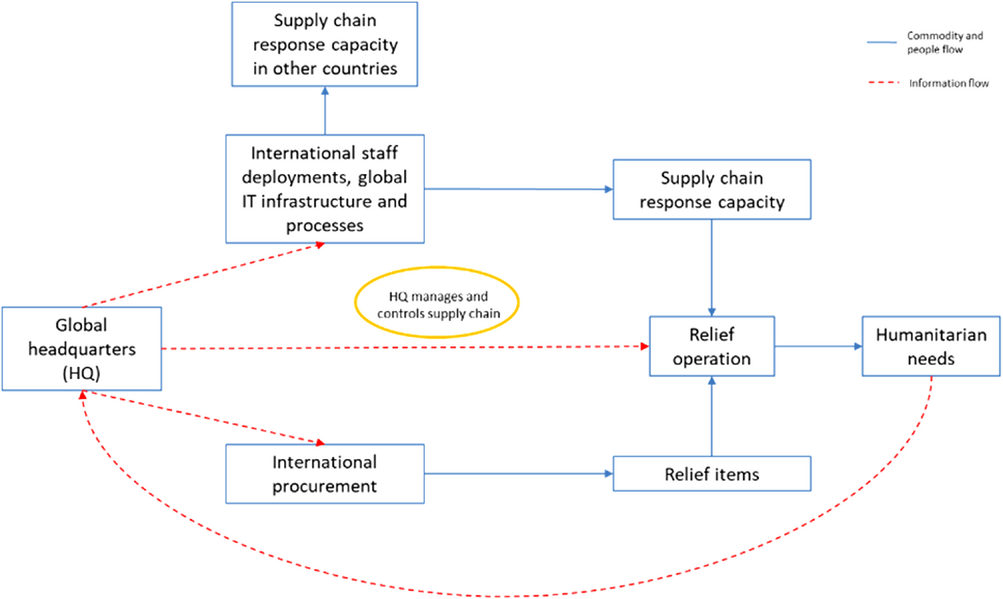
Centralized setting.
In the decentralized setting (Figure 2), the country office manages and controls the supply chain. Staff will be pulled in from other programs in the country or temporarily hired from local labor markets. The organization will use locally available IT systems and apply local procedures and guidelines. Due to a better knowledge of and access to the local market, relief items are procured locally (with certain capacity constraints built into the model). The global headquarters only serves as fundraiser and has no active role in the operation.
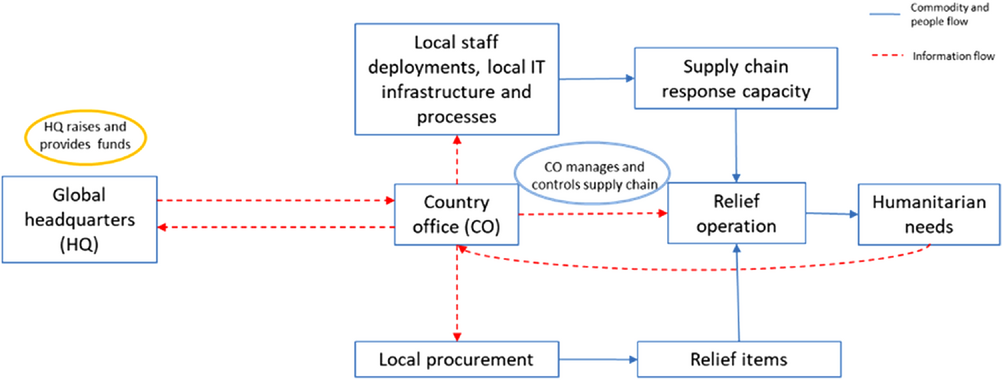
Decentralized setting.
In the hybrid setting (Figure 3), the organization involves capacities from both global headquarters and country office levels. Existing capacity of the country office is complemented by capacities provided from the global level.
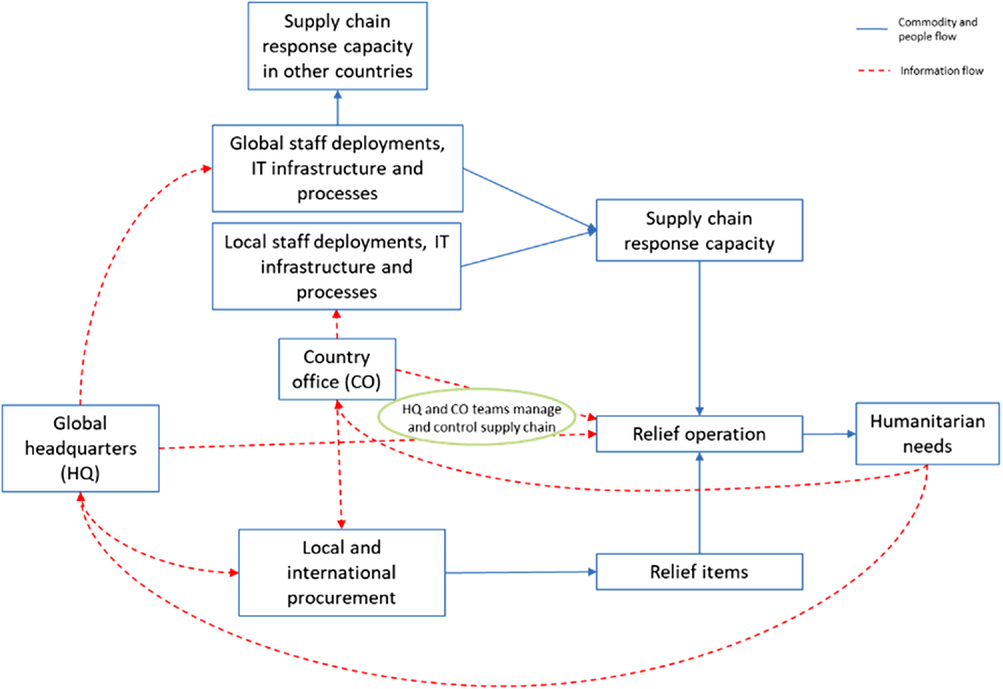
Hybrid setting.
Humanitarian organizations are typically somewhere on a scale between hybrid settings of a rather more centralized nature with headquarters taking a stronger role and hybrid settings leaning more toward decentralization with stronger country offices. A detailed explanation of the system behavior and supply chain data (cost, time, lead times) on the different settings can be found in Annexes 1 and 2 in the Supporting Information. The model of the different settings and formulas is presented in Annex 6 in the Supporting Information.
Preparedness investments captured
For the identification of the preparedness investments used in the model (Figure 4), we built on the work of Van Wassenhove (2006) and Kunz et al. (2014) and in particular on the framework from Jahre et al. (2016), who group investments by their intraorganizational and interorganizational nature.
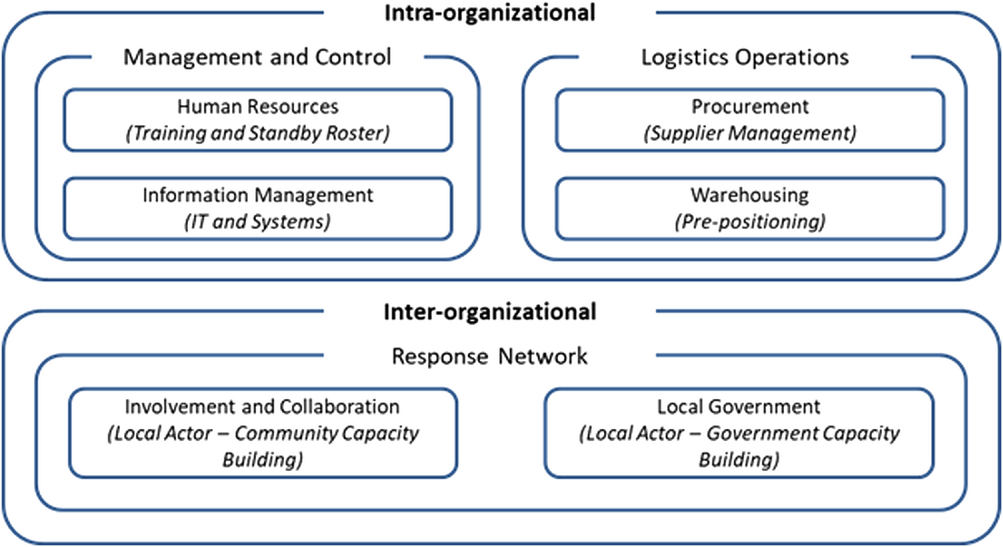
Preparedness investments used in model based on framework by Jahre et al. (2016).
In the intraorganizational context, we differentiate between investments made in (a) management and control and (b) logistics operations. Based on discussions with practitioners, investment activities in management and control predominantly relate to human resources (e.g., training of staff), processes (e.g., standard operating procedures) and information systems (e.g., supply chain management system). Preparedness investments like trainings can enhance the capacity of local staff (Altay and Green, 2006, Van Wassenhove, 2006, Lu et al., 2013, Tint et al., 2015, Lewin et al. 2018), reducing the need for international deployments. Based on the financial data collected from our case studies, the daily cost of an international deployment can be considered to be 8–12 times higher than the cost of a local staff member. The implementation of adequate information technology and systems in humanitarian organizations has tremendous potential to improve information flow and collaboration, reducing delivery lead times (DLTs; Pan et al., 2012; HELP Logistics, Kuehne Logistics University [KLU], and Action Contre la Faim [ACF], 2018; Falagara Sigala et al., 2020).
Investments in logistics operations are centered on supplier management (e.g., market analysis and framework agreements) and warehousing (pre‐positioning). The benefit of having relief items readily available to ship them swiftly to the disaster zone is commonly agreed on among researchers and practitioners (Balcik and Beamon, 2008, Kunz et al., 2014, Jahre et al., 2016, Klibi et al., 2018, Sabbaghtorkan et al., 2020). Market assessments and framework agreements can speed up the procurement process significantly (Balcik and Ak, 2014, Gossler et al., 2019, Wang et al., 2019).
Interorganizational investments identified in our case studies pre‐dominantly focus on country actors (local government and communities). Therefore, we merge Response Network and Recipient Country (Jahre et al., 2016) into Response Network (Figure 4). The influence of customs procedures in terms of time delays for international shipments has been discussed by Kunz et al. (2014). We consider this delay and assume that preparedness investments, such as relationship management with governments, can significantly reduce customs time (Kunz et al., 2014). Engaging and investing in other local network partners will have a positive impact on the needs assessment as well as the actual distribution process (Sheppard et al., 2013). Figure 5 summarizes the connection between preparedness investments and supply chain capacities. To reflect the critical role of staff, the capacity of human resources is directly connected with all functions in the supply chain.
Impact of preparedness investments on supply chain capacities.
Although the investment categories and the co‐related supply chain capacities are consistent across the three different settings, there are differences regarding type of investment activities, funding and time required to implement activities (“funds and time enhancement factor”) and to what extent the respective supply chain capacity is impacted by each investment activity (“weighted impact factors”). In the centralized setting, the investment activities focus on global capacities, and in the decentralized setting on capacities in the country. In the hybrid setting, investment activities are carried out both for global and local capacities (each to a lesser extent than in the centralized and decentralized settings). Table 2 summarizes the main activities in the different settings. A more detailed explanation of the data (funds and time enhancement factors and weighted impact factors) can be found in Annexes 2 and 3 in the Supporting Information.
Investment activities in the different settings
Performance measurement
Our model measures the supply chain performance from an RC, lead time, and local economic impact perspective. To calculate the total RC, we sum up all supply chain relevant expenses including procurement of relief items, transport, storage, distribution and staffing. The staffing costs encompass salaries and deployment expenses for all supply chain staff that are working on the response from the moment the disaster strikes until all items are distributed to the beneficiaries.
We measure the impact of preparedness investments on the total supply chain RC through the indicator H‐RoI Cost. To calculate the H‐RoI Cost, we compare the scenario with investment in humanitarian supply chain preparedness to the scenario without investment.
The H‐RoI Cost will serve as an indicator for the increased efficiency of humanitarian operations through preparedness investments.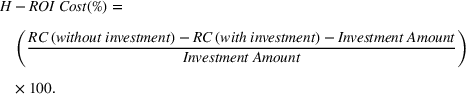
In the recent past, the nonprofit sector has been growing significantly and the number of organizations with social objectives has been increasing steadily. Subsequently, the measurement of social benefits in relation to the project cost has gained much more attention (Lingane and Olsen., 2004; Nicholls, 2017). Also, humanitarian organizations increasingly find that their “success should be measured not just by the number of people we provide with water, food and shelter—but by how effectively we empower local actors to take the lead, so that more people would not need our help in the first place” (Offenheiser, 2014, p. 1).
Empowering local actors and investing locally bridges the gap between relief and development efforts, making vulnerable countries more resilient to future disasters (IASC 2020, OCHA 2020a). To quantify the local economic impact generated through the supply chain, we sum up all expenses made in the country such as local procurement, transport, storage, and staffing cost in the country office (e.g., local procurement strengthens local markets). To measure the impact of preparedness investments on the local economy, we use the ratio “Local Economic Impact (LEI) Increase” and calculate it as below: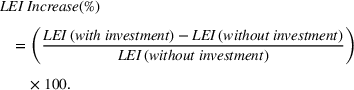
In the context of humanitarian operations, success is often measured in terms of speedy delivery, hence effectiveness is critical (Van Wassenhove, 2006, Tomasini and Van Wassenhove, 2009, Cozzolino et al., 2012). One way of reflecting enhanced effectiveness in the humanitarian supply chain is measuring DLT saved in relation to the investment made. We capture two critical characteristics of an effective response, namely “fast on the ground” (represented by the time in which 10% of the items needed are distributed) and “needs fulfillment” (represented by the time in which 90% of the needs are satisfied).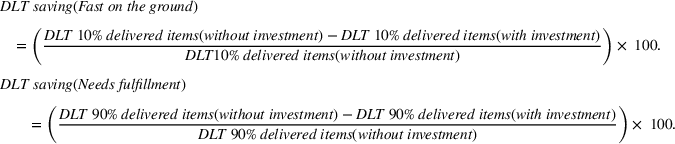
Model validation
We conducted behavioral reproduction tests (Sterman, 2000) to check whether the model can replicate observed behavior at a more aggregated level because we did not have dynamic data that we could compare our detailed findings to. Our findings are aligned with results of other papers (Van Wassenhove, 2006, Kunz et al., 2014, Lewin et al., 2018, Jahre and Jahre, 2019) and practitioners (BCG 2015, WHS 2016, HELP Logistics, Kuehne Logistics University [KLU] and Action Contre la Faim (ACF) 2018) who emphasize the potential of supply chain preparedness efforts. For example, Jahre and Jahre (2019) present the improvements, the IFRC experienced in different relief operations before and after preparedness investments. The BCG study (2015) found that the WFP and UNICEF preparedness efforts in Chad, Madagascar, and Pakistan led to significant cost and lead time savings. Moreover, we reproduced results reported by Kunz et al. (2014) on investments in disaster management capabilities versus pre‐positioning inventory. They found that investing in supply chain preparedness clearly has a positive impact on performance (higher service level and lower RC) and that investing in several preparedness activities has a larger positive impact compared to investing only in one activity (e.g., pre‐positioning). Both results are very much consistent with our findings. Also, our results are aligned with Gonçalves (2011), who demonstrates the correlation of an organization's investment in its own capacities (e.g., HR capacity) and the organization's performance in a disaster response. In the case of decentralized settings, we replicate the findings from Kunz et al. (2014), who show that lead time savings of 67% are achievable when investing in preparedness.
Furthermore, we compare the model deliverables with the “mental database” that was built up through our case study research (Forrester, 1994, Kunz et al., 2014). More specifically, we compare the performance metrics with the empirical results of our case study research. By adjusting the model to reflect the setting of the Philippine Red Cross (mix of hybrid and decentralized characteristics), we replicate the finding of the IFRC case study that with an investment of USD 148,000 and a disaster time of 365 days a total saving of USD 1,195,000 can be generated (HELP Logistics, Kuehne Logistics University [KLU], and International Federation of Red Cross and Red Crescent Societies [IFRC], 2018). We presented our results at several meetings with humanitarian organizations, institutional and private donors. We also checked the assumptions made and final results produced with selected senior supply chain managers from organizations that participated in our case studies. In the sensitivity analyses, we focused on very small, medium and large disasters (50,000, 500,000, and 1,000,000 beneficiaries) and early, mid‐term and late disasters time (day 50, 500, and 1000). We analyzed more than 3500 scenarios by comparing what happens if more (+5%, +10%, and +15%) or less (−5%, −10%, and −15%) funding and time would be required to implement the investments and if the investments had different impacts (“weighted impact”) on the respective supply chain capacities. Overall, we found that the model is very robust except for some cases of disasters happening very early (day 50). Here, we observe some sensitivity on the performance metrics, in particular regarding the investments in suppliers and markets for the centralized setting and in‐country transportation and distribution for the decentralized setting. This highlights the relevance of upstream supply chain capacities in the centralized setting while the downstream supply chain is more critical for the performance of the decentralized setting. More detailed information on the results of the sensitivity analysis can be found in Annex 4.1 in the Supporting Information.
Disaster data and context
We designed the relief supply chain for nonfood items (NFI) commonly distributed in different types of emergencies (UNHCR 2019). The NFI used in the model are of durable nature (one‐off delivery) with no expiry dates, can be purchased at similar quality standards in the affected country as well as internationally, and are of lower value (as expensive and more specialized products are usually difficult to source from local markets). We focus on countries with very high disaster risk profiles. In 2016, the Global Logistics Cluster started compiling a list of preparedness countries that were selected based on their disaster exposure in previous years (Global Logistics Cluster [GLC], 2016). For the SD simulation, we chose the initial 13 countries that were on that list and their main disaster events in the time period between 1 January 2010 and 31 December 2015 (equal to 2190 simulation days). We extracted disaster data from the emergency databases EM‐DAT (CRED, 2020) and UN OCHA (OCHA 2020b) and focused on the largest disasters (in terms of affected population) in the 13 countries under study. Due to the very dynamic nature of complex emergencies (conflicts), the number of affected population was taken at the time the disaster was declared by the humanitarian community. As no humanitarian organization ever targets 100% of the affected population on its own, we selected 10% of the affected population as a determining factor for the needs in the model (Table 3). Those numbers of targeted population correspond to the numbers of beneficiaries served in our case studies (HELP and KLU 2018). To analyze the investment impact, we run the simulation from the perspective of one of the 13 countries. We selected the Philippines because two of the case studies were with humanitarian organizations operating in the country and provided us with extensive supply chain data. The other 12 disaster events that use global resources are added for the centralized and hybrid settings.
Disaster data used in model
FINDINGS
We discuss our results regarding the performance metrics RC, lead time (10% and 90% delivery) and impact for the local economy. At first, we present the findings for the baseline scenarios with no investments made. Then we show the impact of preparedness investments in view of different disaster scales and disaster times. Finally, we discuss to what extent the results change in case of a major shock that affects the supply chain capacity both at international and local levels.
Scenarios without investment
When analyzing the different settings with no preparedness investments in our baseline scenario (very low‐value relief items and international procurement [USD 2.78 per item] being 20% cheaper than local procurement [USD 3.5 per item]), we find that the centralized and hybrid settings are more costly than the decentralized setting (Figure 6). The total RC difference is mostly associated with the high international transport and staff deployment costs.
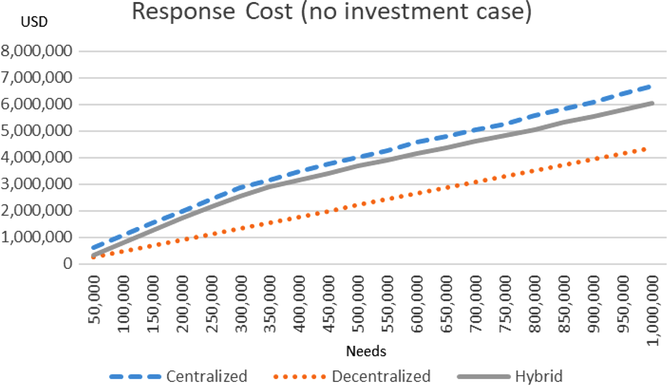
Response cost of the different operational settings in case of no investments.
When increasing the values of the relief items, we find that the decentralized setting remains cheapest for values of USD 12.5 per item (local procurement)/USD 10 per item (international procurement). For USD 25/USD 20 per item, the decentralized setting is the least expensive for smaller disaster scales (<400,000 beneficiaries) and the hybrid setting is the cheapest for medium to large disasters (400,000–1,000,000 beneficiaries). For items with a price of USD 50/USD 40 per item the centralized setting is the least expensive for small to medium disasters (50,000–750,000 beneficiaries) while the hybrid setting is most favorable for large‐scale disasters (800,000–1,000,000 beneficiaries). For items with a value of more than USD 50/USD 40 per item, the centralized setting is that with the lowest RC. Furthermore, we looked at the RC assuming that the price difference between international and local procurement changes. The results are impacted in a way that in case locally procured items have the same price as or cheaper prices than internationally procured items, the decentralized setting is the cheapest one for all disaster scales also for higher value items (e.g., USD 100 per item). Finally, we increased the logistics cost because transport and storage costs tend to increase with increasing item value (e.g., items have more volume, come with higher insurance premium, etc.). In the case where logistics cost increases in the same way we increase the item values, we find that the decentralized setting is the cheapest for all values up to USD 100 per item across all disaster scales, even if international procurement is 20% cheaper than local procurement. For more detailed results of the sensitivity analysis with regard to item values please see Annex 4.2 in the Supporting Information. It has to be noted that our study does not consider inflation effects on local prices as they were observed in some of the large response operations (e.g., Haiti earthquake) in the past. Such inflation might increase the difference between international and local procurement beyond the anticipated 20% and will have an impact on the results.
With regard to the DLT (Figures 7 and 8), the decentralized setting is faster on the delivery of the first 10% of items needed than the centralized setting (and as fast as the hybrid setting) for smaller scale disasters. The larger the disaster, the more the 10% DLT of the decentralized setting slows down compared to the centralized and hybrid settings. For the 90% DLT the decentralized setting is generally slower than the hybrid and centralized settings (except for the case of very small disasters of 50,000 people affected). The main reason for this system behavior is the limited capacity of the local market and staff, affecting the decentralized setting most and causing longer lead times in larger disasters. The centralized setting on the other hand has a larger international procurement capacity and can source items from international suppliers faster. In addition, due to the extensive number of international deployments, the supply chain response capacity in the country can be enhanced at a faster scale.
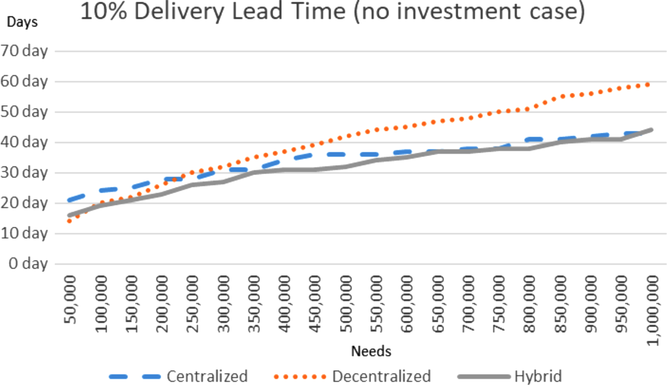
Ten percent delivery lead time of the three operational settings in case of no investments.
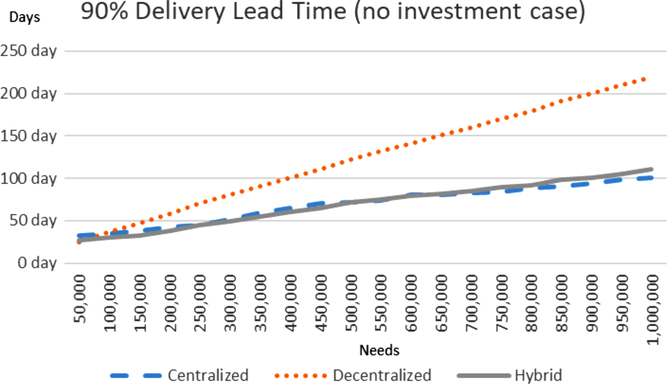
Ninety percent delivery lead time of the three operational settings in case of no investments.
The positive impact on the local economy in the decentralized setting is clearly higher than in the centralized and hybrid settings because all response expenses stay in the affected country. The main reason for the low impact of the hybrid and centralized settings is that the majority of the expenditures occur outside of the country (internationally sourced items, international transport and deployment of international staff). Through our detailed analysis of the different settings with regard to their operational performances, we contribute to discussions from Gatignon et al. (2010) and Besiou et al. (2014). Although Gatignon et al. (2010) conclude that decentralized settings have the potential to reduce cost and delivery time, Besiou et al. (2014) state that the centralized setting (of humanitarian vehicle supply chains) is cheaper and faster than the decentralized setting. As per our findings, performance comparisons between different settings have to consider different supply chain cost structures (e.g., logistics cost), scales of disasters as well as types of relief items (in terms of their availabilities and prices).
Scenarios with investment
To study the impact of preparedness investments, we are running our model in view of different disaster scales and different disaster times.
Different disaster scales (disaster happening at day 400, investments made across all elements)
Humanitarian organizations respond to disasters of different scales. Total RC and lead time heavily depend on the number of beneficiaries and their demand. To consider this operational reality, we analyze the impact of preparedness investments on disasters ranging from very small (50,000 beneficiaries) to very large (1,000,000 beneficiaries).
Except for very small disasters with 50,000 beneficiaries, we find positive H‐RoI RC ratios in all settings. For small to medium disasters (50,000–500,000 beneficiaries), the hybrid setting has the largest cost saving potential. For larger disasters, the hybrid and centralized settings have both higher cost saving potentials than the decentralized setting. In terms of total cost this makes the hybrid cheaper than the centralized setting, with the decentralized setting still being the cheapest. The cost savings for the hybrid setting come mostly from the shift from international to more local sourcing as well as reduced dependence on international deployments due to increased local staff capacity.
The decentralized setting has for both 10% and 90% deliveries the largest time saving potential. Hence, the decentralized setting becomes fastest with regard to the 10% DLT independent of disaster size (Figure 9). For the 90% DLT, the decentralized setting is faster than the centralized setting except for the case of very large‐scale disasters (Figure 10). The decentralized setting is also faster (for the 90% DLT) than the hybrid setting for disasters up to 250,000 affected beneficiaries. For every disaster of larger scale, the hybrid setting becomes the fastest across all settings (except for the disasters with affected populations of 550,000–750,000, where the decentralized setting is the fastest setting). The tremendous time saving for the decentralized setting is mainly related to the enhanced local procurement capacity due to better market knowledge and framework agreements in place. This also benefits (but to a lesser extent) the hybrid setting.
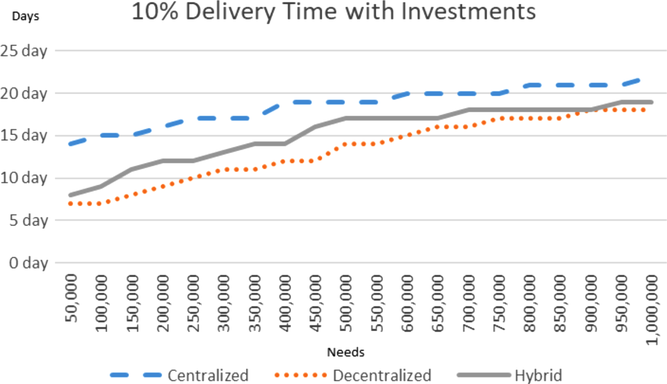
Ten percent delivery lead time of the three operational settings with investments.
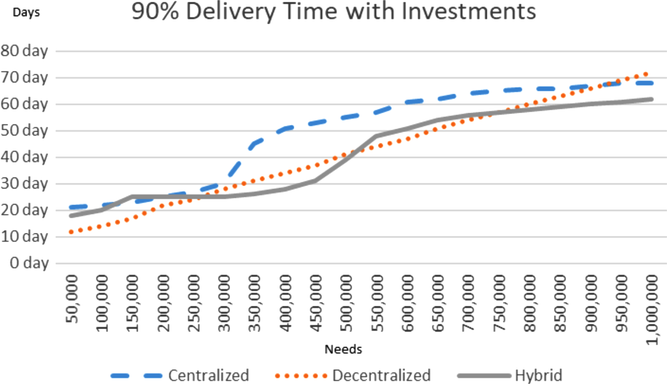
Ninety percent delivery lead time of the three operational settings with investments.
The decentralized setting remains the one with the most positive impact on the economy in the affected country. However, due to the shift to more local procurement through the investments made, the hybrid setting has the largest relative increase in positive impact on the local economy. An interesting but logical observation is that if the different settings are becoming more cost‐efficient, the positive impact on the local economy as per our definition decreases.
Impact of disaster time and number of disasters
Preparedness investments take time until they are implemented and start to generate impact in the supply chain. Therefore, we analyze the supply chain performance of the different settings in view of different disaster times. As humanitarian organizations often face competing demands from simultaneous disasters, we also study the impact of disasters happening in other countries. The model shows that the time of the disaster influences particularly the H‐RoI cost (Figure 11). In case of a disaster striking very soon after the investment decision has been made (e.g., at day 50), the H‐RoI cost is negative across all settings. The H‐RoI cost climbs steeply until it reaches a maximum (investments generate full impact) and then decreases slowly over time (running costs such as pre‐positioning bring the H‐RoI cost down). The H‐RoI cost in the centralized and hybrid settings fluctuates because of the impact of disasters happening in other countries.
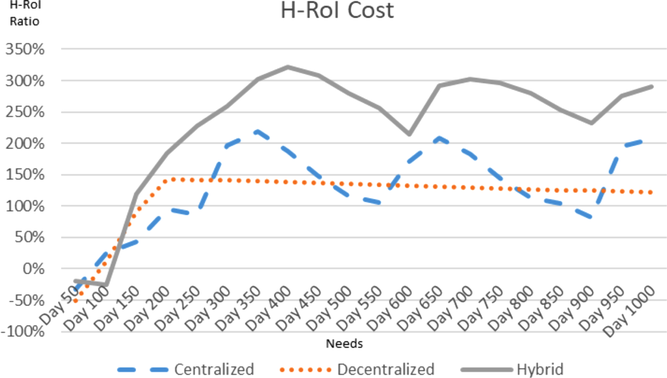
H‐RoI cost of the three operational settings in view of different disaster times.
We can see some interesting behavior in our findings with regard to the lead times in the different settings and different times of disasters (Figure 12). Similar to the H‐RoI cost, we can see the growing positive impact on the lead time until the investments have been implemented (day 150–200). The centralized and the hybrid settings experience some sudden spikes where the lead times increase drastically (e.g., day 100 and day 600). This is because of disasters happening in other countries and the resources of the centralized and hybrid settings are stretched during that time.
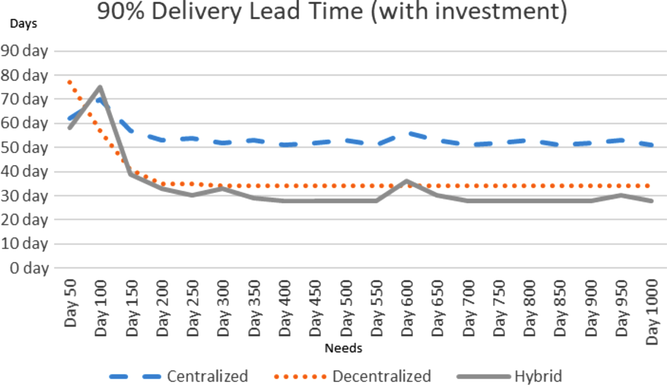
Ninety percent lead time of the three operational settings with investments in view of different disaster times.
In a next step, we study the different settings in case there are countries where preparedness investments have been made but no disaster strikes. To do so, we look at the 13 countries that we selected for our study (based on the Logistics Cluster preparedness country list—please see Subsection 4.5) and disaster data as extracted from the emergency databases EM‐DAT (CRED, 2020) and UN OCHA (OCHA 2020b). We calculate the total H‐RoI cost for the different settings under the assumption that disasters strike in all countries (as per the information provided by the emergency databases). In this case, the hybrid setting has the highest H‐RoI (156%), followed by the centralized (139%) and the decentralized (38%) settings (for further details, please see Annex 5 in the Supporting Information). From that baseline, we run the simulation model by increasing the number of countries with no disaster happening from 0 to 13 (meaning there is no disaster in any of the countries).
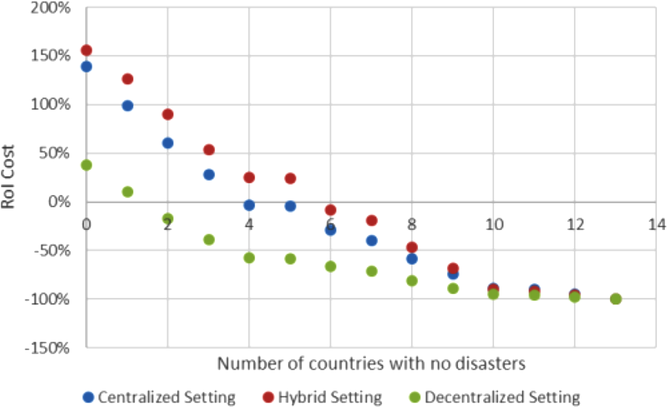
To analyze the correlation of disaster scale and H‐RoI, we reduce in a first step the disasters from largest to smallest, meaning that the first country with no disaster happening would be country 9 (with 670,000 beneficiaries in case of disaster). As presented in Figure 13, we see a rather steep decline in the H‐RoI cost across all settings, with the decentralized setting having a negative H‐RoI already when two of the largest disasters are not happening. The H‐RoI in the centralized setting turns negative once there are 4 of the largest disasters not occurring while the H‐RoI in the hybrid setting turns negative if 6 of the 13 disasters are not happening. From this perspective, the hybrid setting is the most robust in case disasters are not happening as it keeps the positive H‐RoI cost for the longest. As expected, if there is no disaster, then no preparedness investment pays off.
H‐RoI Cost as per number of countries with no disasters (in sequence from large‐ to small‐scale disasters).
Furthermore, we take the approach that disasters occur in the sequence from the smallest to the largest scale. Figure 14 shows that the H‐RoI cost decreases less steeply. The decentralized setting remains the first one where the H‐RoI turns negative but only when there are eight countries with no disasters. A difference to the approach of reducing disasters from large to small scale is that from the moment that there are six countries with no disasters, the centralized setting has a higher H‐RoI cost than the hybrid setting. However, centralized and hybrid H‐RoIs both turn negative when 11 of the 13 disasters do not strike. Subsequently, from an H‐RoI cost perspective, the preparedness investments should not be made if there are at least 8 (in the case of decentralized setting) or at least 10 (centralized and hybrid) countries with no disaster happening.
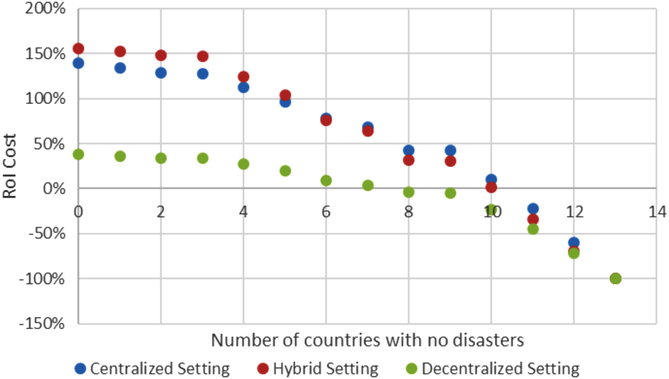
H‐RoI Cost as per number of countries with no disasters (in sequence from small to large‐scale disasters).
Impact of major shocks
Recent crises such as the Ebola outbreak in West Africa and the COVID‐19 pandemic severely reduced supply chain capacities on international and local levels. We study the impact of such shocks on scenarios where preparedness investments have been made. We analyze shocks that affect the supply chain end‐to‐end (international and local transport systems, international and local supplier markets as well as number of available staff) and study to what extent these shocks prolong the lead time to deliver 90% of the required items. Across the disaster scales analyzed (50,000–1,000,000 beneficiaries), we find that all settings are massively affected in terms of increased DLTs—with the decentralized setting being the most vulnerable (Figure 15). When comparing the shock impact on the decentralized setting in case with and without preparedness investments made, we see that there is only a minor difference (e.g., 75% capacity reduction leads to 352% lead time increase in case of no investment and 326% increase in case of investment). Although preparedness investment showed a tremendous impact on the operational performance in normal circumstances, it appears that those investments poorly protect decentralized supply chains against major shocks. One explanation for this system behavior is the vulnerability of decentralized supply chains that mostly rely on resources available in the country. Furthermore, traditional preparedness investments have a strong output focus to increase operational performance in case of sudden and significant increase in humanitarian needs. Less attention is given to strengthen supply chain capacities in the long run.
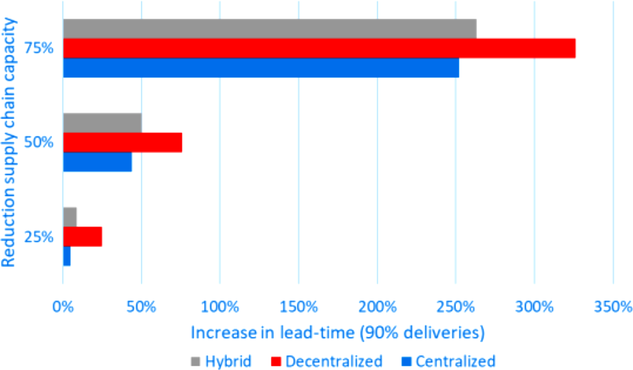
Impact of major shocks on lead time.
Subsequently, we expand our study by looking at measures that strengthen humanitarian supply chains against major shocks in addition to the preparedness investments made. We do that with a special focus on the most vulnerable decentralized setting by comparing the case of no additional measures (full impact of shock on main supply chain parts such as transport systems, supplier markets and human resources) with cases where the shock has no impact on (1) supplier market, (2) transport systems, and (3) HR capacity. Through our model, we are able to identify that strengthening (local) supplier market has the strongest potential to reduce the negative impact of smaller to medium shocks (25% and 50% supply chain capacity reduction). In case of a massive shock (75% capacity reduction), strengthening staff availability and transport systems appears to be most impactful (Figure 16).
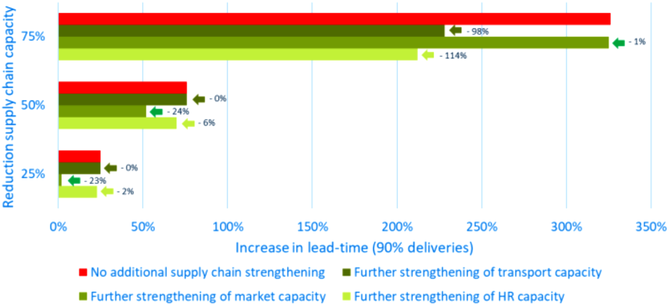
Strengthening of decentralized supply chain capacities.
Strengthening capacities in local suppliers, transport, and labor markets to an extent that they are better protected against major shocks requires investments that go beyond the traditional humanitarian focus. To enhance both operational performance as well as making humanitarian supply chains more resistant against shocks, a closer alignment of humanitarian preparedness and long‐term development efforts will be needed.
CONCLUSION
To conclude, we summarize our findings, discuss contributions of our work to theory and practice and present limitations and opportunities for future research in this field.
Discussion of findings
We have built an SD model that reflects the dynamic and complex operational reality of an integrated humanitarian supply chain. This model allows us to better understand the system behavior and the performance output in terms of RC, lead time and local economic impact. Based on our extensive case studies, we are able to compare the output of centralized, hybrid and decentralized settings in scenarios with and without preparedness investments. Ultimately, we run an initial analysis on the vulnerability of humanitarian supply chains in times of major shocks and disruptions.
Our model findings illustrate that the question of what operational setting comes with the lowest RC depends heavily on the value of the relief item (including the price difference between local and international procurement), the logistics cost and the scale of the disaster (in terms of total demand for assistance). Lower value items generally make the decentralized setting more favorable from a cost perspective, which is confirmed in our base case scenario for very low‐value items for the case with and without investments. However, the preparedness investments under study have a relatively stronger saving potential for the centralized and hybrid settings than for the decentralized setting. For higher value items and in case of preparedness investments being implemented, the centralized and hybrid settings become cheaper than the decentralized one. With regard to local economic impact, the decentralized setting creates more positive impact than the centralized and hybrid settings for scenarios with and without preparedness investments. Centralized and hybrid settings outpace decentralized settings with regard to lead times for deliveries of 10% and 90% of the relief items needed in the case of no investments made (with the exception of small‐scale disasters and 10% DLT, where the decentralized setting is the fastest). The impact on lead time savings through preparedness investments is the largest for decentralized settings, making this setting the fastest for 10% DLT across all analyzed disaster scales and faster for small to medium size disasters for 90% DLT. In Tables 4–6, we summarize the findings of our research with regard to performance of the different settings. Table 4 presents findings of Subsection 5.1, where we analyze the performances of the three operational settings with no preparedness investments made. Table 5 shows results of Subsection 5.2, where we analyze the performances of the three operational settings with preparedness investments made. Table 6 summarizes the investment impact ratios (as defined in Subsection 4.3) across the different settings (discussed in Subsection 5.2). We rank the settings from 1 to 3, whereas 1 means that the setting is performing best (for example lowest cost and lead time and highest local economic impact for Tables 4 and 5; for Table 6 the highest cost and lead time saving ratios and highest local economic impact increase ratio).
Supply chain performance of different settings with no preparedness investments made (baseline scenario with low‐value items and disaster happening on day 400)
Supply chain performance of different settings with preparedness investments made (baseline scenario with low‐value items and disaster happening on day 400)
Summary of preparedness investment impact for baseline scenario (low‐value items and disaster happening on day 400)
Overall, we find that organizations investing in supply chain preparedness in countries with high‐risk profiles in most cases achieve a positive impact on their performance independent of their operational setting. Exceptions can be observed in the case of disasters happening very soon after the investment decision has been made (<100 days) because investments are not fully implemented, and in the case of very small disasters with relatively little saving potential (<50,000 people affected). The H‐RoI is also negative in case there is no disaster happening at all (from the perspective of one single country) or several countries with no disaster (from the perspective of all 13 countries under study).
The application of the H‐RoI concept can help humanitarian organizations and local governments in their negotiations with donors to re‐channel traditional funding streams by providing fact‐based information on the expected benefits of preparedness investments. The application of the H‐RoI concept might also activate new donors, in particular private ones, as they are used to thinking in cost‐benefit terms. The impact of a global crisis with reduced capacities all along the supply chain affects all settings under study but exposes the decentralized setting as the most vulnerable one. Although the results of our preparedness studies generally encourage investments in decentralized settings, humanitarian organizations, donors and governments also need to look into strengthening the supply chain, in particular for decentralized settings, to reduce the negative impact of potential major disruptions on relief operations. Here, a paradigm shift of closer alignment of humanitarian preparedness and longer term development efforts will be essential.
Contributions
Through our work, we contribute to existing research in four ways. First, we address the lack of systemic and holistic thinking (Anjomshoae et al., 2022) by developing an integrated humanitarian supply chain to measure and quantify the performance output with regard to RC, DLT, and local economic impact. Second, we add to discussions on the operational reality of humanitarian organizations by analyzing performance levels of centralized, hybrid and decentralized settings (Gatignon et al., 2010, Pedraza‐Martinez and Van Wassenhove 2012, Bhattacharya et al., 2014, Besiou et al., 2014, Stauffer et al., 2016). Third, we expand the research field of humanitarian supply chain preparedness (Van Wassenhove, 2006, Kunz et al., 2014, Jahre et al., 2016). Although research has mostly focused on individual investment elements, we take a holistic and integrated view on the supply chain, modeling intra‐ and interorganizational investments. We differentiate the reduced response lead time into fast on the ground (10% of needed items delivered) and needs fulfillment (90% of needed items delivered) and measure the success of relief responses in view of the local economic impact generated on the ground. Furthermore, we are introducing the H‐RoI concept to financially quantify the impact of preparedness investments in the humanitarian nonprofit space. Fourth, we provide first insights into the field of strengthening humanitarian supply chains toward major shocks.
In terms of contributions to practice, the studies proved their value within the humanitarian organizations that participated in the studies as well as in the humanitarian sector in general. Based on the findings, organizations adjusted their global preparedness strategy and created new positions in form of preparedness manager roles at a headquarters level. Organizations also received additional funding to implement the investment strategies that were identified by the model to have the largest impact. Many organizations experienced an increased awareness level from the donor side as the studies were presented at several occasions, such as the Inter‐Agency‐Working Group in Geneva in September 2018. Based on our research, the Global Logistics Cluster ran a media campaign via their social media channels under the hashtag #preparednessworks to advocate for enhanced preparedness (Global Logistics Cluster [GLC], 2019). The European Commission included our findings in their new logistics policy (DG ECHO, 2022). With preparedness high up on the agenda for all actors operating in the humanitarian space, we see a lot of potential to expand our research.
Limitations and future research
With the focus on high‐risk countries, our work does not capture the impact of preparedness investments in an environment of low to medium disaster risk levels. We encourage future research to study preparedness investments in such an environment to include scenarios where, for example, no disaster happens after the preparedness investment has been made. Further differentiation between disasters of different types (e.g., sudden vs. on‐set or man‐made vs. natural disasters) will also be of added value to national governments, humanitarian organizations and donor institutions. Our finding that decentralized settings are most vulnerable to shocks calls for researchers to bring together discussions on humanitarian preparedness with long‐term capacity building in countries.
Footnotes
References
Supplementary Material
Please find the following supplemental material available below.
For Open Access articles published under a Creative Commons License, all supplemental material carries the same license as the article it is associated with.
For non-Open Access articles published, all supplemental material carries a non-exclusive license, and permission requests for re-use of supplemental material or any part of supplemental material shall be sent directly to the copyright owner as specified in the copyright notice associated with the article.