
Abstract
Although past studies have found differences in clinical quality outcomes based on patients' insurance type, the extent of these discrepancies, the underlying mechanisms supporting this relationship, and factors that can moderate this effect have not yet been addressed. We seek to fill this gap by studying the relationship between insurance type and clinical quality outcomes using the level of care received, that is, treatment intensity, as a mediator. Using agency theory, we argue that underinsured patients (patients insured by Medicaid) will experience more adverse clinical quality outcomes due to lower treatment intensity compared to privately insured patients. We then explore whether two contextual factors—patient complexity and resource utilization—influence the relationship between insurance type and treatment intensity, and in turn clinical quality outcomes. We use 2010–2016 data from California to test these relationships. The insurance types used for comparison are private and Medi‐Cal (California's equivalent of Medicaid, representing underinsured patients). A patient's 30‐day readmission rate is used as a measure of clinical quality and the log of charges normalized by wage index and inflation (called treatment intensity) is used as a proxy for the level of care they received. We use within‐hospital coarsened exact score matching to create a comparable group of patients using private and Medi‐Cal insurance followed by a hospital fixed effects regression with errors clustered by hospital to test these relationships. Results indicate that treatment intensity mediates the relationship between insurance type and clinical quality outcomes. Further, the difference in treatment intensity based on insurance type is reduced as patient complexity increases, while higher utilization at a hospital lowers its incentive to provide equitable care to underinsured patients.
INTRODUCTION
Businesses often use customer segmentation to streamline operations and maximize financial performance (Kumar & Petersen, 2005). Customers can be segmented based on service lines and service needs, with each customer segment receiving different product/service offerings based on their unique needs and buying power. Although customer segmentation is common, companies may also choose not to serve all customers equally. For instance, companies may ignore customers that are too costly to provide services for or who are unprofitable in the long run by simply not offering any services or products for that customer segment (Zeithaml et al., 2001). In some sectors, however, such as healthcare, providers like hospitals must offer comparable services to all eligible patients due to social and legal pressures. Although, in some situations, hospitals have the option to limit the number of service lines (Ginsburg, 2000; McDermott & Stock, 2011) in order to focus on operations and improve efficiency, these same hospitals are still legally required to provide services that meet appropriate standards of care to all patients within those service lines. At the same time, revenue generated from different patients varies significantly based on their insurance plans. Patients with private insurance carriers are the most profitable, whereas patients who are underinsured (e.g., on Medicaid) or uninsured are loss leaders (Selden et al., 2015). For example, according to Yarbrough (2005), hospitals write off between 40% and 50% of their charges due to free and underpriced care delivered to patients.
Although most hospitals are nonprofit organizations, economic models of provider behavior still predict cost minimization, which is required to sustain operations, along with providing high‐quality care as objectives for their operation (Currie & Gruber, 2001; Malani et al., 2003). Hospitals’ goal of minimizing costs still contrasts with other service firms whose chief objective is profit maximization. These economic models suggest that hospitals will implement strategies to reconcile losses incurred from treating underinsured and uninsured patients. A recent example of this behavior is the decision by Mayo Clinic to prioritize care to privately insured patients over patients insured through Medicaid and Medicare (Ross & Joseph, 2017). Such strategies for reconciling reimbursement losses may have the unintended effect of lowering clinical quality outcomes for underinsured and uninsured patients. Academic literature by and large assumes equitable treatment of all patients based on their diagnoses, leaving this phenomenon underexplored. These studies are premised on the idea that hospitals are motivated by altruism and that the Hippocratic Oath of care is the driving force behind providers’ decisions. However, other studies have investigated differences in clinical quality outcomes and level of care delivery for patients based on their insurance type, pointing to financial health and constrained resources as additional drivers influencing care delivery decisions. A summary of this literature stream is provided in Table 1. Within this literature stream, studies investigating the relationship between insurance type and clinical quality outcomes have documented that underinsured and uninsured patients face increased odds of inpatient mortality and readmission, as well as lower conformance to Centers for Medicare and Medicaid Services (CMS) process of care outcomes, as compared to privately insured patients (Connolly et al., 2018; Goldman et al., 2007; Spencer et al., 2013; Weygandt et al., 2012). Although researchers have acknowledged the existence of these correlations, consensus on their magnitude remains elusive, and studies have as yet provided limited actionable insights to reduce these adverse effects. We intend to fill this gap by, first, understanding the mechanism supporting this relationship and, second, identifying factors that may mitigate or amplify its effects. Additionally, an accurate determination of effect size is critical to the relevance of this issue; we thus take multiple steps (discussed later) to ensure accurate determination of the effect sizes for our variables of interest.
Literature review and gaps identification
The aforementioned literature stream suggests that one strategy to reconcile reimbursement losses may involve creating intentional differences in treatment intensity, that is, the level of care delivery, based on the patient's insurance type (Hadley et al., 1991; Weissman & Epstein, 1989; Wenneker et al., 1990). See Table 1 for details. In its 2002 report, the Institute of Medicine (IOM) also acknowledged differences in care delivery experienced by patients based on their insurance types. These differences in treatment intensity may manifest themselves in lower caregiver‐to‐patient ratios, use of older equipment, reduced numbers of lab tests, selective admission of healthier patients, offering of fewer services, use of generic medication, and so forth for underinsured and uninsured patients. Although studies have acknowledged the existence of strategies to influence treatment intensity, there is a lack of consensus on the extent of the resulting disparity and the contextual factors influencing it. Further, it is unclear if this behavior directly impacts clinical quality outcomes, that is, whether treatment intensity acts as a mediator in the relationship between insurance type and clinical quality outcomes. In fact, studies have reported both positive and negative impacts of treatment intensity on clinical quality outcomes (Hussey et al., 2013), making it difficult to confirm or deny a mediating relationship based on extant literature. Finally, a majority of these studies have not used robust econometric techniques to establish causality between insurance type, treatment intensity, and clinical quality outcomes, meaning that their findings are most likely context‐specific associations. Given these gaps in the literature, we first examine the role of treatment intensity as a mediator in the relationship between patient insurance type and clinical quality outcomes. Contrary to the extant literature, our empirical approach addresses multiple challenges with accurate estimation of this relationship, including hospital‐level matching of patients, large panel data set, use of multiple operationalizations of treatment intensity, and multiple robustness checks, which enables us to establish a stronger empirical basis and accurately determine effect sizes for the relationships among our variables of interest.
We further examine the impact of two contextual factors—resource utilization and patient complexity—in influencing the relationship between insurance type and treatment intensity, which in turn should influence clinical quality outcomes (a moderated mediation relationship). In recent years, an aging population and better insurance coverage have increased demand for care delivery. Increased demand has put additional strain on hospitals’ resources, including their workforce, which could further aggravate already high burnout rates among hospital employees (Aiken et al., 2002; Dyrbye & Shanafelt, 2011). The resulting scarcity of resources may reduce hospital incentives to allocate them to loss‐making patients. Thus, resource utilization may influence potential differences in treatment intensity for uninsured and underinsured patients. Patient complexity is another factor that may affect the relationship between insurance type and treatment intensity. As patient complexity increases, the uncertainty in care delivery outcomes also increases, necessitating additional information on the part of caregivers to devise effective treatment plans. The increased uncertainty in devising treatment plans associated with patient complexity may reduce the differences in treatment intensity based on insurance type. For this reason, we study the impact of workload, which is a proxy for resource constraints, and patient complexity, which is a proxy for treatment uncertainty, on the relationship between insurance type and treatment intensity. A better understanding of these relationships will provide operational levers that policymakers, hospital executives, and industry watchdogs can draw on to minimize any negative impact on clinical quality outcomes for underinsured and uninsured patients.
We test these research questions using patient‐level data from the state of California for the years 2010 through 2016. A patient's 30‐day readmission rate is used as a measure of clinical quality. The insurance types used for comparison are private and Medi‐Cal (California's Medicaid program, which represents the underinsured population seeking care delivery in the state). The log of charges normalized by wage index and inflation, called treatment intensity, is used as a proxy for the level of care received by the patient in question. Charges reflect the full established rates (before contractual adjustments) for the services provided to the patient, which are an excellent proxy for evaluating the differences in the level of care delivery. We use a within‐hospital coarsened exact matching (CEM) procedure with an extensive set of covariates to create a comparable group of patients using private and Medi‐Cal insurance for each hospital in our data set. Then, using a hospital fixed effects ordinary least squares (OLS) regression with robust standard errors clustered by hospital, we test the relationship between insurance type, treatment intensity, and clinical quality outcomes, as well as the moderating impact of contextual factors in influencing this relationship.
Results indicate that treatment intensity mediates the relationship between insurance type and clinical quality outcomes, that is, readmissions, with Medi‐Cal patients being 1.86 times more likely to be readmitted than comparable privately insured patients within a 30‐day window. This indicates that differences in treatment intensity could have serious implications for treatment effectiveness and important clinical quality outcomes. We also find that higher utilization at a given hospital lowers its incentive to provide equitable care to underinsured patients. Hospitals with higher utilization show a 14.46% difference in treatment intensity compared to a 9.68% difference in treatment intensity among hospitals with lower utilization. Finally, our findings show that patient complexity reduces differences in treatment intensity based on insurance type, as patients with higher complexity show a 9.89% difference in treatment intensity compared to a 13.08% difference for patients with lower complexity.
Our study makes several important contributions to literature and practice. Specifically, we demonstrate that treatment intensity is a mediator in the relationship between insurance type and clinical quality outcomes. Although extant studies have documented differences in clinical quality outcomes based on a patient's insurance type, these results on their own do not provide actionable insights to influence this relationship. Treatment intensity, on the other hand, can be influenced by both hospitals and policymakers. By establishing treatment intensity as a mediator, we not only provide a better understanding of this relationship but also identify an operational factor, which can have a positive influence on clinical quality outcomes for underinsured and uninsured patients. Additionally, we demonstrate that the relationship between insurance and treatment intensity is moderated by patient complexity (a proxy for uncertainty in devising treatment plans) and the care delivery unit's utilization (a proxy for resource constraints). Specifically, we find that increased uncertainty associated with care delivery reduces differences in treatment intensity, whereas increased resource constraints aggravates those differences. Overall, our results provide important insights into the mechanisms supporting and factors influencing the relationship between insurance type and clinical quality outcomes.
THEORY AND HYPOTHESIS DEVELOPMENT
The relevant literature related to our relationships of interest is summarized in Table 1. We use this literature stream as well as agency theory as a basis to propose our hypotheses.
Agency theory
Agency theory explains how actors in a relationship (a principal and an agent) who have asymmetric information can contract to align outcomes (Eisenhardt, 1989). The principal contracts with the agent to do work, but the principal bears the majority of the risk. If the principal cannot monitor the agent's work, it creates a moral hazard problem, that is, possibility of the agent shirking their work. To address both the moral hazard and inequality of risk sharing, agency theory offers an “outcome‐based contract” in which the agent is judged and rewarded based on the outcome instead of the process. By focusing on the outcome instead of the process, part of the risk is shifted onto the agent, which increases their incentives to employ appropriate effort. We use this theory to explain the relationship between the patient (i.e., the principal) and the hospital (i.e., the agent). The patient engages the hospital to provide care. We broadly assume that the patient does not know every step the hospital should take in administering care. That is, the patient, while being cared for, may not be aware of the appropriate standards of care and therefore cannot monitor the quality of the hospital's work (Coulter & Fitzpatrick, 2000). Additionally, if the hospital staff fails to meet the appropriate standards of care, the patient will bear the risks of receiving low‐quality care.
Although underinsured patients do not provide the same financial compensation to hospitals as do privately insured patients, there are still financial and social incentives for hospitals to treat them. The practice of treating patients at reduced reimbursement rates is called “charity care.” Although charity care has lower reimbursement rates, it offers altruistic benefits (i.e., the benefits of doing a good deed) derived from care delivery to the needy. Charity care also does yield some financial benefits. Medicare patients in particular may use the hospital's services at a higher rate, which can help better utilize care delivery capacity at a hospital and thus can be financially beneficial, especially given hospitals’ ability to influence treatment margins (Robinson, 2011; Stensland et al., 2010). Additionally, widening income disparity in the United States is forcing more individuals to rely on low‐cost insurance plans, making this group difficult to ignore. For example, the U.S. patient population insured by Medicaid and the Children's Health Insurance Program (CHIP) increased from 35.3 million in 2000 to over 61.2 million in 2013 (Kaiser Family Foundation, 2014). Hence, both economics and charity care will drive hospitals’ decisions on the level of care provided to patients. Given that patients do not have the expertise to judge the quality of care provided, under certain circumstances, hospitals may be biased toward providing a lower level of care to certain patients. This could potentially be true for underinsured patients who do not provide commensurate compensation for the services rendered by the hospital.
Insurance type, treatment intensity, and clinical quality outcomes
Main effect of insurance type on clinical quality outcomes
Financial incentives drive organizational decisions and often motivate organizations to offer different products/services to different customer segments depending on their willingness or ability to pay for them. Even among nonprofit organizations, where profit maximization is not the objective, maintaining sound financials is critical to sustaining operations (Horwitz, 2005; Shen, 2003). In the healthcare sector, the majority of hospitals are nonprofits and are driven by the altruistic goal of providing effective care to all patients. However, compensation received by hospitals for care differs significantly according to the patient's insurance type, with privately insured patients being the most profitable, and underinsured and uninsured patients being loss leaders (Lopez et al., 2020). Due to the significant mismatch between the compensation for care received from private versus underinsured patients, we argue that financial incentives could influence hospitals to devise strategies that reconcile such reimbursement losses. These strategies could involve shorter lengths of stay or fewer procedures administered to underinsured and uninsured patients as compared to privately insured patients (Hadley et al., 1991; Weissman & Epstein, 1989; Wenneker et al., 1990). The use of such strategies points to the prioritization of economics of care delivery over charity care in the principal–agent relationship between the patient and the hospital.
Such approaches to reconciling reimbursement losses may have the unintended effect of producing lower clinical quality outcomes for underinsured and uninsured patients. Extant studies in this area have documented higher odds of mortality and readmission, and lower conformance to care delivery protocols for underinsured and uninsured patients compared to privately insured patients (Connolly et al., 2018; Goldman et al., 2007; Spencer et al., 2013; Weygandt et al., 2012). Among these studies, Goldman et al. (2007) find a lower adherence to CMS process of care measures for nonteaching hospitals with a high percentage of Medicaid patients when compared to other nonteaching hospitals. Spencer et al. (2013) show that privately insured patients have a lower mortality rate compared to those insured by Medicare and other patient groups. Weygandt et al. (2012) find significant differences in mortality after blunt injury between insurance types, with private insurance and Medicaid having lower mortality rates compared to not billed and self‐pay. Finally, Connolly et al. (2018), use a cross‐sectional analysis with 12,525 population cells to demonstrate that Medicaid and uninsured patients were associated with increased odds of inpatient mortality, readmissions, postsurgical complications, postoperative length of stay, and charges. Following the findings from these studies, we propose that insurance type will influence clinical quality outcomes, and specifically that underinsured patients will experience more adverse clinical quality outcomes. This leads to the following hypothesis. A patient's insurance type will influence their clinical quality outcomes, with underinsured (Medi‐Cal) patients experiencing worse clinical quality outcomes when compared to privately insured patients.
Indirect effect via mediation of treatment intensity
Evidence from the literature suggests that hospitals reconcile part of the losses from charity care by implementing intentional differences in the level of care delivery, that is, treatment intensity, based on the type of insurance a patient carries, with underinsured patients receiving a different level of care compared to privately insured patients. For example, in a study of California hospitals, Dranove and White (1998) find that hospitals reduced their level of service to Medi‐Cal patients in response to a reduction in reimbursement rates. The difference in treatment intensity for underinsured patients may manifest itself through the use of lower cost equipment, prescribing generic medications, administering fewer procedures, dedicating a smaller number of personnel, and/or assigning lower quality physicians to their case. Supporting this thesis, Hiestand et al. (2004) find that uninsured acute myocardial infarction patients are more likely to receive less expensive therapies compared to insured patients, who are more likely to receive expensive invasive treatments. Frank and Salkever (1991) also find evidence of impure altruism in the decision of hospitals to provide charity care. Additionally, when evaluating the impact of the Hill–Burton Act, Almond et al. (2011) found that, while under the terms of this Act, private hospitals provided charity care by selecting less severe patients and offering service lines that were less expensive to maintain. These same hospitals often discontinued these charity care–focused services when the terms of the Hill–Burton Act expired. Analyzing discharge abstracts of patients from a national sample of hospitals, Hadley et al. (1991) found that uninsured patients were between 29% and 75% less likely to undergo each of five high‐cost or high‐discretion procedures included in their study. Weissman and Epstein (1989) compare uninsured patients with Blue Cross–insured patients, finding that uninsured patients had, on average, 7% shorter stays and underwent 7% fewer procedures than Blue Cross–insured patients. Investigating the likelihood of patients receiving three cardiac procedures (angiography, bypass grafting, and angioplasty), Wenneker et al. (1990) find that privately insured patients had higher odds of receiving these procedures when compared to either uninsured or Medicaid‐insured patients. Finally, Epstein et al. (2012) show that drug‐eluting stents, which reduce outcome and stent‐related complications, had a lower utilization among underinsured patients. These studies provide evidence of how hospitals prioritize the economics of care delivery over the purely altruistic motivation to provide charity care.
The factors driving hospitals to prioritize care delivery economics over altruistic charity care benefits are further strengthened in the current operating environment, which has witnessed increased competition and compression in margins. The median operating margin for hospitals in 2018 was 1.7% (Kacik, 2019), with most hospitals operating in the red. In this environment, the treatment of underinsured patients will increase the charity care burden on hospitals, further aggravating their financial situation. Even Mayo Clinic, a premier U.S. hospital, recently indicated that they will prioritize care to privately insured patients over Medicaid and Medicare patients, primarily because privately insured patients yield better margins (Ross & Joseph, 2017). Hence, we expect the economics of care delivery to be the dominant driver determining treatment intensity for patients and anticipate underinsured patients will have lower treatment intensity than privately insured patients.
Given that treatment intensity captures charges related to different aspects of care delivery—daily hospital services, ancillary services, any patient care services, and so forth—it may be correlated with clinical quality outcomes. For example, in their systematic review of studies evaluating the relationship between intensive care unit (ICU) staffing and clinical quality outcomes, Provonost et al. (2002) find higher staffing intensity to be associated with lower mortality rates. Similarly, Novack et al. (2010) found a negative association between more comprehensive routine lab tests and mortality among heart failure patients. Lower levels of treatment intensity would entail intentional decisions to commit lower quality resources to, perform fewer diagnostics and clinical procedures on, or provide older or less advanced treatments for, underinsured patients compared to privately insured patients. While these decisions supporting lower treatment intensity may still maintain required standards of care delivery for underinsured patients, the higher level of care received by privately insured patients (as reflected in higher values of treatment intensity) should result in improved treatment outcomes.
In its 2002 report, which looks at patients with traumatic injuries and acute cardiovascular diseases, the IOM acknowledged that uninsured patients have a lower likelihood of being admitted, receive fewer services during hospitalization, and, as a result, have a higher mortality rate than insured patients. Sepehri et al.’s (2006) study of non‐U.S. hospitals shows that insured patients have a higher likelihood of receiving inpatient care when compared to underinsured patients. Finally, lower quality physicians (who are key figures in deciding what treatment a patient receives) are more likely to treat underinsured patients within the same hospital (Gardner & Vishwasrao, 2010), leading to adverse health outcomes. Thus, we expect clinical quality outcomes to deteriorate due to compromises in treatment intensity for underinsured patients. This leads to the following hypothesis. The impact of insurance type on clinical quality outcomes is mediated through treatment intensity, such that lower levels of treatment intensity for underinsured (Medi‐Cal) patients will result in worse clinical quality outcomes for this group when compared to privately insured patients.
Moderating effect of utilization
Utilization refers to the busyness of a hospital. While high utilization may spread the fixed costs of a hospital over a greater volume of patients, it places a tremendous strain on resources and providers (Berry Jaeker & Tucker, 2017). Demand for resources is significantly higher during the admission stage, where initial diagnoses and tests are conducted to evaluate a patient's condition, as well as during discharge, where nurses must perform necessary tests and assess a patient's fitness for discharge (Berry Jaeker & Tucker, 2017; Clarke & Donaldson, 2008; Kuntz et al., 2015). As utilization increases, limited resources must be shared among more patients, imposing challenges in effectively meeting the care delivery needs of all patients and reducing the level of care (Diwas & Terwiesch, 2009).
Higher utilization could force hospitals to lower the level of care delivered to loss‐making patients. Given that adding capacity may be challenging and expensive, increased utilization of existing resources may drive hospitals to reevaluate how they allocate these limited resources among patients. It can therefore introduce differences in treatment intensity between underinsured and privately insured patients through the prioritization of financial objectives. Hospitals may choose to favor more profitable patients while restricting resources to underinsured patients. Past research indicates that higher utilization forces providers to make discretionary use of resources, differences that can manifest themselves in decisions such as lower resource dedication, fewer diagnostic and treatment interventions, or earlier discharges to free up capacity (Diwas & Terwiesch, 2009; Kuntz et al., 2015). Due to a greater emphasis on the bottom line, we anticipate these choices to be more pronounced for underinsured patients, which can introduce differences in treatment intensity. Differences in care delivery may also, in part, be driven by the restrictive insurance policies of the underinsured, which limit the type of care and procedures reimbursed. Hence, we argue that the driving forces behind charity care will improve as the capacity of the system to provide such care increases (i.e., as resource constraints ebb). This leads us to the following hypothesis. Higher resource utilization will amplify the difference in treatment intensity between underinsured and privately insured patients.
Moderating effect of patient complexity
Chronic illnesses such as diabetes, hypertension, and chronic respiratory diseases are highly prevalent, with 6 in 10 adults having at least one condition and 4 in 10 adults having two or more of these conditions. 1 In our study, we document the patient complexity arising from the presence of chronic conditions via the Elixhauser index, which captures the number and types of comorbidities for a given patient. Patient complexity increases the uncertainty associated with determining an effective treatment plan. This increased uncertainty is due to the additional information that needs to be processed while developing a treatment plan. For example, providers need to account for several factors such as drug interactions, treatment interventions, and treatment protocols that do not aggravate existing conditions while developing an effective treatment during hospitalization.
Given this uncertainty, patients admitted with greater comorbidity‐related complexity have an increased need for timely care, as incorrect treatments and decreased patient engagement can increase the likelihood of adverse events and negative outcomes (Nguyen et al., 2018). The uncertainty in treatment for more complex patients can be mitigated by increasing the level of care via factors such as improved diagnostics, testing, and monitoring, and better coordination of care between different subunits (Vogeli et al., 2007). As discussed earlier, hospitals are agents in the principal–agent relationship between patients and hospitals; they are evaluated on the outcome of their care delivery. For instance, the CMS through its readmission's reduction program penalizes hospitals for excess readmissions in patients after certain procedures. This incentivizes hospitals to develop effective, high‐quality programs and improve the level of care to avoid such penalties. In addition to such penalties, failures in care delivery also carry risk of adverse consequences for hospitals through lawsuits, loss of reputations and goodwill. Consequently, the motivation to prioritize care delivery economics should weaken when care delivery outcomes are at risk, resulting in smaller differences in treatment intensity based on insurance type as patient complexity increases. This leads us to the following hypothesis. Higher patient complexity will reduce the difference in treatment intensity between underinsured and privately insured patients.
RESEARCH DESIGN, DATA SOURCES, AND VARIABLES
Research design and data sources
We investigate the relationship between insurance type, treatment intensity, and clinical quality outcomes by gathering data from four major databases: California's Office of Statewide Health Planning and Development (OSHPD), the Inpatient Prospective Payment System (IPPS) from the CMS, the Healthcare Information and Management Systems Society (HIMSS), and the Dartmouth Atlas.
We focus on the state of California because the size of their Medi‐Cal program (underinsured population) and the extent of underfunding present an ideal setting to determine the impact of insurance type on clinical quality outcomes as well as mechanisms and contextual factors influencing the relationship between them. Medi‐Cal is California's Medicaid program, representing the state's underinsured population. It primarily serves low‐income individuals, those with an income below 138% of the federal poverty level. This program supplements federal Medicaid funding received by the state. Services provided through this program include ambulatory and emergency services, maternity care, mental health care, dental, vision, and long‐term care. As of February 2022, this program had 14.6 million enrollees, representing about one‐third of California's population. The Medi‐Cal program is also chronically underfunded and only reimburses 80 cents for every dollar spent on care. In 2009, the state ranked first in the country in the extent of underfunding for Medicaid‐equivalent programs, and hospitals treating Medi‐Cal–insured patients lost $4.6 billion.
We perform our analyses at the patient level. Our patient‐level data come from OSHPD for the years 2010 to 2016. This data set contains detailed information on patient demographics (age, gender, race, and insurance), dates of admission and discharge, and diagnosis‐related group (DRG) codes. We restrict our data based on principal diagnosis, insurance, and hospitals as will be explained next. First, we only include patients whose principal diagnoses are associated with diseases and disorders of the circulatory system (major diagnostic category 05), since this comprises the largest category of overall spending and per‐capita expenditure for well‐defined health conditions. About one in three adults have at least one type of cardiovascular disease, and one of every six healthcare dollars 2 spent annually is on treatment for these diseases. Including the entire population of circulatory system patients provides a comprehensive view of treatment biases across all medical conditions and severity of illness for this patient population. As the reporting of diagnosis codes switched from ICD‐9 to ICD‐10 in quarter 3 of 2015, we used the crosswalk between ICD‐9 and ICD‐10 codes provided on the National Bureau of Economic Research's (NBER) website to ensure that we correctly incorporated diagnoses and procedures associated with cardiac conditions. 3 Second, we focus on differences in care delivery between underinsured (Medi‐Cal) and privately insured patients. We exclude Medicare and uninsured patients from the comparison set because these groups have unique characteristics that make them unsuitable for comparison with underinsured and privately insured patients. Almost everyone in the United States is qualified to receive Medicare after the age of 65, but these patients can also choose to carry private insurance, making it difficult to distinguish between insurance types. On the other hand, uninsured patients can boost a hospital's revenue via independent one‐on‐one negotiations and discounts if they pay in full. Third, our analysis is limited to acute care hospitals. We exclude rehabilitation centers, psychiatric centers, and veteran administration centers as their operations and patient populations are significantly different from those of acute care and specialty hospitals. Our initial sample (before joining with other data sets) comprises 261 hospitals and 675,378 patients.
Variables
Dependent variable (DV)
We operationalize clinical quality outcome using patient readmission. As per CMS guidelines, we use 30‐day readmissions as a metric for clinical quality. This variable has been used in past studies as a key indicator of clinical quality (Anderson et al., 2012; Berry Jaeker & Tucker, 2017; Diwas and Terwiesch, 2012). The OSHPD data set provides a unique patient identifier, which we use to code our readmission variable as 1 if the patient was readmitted within 30 days for any cause after discharge from an acute care hospitalization and 0 if the patient was not readmitted within 30 days. 4 Records with missing patient identifiers were removed before calculating the readmissions measure. The readmission variable calculation is adjusted to account for patient mortality during the 30‐day period. Summary statistics for the variables are provided in Table 2.
Descriptive statistics of variables used in main analysis
Key independent variable (IV)
Our main IV of interest is Insurance, which is a binary variable. As discussed previously, we are interested in examining whether a patient's insurance status leads to differences in treatment intensity. Patients with private insurance are coded as 0, and patients with Medi‐Cal insurance are coded as 1. This variable is available in the OSHPD data set. Summary statistics for the variable are provided in Table 2.
Mediating variable (MV)
Our MV of interest is Treatment Intensity. We construct this variable based on the information on charges available in the OSHPD data set. Hospital charges represent the amount charged for services rendered for care during a patient's stay at the facility, based on the hospital's full established rates before contractual adjustments. Charges include, but are not limited to, daily hospital services, ancillary services, and any patient care services, but exclude hospital‐based physician fees. Prepayments (such as deposits and prepaid admissions) are not deducted from this variable. Charges have been used in the literature to measure treatment intensity (Card et al., 2007). To reduce the impact of outliers on our estimations, we only consider charges between the first and 99th percentile. It is possible that geographic differences in prices may drive the proposed relationships. Accordingly, we adjust our variable by dividing it by the hospital wage index. CMS reports this index yearly in the IPPS database; it is determined based on a formula that considers patient and hospital characteristics, including hospital location and hospital type. 5 It is also possible that inflation in prices may affect the hypothesized relationships, so we correct for inflation 6 in our wage‐adjusted variable. Finally, we take the log transformation of the inflation and wage‐adjusted variable to ensure normality. We report the results using this MV in Section 3.4.2. We also conduct robustness tests using alternate operationalizations of treatment intensity. These are discussed in Supporting Information A4.
Moderators
In what follows, we discuss two moderator variables of interest.
Utilization: This variable represents the busyness of a hospital. Since we have day‐level data on cardiology patients, we capture daily utilization as a ratio of the total number of patients receiving treatment in a hospital's cardiology department on any given day to the maximum number of patients in that department. The denominator is derived from the maximum number of patients that receive treatment in the cardiology department during a given quarter of the year and considers the weekday/weekend effect. Our approach for using patient census data is similar to that used in prior literature (Bell & Redelmeier, 2001; Berry Jaeker & Tucker, 2017; Kuntz et al., 2015). This variable is calculated from the OSHPD data set.
Patient Complexity: This variable represents the comorbidity complexity of a given patient. Decisions regarding treatment options and paths are likely to change as the number and nature of complexities increase. We measure comorbidity complexity using an Elixhauser severity score based on Elixhauser et al. (1998) and Berry Jaeker and Tucker (2017). To compute this score, we first create an index, which is a vector of 30 binary variables, each representing a specific comorbidity, with 1 indicating that the patient has the comorbidity and 0 otherwise. The vector of binary variables is created based on the data available in the California data set. We then compute the Elixhauser severity score by multiplying the index with a vector of weights that represents the severity of each comorbidity, that is, a dot product using the van Walraven et al. (2009) method. Berry Jaeker and Tucker (2017), Elixhauser et al. (1998), and van Walraven et al. (2009) provide a more in‐depth explanation for the Elixhauser severity score metric calculation.
Control variables
We include several control variables in our analysis.
Patient‐level controls. We control for patient demographics and medical conditions as listed below: Age: Age has been consistently shown to be a risk factor associated with treatment intensity and readmission. Older patients are more likely to receive disease screening, counseling, and education services in the management of heart conditions, thereby reducing the incidence of readmission. We measure patient age in years. Gender: Research suggests that female patients are in worse condition when admitted to a hospital for a cardiac condition. They may consequently have to undergo more complex treatment and are more likely to experience postprocedure complications, thereby increasing the risk of readmission. Gender is coded as a binary variable with 0 indicating a male patient and 1 indicating a female patient. Race: Patients who are Black or belong to another non‐White race are more disadvantaged in primary care, leading to greater medical expenditures when they are admitted to a hospital for a cardiac condition as well as potentially greater readmission rates. Race is coded as a binary variable with 0 indicating a White patient and 1 indicating a non‐White patient. DRG fixed effects: Different DRGs represent different resource utilization for a hospital. For example, within cardiac conditions, cardiac catheterization consumes more resources than replacing a pacemaker. DRGs are assigned to patients based on principal and other diagnoses, principal and additional procedures, gender, and discharge status. As the type of DRG may potentially impact outcomes, we include DRG fixed effects in our analysis.
Hospital‐level controls. We control for the following variables at the hospital level: Hospital size: Size is captured as the number of beds and is a measure of the available resources, which can potentially impact hospital processes and outcomes. We collect information on the number of beds from the IPPS files. Health Information Technology (HIT) maturity: The HIT variable represents the number of cardiology information technology systems critical to cardiology patients’ clinical care. We refer to the HIT cardiology technologies used in the past literature (Angst et al., 2011), as is detailed in Supporting Information A1. Information on these technologies is collected from the HIMSS database. As in prior literature (Sharma et al., 2016), “Live and Operational” technologies in the HIMSS database are used to determine maturity. This data set is matched with the OSHPD data set using the hospital's unique CMS identifier. Hospital fixed effects: To account for time‐invariant heterogeneity across hospitals, we use an indicator variable for each hospital.
Market‐level controls. We factor in a key market‐level control: localized competition. Since the current reimbursement system incentivizes value over volume, greater competition forces hospitals to compete on better quality outcomes to improve their market share. Our measure of competition is the Herfindahl–Hirschman Index based on a provider's market share in a given health service area. Information on hospital service areas comes from the Dartmouth Atlas, and the number of hospital‐level discharges comes from the OSHPD data set. Like Wani et al. (2018), we take the negative log transformation to make interpretation easier—smaller values represent monopolistic conditions while larger values indicate greater competition.

where nkt
is the number of total patient discharges from hospital k in hospital service area j in year t, and Njt
is the total number of patient discharges in hospital service area j in year t.
Time controls. We control for the following time‐related variables: Day of the week: Reduced staffing and availability of services may cause delays in receiving appropriate medical interventions and impact patient outcomes. To account for this, we include a day of the week fixed effect. Quarter of admission: Exposure to colder temperatures is likely to trigger a surge in blood pressure and other cardiovascular events, which may result in worse patient outcomes. Accordingly, we add a fixed effect for each quarter of the year. Year: To control for heterogeneity that may occur across years, we use an indicator for each year of our data.
Descriptive statistics and correlations for the key variables of interest are provided in Tables 2 and 3.
Correlations
Note: All correlations are significant at the 0.05% level of significance.
Patient matching
To reduce the magnitude of bias in our results, we conduct our analysis using a CEM procedure (Iacus et al., 2012) on patient data. The CEM procedure is a nonparametric method that can be used to control the effect of pretreatment control variables and reduce the degree of imbalance between the treatment (Medi‐Cal patients) and control (privately insured patients) groups across several control variables. Although both CEM and propensity score matching (PSM) reduce the degree of asymmetry and provide a better balance between the treatment and control groups, a key benefit of using CEM is that it is more robust to measurement error than other techniques (Iacus et al., 2012) and provides the lowest variance and bias in estimates (Wells et al., 2013). Thus, it can help more effectively identify the effect of insurance type on treatment intensity. We use several patient‐level covariates such as age, gender, race, and comorbidity complexity to match patients in the two groups. These covariates account for the demographic and health status of patients at the time of admission. It is also important to control for socioeconomic status (SES), which is typically a combination of education, income, and profession. However, no single measure of SES is universally accepted. Research has shown that patient zip codes can be a viable proxy for patient SES (Link‐Gelles et al., 2016); hence, we include patient zip codes to account for possible differences in socioeconomic conditions. Finally, we also match patients on their medicare severity diagnosis related groups (MS‐DRG) codes to compare the treatment intensity for patients with similar medical conditions. We conduct within‐hospital matching to account for possible differences across hospitals. We use Stata 14 to employ CEM. The matching balance with CEM is provided in Supporting Information A2, which shows that the bias in matching is significantly reduced after CEM, increasing our confidence in the validity of the results. After joining the aforementioned data sets and using this matching procedure, we are left with a total of 530,494 observations from 261 hospitals.
Analyses and results
Figure 1 represents the framework studied in this research. Conceptually, our hypotheses combine a mediation effect, that is, the impact of insurance type (private vs. Medi‐Cal) on readmission through treatment intensity (H2), and a moderation effect from the contingency effect of utilization (H3) and patient complexity (H4) on the mediating process. OLS and logit regression models are used to test the moderated mediation hypotheses. Using the CEM and fixed‐effects model across several patient‐, hospital‐, market‐, and time‐level controls should alleviate concerns about potential endogeneity and omitted variable bias.
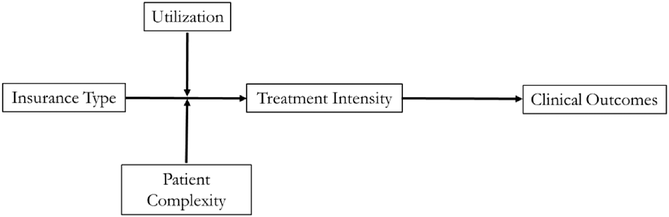
Conceptual model.
Main effect of insurance on clinical quality outcome (H1)
In H1, we proposed that underinsured patients will have worse clinical quality outcomes (as measured by readmission) compared to privately insured patients. Model 2 in Table 4 indicates a significant positive effect of insurance on readmission (Model 2, coefficient = 0.642, p < 0.001). This suggests that underinsured patients are almost twice as likely (exp(0.642)) as privately insured patients to be readmitted within 30 days. Thus, H1 is supported.
Main results for the impact of insurance type on treatment intensity and clinical quality outcomes
Note: Robust standard errors in parentheses.
p < 0.01, **p < 0.05, *p < 0.1.
Mediating effect of treatment intensity (H2)
To test the mediated hypothesis (Hypothesis 2), we use the procedure suggested by Baron and Kenny (1986). The results are reported in Table 4. First, we find a significant negative effect of insurance (IV) on treatment intensity (MV; Model 1, coefficient = −0.065, p < 0.001). Second, we find a significant positive effect of insurance (the IV) on readmission (the DV) without involving treatment intensity (the MV; Model 2, coefficient = 0.642, p < 0.001). Third, we find a significant negative effect of treatment intensity (MV) on readmission (DV; Model 3, coefficient = −0.202, p < 0.001). Finally, in the presence of treatment intensity (MV), the effect of insurance (IV) on readmission (DV) is reduced, though it is still significant and positive (Model 4, coefficient = 0.619, p < 0.001). Taken together, the results suggest that treatment intensity (MV) acts as a partial mediator.
Next, we conducted Sobel's (1982) test to further ascertain whether the mediation relationship holds. The test confirms a significant mediation effect of treatment intensity (p < 0.001). Therefore, the mediation hypothesis (Hypothesis 2) is supported. Model 5 reports the mediation model results as odds ratios. Our results in Model 1 indicate that treatment intensity is lower for underinsured patients by approximately 6.29% (calculated as (1 − exp(−0.065)) × 100). For a hospital that spends an average of $36,680 per patient, this translates to lower treatment intensity for underinsured patients by approximately $2307 (36,680 × 0.0629) compared to privately insured patients. As discussed previously under H1, Model 2 indicates that, without the inclusion of treatment intensity, underinsured patients are almost twice as likely as privately insured patients to be readmitted. Model 3 indicates that a 1% increase in treatment intensity reduces the chance readmission by 0.2%. Finally, we interpret the effect of insurance on readmission mediated by treatment intensity using the log odds reported in Model 5. The results indicate that, in the presence of treatment intensity as a mediator, the impact of insurance on readmission is reduced, with underinsured patients being 1.86 times more likely, on average, to be readmitted as compared to privately insured patients. The indirect effect is equivalent to 3.58% (1 − (0.619/0.642)) of the total effect. 7
Moderating effect of utilization (H3) and patient complexity (H4)
To test our moderating effect hypothesis (Hypothesis 3), treatment intensity was regressed on insurance, utilization, and the interaction (i.e., combined product effect) between insurance and utilization. Similarly, to test our moderating effects hypothesis (Hypothesis 4), treatment intensity was regressed on insurance, patient complexity, and the interaction (i.e., combined product effect) between insurance and patient complexity. We include all control variables used in the mediation analysis. The necessary precondition for moderated mediation analysis is that the interaction effect between the independent and moderator variable is statistically significant. This implies that the magnitude of insurance on treatment intensity varies according to changes in the values of utilization in the case of H3, or patient complexity in the case of H4 (Preacher et al., 2007).
Table 5 provides the results of the moderating effects of utilization and patient complexity. We report a controls‐only model in Model 6 and the main effects of insurance, utilization, and patient complexity in Model 7. The interaction between insurance and utilization is negative and highly significant (Model 8, coefficient = −0.084, p < 0.01), indicating that utilization negatively impacts the relationship between treatment intensity and insurance type. We plot the interactions in Figure 2 at the 25th and 75th percentile values of utilization. This figure illustrates that underinsured patients are worse off under high hospital utilization conditions. When utilization is low, the treatment intensity for underinsured patients is 9.68% lower than for privately insured patients. Under high‐utilization conditions, the gap in treatment intensity for underinsured patients worsens to 14.46% as compared to privately insured patients. Thus, we find support for H3. 8
Moderating effects of utilization and patient complexity and full moderated mediation model
Note: Robust standard errors in parentheses.
p < 0.01, **p < 0.05, *p < 0.1.
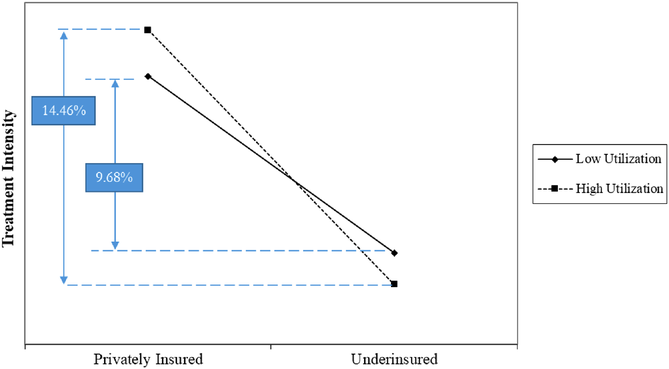
Two‐way interaction plot between utilization and insurance type for treatment intensity.
The interaction between insurance and patient complexity is positive and highly significant (Model 9, coefficient = 0.005, p < 0.01), indicating that patient complexity positively impacts the relationship between treatment intensity and insurance type. We plot the interaction effect using the 25th and 75th percentile values of patient complexity in Figure 3. The graph illustrates that both underinsured and privately insured patients have better treatment intensity when patient complexity is higher. When patient complexity is low, the treatment intensity is lower for underinsured patients by about 13.08% compared to privately insured patients. When patient complexity is high, the gap in treatment intensity between the two groups is reduced to 9.89%. Thus, we find support for H4.
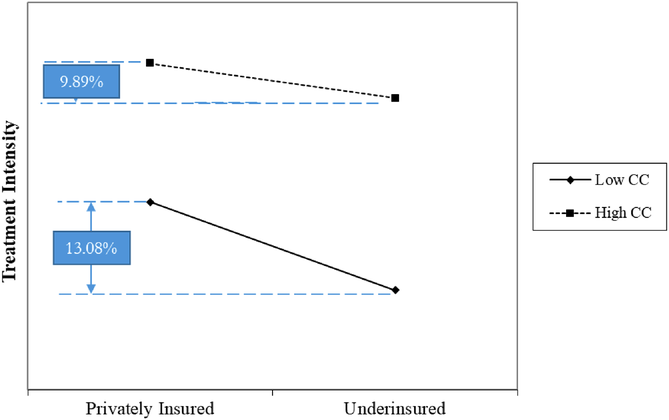
Two‐way interaction plot between patient complexity and insurance type for treatment intensity.
With the basic interaction hypotheses confirmed, and given the moderated mediation nature of our model, we further investigate whether insurance impacts readmission (through treatment intensity) at varying levels of utilization and patient complexity by examining the conditional indirect effect (Preacher et al., 2007). We used a bootstrapping procedure, which generates 1000 subsamples (at the 95% significance level) from the original data set to produce bias‐corrected confidence intervals for hypothesis testing. The advantage of this procedure is that bootstrapping requires no assumptions regarding the shape of the sampling distribution when conducting moderated mediation tests (Hayes, 2015). With this method, we can determine whether the indirect effect of insurance on readmission is different from zero for any level of utilization (or patient complexity) if the bias‐corrected confidence intervals do not contain zero (Preacher et al., 2007). The top half of Table 6 presents the estimates for the conditional indirect effect derived from 1000 bootstrapped samples for low (mean – 1 standard deviation), medium (mean), and high (mean + 1 standard deviation) levels of utilization, respectively. The 95% bootstrapped confidence intervals do not contain zero and indicate that the indirect relationship between insurance type and increased readmission is strengthened at higher levels of utilization. We similarly estimate the conditional indirect effect from 1000 bootstrapped samples for low, medium, and high levels of patient complexity, respectively. Once again, the 95% bootstrapped confidence intervals do not contain zero and indicate that the indirect relationship between insurance type and readmission is weakened at higher levels of patient complexity.
Conditional indirect effect analysis of insurance on readmission as dependent variable
To further increase confidence in our results, we also report a more recently developed index of moderated mediation (IMM), which confirms the moderated mediation results (Hayes, 2015). We determine that the indirect effect of insurance type on readmission is different from zero for any level of utilization (or patient complexity) if the IMM 95% bootstrapped confidence interval does not contain zero. The IMM is significant for utilization (coefficient = 0.0034, standard error = 0.0002, confidence interval = [0.0030, 0.0038]). As reported, the confidence interval does not include zero. Thus, treatment intensity, insurance type, and utilization interactively influence readmission such that insurance type has a stronger indirect positive relationship with readmission when utilization is higher. The IMM is also significant for patient complexity (coefficient = −0.0002, standard error = 0.0000086, confidence interval = [−0.00024, −0.00021]). Once again, the confidence interval does not include zero. Thus, treatment intensity, insurance type, and patient complexity interactively influence readmission such that the indirect relationship between insurance type and readmission is weakened when patient complexity is higher.
Among the control variables, we find that patient demographics impact both treatment intensity and readmission. However, hospital‐level factors (such as size and HIT) and market‐level factors (such as competition) do not impact outcomes. Finally, we conduct several robustness checks to test our proposed relationships. These include alternate operationalizations of the DV and additional patient and market‐level controls and are reported in Supporting Information A4.
DISCUSSION
This research makes several contributions to literature and practice. First, unlike studies in healthcare, which implicitly assume equitable treatment of all patients based on their medical conditions, we demonstrate that clinical quality outcomes vary based on a patient's insurance type. Second, we show that treatment intensity acts as a mediator in the relationship between insurance and clinical quality outcomes. While the assumption of equitable treatment is based on the presumed altruistic motivations of hospitals and the Hippocratic Oath taken by care providers, our findings demonstrate that the desire to maintain sound financials by reducing charity care dominates, even among nonprofit hospitals. Additionally, the identification of treatment intensity as a mediator in the relationship between insurance type and clinical quality outcomes helps clarify the mechanism supporting this relationship, which may also assist in designing actionable interventions for reducing such discrepancies.
Third, our empirical approach addresses multiple challenges associated with accurate estimation of this relationship, including conducting hospital‐level matching of patients, large panel data set, use of multiple operationalizations of treatment intensity, and multiple robustness checks, which enables us to establish a stronger empirical basis and better determine effect sizes for the relationships among our variables of interest. An accurate determination of the effect size is critical to the relevance of this issue. Additionally, an understanding of the extent of differences in clinical quality outcomes based on insurance (which are likely due to intentional differences in treatment intensity) may highlight the seriousness of this issue and the inherent risks to patient health posed by strategies that require systematically providing lower levels of care to certain patients. These results may also encourage healthcare providers to proactively reduce such differences in treatment intensity and/or encourage policymakers to enact legislation to reduce such discrepancies. Specifically, policymakers could consider legislative actions to reduce the burden charity care places on hospitals that treat underinsured patients, tracking and reporting clinical quality outcomes based on different patient populations (including based on insurance), and more stringent penalties on care providers if a particular patient population (e.g., the underinsured) is found to consistently experience more adverse clinical outcomes.
Fourth, we highlight the importance of contextual factors in influencing differences in treatment intensity based on insurance type and, in turn, in clinical quality outcomes. Specifically, excessive workload (a proxy for resource constraints) may further aggravate disparities in treatment intensity. Healthcare administrators can help reduce such differences by managing appropriate resource utilization levels at hospitals. Staffing strategies that impact utilization, such as hiring more full‐time and cross‐trained workers, as well as making optimal use of part‐time resources and stepdown units for patient transfers, and so forth, may help reduce these differences in treatment intensity based on insurance type. Furthermore, patient complexity (a proxy for uncertainty in devising a treatment plan) reduces differences in treatment intensity. Although patient complexity is not an operational lever, it improves our understanding of the phenomenon by highlighting that, as uncertainty in patient condition increases, the incentives of agents (hospitals) to provide different levels of care based on insurance type decrease, as those agents are evaluated on clinical quality outcomes. This aligns well with the principal–agent lens used to explain this phenomenon, thus increasing confidence in the explanatory power of the lens for this context as well as the robustness of our findings in support of the hypothesis. Overall, these contextual factors help us better understand the driving forces behind differences in treatment intensity based on insurance type, guiding both practitioners and policymakers toward operational levers that can be used to reduce such differences and, in turn, improve clinical quality outcomes.
We also demonstrate the application of agency theory to a setting where the agent's motivations are beyond commensurate financial benefits for their services. Although studies have discussed principal–agent relationships in nonprofit settings (Steinberg, 2010; Van Puyvelde et al., 2012), work in this area is scarce. Specifically, in the nonprofit healthcare sector, providers are ostensibly driven by altruistic motivations to provide care for underinsured patients. We demonstrate that, even in these settings, financial motivations start to play a dominant role over altruistic motivations after a certain number of losses are realized. Thus, even for nonprofits, sustainable business operations are a key motivator influencing agent behavior. This provides a new application for the principal–agent theory, which has primarily been applied to for‐profit settings.
LIMITATIONS AND CONCLUSION
We acknowledge the following limitations in our study. First, our analysis is based on a single state and 7 years of data. California is regarded as one of the more progressive states in terms of legislation and has a higher GDP per capita and population density compared to the U.S. population as a whole. This may limit the generalizability of our results. At the same time, our matching approach should balance some of the unique demographic characteristics of California. Further, a significant relationship in California, a progressive state, may indicate that these relationships are likely to be even more significant in other less progressive, more resource‐constrained states. Thus, our results might underestimate the magnitude of the identified relationships. Second, our analysis is restricted to patients with circulatory system ailments. The identified relationships and their strength may well change for patients with other conditions. However, patients with circulatory ailments form an important population on their own, given that almost one in three Americans suffer from at least one circulatory ailment and the expenditure involved in the treatment of such conditions is the highest on a per‐capita basis. Third, we use the log of adjusted charges to capture treatment intensity. Although charges have been used as a proxy for treatment intensity in several studies, we acknowledge that there may be other measures, like specific clinical procedures, that may better capture treatment intensity, and we thus recognize this as a limitation of our study. However, the use of specific procedures could also limit generalizability. Fourth, we acknowledge that, although private insurance generally provides more coverage, there are private insurance plans that could also result in underinsurance with high deductibles and reduced coverage. However, we do not anticipate that this would alter our results, as most individuals carrying a high‐deductible insurance plan (HDIP) supplement it with a health savings account (HSA)—approximately 66.6% based on Kullgren et al. (2020). Furthermore, majority of individuals carrying an HDIP plan are younger and healthier, which lowers their likelihood of having cardiac conditions. Finally, we acknowledge limitations in our estimation approach. Although we have addressed biases in our data set through matching and testing for endogeneity, other potential biases in our data set may alter our results. That being said, given the strong theoretical justifications for our hypotheses and consistency across multiple robustness checks, we are confident in our findings. We urge future researchers to address these limitations and further extend this important research stream.
Overall, this study offers important insights for both theory and practice. We find evidence of differences in treatment intensity between underinsured and privately insured patients. A large number of studies in operations assume equitable care and altruistic motivations for care providers. We demonstrate that, in fact, financial motivations dominate altruistic ones. We also quantify the magnitude of these differences in treatment intensity and establish the role of treatment intensity as a mediator in the relationship between a patient's insurance type and their clinical quality outcomes. Specifically, we find that improvements in treatment intensity reduce readmission rates, indicating that differences in treatment intensity between privately insured and underinsured patients could have serious implications for treatment effectiveness. This result highlights the seriousness of the issue and the urgency of addressing it. We also find that differences in treatment intensity are reduced as the resource utilization (workload) of hospitals decreases and patient complexity increases. Hospital executives should thus take an in‐depth look at existing processes and explore redesigns that may help overcome biases in treatment, particularly under conditions of high utilization and patient complexity.
Footnotes
1
2
3
4
We ran our analysis with 30‐day same cause readmission and our results are consistent.
5
6
7
Although our effect size may seem small, it has been suggested that the presence of a mediating effect is more important than its magnitude. Achieving a large effect size may be indicative of a flawed methodology or research design that violates basic assumptions of causal mediation such as temporal order and direction of variables or that it does not incorporate appropriate control variables (Walters, ![]() )
)
8
A statistical test of the endpoints in ![]() reveals that for privately insured patients, there is no significant difference in treatment intensity as utilization goes from low to high (coefficient = 0.011, p > 0.1), indicating that utilization does not have an impact on treatment intensity of privately insured patients. However, in case of under insured patients, we find a significant difference in treatment intensity as utilization goes from low to high (coefficient = −0.04, p < 0.01). Thus, utilization has a negative impact on the treatment intensity of underinsured patients, which results in a widening gap in treatment intensity between patients with private and Medicaid insurance.
reveals that for privately insured patients, there is no significant difference in treatment intensity as utilization goes from low to high (coefficient = 0.011, p > 0.1), indicating that utilization does not have an impact on treatment intensity of privately insured patients. However, in case of under insured patients, we find a significant difference in treatment intensity as utilization goes from low to high (coefficient = −0.04, p < 0.01). Thus, utilization has a negative impact on the treatment intensity of underinsured patients, which results in a widening gap in treatment intensity between patients with private and Medicaid insurance.
References
Supplementary Material
Please find the following supplemental material available below.
For Open Access articles published under a Creative Commons License, all supplemental material carries the same license as the article it is associated with.
For non-Open Access articles published, all supplemental material carries a non-exclusive license, and permission requests for re-use of supplemental material or any part of supplemental material shall be sent directly to the copyright owner as specified in the copyright notice associated with the article.