
Abstract
We study the product design problem where a decision maker selects the features of a product from a set of feasible options. We focus on two widely studied objectives in this field, that is, the share of choice (SOC) and buyers' welfare (BW). The two objectives are vulnerable to different types of customer preference misspecification, that is, deviation from the nominal utility distribution and effects of outliers, respectively. We formulate a distributionally robust optimization (DRO) SOC maximization model and a winsorized BW maximization model to obtain robust solutions to the two problems. Interestingly, we show that the two robust models are equivalent in a certain sense—for appropriate choices of robustness parameters, both models return the same solution. This observation has important ramifications. For instance, it indicates that a product designed to yield higher BW is more robust to the deviation from the nominal utility distribution for the SOC problem, while that with higher SOC is less sensitive to the effect of outliers for the BW problem. Last but not least, we use the equivalence to develop a new approach to solve the DRO model for the SOC problem, using a version of the winsorized BW model. Extensive numerical experiments demonstrate the superior performance of the proposed approach.
Keywords
INTRODUCTION
Companies often rely on product strategy to gain prominence in selected markets (Xia et al., 2016). Failure to design a good product often causes firms to suffer direct financial losses and indirect damages to reputation (Wang & Curry, 2012). To select the “right” product, decision makers must clearly understand customer preferences that influence choices for alternative products. Conjoint analysis (CA) 1 is a common technique often used to elicit customer preference (measured by utility values) from a representative sample of the population. Since the publication of Zufryden (1977), extensive prescriptive models based on CA have been established in both operation research and the marketing field (Bertsimas & Mišić, 2016; Green & Krieger, 1985; Jiao & Zhang, 2005; Kohli & Sukumar, 1990; Shi et al., 2001). Depending on the number of products, the models are divided into single‐product design, or product‐line design (multiple products are designed simultaneously) (Shi et al., 2001). Our paper first focuses on the single‐product design problem for ease of exposition, and provides extensions to the product‐line design problem in the Supporting Information (EC.1.2).
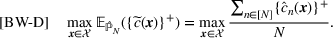
The share‐of‐choice (SOC) problem is one of the most widely studied problems in the literature (Camm et al., 2006; Kohli & Sukumar, 1990; Shi et al., 2001; Wang et al., 2009; Wang & Curry, 2012; Wang & Gutierrez, 2022). The problem aims to find a product that maximizes SOC, that is, the percentage of customers for whom the offered product delivers higher utility than the outside options, using the point estimation of individual partworth (utility values) attached to each feature (estimated from CA) for the representative sample of the population (Balakrishnan & Jacob, 1996; Balakrishnan et al., 2004; Kohli & Sukumar, 1990; Shi et al., 2001). The implicit assumption under the above approach is that the partworths are estimated accurately, and their distribution over the sample represents the entire population.
However, the partworths are often not measured precisely for two reasons. First, it is hard to get an accurate point estimation of partworth at the individual level, due to the limited range of questions in the CA survey (Wang & Gutierrez, 2022) and the limitations of estimation techniques (e.g., the hierarchical Bayesian method provides only a posterior distribution instead of a point estimator for the utility of each customer; Allenby & Rossi, 1998). On average, the hit rate of customer choice based on CA data is only 75%–85% (Johnson & Orme, 2010). Second, because only a subset of the entire population is included in the CA (Bertsimas & Mišić, 2016), the well‐known optimizer's curse (Smith & Winkler, 2006) holds if we optimize the objective over the sample distribution. This phenomenon has actually been observed in previous product design literature (Schön, 2010a).
Recently, several papers studying the SOC problem focus on customer preference uncertainty. Camm et al. (2006) and Wang et al. (2009) solved the classical model multiple times (via sampling) and use the majority vote to choose a robust solution. Wang and Curry (2012) and Wang and Gutierrez (2022) applied different robust frameworks to find robust solutions during the optimization phase. In the two studies, robustness is obtained by allowing the “true” partworth of each feature to vary in an “uncertainty set” around the nominal value, and the product with the best worst‐case performance is selected. All the literature showed the superior performance of the robust solutions, which supports the necessity of incorporating robustness against customer preference uncertainty in the SOC problem.
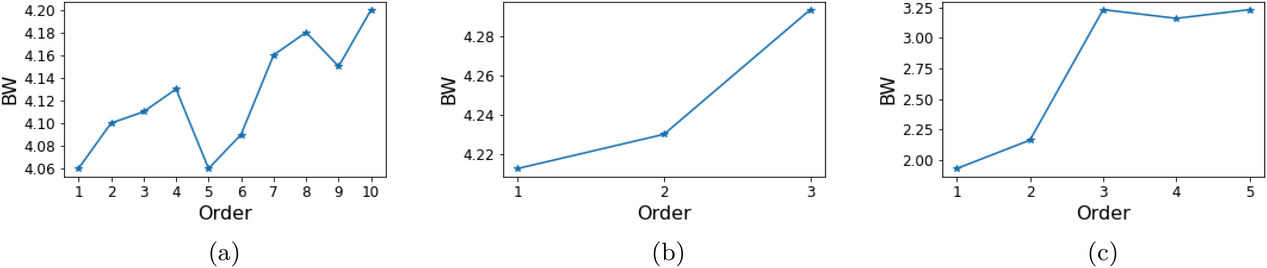
Camm et al. (2006), Wang et al. (2009), and Wang and Curry (2012) reported the detailed specification of the solutions with different extents of robustness. The data are publicly available, which allows us to evaluate the performance of the robust solutions. In Figure 1, we compare the buyer's welfare (BW) metric, which is another widely studied objective, among the solutions with different levels of robustness. BW refers to the summation of utility surplus generated due to customers choosing the offered product over the population (Balakrishnan & Jacob, 1996; Balakrishnan et al., 2004; Green & Krieger, 1985). For the solutions in these studies, we arrange them in ascending order of the extents of robustness (in Camm et al., 2006; Wang et al., 2009, the extent of robustness is indicated by the frequency of the solution to be optimal in the robustness test; in Wang & Curry, 2012, the extent of robustness is measured by the range of value that partworth can vary); that is, the solutions on the right‐hand side of each figure are supposedly more robust compared to those on the left‐hand side of the same figure. Surprisingly, in Figure 1, all the results indicate that a more robust solution usually attains higher BW. This raises the following question: Is the positive correlation between BW and the robustness of the SOC problem a fundamental phenomenon or merely a coincidence? We answer this fundamental question in the paper.
In many cases, the trade‐off between SOC and BW is of great importance. Three concrete examples are provided for a better understanding of the importance of the trade‐off. The SOC model is appropriate for a mass‐market product for which sales are more important. In contrast, the BW problem suits a niche‐market product that aims to provide high perceived prestige to customers. Masstige is an emerging kind of product located between the two types of products. The masstige products focus on a broader customer group (larger SOC) than its niche‐market competitors while having a higher perceived prestige (larger BW) than the mass‐market ones (Truong et al., 2009). For example, Coach is a company that provides masstige products. The company positions its leather goods between the traditional luxury goods, such as Gucci, and the mass‐market goods, such as Mossimo at Target (Silverstein & Fiske, 2003). A good trade‐off between SOC and BW can help companies position their masstige products better.
Consider a township planning to build a new library. Suppose that the residents can still use the current library, and there are three feasible, new alternatives (differing in the collection, number of books, and video services, etc.). Suppose there are five segments in the market, with relative sizes and utility as shown in Table 1. Like many decisions in the public sector, decision makers care about both social benefit (measured by BW) and the percentage of people who benefited from the new alternative (measured by SOC). If BW is applied as a single criterion, the township should choose option A. However, less than one‐half of the population will be better off with A. Option B, on the other hand, maximizes SOC, but sacrifices a large portion of social benefits. In this case, option C might be a better choice because it makes a good trade‐off between the two objectives. Town library design, Gupta & Kohli, 1990
The market share profit trade‐off is key to product design choices in many industries. For example, Li et al. (2019) noted that “at Intel, for example, senior management constantly shifts discussion between profit maximization and market share expansion. On the one hand, the profit‐maximizing pricing solution may not meet the firm's ambition on market share; on the other hand, the market share‐maximizing prices reduce profit margins to nil, which is also far from ideal.” As BW indicates the social surplus left in the market, the trade‐off between market share and profit is also partly determined by the trade‐off between SOC and BW. Profit‐market share trade‐off in Intel
Detail utility of the town library design example, Gupta and Kohli (1990)
Detail utility of the town library design example, Gupta and Kohli (1990)
The current library (status quo).
To answer the research question, we propose a distributionally robust optimization (DRO) model for SOC maximization using an uncertainty set based on Wasserstein distance, and another BW maximization model based on the notion of winsorization, that is, truncating the outliers (abnormally high values) at a certain threshold, so that the aggregate BW calculation will not be heavily influenced by some abnormal values. The former provides robustness against distributional deviation of customers' utility for SOC maximization, and the latter provides robustness against outliers for BW maximization. Our analysis of the two models yields the following important insights:
The remainder of this paper is organized as follows. Section 2 reviews previous literature. Section 3 provides a formal statement of the SOC and BW problems and a discussion on the necessity of the robustness and trade‐off between the two objectives. Section 4 proposes the DRO model of SOC maximization and the winsorized BW model. Section 5 presents the analytical results. Section 6 presents numerical experiments with synthetic and real‐life data. Finally, conclusions and future research directions are outlined in Section 7. For the briefness of reading, we furnish all the proofs in the Supporting Information (EC.3).
Throughout the paper, scalar values are denoted by the standard letter x. Vectors are denoted by the bold letter 


LITERATURE REVIEW
The classical product design models proposed in the literature can be divided into first‐choice or probabilistic‐choice models. The first‐choice model assumes that the individual customers deterministically choose their most preferred product with the highest utility (Belloni et al., 2008; Camm et al., 2006; Wang et al., 2009). The choices of individual customers are aggregated to calculate objectives in an empirical risk optimization way; that is, sample statistics of objectives are applied to evaluating products. The main focal point of these papers is computational efficiency. For example, Bertsimas and Mišić (2019) provided a novel mixed‐integer optimization formulation for the first‐choice product design model and show that the formulation is stronger than the classic formulations in Belloni et al. (2008) and McBride and Zufryden (1988). In contrast, the probabilistic choice model considers a random choice, where the probability is a prespecified function of utility. Given the choice probability, the expectation of objectives can be calculated. Probabilistic choice models with different prespecified functions are applied in previous literature, such as the multinomial logit model (Chen & Hausman, 2000), the share‐of‐surplus model (Kraus & Yano, 2003), and the general attraction model (Schön, 2010a, 2010b). The first‐choice model is the most widely used in product (line) design literature. Our model extends the first‐choice model by a Wasserstein DRO approach.
Both first and probabilistic choice models assume that the utility and choice probabilities can be estimated precisely. However, estimation errors in the utilities and the probabilities are inevitable in practice (Bertsimas & Mišić, 2016; Wang & Gutierrez, 2022). Therefore, some researchers studied how to offer robustness against uncertainty in utility. Camm et al. (2006) repeatedly solved the classic models and selected the most frequently occurring solutions as the robust ones for the single‐product SOC problem. Belloni et al. (2008) implemented a similar procedure in a revenue‐maximizing product‐line design problem to test the robustness of solutions obtained by different solving approaches. Wang et al. (2009) conducted a similar robustness test for the SOC product‐line design problem.
Although emphasizing the importance of customer preference uncertainty, these studies do not explicitly model the uncertainty. Recent papers paid attention to robust models for the product design problem (Bertsimas & Mišić, 2016; Wang & Curry, 2012; Wang & Gutierrez, 2022). Bertsimas and Mišić (2016) proposed a robust revenue‐maximizing product‐line design model, which maximizes the worst‐case revenue over a structural uncertainty set containing choice models with different types and parameters. The above paper differs from our paper in two aspects. First, the model focuses on selecting the products from a prespecified candidate set while our model builds the products by combining multiple attributes. Second, their model focuses more on the probabilistic choice model while our model extends the first‐choice model. Compared to Bertsimas and Mišić (2016), Wang and Curry (2012) and Wang and Gutierrez (2022) are more closely related to our paper because both their models are based on the first‐choice model and maximize the SOC. As shown in Section 6.1.3, both their models can be nested into the same max–min framework as ours. The major difference between the two papers and ours is the uncertainty sets adopted. Specifically, Wang and Curry (2012) maximized the worst‐case SOC with an event‐wise uncertainty set proposed by Chen et al. (2020) while Wang and Gutierrez (2022) maximized the worst‐case SOC with scenario‐based uncertainty set.
Moreover, our paper distinguishes itself by showing the relationship between robustness against customer preference uncertainty for the SOC problem and another widely studied objective, that is, BW (Balakrishnan & Jacob, 1996; Green & Krieger, 1985; Kohli & Sukumar, 1990). The result is general. It enhances the insights from the numerical results obtained in Camm et al. (2006) and Wang et al. (2009) and holds for the model proposed by Wang and Curry (2012) and Wang and Gutierrez (2022) as we will show by the numerical experiments.
PROBLEM STATEMENT
We extend the conventional product design problem based on the first‐choice model, which is widely studied in previous literature (Balakrishnan & Jacob, 1996; Camm et al., 2006; Kohli & Sukumar, 1990; Shi et al., 2001; Wang & Curry, 2012). We provide the problem statement, benchmark models, and a discussion on the disadvantages of the benchmark models in this section.
First choice based framework
Although different in the objectives, the product design frameworks based on the first‐choice model have threefold primitives.


Benchmark models
Based on the primitives, previous scholars have proposed several prescriptive models to find a product 

We focus on two widely studied objectives, that is, SOC and BW (Balakrishnan & Jacob, 1996; Camm et al., 2006; Green & Krieger, 1985; Kohli & Sukumar, 1990; Shi et al., 2001). The former is the percentage of buyers, while the latter represents the total surplus collected by all buyers.
Generally, the decision makers aim to maximize the managerial objectives over the entire customer population. However, in practice, it is impossible to obtain information about the entire population. A straightforward way to overcome this difficulty is to maximize the objective over a sample of representative customers instead. Let


Note that the formulations provided in the main text are to show the relationship among the models. The mixed‐integer linear programming (MILP) reformulations of the models are presented in the Supporting Information (EC.1.4) for computation. Readers may find that the formulations above are slightly different from those proposed in previous literature. We discuss the equivalence between the formulations and previous formulations in the Supporting Information (EC.1.3).
Issues with the benchmark models
This section provides a simple example to illustrate the drawbacks of models SOC‐D and BW‐D. Consider a problem where decision makers need to select one product from a product set The rows under the case of “Observed” report the observed surplus of the three products for the five customers. According to observed consumer surplus, model SOC‐D selects product a while model BW‐D chooses product c. These two products are “extreme” because product a has a very small average BW (0.1), whereas product c has the lowest SOC (0.2). The example illustrates the drawback of solely considering SOC and BW, which has already been discussed in Gupta and Kohli (1990). Product b is a more desirable product for decision makers who care about both objectives and hope to strike a balance between the two objectives. The fourth to ninth rows are used to show the vulnerability of SOC and BW maximizers to different types of customer preference uncertainty. The SOC maximizer, product a in this case, is vulnerable to distributional deviation in the consumer surplus. In the “Deviate” case, where the ground truth surplus deviates downward uniformly by 0.2 from the observed cases, the SOC of product a is reduced to 0. The BW maximizer, product c, is sensitive to what is known as outliers in statistics (Grubbs, 1969; Maddala, 1992). As shown in the “Outlier” case, both the BW and SOC of product c are reduced to 0 when customer 1 drops out. Because product b shows greater robustness in both “Deviate” and “Outlier” cases, it may be preferred by the decision makers.
Specific data for Example 1
To address the impact of customer preference uncertainty, we propose a DRO model for the SOC problem and a winsorized model for the BW problem in Section 4. Analytical results in Section 5 show that product b is selected by both models when the parameters are set properly. Therefore, the results indicate that both models are capable of providing robustness against both “Deviate” and “Outlier” cases, which is closely related to the trade‐off between SOC and BW.
MODEL FORMULATION
The DRO counterpart for model SOC‐D
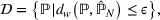
As shown in the “Deviate” case in Example 2, model SOC‐D is vulnerable to a distributional deviation between the empirical and true distributions. The Wasserstein DRO framework is one of the most popular frameworks to offer robustness against such deviation and has many desirable properties (Esfahani & Kuhn, 2018; Kuhn et al., 2019). We adopt this framework to the SOC problem; that is, we maximize the worst‐case SOC in a Wasserstein uncertainty set. The set is centered at the empirical distribution and contains all the distributions that deviate from the empirical distribution by Wasserstein distance of no more than a given threshold. The Wasserstein distance is defined as follows.


Accordingly, the uncertainty set is then defined as


Note that although we maximize the worst‐case SOC here, our target is to provide a statistical guarantee to the SOC under the true distribution. Many results on how to adjust ε to achieve a desirable guarantee can be found in previous literature (Esfahani & Kuhn, 2018; Zhao & Guan, 2018). Furthermore, the framework is flexible enough to reflect decision makers' different attitudes toward uncertainty. The conservatism of model SOC‐DRO increases in ε. Therefore, a designer who believes that the partworth utilities fully reflect the preference of the customer population can apply the model with 
Winsorized BW model
The “Outlier” case in Example 2 shows that the BW maximization is sensitive to a customer with an extremely high consumer surplus, which is known as outliers in statistics. Winsorization is a common statistic technique to deal with outliers, which replaces the extreme values with a prespecific value. The technique is applied in many fields, such as finance (Berg‐Jacobsen & Tran, 2021; Khan & Fahim, 2021), biometrics (Lan et al., 2022; Li et al., 2021), and psychology (Anderson et al., 2022; Sales et al., 2021), and is commonly incorporated the mainstream statistic software like SPSS,
2
STATA,
3
and scipy
4
package for Python. In this paper, we adopt this technique to formulate a winsorized BW maximization model as follows:
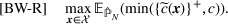
Intuitively speaking, the practical idea behind model BW‐R is to forbid the phenomenon—“the squeaky wheel gets the grease.” An upper limit of c is a threshold to distinguish between ordinary and extremely high consumer surplus. With this term, no matter how high the consumer surplus a customer has, his surplus is winsorized to c.
This framework is also flexible to decision makers with different attitudes toward uncertainty. As c decreases, the winsorized BW model is less sensitive to outliers because customers with a higher consumer surplus than c contribute less to the objective function. With a large enough c, the BW model is equivalent to the classic BW model.
ANALYTIC RESULTS
In this section, we provide the condition where models SOC‐DRO and BW‐R are equivalent. Motivated by the equivalence, we show how the models achieve a trade‐off between SOC and BW and develop an approach to get the optimal solution of the proposed SCO‐DRO model with lower complexity.
The relationship between models SOC‐RDRO and BW‐R
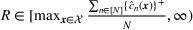
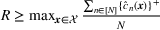
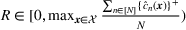
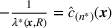
As a foundation of this section, we first present a tractable reformulation of model SOC‐DRO:
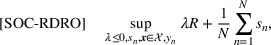


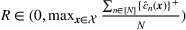
As shown in Definition 1 and Equation (5), there are two parameters, distance ε and norm p, to control the extent of the robustness of model SOC‐RDRO. Model SOC‐RDRO indicates that the influence of the two parameters can be synthesized by a single metric R, which makes it easy to compare the extent of the robustness of models SOC‐RDRO using different parameters. Therefore, we investigate the effect of R instead of that of ε and p independently in the rest of this paper. Note that R increases in both ε and p, and therefore a large R indicates a more conservative model SOC‐RDRO.
The core of the difference between models SOC‐RDRO and SOC‐D is the introduction of dual variable λ. When 


Comparison between

For 


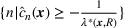
Let Models SOC‐RDRO and BW‐R share the same optimizer, when


Note that 


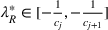
Another keynote is that for R close enough to The optimal solution of model SOC‐RDRO with 


Furthermore, we illustrate the monotonicity of


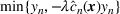
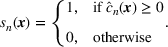
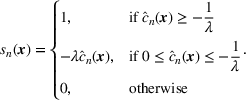
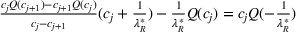
According to Proposition 2, The difference between (12) and (13) indicates not only the relationship between models SOC‐RDRO and BW‐R but also a different classification scheme compared to that under model SOC‐D. As shown in Figure 2, the new scheme further classifies the original buyers into two types. An intuitive probabilistic explanation of the scheme is that the buyers with surpluses lower than a threshold will purchase the offered product with a probability proportional to the scale of their surplus. This indicates that the underlying choice model of model SOC‐RDRO is more flexible than the first‐choice model under the classic SOC model, which cannot characterize probabilistic choice. With the probabilistic choice modeling, the new scheme can overcome two technical difficulties in the classic SOC model. The first difficulty is the classification of customer with 


Trade‐off between SOC and BW
As we illustrated in the last section, model SOC‐RDRO with R equal or close enough to 0 and 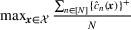
Figure 3 illustrates the trade‐off observed in a numerical instance. The figure shows that model SOC‐RDRO selects the same products as models SOC‐D and BW‐D when the degree of conservatism is least and highest; as R increases, the BW of the selected product becomes higher while the corresponding SOC decreases.
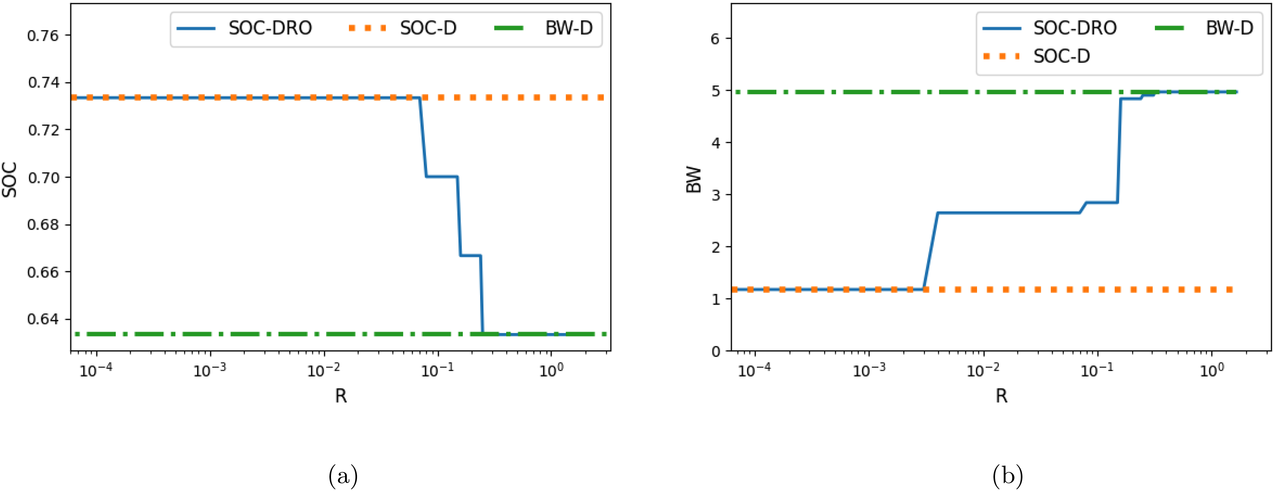
Relationship between models SOC‐D, BW‐D, and the proposed DRO model: (a) SOC comparison and (b) BW comparison
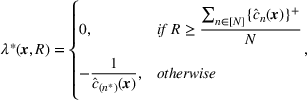
The trade‐off is due to the selection of λ. For the case of For model SOC‐RDRO with 


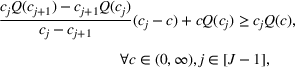
Proposition 3 shows that given Consider a product 


Data for Example 5
Proposition 3 shows a twofold influence of R on selecting the optimal solution.
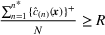
First, model SOC‐RDRO requires the BW of the selected product to exceed R. For given When 


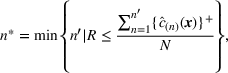
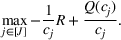
Second, model SOC‐RDRO maximizes the percentage of a smaller subset of buyers as R increases. The following proposition shows that instead of maximizing the percentage of buyers, model SOC‐RDRO maximizes the percentage of buyers with consumer surplus higher than


Recall that as shown in Proposition 3, 


To synthesize, as R increases, model SOC‐RDRO puts a higher lower bound on the BW of the selected product while focusing on a smaller subset of buyers, which leads to the trade‐off between SOC and BW as shown in Figure 3. Thus, the proposed model can help practitioners make a better trade‐off between the two objectives. For example, for the design of a masstige product as illustrated in Example 1, our model can provide several recommendations with different trade‐off positions between the two objectives. As the robust parameter R increases from 0 to ∞, the recommendation gradually turns from a mass product to a product that focuses on a smaller range of customers with high surplus value. Then, the practitioners can find their sweet spot between sales and perceived prestige from the recommendations according to their preferences. Furthermore, the trade‐off also guides a decision maker with a single objective. For a decision maker who aims to maximize SOC and wants to hedge against a greater degree of customer preference uncertainty, she/he should select a product with higher BW; similarly, for a decision maker who wants to release the sensitivity against outliers and maximize BW, she/he should search for a product with higher SOC.
An approach to solve model SOC‐RDRO
Although the product design is a long‐term decision, computational efficiency is of great importance when involving robustness. In practice, it is necessary to find the “proper” robust parameter R or a set of candidates with different extents of robustness to practitioners for further selection. This requires repeating solving model SOC‐RDRO with different R for an extensive number of times. Furthermore, it is prudent to apply cross‐validation to further validate the performance of the models with different R (Esfahani & Kuhn, 2018), that is, for a given R, model SOC‐RDRO needs to be solved multiple times with different samples. Therefore, model SOC‐RDRO may be solved thousands of times to get a satisfying recommendation for the practitioners.
As model BW‐R is easier to solve compared to model SOC‐RDRO, the equivalence between the two models indicates an approach to enhance the computational efficiency, that is, getting the optimal solution of the model SOC‐RDRO through solving model BW‐R. The computational advantages of model BW‐R are twofold.


Comparison of the scale of the models
However, we cannot directly replace model SOC‐RDRO with model BW‐R. On the one hand, the equivalence between models SOC‐RDRO and BW‐R holds only with the condition 


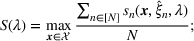
In the following, we show how to pick the optimal solutions for models SOC‐RDRO with different R from those of models BW‐R with different c. First, Proposition 5 shows the feature that distinguishes the optimal solutions of model SOC‐RDRO from other optimal solutions of model BW‐R. Let For any ordered sequence, there exists for any 


Condition (17) indicates that the curve connecting solving model BW‐R with different finding upper concave piecewise linear envelop of the curve that plots collecting the corresponding solutions of the intersections.


Applying concave piecewise linear envelop of


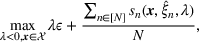
After finding The DRO models of many problems have the reformulation in the following format:
Note that solving model BW‐R is equivalent to solving model SOC‐RDRO with λ given in advance. The proof of Proposition 5 does not require properties specific to models SOC‐RDRO and BW‐R. As such, following the same idea, we can apply the following problem to get the optimal solution of problem (19):


NUMERICAL EXPERIMENTS
We implemented extensive numerical experiments based on simulated and real‐life data to validate the effectiveness of the proposed models. Our numerical experiments mimic the product design procedure in practice, namely, draw sample customers from a population and collect their utilities; establish models to select the “optimal” products; launch the product to market and observe its market performance.
In steps (b) and (c), BW and SOC are calculated in‐sample (with respect to the sample) and out of sample (with respect to oracle distribution or testing samples) to evaluate the market performance, respectively. We denote the in‐sample and out‐of‐sample BW and SOC as 


Simulated experiments
We generate simulated data based on a CA case for a new camera design composed of 8 attributes and 18 levels, whose partworth follows a multivariate normal distribution. The detail of the case is reported in Gilbride and Allenby (2004). We provide the mean vector and covariance matrix of the multivariate normal distribution in the Supporting Information (EC.2.1) for the convenience of reference. Following Camm et al. (2006), we simulate hurdle utility by fixing a benchmark product. We draw samples from the oracle distribution to establish the models. One hundred instances were generated for each sample size 
Performance comparison across model SOC‐RDRO with different extents of robustness
This section presents the in‐sample and out‐of‐sample metrics to show the benefits of offering robustness to the SOC problem. Figure 5 plots the mean of the metrics (lines) and the tube between the 20th and 80th quantile of out‐of‐sample metrics (shaded regions) against R. In Figure 5, the leftmost node of the horizontal axis corresponds to model SOC‐D (model SOC‐RDRO with 

In‐sample and out‐of‐sample SOC (left axis, solid line, and blue shaded region) and BW (right axis, dashed line, and green‐shaded region) with different sample sizes: (a)


The in‐sample metrics reflect that the trade‐off between SOC and BW is achieved through adjusting R. Note that the deterioration at the right‐hand side of each figure is because R is over its upper limit. Before the deterioration, as R increases,


Furthermore, we observe better predictability of 


Benefit of directly solving model BW‐R
In this section, we solve the same instances through model BW‐R and compare the results with those obtained by solving model SOC‐RDRO.
First, we compare the in‐sample and out‐of‐sample metrics to show the stable convergence of model BW‐R. As the comparison results are similar, we exemplify them only by 

Comparison of in‐sample and out‐of‐sample SOC (left axis, solid line, and blue‐shaded region) and BW (right axis, dashed line, and green‐shaded area) between models BW‐R and SOC‐RDRO with
Second, we show the computational efficiency improved by model BW‐R. The comparison is implemented for both solving the model with off‐the‐shelf solvers (exemplified by Cplex 12.8.0) and enumeration‐based algorithm (exemplified by a branch‐and‐bound algorithm modified from Camm et al., 2006, the detail of which is shown in the Supporting Information, EC.2.2). The computation is terminated with a time limit of 3600 s.
Figure 7 presents the average computational time of solving model SOC‐RDRO with different R (solid line) and BW‐R with different c (dashed lines), where the color indicates different sample sizes. As shown in the figure, the computational time of solving model BW‐R with both Cplex and the branch‐and‐bound algorithm is significantly less than that of solving model SOC‐RDRO. For example, the computational time of solving model SOC‐RDRO with 

Computational time of Cplex (

Compared to previous robust models
To our best knowledge, Wang and Curry (2012) and Wang and Gutierrez (2022) are the only two studies that propose robust models of the SOC problem. Both models proposed by Wang and Curry (2012) and Wang and Gutierrez (2022) can be reformulated to the same max–min framework shown in formula (6) with different uncertainty sets as follows. The models proposed in Wang and Curry (2012) can be reformulated as a max–min model with an event‐wise uncertainty set (Chen et al., 2020) as follows:
The model proposed in Wang and Gutierrez (2022) is a max–min model with a scenario‐based uncertainty set; that is, the set contains a finite number of possible distributions. Specifically,


We resolve the same instances in previous sections with 


The generality of the finding inspires us to apply a heuristic way to achieve robustness, that is, a weighted model of SOC and BW maximization, which is shown as follows:

Case study
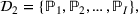
In this section, we validate the effectiveness of the proposed model through an empirical dataset. The case is a CA for a credit card design. Table 5 presents the attributes and candidate levels considered in the CA. A total of 946 customers were sampled, and each of them was presented with 13–17 paired comparisons between two credit card designs. The detail of the response data is available in the R package bayesm. 5
Attributes and levels for the credit card design
A hierarchical Bayesian approach was applied to estimate the partworth utilities for each customer. The partworth utility of the first level of each attribute is regularized to 0, and the empirical distributions of the partworth utility of the rest levels are shown in Figure 9. We divide the 946 samples into training (the first 630 samples), validation (the next 100 samples), and test sets (the last 216 samples). Different sizes of samples are randomly drawn from the training set to establish models SOC‐D, and SOC‐RDRO with different R, and BW‐D. And then, we implement cross‐validation on the validation set to get a proper R for model SOC‐RDRO. Finally, we calculate the out‐of‐sample metrics of the models over the test set. We implement a comparison among the established models. A benchmark to evaluate the quality of the solutions is the maximal 

Partworth utilities of the nonbenchmark levels
Figure 10 plots the out‐of‐sample metrics of models SOC‐D, SOC‐RDRO, BW‐D, and the clairvoyant ones. As shown in the figure, both models BW‐D and SOC‐RDRO improve 


Out‐of‐sample metrics of the credit line design case: (a)

CONCLUSIONS
This paper proposes two models for the product design problem. One is a DRO model of SOC maximization, and the other is a winsorized model for BW maximization. Our key finding is the equivalence between the two models when robust parameters are set properly. The equivalence motivates other main results of the paper. First, the equivalence explains the phenomenon we observed from the solutions presented in previous literature (Camm et al., 2006; Wang et al., 2009; Wang & Curry, 2012), that is, the solutions claimed to be more robust (or conservative) to the SOC problem have higher BW. Second, the equivalence leads to a further customer classification, which further separates the buyers identified by the classic models into two segments by a threshold of consumer surplus. The further classification enables characterizing probabilistic choice for the SOC problem and defining the outliers for the BW problem. Third, the equivalence indicates a more efficient approach to solving the DRO model for the SOC problem. Through extensive numerical experiments based on synthetic and real‐life data, we show that the proposed framework outperforms its classical counterpart.
Focal areas for future research can be summarized in three aspects. First, another important objective, profit, should be studied in the future because it includes a key trade‐off between price and SOC. As the paper finds the connection between SOC and BW from the perspective of robust optimization, we expect the relationship between the three objectives founded. Second, the effect of robustness on other choice models should also be investigated. Although first‐choice models are the most widely applied approach in product design, the effect of robustness on the probabilistic choice model or others that do not base on the utility theory, such as ranking‐based models (Bertsimas & Mišić, 2019), should be investigated. Third, the interaction between products in a product line should be considered. Although we extend our model to accommodate product‐line design in the Supporting Information (EC.1.2.1), the results do not examine the substitution and similarity of the products in the product line. Further study on this issue will provide a better understanding of the product‐line design problem.
Footnotes
ACKNOWLEDGMENTS
The authors gratefully thank the review teams for their constructive comments to improve the paper. The authors appreciate Professor Teo Chung Piaw for his help in revising the paper. This research is partially supported by the National Natural Science Foundation of China (grant nos. 72188101, 72171129, 71991462). Maoqi Liu and Changchun Liu are currently supported by National Research Foundation, Singapore, and A*STAR, under its RIE2020 Industry Alignment Fund – Industry Collaboration Projects (IAF‐ICP) grant call (grant no. I2001E0059) – SIA‐NUS Digital Aviation Corp Lab.
1
2
Detail introduction of SPSS can be found at
3
Detail introduction of STATA can be found at
4
Detail introduction of scipy package can be found at
5
Go to
References
Supplementary Material
Please find the following supplemental material available below.
For Open Access articles published under a Creative Commons License, all supplemental material carries the same license as the article it is associated with.
For non-Open Access articles published, all supplemental material carries a non-exclusive license, and permission requests for re-use of supplemental material or any part of supplemental material shall be sent directly to the copyright owner as specified in the copyright notice associated with the article.