
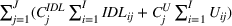
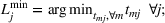
Abstract
Industry trends such as product customization, radical innovation, and local production accelerate the adoption of mixed‐model assembly lines (MMALs) that can cope with a widening gap between model processing times and true build to order capabilitiy. The existing high work content deviations on such assembly lines stress production planning, especially the assembly line sequencing. Most manufacturers set the launching rate for all assembly line products to a fixed launching rate resulting in rising utility work and idle time when system load increases. We present an “ideal” variable rate launching (VRL) case resulting in minimal computation and achieving 100% productivity (full elimination of idle time and utility work) for balanced assembly times and homogeneous station lengths. Managers should foster the ideal circumstances where operators need not wait for a preceding task to be completed and product sequence restrictions are eliminated, thus enabling unmatched production flexibility. Furthermore, we present a mixed‐integer model to analyze both closed and open workstations on an MMAL for fixed rate launching and VRL. This model incorporates costs not only for labor inefficiencies but also for extending the line length. We present a heuristic solution method when process times and station lengths are heterogeneous and demonstrate that the variable takt dominates the fixed takt. In a numerical, industrial benchmark study, we illustrate that a VRL strategy with open stations has significantly lower labor costs as well as a substantially reduced total line length and thus lower throughput time.
INTRODUCTION
During our visits with finalists in the INSEAD–WHU Industrial Excellence Award (IEA) competition (see
This dynamic business environment exerts pressure on existing linear and inflexible assembly lines to adopt a more efficient layout and to handle a wider range of products at a single site (oftentimes “brownfield” plants with an existing assembly setup). Many executives voiced the concern that assembly lines must be expanded considerably if they are to handle such product diversity. Most of these manufacturers strive to fulfill unique customer requirements in a true build‐to‐order environment—one of the predominant variants of mass customization—where the next unit scheduled for assembly is linked to the last incoming customer order (Agrawal et al., 2001; Wang et al., 2017). The central question that arises in this context is whether existing assembly line systems can effectively cope with such rapid changes and with the ever rising demand for greater flexibility and volume (Bloomberg, 2019).
Leading production systems are today based on four crucial objectives: takt, flow, zero defects, and pull; all of these derive from the Toyota Production System. Takt time (or cycle time) is the clock speed of every assembly process, which is determined by the available operating hours and the output per period that is needed to satisfy demand; it is the key lever of productivity (Monden, 2011). So when a new model with significantly greater work content is scheduled for production, plant managers can either plan a separate assembly line or adjust the existing line's parameters—that is, increase the fixed takt time. Yet, in either case, productivity suffers. Furthermore, the greater the difference in the workload of units sequenced on the line, the more difficult it is to assemble in a continuous flow of workload where the operator's individual workload is balanced—one of the cornerstones of lean. When assembling highly variable, customer‐specific products in a fixed takt time, such a steady flow cannot be achieved. Mönch et al. (2022) show how variable takt time groups enable a convergence toward a perfect assembly flow, independent of workload differences within the product portfolio. It follows that determining the optimal launching strategy is critical when introducing multiple models with unequal work content onto a given assembly line. The approach most commonly used to determine the launching interval (λ) is fixed rate launching (FRL), where the interval between two adjacent units on the line approximates the fixed takt time (including all inefficiencies) (Bard et al., 1992). Our paper presents the concept of variable rate launching (VRL), under which models are placed onto the conveyor depending on their processing time. When this procedure is followed, labor inefficiencies are substantially reduced.
In 2017, Fendt—the German subsidiary of AGCO and an innovation leader within the agricultural machinery market—implemented such a VRL system, the “VarioTakt.” Adopting this approach allowed Fendt to assemble all 10 of its product series, including an unlimited number of model configurations, on a single assembly line and with relatively few concerns about sequence restrictions or product complexity (Huchzermeier et al., 2020a). Note that in 2020, the World Economic Forum and McKinsey & Company selected Fendt's Marktoberdorf plant as one of their global digital lighthouse factories (Betti et al., 2020). The four cornerstones of our “ideal” case are based on Fendt's current operations (see Theorem 1 in Section 5). Without the VarioTakt, Fendt would not have been able to cope with the increased customization resulting from greater competition and its expansion into new markets (e.g., North America) (Bebersdorf, 2017). A recent process innovation enabled by this novel approach is that the “Fendt 1000 Vario”—the largest premium tractor in the market, with 738% more horsepower than Fendt's smallest tractor—is now assembled with all other models on the same assembly line (Bebersdorf, 2017). The complex tasks of sequencing products can be omitted as models are perfectly balanced over the entire set of stations and all stations have the same length. These cornerstones of the ideal case are discussed in Section 5. This is particulary of great interest for manufacturing executives during times when the product mix changes quickly, for example, due to recessions or pandemics. Huchzermeier et al. (2020b) provide an in‐depth description of the Fendt VarioTakt and how Fendt achieves the underlying requirement of perfectly balancing station processing times. Also, Mönch et al. (2021) describe how variable launching rates simplify the assembly line balancing problem and achieve high operator utilization levels by almost perfectly balancing assembly times.
Most research that explores how best to cope with mixed models in assembly has focused on minimizing idle time and utility work (or work overload) independently (Bolat & Yano, 1992b; Dar‐El & Cother, 1975; Okamura & Yamashina, 1979; Thomopoulos, 1967; Tsai, 1995; Yano & Rachamadugu, 1991) or on minimizing overall line length (Bard et al., 1992; Dar‐El & Cother, 1975; Dar‐El & Cucuy, 1977). Utility work arises when processing times on a unit exceed the operators capacity. Idle time occurs when the operator cannot immediately start work on the next unit. We provide a more detailed description of both concepts in Section 4. The paper by Dar‐El (1978) is the first to address overall line length and throughput time while considering both FRL and VRL. The numerical studies of Bard et al. (1992), Sarker and Pan (2001), and Fattahi and Salehi (2009) show that VRL outperforms FRL in terms of the costs associated with idle time and utility work—but only for the case of closed workstations. There has been hardly any research that models the VRL strategy with open stations, and no empirical studies have discussed the requirements and practical benefits of implementing a VRL strategy on assembly lines with open stations.
Our paper's contribution is to formulate a mixed‐integer model of the optimization problem for both closed and open workstations on a mixed‐model assembly line (MMAL) with FRL and VRL. We refer to this formulation as the general case, and it accounts for circumstances that have not previously been considered together. In addition to incorporating the costs associated with operator idleness and utility work, our analysis also considers—given the space restrictions commonly encountered in manufacturing sites—the cost of extending the assembly line length. Unlike most previous research, this study also accounts for sequence‐dependent setup times when switching between the production of two distinct product models. Following the real‐world example of Fendt, we identify several prerequisites for the ideal case: implementation of a VRL strategy under which employees are always busy, yet there are no workload peaks. This setting features 100% operator utilization and station lengths that are reduced to a bare minimum; these goals can be achieved by balancing assembly tasks and allowing parallel work on products as long as workers do not interfere with each other. Most importantly, this approach does not require extensive computations and is flexible enough to handle almost any change in product mix at nearly any time. We also present crucial insights on the practical application of VRL. In particular, we show how a firm can switch easily from a fixed takt system requiring high computational effort to a variable takt system with full flexibility, 100% productivity, and hardly any computational burden.
The rest of our paper proceeds as follows. In Section 2, we describe the characteristics of an MMAL, after which Section 3 reviews the literature on FRL and VRL with closed and open stations. Our unifying model formulation—which we refer to as the general case—is proposed in Section 4. Section 5 then discusses the modeling and implementation of the ideal case for a VRL system. In Section 6, we develop heuristic solution procedures and conduct a benchmarking study. We conclude in Section 7 with summary remarks and managerial insights.
MIXED‐MODEL ASSEMBLY LINE SYSTEMS
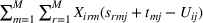
Assembly lines are classified into single‐model assembly lines (SMALs) and mixed‐model assembly lines (MMALs), depending on the number of models being manufactured on the same line (Al‐Hawari et al., 2015; Becker & Scholl, 2006). On SMALs, a single model is assembled. Whereas, on MMALs, multiple different product models are assembled with setup times between different models (Becker & Scholl, 2006; Boysen, Fliedner, & Scholl, 2008). This section briefly outlines the basic structure of the MMAL systems considered in our paper (for a more detailed description of MMALs, see Buxey et al., 1973). Such assembly lines are used to assemble different workpieces (or products, or units), which vary in terms of assembly tasks and work content. A product model (model, hereafter) is defined by the same underlying design and physical characteristics as well as bill of materials (e.g., the BMW 3 series or the BMW 7 series). Thus, two workpieces can be of the same model. In this definition, model configurations, for example, interior upgrades, are not included. However, our approach also works for model configurations, where each workpiece belongs to a model configuration and not a model. Generally speaking, MMALs are partitioned into J work stations that are connected by a conveyor belt moving—from upstream to downstream—at a constant velocity v. There exists no buffer inventory between stations, and workpieces directly move into the next station. When looking to manufacture multiple models on a single assembly line, a manufacturer faces two closely related problems: the assembly line balancing problem and the assembly line sequencing problem. Line balancing defines the assignment of total workload among stations as evenly as possible (Boysen et al., 2007; Kilbridge & Wester, 1962; Thomopoulos, 1967). When a manufacturer decides to assemble models with differing work content on a single assembly line, the medium‐term line balancing problem is linked to the short‐term assembly line sequencing problem (Thomopoulos 1967). Since assembly times differ between models and stations, it follows that operators are either underutilized or overloaded in terms of the assembly line's average work content. Once the best possible line balance is achieved, line sequencing determines the assembly order of products on the line based on leveling operator workload across total demand. The optimal assembly sequence has the effect of leveling workload deviations among the models based on a given assembly line balance, that is, by alternating single products (or batches) that have high and low levels of utilization. In the following, the focus is solely on the assembly line sequencing problem and we assume that stations are “balanced” in the sense that they reflect the best possible assignment of assembly tasks to stations. Then, the number of work stations is given and we do not consider the possibility of rebalancing the assembly line. Mönch et al. (2021) show how variable takt times reduce the complexity of the assembly line balancing problem. Moreover, the workpiece sequence is predetermined before assembly starts. Workpieces are processed on a first‐come, first‐serve basis and in the same sequence as they are launched onto the line. Different product model types m are assembled in a fixed station order, and the workpieces in the sequence are denoted by i. One operator is assigned to each station j; that operator moves downstream with the conveyor while performing an assembly task on one workpiece at a time. Material supply is located at the upstream station boundary. We consider not only the deterministic assembly time


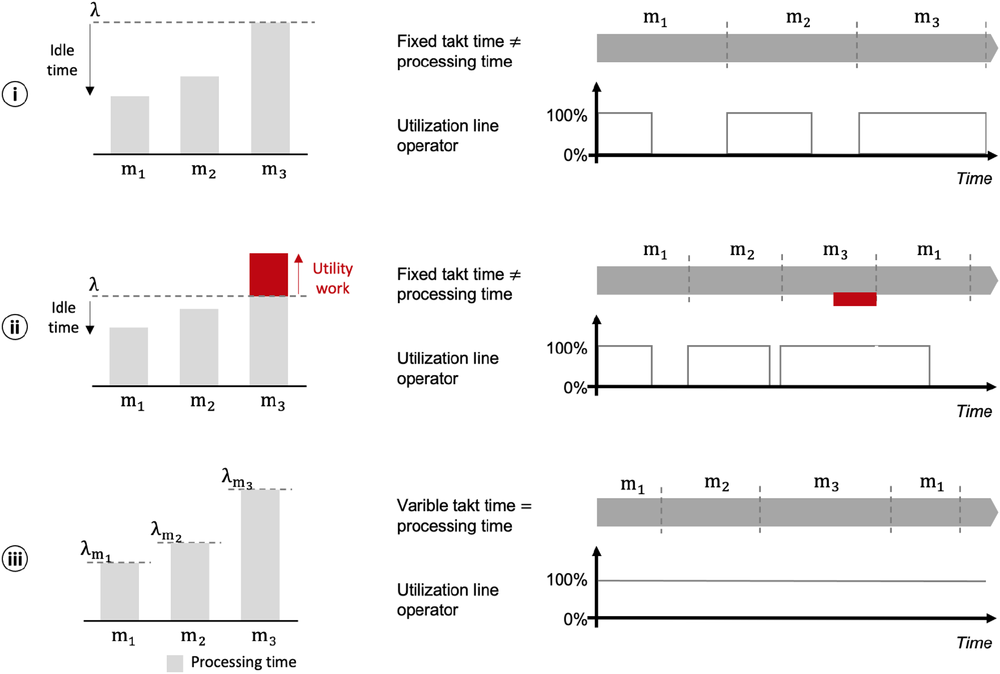
Launching rate strategies: Using the maximum process time (Case i), the average process time (Case ii), or variable process times (Case iii)
Depending on the nature of the task and on the assembly system's physical layout, station boundaries can be either open or closed. When stations are closed, the operator is not allowed to cross either its upstream or downstream boundary. This restriction might be needed, for instance, to preclude unproductive traveling or when technological or safety issues require that assigned tasks be performed within the station boundary—for example, in heating chambers or paint booths (Bard et al., 1992). Yet, when a workstation is open, the operator can cross its upstream boundary (to start work on a product outside that boundary) and/or its downstream boundary (to finish work on a product). Hence, the overlap or “drift” area between two adjacent stations extends an operator's allowable work area: by


Assumptions of the model
Note also that the product mix is predetermined and that sequences are built using the minimal part set (MPS). The notion of an MPS is widely used in the literature on MMAL sequencing, and it is defined as the smallest part set needed for the proportion of models that matches overall demand 
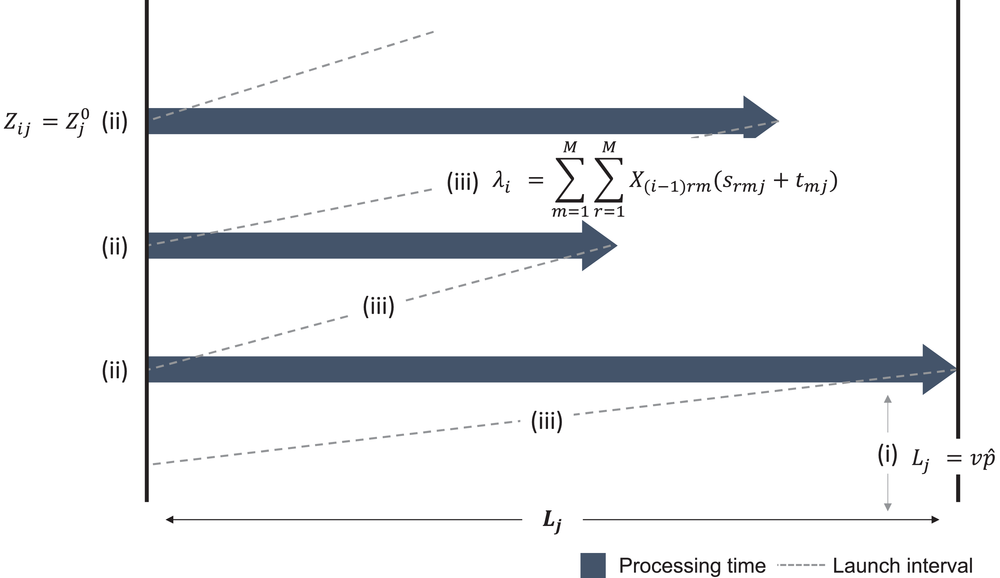
Figure 2 presents an operator movement diagram for the case of open stations and VRL. This particular three‐station scenario can be viewed as one component of a larger assembly line system. The horizontal dimension represents the operator's movement, and the vertical position corresponds to unit i's location in the sequence. Here, we assume that the MPS is (1, 1, 1); the station length is 


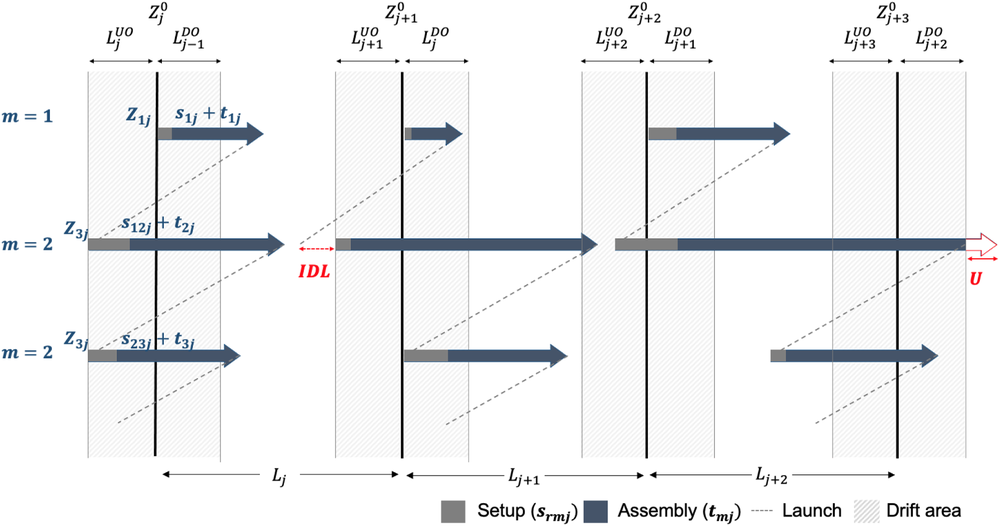
Operator movement diagram for the open‐station case with variable launching rates
In the figure, a horizontal arrow starting at location 


LITERATURE REVIEW
Over the past decades, a large amount of academic research has addressed the design criteria and configuration of MMAL systems. Thomopoulos (1967) distinguishes between two related barriers to an effective utilization of MMAL systems: the assembly line balancing problem and the assembly line sequencing problem. Line balancing involves the assignment of tasks (i.e., with and without precedence constraints) to a line's workstations so that the lowest takt time—which is usually the same for all products—is achieved. An overview of the line balancing problem can be found, for example, in Baybars (1986), Becker and Scholl (2006), Boysen et al. (2007), and Battaïa and Dolgui (2013). Mönch et al. (2021) present a generalizable mixed‐integer programming model that regards variable takt times and random customization, that is, random processing times, when solving the assembly line balancing problem. Moreover, Mönch et al. (2022) present a preliminary step to the line balancing and sequencing problem by defining variable takt times groups, where units with similar assembly times are assigned the same takt time. The results show that defining takt time groups can significantly reduce the effort connected to solving the assembly line balancing and sequencing problem. Our paper focuses on the line sequencing problem (for an extensive overview of literature on MMAL sequencing, see Boysen et al., 2009).
In the area of MMAL product sequencing, scholars have highlighted the development of algorithms and (meta‐) heuristics to ensure that parts are used at a constant rate and to minimize idle time, utility work, line length, throughput time, total setup costs, and the risk of stopping the conveyor. Because this paper focuses on the multiple objectives of minimizing idle time and utility work while accommodating line length restrictions, here we review only that literature devoted to optimizing one or more of these objectives. In this endeavor, we classify the research on MMAL sequencing in terms of the launching rate (i.e., fixed or variable) and the chosen station type: open station (OS) or closed station (CS) boundaries. For each of the resulting four cases, we discuss the related literature (as illustrated schematically in Figure 3) in turn.
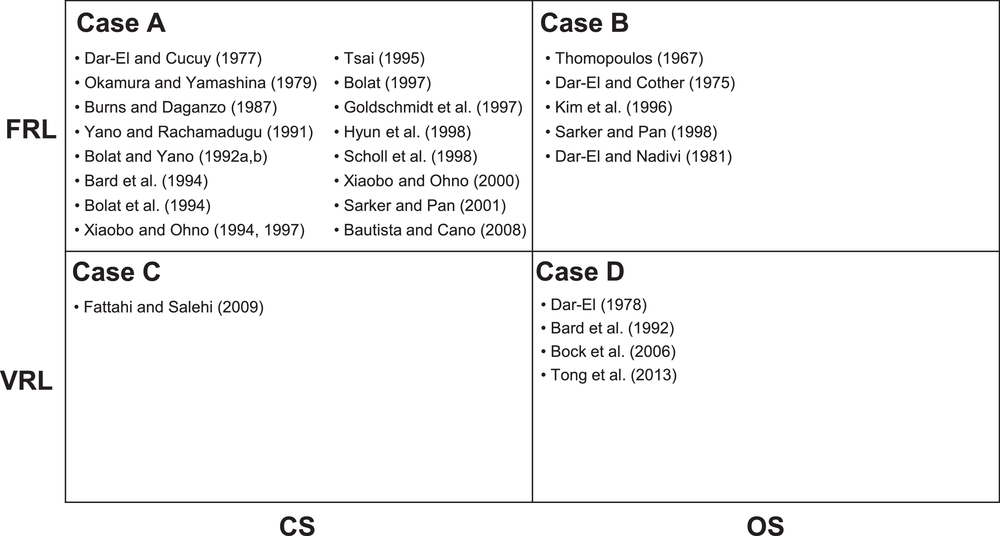
Classification of MMAL research based on type of work station and type of launching rate

The model that we develop minimizes restrictive modeling assumptions; in particular, it allows for (i) variable launching rates, (ii) open stations, (iii) unbalanced processing times, (iv) variable station lengths, (v) an unrestricted number of models, (vi) an unrestricted number of stations, and (vii) separation of setup and processing time. Most research considers setup time to be part of the processing time and hence independent of the sequence; however, Sun et al. (1999), Vallada and Ruiz (2011), and Yoshida and Hitomi (1997) are among the scholars who disagree with that approach. Moreover, we exploit structural properties—leading to the ideal case—that enable optimal solutions for VRL with open stations. If these properties do not exist, that is, inhomogeneous assembly times, we introduce the line length algorithm for open stations (LLAOS). Space restrictions play a dominant role in the layout planning of today's assembly lines; it is for this reason that our objective function accounts for extending the line length. By fixing the launching rate and/or setting both the upstream and downstream workstation overlaps to zero, our model can be reduced to Case A, B, or C. This paper is the first to benchmark all four of the cases described above.
VARIABLE RATE LAUNCHING MODEL FOR OPEN STATIONS (VRLMOS)
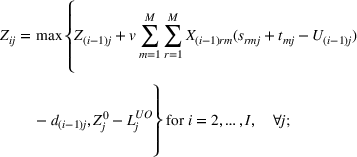
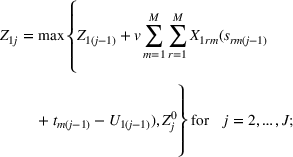
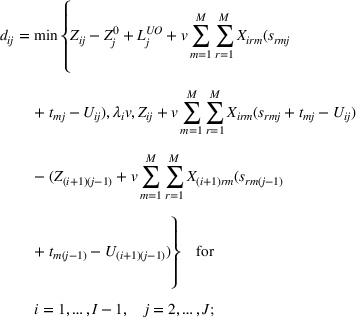
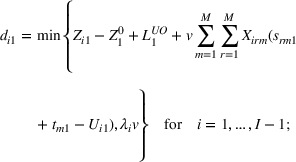
In many manufacturing settings, competitiveness depends not only on inefficiency costs associated with idle time and utility work but also on space limitations that affect production planning and the facility layout. Hence, our model simultaneously considers all three drivers: idle time, utility work, and line length. This model also accounts for setup times by addressing assembly environments in which products are fundamentally different. We shall employ the notation summarized in Table 2 when describing the mathematical model and its solution procedure.
Notation
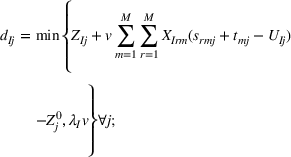
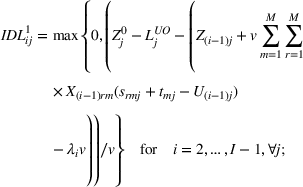
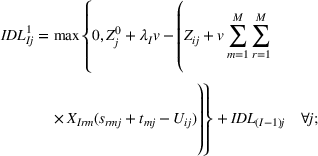
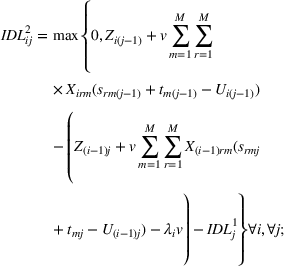
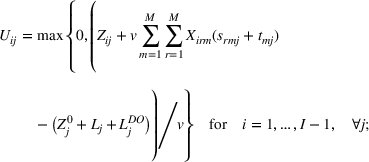
For a station j, one unit of idle time 


For a station j, one unit of idle time 


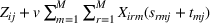
Line length and zero reference point
Most assembly line systems have a lower bound on the station length, 


MPS and model assignment
The MPS required to meet demand 


Operator starting position
An operator starts her work within the allowable upstream station overlap area 


Operator's upstream walking distance
The operator's upstream walking distance 


Idle time
Idle time (


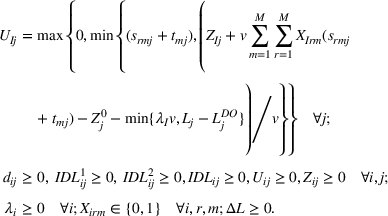
Utility work
Utility work 


IDEAL VRL APPROACH
In this section, we identify conditions that simplify the complex VRL model. These underlying assembly line requirements offer guidance for manufacturing companies—which face a wide variation in model process times—on where best to direct their investment and planning capacities. We show that the ideal VRL approach eliminates all labor inefficiencies (Theorem 1), almost entirely resolves the assembly line sequencing problem (Theorem 2), and minimizes the line length (Theorem 3). The conditions of Theorem 1 directly imply Theorem 2; yet given the latter's importance, we formulate it separately. For all three theorems, we set the upstream and downstream station overlaps to zero: 

Productivity
In the ideal VRL approach, idle time and utility work are completely eliminated and operator utilization is 100% under the following conditions: (i) Station lengths are set to the maximum processing time (over all models) multiplied by the conveyor speed, 


Utility work. Using condition (ii), we can write 


Idle time. Conditions (iii) and (iv) reduce Equation (14) to 


Single‐station case. From conditions (ii) and (iv) it follows that all stations have the same length: 
Operator movement under the ideal VRL approach for the single‐station case
Key to the applicability of the ideal case is the assumption that work can be perfectly balanced across workstations. This assumption sounds rather restrictive, but in practice, companies like Fendt achieve an almost perfect balance of work for their models of over 94%; where 100% is a perfect line balance (Huchzermeier et al., 2020b). Note, however, there is a practical need for a balance in the midnineties range as this grants operators some slack in case of contingencies.
Model‐mix flexibility
The ideal VRL approach guarantees the highest efficiency for any product sequence, so models can be launched onto the assembly line—at any time and in any order—without causing idle time or utility work.
We use the four conditions of Theorem 1 to prove Theorem 2. As shown in our model, the operator starting position For assembly systems with and without setup times, satisfying the conditions of Theorem 1 leads to a 100% workforce utilization—that is, because 


Line length
When multiple operators are allowed to work simultaneously on a product, the optimal line length L is determined by one of the following cases: (a) 


The extent to which a workstation's task may be shifted to the previous station is determined by the factor 

Case (a). If 


Case (c). For 


Case (b). For 
SOLUTION METHOD FOR THE GENERAL CASE
In this section, we discuss our heuristic solution method for those manufacturing environments in which it is not possible for the assembly process to be aligned with the ideal case's four conditions (Theorem 1). For the general case, the planning unit has to solve the NP‐hard assembly line sequencing problem in order to reduce labor inefficiencies and line length. In our simulation, we show that—in terms of costs and line length—VRL with closed stations (Case C) dominates FRL with closed stations (Case A) in all of the scenarios considered. The same holds true for open stations.
Line length algorithm for open stations (LLAOS)
We have established that idle time and utility work are substantially reduced when production switches from fixed to variable takt times. In general, VRL (with launching rate 


Line length algorithm for open stations (LLAOS)
The procedure for selecting 
Selecting the station for which the future total cost of idle time and utility work would be highest:


Selecting the station for which the current total cost of idle time and utility work is highest:
Selecting the station with the highest sum of utility work over all units in the sequence:
Selecting the station with the most utility work for one unit in the sequence: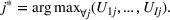

Extension of the LLAOS
Benchmark study and analysis
This section presents the findings derived from our large‐scale analysis of 2070 product sequences. We benchmarked the LLAOS selection procedures for Cases A, B, C, and D with respect to total cost of inefficiencies and assembly line length.
Data generation
The data set consists of 30 scenarios, each featuring a unique combination of the underlying MPS and model processing times. Each MPS is randomly generated under the condition that all models occur at least once in the sequence. Processing times are derived from a uniform distribution whose intervals are given in Table 3, and they include both assembly time and setup time. All scenarios incorporate the following line‐related parameters: frequency, 


Intervals for uniform distribution of processing times


Benchmarking the LLAOS options
In order to identify the preferred LLAOS option, we compare the minimal costs of all 2070 sequences for each option and case. Table 4 reports the percentage of sequences for which the specified option yields the best result, where the value in parentheses is the percentage of sequences for which only this option achieves the single best outcome of all options. Option 1 is clearly the dominant choice for at least 84% of the sequences. In fact, for the most restrictive strategy (Case A), the first selection procedure always leads to the best sequence; and it leads to the single best solution in 57% of the cases. Another noteworthy observation is that Option 1 becomes less dominant as flexibility is increased—for example, by opening up station boundaries and/or implementing VRL. Even so, Option 1 remains the best choice for flexible systems: For Case D, it delivers 84% of best solutions and 32% of the single best solutions.
Comparison of the LLAOS options by percentage of sequences yielding best (single best) result
These results can be improved if one undertakes the simple local search procedure described in Section 6.1. By examining neighboring solutions, our extended LLAOS for Option 1 (hereafter, LLAOS‐1) reduces the costs associated with Cases B, C, and D in (respectively) 37%, 26%, and 52% of the sequences. We remark that LLAOS‐1b does not yield any significant improvement for Case A; the reason is that it obtains the same station lengths (for most instances) as the LLAOS and thus results in the same inefficiency costs for each sequence.
With these parameters, a full enumeration over the line length was performed; starting with the minimal station lengths and iterating through all combinations until arriving at the maximum line length. The performed enumeration showed a runtime of roughly 2700 s. Moreover, the average optimality gap is 2.3% with one outlier of 8.5% (but still achieving better results than the fixed launching rate setting).
Analysis of deviations in line length and total costs
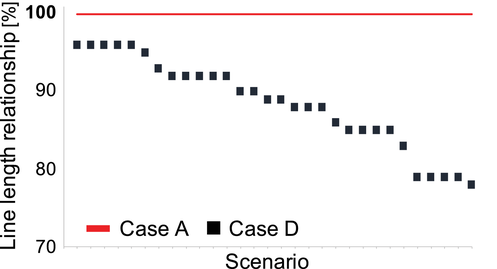
Our purpose here is to show that shifting the assembly strategy from Case A to Case D reduces assembly line length and overall assembly costs. Figure 5 and Figure 6 plot the percentage of improvement in (respectively) line length and overall cost when the LLAOS‐1 is implemented with variable takt times and open stations. As expected, Case A results in the highest average costs for all 30 scenarios. We can also see that Case A (resp., Case D) corresponds to the highest (resp., lowest) average cost and minimal cost for every scenario. These graphs show that changing from Case A to Case D reduces the line length of the best sequence by anywhere from approximately 4% to 22% (Figure 5) and also reduces total costs by approximately 11% to 37% (Figure 6). For any randomly chosen sequence, changing from Case A to Case D results in an average cost reduction of approximately 22%.
Line length improvement, from Case A to Case D, of best sequence
Cost reduction, from Case A to Case D, of best sequence
We next discuss whether manufacturing executives who seek to push, in a stepwise fashion, their Case A assembly process toward a more flexible approach should start by opening up station boundaries or rather by adopting VRL. From the line length perspective, opening up the station boundaries (Case B) has a significantly greater effect on the final length than does introducing variable takt times (Case C): In the former case, line length is reduced by approximately 12% on average. Of course, operators at open stations can start work earlier (than can those at closed stations), thanks to the adjacent station's drift area—thereby reducing the space required to fulfill their task. The combination of open stations and VRL has the greatest effect on line length: an average reduction of approximately 12%.
From the cost perspective, Case A and Case D can be seen as amounting to (respectively) an upper and lower bound on total inefficiency costs due to idle time, utility work, and line length—bounds that subsume the outcomes in Cases B and C. Unlike the results of our line length analysis, recommendations to open station boundaries or to introduce VRL are strongly dependent on the sequence.
Figure 7 plots the cost distribution of the sample scenario and its 90 sequences (the connecting lines are solely for the purpose of illustration). If the goal is to extend Case A, then the choice of opening stations versus establishing VRL clearly depends on the sequence—that is, since Case B yields a lower cost than does Case C in just over half (52%) of the sequences. This sequence dependency of production planning can be reduced significantly by the conditions presented in Section 5.
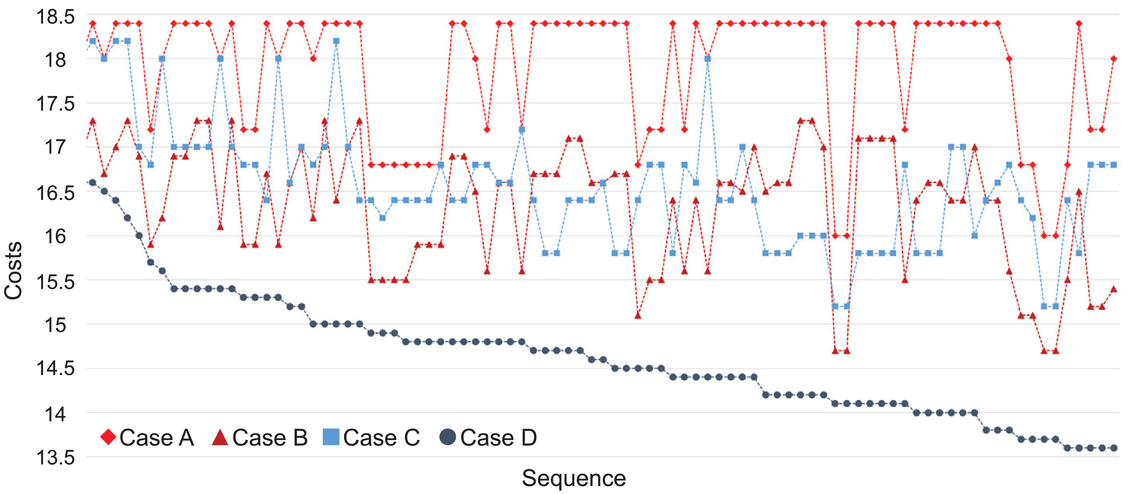
Total costs of every sequence in the sample scenario after implementing LLAOS‐1
DISCUSSION AND PRACTICAL IMPLICATIONS
Our paper consists of three main parts. First, we introduce a mixed‐integer programming model for minimizing labor inefficiencies and line length simultaneously on MMALs with variable takt times and open stations. Second, we discuss how companies can establish an ideal case, where labor inefficiencies are eliminated and operators are constantly utilized. Third, for manufacturing environments that are unable to align their operations with the ideal case, we present the LLAOS. In the rest of this section, we discuss the practical implications of all three elements and present managerial implications.
VRLMOS. Our general model extends the literature in that it is unrestricted with regard to launching rates and setup times as well as to variations in models, processing time, station length, and line length. This model applies to a large number of business cases, including those in which a leveled workload has proved to be elusive.
Ideal case. We present evidence that the general NP‐hard problem of MMAL sequencing can be broken down into an “ideal” VRL approach that maximizes the benefits of a VRL strategy and overcomes most implementation barriers to employing variable takt times. Successful implementation requires that manufacturing executives focus on five key planning objectives. First, processing times for every model should be perfectly balanced over all stations so that a product model has the same processing time at each station. Second, station lengths should be set to the maximum processing time over all models. Third, operators should start work on each unit at the upstream station boundary. Fourth, the launching rate should be determined by the previous product's processing time at the first station. Fifth, when parallel work is feasible, then workstations should overlap as much as possible.
If enough assembly space is available to set the station lengths equal to the maximum processing time, then fulfilling the first two conditions should not be difficult. Yet, achieving the third condition requires a highly flexible conveyor system, one that allows the spacing between units to vary; for that purpose, products can be placed on automated guided vehicles. The last condition requires considerable planning effort. For example, Fendt established a highly productive assembly design with an almost perfect line balance by assigning single tasks or entire tractor components to preassembly stations and utility workers (Huchzermeier et al., 2020b; Mönch et al., 2021).
Implementing variable takt time leads to five benefits. First, worker productivity rises significantly because operators can immediately start work on the next unit; hence the manufacturer's workforce is constantly occupied. Second, a system with zero idle time and no utility work ensures the best possible throughput time. Third, eliminating sequence restrictions substantially reduces planning efforts. Fourth, the decrease in utility work naturally increases quality by lowering the stress level of operators; beneficial outcomes include lower error rates and less rework. Finally, dispensing with the restrictions due to sequence dependency greatly increases manufacturing flexibility to fulfill a broad range of different customer demands in real time. Our description and solution of the general case covers manufacturing environments that deviate from the ideal case in terms of one or more aspects.
Solution method for the general case. The general case applies for manufacturing companies at which station lengths vary and/or processing times cannot be perfectly balanced, circumstances that violate requirements of the ideal case. We are the first to formulate a mixed‐model assembly optimization problem that accounts for both the cost of inefficiencies and line length. As discussed in the literature review, such combinatorial problems are solved efficiently by a variety of meta‐heuristics. In our paper, we emphasize the ideal case over the general case and thus do not focus on such standard solution methods. However, we suggest four novel and efficient search strategies—as defined above—for choosing the best station improvement for our MMAL problem. We tested these rules on a sample assembly line scenario, with three stations and three products. We develop a solution method for the general case—the LLAOS—that is an extension of Fattahi and Salehi's (2009) LIBP algorithm, which ignores open station boundaries and their effects on line length and labor costs. The LLAOS enables us to solve the unrestricted model by identifying the best sequence and its associated line length for open stations. We conduct a benchmark analysis to evaluate four station selection options for the LLAOS. This analysis involves comparing the minimum costs and line length of 2070 scenarios in terms of policies defined by the four cases that arise from the possible combinations of workstation type (closed or open) and launching rate (fixed or variable). To the best of our knowledge, this study is the first to compare the effects of all four cases on labor inefficiencies and line length. We find that the best outcome results from choosing, in every iteration of the LLAOS, the station predicted to yield the greatest reduction in both idle time and utility work. Another important finding is that, when the assembly strategy is changed from closed and fixed to open and variable, the line length and total costs are reduced by (respectively) 12% and 22% on average for the three‐station scenario. Also, we performed a cost analysis for an assembly setup with 10 stations and compared the costs of Case A and Case D. (The processing times of the extension are based on the distribution presented in Table 3.) On average, switching from Case A to Case D leads to a cost reduction of approximately 9% over all scenarios. The range of cost savings over all scenarios lies between 5% and 16%. These results are in line with our observations made at Fendt: After switching to VRL, overall line length productivity increased by 9% and annual productivity savings rose to 6% (Bebersdorf, 2017). Moreover, we assess the optimality gap by performing a full enumeration over the possible line length, starting from the minimal station length. The results we obtain show that the optimality gap over 30 scenarios is a mere 2.3% with negligible run times. This states the effectiveness of the proposed algorithm. Our computational results indicate that companies should strive to implement variable launching rates. Clearly, the ideal case should be the “true north” for such assembly strategies. However, the more stations and models considered, the more difficult it will be to obtain optimal solutions if processing times are not balanced and space restrictions exit, certainly, there is no guarantee that idle time and utility work can be eliminated at all and most likely never will be. Even for small problem instances, for example, three stations, such an optimization proves difficult and does not come even close to the performance of the variable takt approach. The stark difference between an optimal result, that is, 100% utilization of frontline employees, with no need for any optimization—in the case of the variable takt—becomes really evident. This should be one of the key arguments for abandoning the fixed takt as it is unsuited for the optimization of an MMAL. Finally, the LLAOS results in the ideal case when processing times are balanced over all stations for fixed launching rates (for variable launching rates, see the approach presented by Mönch et al. (2021)—the results show that VRL is superior to FRL for uniform processing times as well). This is the case in many standardized assembly lines, for example, automotive final assembly, where all stations have the same work content. If model processing times are uniform over all stations and space is not limited (no costs for increasing stations lengths), then the stations length would increase up to the maximum processing time (multiplied by the conveyor speed) and variable launching rates would equal the prior processing times, thus resembling the ideal case conditions from Theorem 1.
Managerial implications. Mass customization, highly innovative products, and localized production facilities have increased the pressure on static manufacturing designs, even those that previously operated at high levels of productivity. The prevailing management view wrongly supposes that all models should be handled using the same fixed takt time and that sequencing will, in itself, somehow accommodate variations in workload—beliefs that stem from a decades‐long quest to eliminate the variability from manufacturing systems (Monden, 1983). Yet, the inflexibility of employing a single takt time renders sequence optimization, a computationally expensive procedure. We want to point out that in a real‐world assembly context, additional factors play a role: Planners in multistage operations strive to achieve an average workload that matches the time it takes for a line carrier to pass through a workstation. If the workload is (much) larger, workers tend to drift off, that is, in the downstream direction. Moreover, if this is the case, workers drift in the upstream direction unless they pause at the start of their workstation (Mönch et al., 2022). Therefore, process times tend to “not vary that much,” at least they are bounded by a certain factor, which needs to be agreed by the workers council, worker representative, respectively (at Fendt, this factor is 15%). If process times are exceeding the time for passing of workstations, preassembly, suppliers, hybrid assembly (including matrix assembly), or flexible workers are scheduled. As one cannot ensure that workers use the entire space for assembly tasks, long process times have a high risk of significantly interfering with activities in the subsequent station and thus are often curtailed before the data are optimized. Conversely, operation tasks with little workload lead to idle time, which is also to be avoided (Bebersdorf & Huchzermeier, 2022). For those reasons, it is unreasonable, in our view, to simulate extreme realizations or variations in process times—as is typical for many operations research (OR) approaches. In our experiments, we took great care to assemble a meaningful data set for this specific context. Note that the variable takt solves the issue of accepting more variance in process times by leveling the work content of each station's operator even though the spread of that content widens. As each product is assigned its own takt, much larger variations can be accepted, and there is limited or no drifting off whatsoever. This can never be achieved, as outlined above, with the fixed takt. It is not a matter of combinatorial optimization finesse; it is a matter of a fundamental change in approach.
For those who seek to move quickly from a fixed to a variable takt system, we suggest that product process times be rebalanced by distinguishing between tasks that must be performed directly on the production line and tasks that can be shifted to preassembly stations or lines located near the final assembly line (Huchzermeier et al., 2020b). In the medium term, it can be helpful to set up an interface between manufacturing and R&D; doing so will make it easier to integrate manufacturing objectives with the product development process. At Fendt, this is called Design for Takt (Bebersdorf & Huchzermeier, 2022).
Such integration, by enabling a perfect balance of workload across the assembly line for each product, can ease efforts to improve shop‐floor planning and can also reduce assembly costs substantially. The typically time‐intensive planning of the next sequence can thus be eliminated in systems without setup times, since all sequences yield the same efficiency. As for setup costs, an optimal batching of products in an MPS is both straightforward and independent of the assembly line status and layout. When combined with open stations, VRL not only significantly reduces operator idleness and work overload but also shortens the line length considerably.
We conclude that, with regard to future developments in assembly‐intensive industries, the introduction of variable launching rates into MMALs is an efficient way to meet the challenges arising from mass customization and the need for more flexibility/responsiveness during turbulent times. Our results show that VRL outperforms FRL even when the conditions of the ideal case are violated. A major change in the manufacturing landscape is already evident in the form of new dynamic line configurations and layouts. The VRL strategy proposed here is a practical way to cope with the ever increasing demand for assembly line flexibility while keeping investment costs under control. As labor inefficiencies inevitably rise, we are certain that the VRL adoption rate will likewise increase. For example, during several visits at premium car manufacturers, we observed first experiments with variable takt times in subassembly stations, for example, in the assembly of two‐ and four‐door cars. Employing variable takt times eliminates the major limitations of a fixed takt time system and yet retains all of the conventional assembly line's advantages.