
Abstract
We study how to admit and schedule heterogeneous patients by using simple, interpretable, yet effective policies when capacity is scarce, no‐show behavior is patient‐ and time‐dependent, service duration and reward are deterministic but patient‐dependent, and overtime is costly. Our work is motivated by the aforementioned operational challenges that typically face adopters of new technologies in the healthcare sector. We anchor our study on a partnership with the proton therapy center of Massachusetts General Hospital (MGH), which offers a new radiation technology for cancer patients. We formulate the problem as a nonlinear integer optimization problem. However, as the solution to this formulation lacks both tractability and interpretability, to be relevant to practice, we limit our study to simple and interpretable policies. In particular, we propose a simple index‐based rule and derive analytical performance guarantees for it. We also calibrate our model using empirical data from our partner hospital, and conduct a series of experiments to evaluate the performance of our proposed policy under practical circumstances. The analytical performance guarantees and our numerical experiments demonstrate (a) the strong performance of the proposed policies, and (b) their robustness to various practical considerations (e.g., to potential misspecification of no‐show probabilities). Our results show that our proposed policy, despite being a simple and interpretable index‐based rule, is capable of improving performance by about 20% at an organization such as MGH, and of delivering results that are not far from being optimal across a wide range of parameters that might vary between organizations. This suggests that the proposed policy can be viewed as an effective “one‐fits‐all” capacity allocation rule that can be used in a variety of environments in which operational challenges such as no‐shows and overtime costs need to be navigated using simple and interpretable rules.
INTRODUCTION
Motivation
Adoption of new treatment technologies often enables organizations in the healthcare sector to drastically improve their service quality and generate additional value. At the same time, adoption of such technologies typically requires substantial investments (e.g., in new equipment or skilled labor). It is, therefore, crucial for adopters to allocate their new‐technology‐enabled service to users in a way that makes the best use of their installed capacity. On the surface, this crucial task is facilitated by the ample demand that flocks to adopters. Specifically, due to the advantages that such new technologies offer to users, organizations that adopt them typically face a high demand level compared to the installed capacity. This enables them to be more selective about which users to admit and when to schedule them to receive the service. However, these admission and scheduling decisions are impeded by common practical considerations that often arise in such contexts, most notably no‐shows, overtime costs, and the need for interpretable allocation rules.
No‐shows. Users who are scheduled to receive service but do not show up can cause serious problems for adopters of new technologies particularly in light of their elevated opportunity and unused capacity costs. Although user's no‐show propensity might be reduced by the new technology's higher service quality, it could also be offset by potentially increased scheduling lead times owing to increased demand. The consequences of no‐shows is particularly compounded in services in which capacity allocation requires some advance coordination and planning with users, which make it impossible for the adopters to allocate the capacity assigned to a no‐show user to a new one. For example, patients accepted to be treated with a new treatment technology need to be contacted in advance, informed, checked for their insurance and other documents, and scheduled for treatment starting a specific date. While waiting for their scheduled appointments, patients might decide to use the old treatment technology instead of waiting longer for the new one, especially if their health condition starts to degrade. Thus, even though capacity is allocated to a patient, he/she might not show up to use it. Furthermore, the lengthy advance planning and coordination that is required to shift the allocated capacity to another patient means that the allocated capacity will be wasted, as last‐minute replacements are often impossible in practice.
In view of the aforementioned considerations, selecting which users to serve from the set of interested users and when to schedule them to receive the service needs to be decided upon in a way that accounts for the induced no‐show behavior of scheduled users. Of note, accurate predictions of who is likely to “show up” and the related time sensitivities, therefore, can exceedingly help adopters of new technologies to make better allocation and scheduling decisions. However, such accurate predictions are rarely available to adopters, as they deal with a newly introduced technology for which there are not enough data to reliably estimate show‐up probabilities. Lack of data availability also impedes the ability to identify important consumer features that can serve as strong show‐up predictors.
Overtime costs. Arguably, the most common approach to compensate for the risk of wasted capacity due to no‐shows is overbooking. 1 The flip side of overbooking is that it could lead to overtime operations, which could be costly for the service provider. In particular, for adopters in certain services, access to flexible or slack capacity on demand to cover overtime needs might be limited or very expensive. A hospital offering a new treatment technology, for example, might need to hire additional skilled labor that is knowledgeable about the new treatment, or compensate existing staff for overtime. Therefore, scheduling decisions need to carefully account for potential overtime costs.
Interpretable allocation rules. Allocation of scarce, highly valuable resources tends to be contentious in nature as it could have important implications for the allocatees' welfare. Consequently, it is often highly desirable for the allocation rules to be transparent and interpretable, so that they can be easily understood and trusted by the allocatees. This is especially important in sectors such as healthcare, because denying or providing treatment to patients, and sometimes even delaying the treatment for them due a prioritization rule in place, could be a life‐or‐death related decision (Bertsimas et al., 2013; Saghafian et al., 2014). Therefore, most adopters of disruptive new technologies tend to be reluctant to rely on complex “black‐box” type algorithms as their allocation rules, and rather prefer to make use of interpretable and easy‐to‐implement rules instead.
Our study
In this paper, we develop a procedure to assist organizations that face the above‐mentioned issues with making two interwoven decisions: given a set of heterogeneous users, and some limited service capacity over a time window, (a) who to allocate the scarce capacity to (i.e., an admission decision), and (b) for those admitted, when to serve them (i.e., scheduling decisions). Our study of these decisions under the foregoing issues is particularly motivated by the situation at the Proton Therapy Center of our partner hospital, Massachusetts General Hospital (MGH).
By using protons rather than x‐rays, proton therapy offers a superior technology for treating cancer compared to the traditional radiation therapy. Specifically, proton therapy offers two important advantages compared to the traditional x‐ray‐based radiation therapy: (a) more radiation delivered to the malignant tumor, and (b) less radiation delivered to the healthy tissues surrounding the tumor. In addition, proton therapy typically causes fewer and less severe side effects such as low blood counts, fatigue, and nausea. Due to these advantages, demand for proton therapy among cancer patients is currently extremely high. However, as the technology is relatively new, only a few facilities in the United States currently offer it (including a center at our partner hospital, MGH), and capacity at each of these facilities is fairly limited. Due to this typical high demand‐to‐capacity ratio, some patients face long service lead times further prolonged by the lengthy insurance approval and proton therapy planning process, in total taking a few (if not many) weeks. Because patients waiting to receive treatment might seek outside options (e.g., traditional radiation therapy), MGH faces costly last‐minute cancelations (i.e., no‐shows). 2 Furthermore, compensating for the wasted capacity due to such cancelations through overbooking often translates to significant overtime costs at MGH. Finally, as decisions on who should be accepted to receive treatment via this new technology and when to serve accepted patients are sensitive in nature (e.g., could be a matter of life or death), MGH administrators are reluctant to implement “black‐box” rules. Instead, they are in need of allocation rules that can be easily interpreted and described to patients, providers, and stakeholder.
Our approach
We follow a step‐by‐step approach. Motivated by the situation at our partner hospital, we start by developing a framework to study joint admission and scheduling decisions for a given set of heterogeneous users under the risk of (a) patient‐ and time‐dependent no‐shows, and (b) overtime operations. We then analyze the optimal policy, and find it to be complex and not interpretable for implementation in practice. Thus, as part of our step‐by‐step approach, we try to first gain an understanding of the complex problem faced by our partner hospital by considering a simplified model that can capture the main trade‐offs discussed above. This allows us to develop a simple heuristic rule that is expected to work well in practice. We then relax some of the simplification assumptions of our model, provide extensions, and make use of simulations calibrated with hospital data to test the performance of the proposed heuristic rule under more realistic scenarios that better represent the complex environment at our partner hospital.
A particular example of our step‐by‐step approach is the fact that we begin our analysis by gaining insights into the main trade‐offs by assuming that each patient only requires one visit. We then relax this assumption and provide an extension by considering more realistic situations in which some patients require multiple (and a heterogenous number of) visits. Finally, we note that hospital administrators need to consider other practical issues that may exist in their practice but do not systematically affect the main trade‐offs we study in this paper. For example, some proton therapy centers may prefer to reserve a small portion of their capacity for specific use (e.g., a small block of time of one of their gantry rooms might be reserved for pediatric patients under anesthesia). We highlight that such preferences (a) can be easily incorporated into our heuristic rule 3 , and (b) are relatively case‐by‐case without any systematic effect on the main driving forces we strive to study.
Our contributions
Our main contributions can be summarized as follows. We develop a simple, interpretable, and easy‐to‐implement index‐base rule that could be used to tackle joint admission and scheduling decisions for heterogeneous users under the risk of patient‐ and time‐dependent no‐shows, and overtime operations, faced by various hospitals, including MGH. We provide theoretical performance guarantee for our proposed index‐based rule. From a technical perspective, our work extends the available results for the generalized assignment problem (GAP). This is because, in contrast to the literature on GAP, we deal with overtime costs, and hence, an integer optimization problem with a nonlinear objective function. Another key difference with the available studies on GAP is that we seek to find a policy that is simple and interpretable, can allow for no‐shows, and is also robust to potential misspecifications of no‐shows. We provide simulation‐based evidence using hospital data for the effectiveness of our proposed policy. In addition, we find this policy to be robust to input data misspecifications (e.g., patient‐ and time‐dependent no‐show probabilities, which are inherently hard to calibrate in practice). Our simulation experiments also reveal that this policy performs well under a wide range of factors that could vary among hospitals. Thus, besides being an easy‐to‐implement and effective policy, our proposed policy can be viewed as a “one‐fits‐all” rule that can be used in a variety of hospitals. Employing machine learning and predictive analytics, we also shed light on patient characteristics and useful learning approaches that can be utilized to effectively predict no‐show risks. This can be valuable in practice, as predicting no‐show risks and incorporating them in admission and scheduling decisions can yield substantial benefits. Predicting no‐show, however, is a challenging task, as no‐show risks often depend on a variety of patient characteristics as well as the delay in offering the capacity (i.e., are patient‐ and time‐dependent). Despite this challenge, our machine learning approaches show promising results for predicting no‐show risks, and thus, offer new predictive tools that can be implemented in practice.
MODEL AND RELATED STUDIES
We start by developing a simplified model that can capture the main trade‐offs discussed in Section 1. In doing so, we take advantage of some of the observations we have made based on collaboration with our partner hospital (one of the authors of this paper is the medical director of Proton Therapy Center of our partner hospital). Before we formally introduce the model, we make three notable observations.
First, as we discuss in more in detail in Section 5, while patients submit their requests/applications in a dynamic manner, patient applications are batched and are reviewed only periodically and with a fixed review cycle (e.g., 4 weeks). That is, a group of physicians review all the collected patient applications (e.g., medical documents, history, etc.) in the beginning of each cycle and evaluate their suitability for proton therapy. As reviewing applications require extensive evaluations, this makes “online” (i.e., on‐the‐spot) decision‐making impossible. Instead, the practice involves collecting all the applications and making decisions in an “offline” manner. Once it is decided which patients should be accepted (among those reviewed in that cycle), accepted patients are then scheduled to receive treatment. Those who are reviewed but not accepted (i.e., are rejected) are informed. These rejected patients typically seek other treatment options (e.g., traditional x‐ray therapy) and do not apply again, as waiting further can be detrimental. In addition, reviewed applications will not be re‐reviewed in another cycle. Thus, decisions made at each review cycle do not have a systematic impact on those of the next review cycle. These facts allow us to focus on studying the problem faced by the practitioners at the beginning of each review cycle in isolation (i.e., as a static problem as opposed to a dynamic one).
Second, as is detailed in Section 5, there are various features in proton therapy that prevent assigning capacity that is freed up due to a last‐minute no‐show to a different patient. For instance, delivering treatment in proton therapy requires a physician (e.g., a radiation oncologist) to have enough time to develop a radiation treatment plan along with a dosimetry and medical physics team. In addition, prior to delivering the treatment, multiple other preprocessing steps need to be taken (e.g., clinical determination of region to be treated, quality assurance testing, and peer review of treatment plan, among others). Due to these preprocessing steps, no‐shows of scheduled patients almost always result in wasted scheduled capacity. Thus, unlike many other healthcare appointment scheduling studies, we consider a model in which no‐shows do not free‐up capacity.
Third, we note that no‐show probabilities in proton therapy mainly depend on when a patient's first visit is scheduled, and are not affected by his/her follow‐up visits—if any. That is, once the treatment delivery process for a patient starts, the patient adherence to using subsequent appointments is very high.
With these observations from our partner hospitals in mind, we proceed by developing a simple model that captures the main trade‐offs in admitting and scheduling patients. To this end, we start by assuming that each patient requires only one visit. The extension of the results gained to multiple visits is relatively straightforward, and we defer the related discussion and analysis to Section 6.
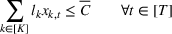
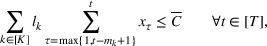
Consider a facility that has limited capacity to provide some medical service over some future time window that spans T time periods. A time period could be, for example, 1 day. On each such future time period there are C available service time slots. If service runs in excess of this capacity, overtime cost is incurred at a rate of θ per time slot. Service on each time period cannot run for more than


There are N patients who seek to be admitted and scheduled for the service. Each patient belongs to one of K different classes, indexed by


The facility's decision maker (DM) needs to choose which patients to admit and when to schedule them. Let


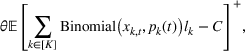


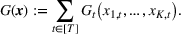
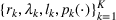
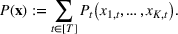
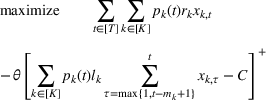
The DM's problem is to make joint patient admission and scheduling decisions so as to maximize the expected profit. It can be formulated as the following nonlinear integer optimization problem


Because G is a nonlinear, complex function, solving the optimization problem (5)–(8) is intractable for even moderate problem sizes. However, even if exact solutions to this problem were attainable, they would be of limited practical relevance due to lack of interpretability. In particular, a patient admittance approach that uses optimization problems such as (5)–(8) operates essentially as a “black‐box” that is nearly impossible to explain to or communicate with patients and/or physicians. Indeed, as noted in Section 1, interpretability of admission and scheduling rules in utilizing a new technology is highly desirable in practice, if not necessary.
In addition to interpretability, our goal is to devise a policy with the following desiderata. First, to be implementable in practice, the policy needs to be computationally efficient and scalable in order to accommodate large‐scale problem instances. Second, the policy needs to provably perform well, that is, have analytical performance guarantees vis‐a‐vis the optimal value of problem (5)–(8). Finally, because it is often hard to accurately calibrate no‐show probabilities (e.g., due to lack of large‐scale data caused by the fact that the technology is new and has not been offered for a sufficiently long‐period of time), the policy's performance needs to be robust against potential misspecification of no‐show probabilities.
To achieve our goal, we focus our attention on devising index policies that allow for making joint admission and scheduling decisions. By design, and owing to their simplicity, index policies are both interpretable and scalable. In the analysis that follows, we derive an index policy that also enjoys analytical performance guarantees, is robust against potential misspecification of no‐show probabilities, and performs very well in numerical experiments calibrated with data from our partner hospital. Prior to doing so, however, we first briefly review the studies that are related to our work.
Related studies
Owing to their pervasiveness and ubiquitous use in service operations, scheduling techniques have been studied in a large body of the literature. Herein, we make no attempt to survey the literature, but rather focus on papers that are closest to ours.
Healthcare operations
Patient scheduling under no‐shows has received a lot of attention in healthcare operations. Cayirli and Veral (2003) and Gupta and Denton (2008) provide a broad literature review of some earlier works in this stream. Most of the existing studies on patient scheduling under no‐shows consider only homogeneous no‐show probabilities (Hassin & Mendel, 2008; Kaandorp & Koole, 2007; LaGanga & Lawrence, 2012). In Luo et al. (2012), the authors consider a patient scheduling problem with no‐shows and service interruptions. Feldman et al. (2014) study the inter‐day appointment scheduling problem with homogeneous patients under no‐shows and patient preferences. Because the general problem is computationally intractable, they provide an optimal policy for the static model, and propose a heuristic solution for the dynamic model. The key difference of our approach is that we seek to derive interpretable index policies with performance guarantees.
Another different but closely related problem is scheduling of jobs with time varying status, motivated by disaster response scenarios (Argon et al., 2008; Chan et al., 2013). Different from these studies, we consider overtime costs and derive performance guarantees, alongside a robustness analysis. Master et al. (2016) consider a discrete time, multi‐server system with jobs whose values decay as time elapses. Because the problem is intractable, they propose and analyze the performance of several approximation algorithms. Our model is closely related to that of Master et al. (2016), but with several notable differences; we consider overtime operations as well as multiple capacity constraints, which introduce new challenges as one needs to simultaneously and carefully balance profit generation and capacity consumption.
Other related studies within the healthcare operations literature include Patrick et al. (2008), Wang and Gupta (2014), Helm and Van Oyen (2014), Diamant et al. (2018), Saghafian et al. (2019), and Saure et al. (2020). Patrick et al. (2008) design approximate dynamic programming method to schedule patients with different priorities to a diagnostic facility in a public healthcare setting. Wang and Gupta (2014) study nurse staffing with heterogeneous absenteeism (no‐shows). Helm and Van Oyen (2014) consider the problem of assigning elective patients with different rewards to different hospital units under capacity constraints. Diamant et al. (2018) develop a dynamic model of patient scheduling with rewards and no‐shows in which a clinic assigns patients to an appointment day but delays the decision of which assessments patients undergo until it is observed who arrives. Saghafian et al. (2019) study the problem of assigning patients admitted through the ED to hospital inpatient units, where patients have different rewards, waiting costs, and service needs (capacity use). Saure et al. (2020) study the problem of scheduling multi‐priority, multi‐class patients with random service duration.
Finally, for other studies related to patient scheduling with time‐dependent no‐shows, we refer to Begen and Queyranne (2011), Kong et al. (2019), Liu et al. (2009), Zacharias and Pinedo (2013), Zacharias and Yunes (2019), Zeng et al. (2010), and the references therein. These studies are, however, mainly motivated by medical appointments in which (a) there is a single patient type (e.g., Begen and Queyranne, 2011; Liu et al., 2009; Zacharias and Yunes, 2019), and (b) admission is rather exogenous and does not play an important role (e.g., appointments of a primarily care physician Zacharias & Pinedo, 2013; Zeng et al., 2010). As noted before, our focus in this study is on joint admission and scheduling decisions among a pool of heterogenous potential users, and we are motivated by settings in which the scarce capacity of a new technology (e.g., proton therapy) needs to be allocated to appropriately selected users at appropriate times.
Generalized assignment problem
When the overtime cost is large enough and overbooking is always detrimental, our problem reduces to maximizing reward, and hence, becomes closely related to the GAP (Chekuri & Khanna, 2006; Feige & Vondrák, 2006; Fleischer et al., 2006). Computing the optimal solution for GAP is in general NP‐hard, but efficient approximation schemes exist. Fleischer et al. (2006) propose an


A key difference between our study and the literature on GAP is that we deal with overtime costs, and hence, an integer optimization problem with a nonlinear objective function. Another key difference with the aforementioned studies is that we seek to find a policy that is simple and interpretable, can allow for no‐shows, and is also robust to potential misspecifications of no‐shows. As noted earlier, these features are typically important for adopters of new technologies, and our focus on them is particularly motivated by the situation at our partner hospital.
Submodular maximization under a knapsack constraint
When the overtime cost is moderate, overbooking may be profitable. In that case, as we will see, the objective function of our problem can be approximated by a (nonmonotone) submodular function, and thus, relates to the problem of submodular maximization under a knapsack constraint. For monotone submodular maximization under a knapsack constraint, a simple marginal reward/weight with a fixed scheme is a


Treatment planning in radiation therapy
Several papers in the literature address appropriate design of treatment plans in radiation therapy. For this stream of research, we refer interested readers to Bortfeld et al. (2008), Chan and Misic (2013), and the references therein. Treatment plans are, however, designed once the decision to allocate the capacity to the patient is made. Thus, our work differs from this stream of literature in that we focus on the more strategic‐level decisions of capacity use (admission and scheduling) as opposed to the operational‐level decisions related to the design of treatment plans for admitted patients.
THE MAX‐RATE ADMISSION AND SCHEDULING POLICY
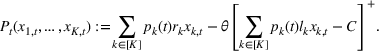
In this section, we describe our proposed joint admission and scheduling policy, which we term
At a high level, the policy works as follows. It sweeps through the time periods in ascending order,


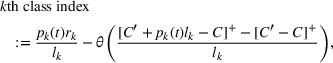
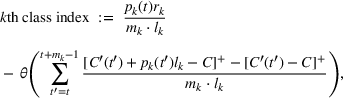
The proposed policy is evidently simple and interpretable. Scheduling priority of a patient for a time period, as dictated by the index, bears the following rather intuitive explanation. Scheduling of a patient of class k can be viewed as an “investment” of 
Given that the
PERFORMANCE ANALYSIS
In this section, we provide a theoretical guarantee for the performance of the For a maximization problem 


Among the steps we follow so as to analyze the 


The 


At a high level, our performance analysis proceeds in three steps. In the first step, we characterize “how well” the index score of the The 


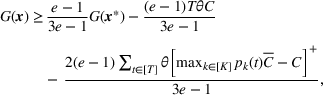


The approximation factors in the theorem above compare favorably with other factors obtained in the literature for similar types of problems. To this end, let us compare the approximation guarantees we provide for our problem with those provided for the classical GAP, which is a much simpler problem whereby no overtime considerations are present. As we remarked in our review of related papers, state‐of‐the‐art algorithms for GAP achieve guarantees of 


Effect of misspecification of show‐up probabilities
Among the model parameters, show‐up probabilities 


To consider such misspecifications, we assume that the exact show‐up probability functions, 


Under this model of uncertainty, we consider the following robust counterpart to our original optimization problem: For the problem (24)–(27): if if 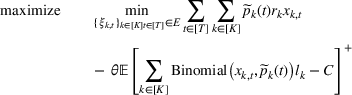


The approximation guarantees in Theorem 2 illustrate how the performance of the proposed index policy depends on potential misspecifications of the show‐up probabilities, as captured by the parameter ε. Note that for 
CASE STUDY: PROTON THERAPY TREATMENT ADMISSION AND SCHEDULING
To gain further insights into the performance and advantages of the
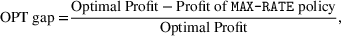
In summary, we find that our proposed policy strikes a favorable balance between interpretability and performance. In particular, being an index‐based scoring policy, it is almost as simple and has the same interpretable scoring‐based format as the current practice at MGH (which we describe in detail below). Importantly, our results show that it yields about 20% performance improvement in expected clinical benefits—an estimate we arrived at by using real data and the same performance metrics as used by MGH. Furthermore, we find that the
In what follows, we first briefly describe the process of proton therapy treatment at MGH. We then introduce our data, parameter estimation procedures, and analyses.
Proton therapy treatment process
To be treated via proton therapy, patients are required to “apply” in advance. That is, in consultation with their physicians, they decide to seek proton therapy treatment and submit all the required documents. Subsequently, there are a series of steps that need to be completed prior to treatment commencing. First, each application is reviewed in detail so as to evaluate the patient's suitability for proton therapy and expected clinical benefits. Second, once a patient is accepted for treatment, the staff try to ensure that he/she is either covered through insurance and/or is able to pay the associated costs out‐of‐pocket. Once these steps are done, the physician (e.g., a radiation oncologist) begins to develop a radiation treatment plan with a dosimetry and medical physics team that involves multiple steps from clinical determination of region to be treated to quality assurance testing and peer review of treatment plan. These processes are lengthy in time, but are essential before the patient can start the treatment.
Because all the aforementioned required steps prior to treatment take at least a couple of weeks, there is usually a delay between when the patient applies and when he/she is scheduled to start the treatment. Lack of enough proton machines compared to the demand creates further scheduling delays. Of note, these required processes also prohibit compensating for no‐shows by assigning the capacity to another patient: when a patient who is scheduled to receive treatment does not show up, last‐minute replacements are not possible. Patients who do not show up to receive their treatment often seek treatment from other resources (e.g., traditional x‐ray radiation). This is, for example, the case for patients who no longer can wait, those whose health condition suddenly degrades, and those who receive advice against proton therapy after applying for it. Similar to those patients who are declined to receive the service, no‐show patients almost never apply again.
Proton therapy admission process at MGH
The number of prospective patients far exceed available proton therapy treatment capacity at MGH. Applications are reviewed periodically by a panel of expert oncologists, medical physicists, and dosimetrists who evaluate appropriateness of each case with a collective determination made. That is, applications are collected over some period at MGH, which we refer to as “cycle,” and then the panel meets at the end of each cycle to make a decision.
This elaborate and complex decision‐making process is currently guided by a scoring system developed by MGH, which assigns each applicant with a prioritization score, termed the “capstone” score. The capstone score was designed to reflect the incremental medical benefit a patient would have by receiving proton radiation, as opposed to conventional therapies. 6 In other words, the capstone score approximates the utility that the center would derive by providing service to that patient based solely on clinical grounds. Notably, no operational considerations, such as capacity consumption, or no‐show probability, are used in the calculation of this score. By and large, the panel tends to prioritize and schedule patients using the capstone scoring formula.
Data set
Our data set spans a period of 481 days in 2016–2017, and includes information about all 1153 patients who were reviewed to be treated at the MGH Proton Therapy Center during this period. Due to incomplete data entries, we omit data on five of these 1153 patients. Moreover, 75 patients out of the remaining 1148 patients had data entry errors (e.g., appointment dates earlier than the application date), and hence, we omit them as well. Thus, our final data set includes information about 1073 patients. For each patient, the data include information about the patient's application date, demographic features such as age, gender, residency location, and medical features such as Karnofsky score, 7 comorbidities, and prior radion therapy records, among others. For admitted patients, the data also include appointment date, service duration, and an indicator of whether they showed up or not. The capstone score is another piece of information available for each patient in our data set, which we utilize as the “reward” parameter in our model. As remarked above, this score reflects medical benefits, and tends to increase as the patient's life year gains by the therapy are expected to increase, and also as the patient's alternative treatment options beyond proton therapy become limited or less effective.
Scheduling delays
For each admitted patient, we define the scheduling delay as the difference between her scheduled appointment date at the center and her application date (for simplicity, we also refer to application date as “arrival date”). Figure 1 illustrates the boxplot of these scheduling delays, and shows that the majority of the patients have delays in the range of 7 to 154 days (1 week to 5 months). Furthermore, it can be seen from Figure 1 that the first and third quartiles of the scheduling delay are 27 days and 74 days, respectively.
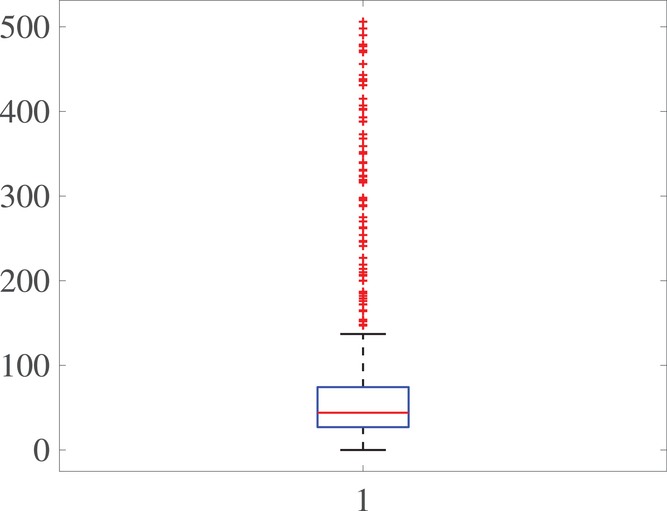
Boxplot for scheduling delays
Experimental setup
As noted earlier, the current practice at our partner hospital involves periodic meetings (with a fixed number of days between meetings as the cycle) among a review panel to determine the patients who should be accepted and scheduled. To design and perform our experiments, we attempt to make assumptions that best represent this and other aspects of the practice at our parent hospital. In particular, following the current practice, we divide our experiment's horizon (481 days) into cycles of equal time periods. For the ith cycle, 


Estimating show‐up probabilities and the number of patient classes
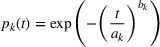
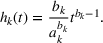
In our data set, about 15% of the patients do not show up in the scheduled time. To accurately estimate our show‐up probability functions, we take advantage of the information available in our data. For a class k patient, we consider the function 


Calculating soft capacity
As our data set does not indicate the duration of overtime operations, we start our analyses by assuming that the system runs with no overtime. This allows us to directly calculate the total operating minutes on each day using our data set. We assume that available capacity equals to this number of total operating minutes on each day. It can be readily seen that this calculation underestimates the actual capacity. Making available to our policy this calculated capacity enables our study then to report conservative estimates about our policy's actual performance. As we will describe later, we also perform simulation analyses by allowing overtime.
Estimating service duration for rejected patients
Our data set only includes service duration for patients who are accepted/admitted by our partner hospital. That is, the potential service duration of the patients who are rejected is not observable to us, simply because they were not admitted (and no treatment plan was designed for them) at our partner hospital. As an alternative policy such as the
Fair comparison with current practice
As noted earlier, with a cycle time of 30 days, the majority of the patients scheduled for the ith 


Performance metrics
We measure reward from providing service to a patient using the patient's capstone score, as it was designed to approximate the center's utility and medical benefits from treating that patient. Then, we measure the performance of the 

Defining classes
Our data analyses show that the following vector of patient characteristics is most significant in predicting show‐up probabilities:

Weighted AUC and expected improvement for different number of clusters
Results
We measure the standard deviation, 95% confidence interval, and the OPT gap for the cases with 
Detailed measurements for 

Overtime considerations
As noted earlier, the data set from our partner hospital (MGH) does not include information about overtime operations. As the 

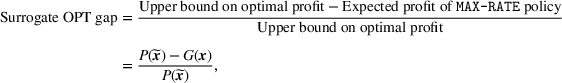
For the purposes of measuring the optimality gap of our policy, note that calculating the optimal profit via (5)–(8) now becomes intractable. Therefore, we instead calculate the optimal value of (12)–(15), which provides an upper bound for the optimal profit, given that 


Profit breakdown for 
Profit breakdown for 

Surrogate OPT gaps on the scaled data set. (a) Surrogate OPT gap with

Sensitivity analysis with synthetic data
To go beyond the case study at our partner hospital, and investigate the suitability of the
To gain deeper insights and have a benchmark, we also measure the performance of another index‐style policy with the following ratio as its index: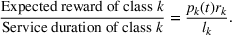
Base case
In the base case, we set the number of patient classes to 


We assume service duration for class 1, 2, …, 5 to be 30, 40, …, 70, respectively. All the patients arrive on the first day of the cycle. The soft capacity and hard capacity for each day are set to 1260 min (


Summary statistics for the base case setting
The effect of load factor
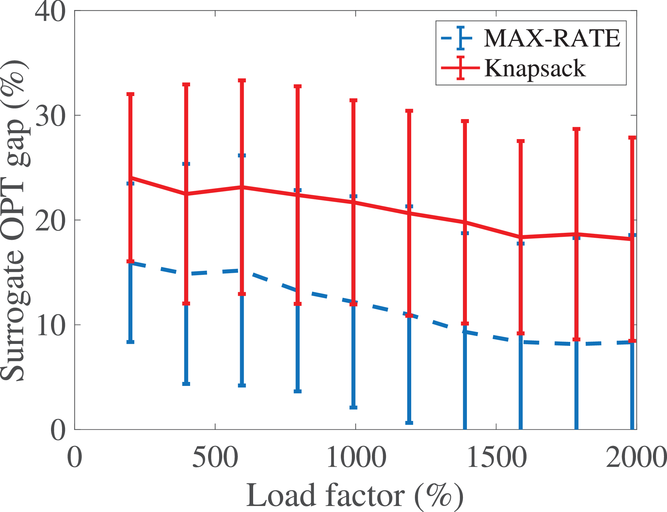
We start our sensitivity analyses by considering the effect of load factor. To examine this effect, we vary the number of arriving patients from 1500 to 6000 with a step size of 500 while keeping the populations of each class the same. The results are shown in Figure 3(a), which indicates that the surrogate OPT gap drops from about 18% to as low as 5% as we increase the load factor from about 200% to 800%. This is due to the fact that, as the number of patients in each class increases, the
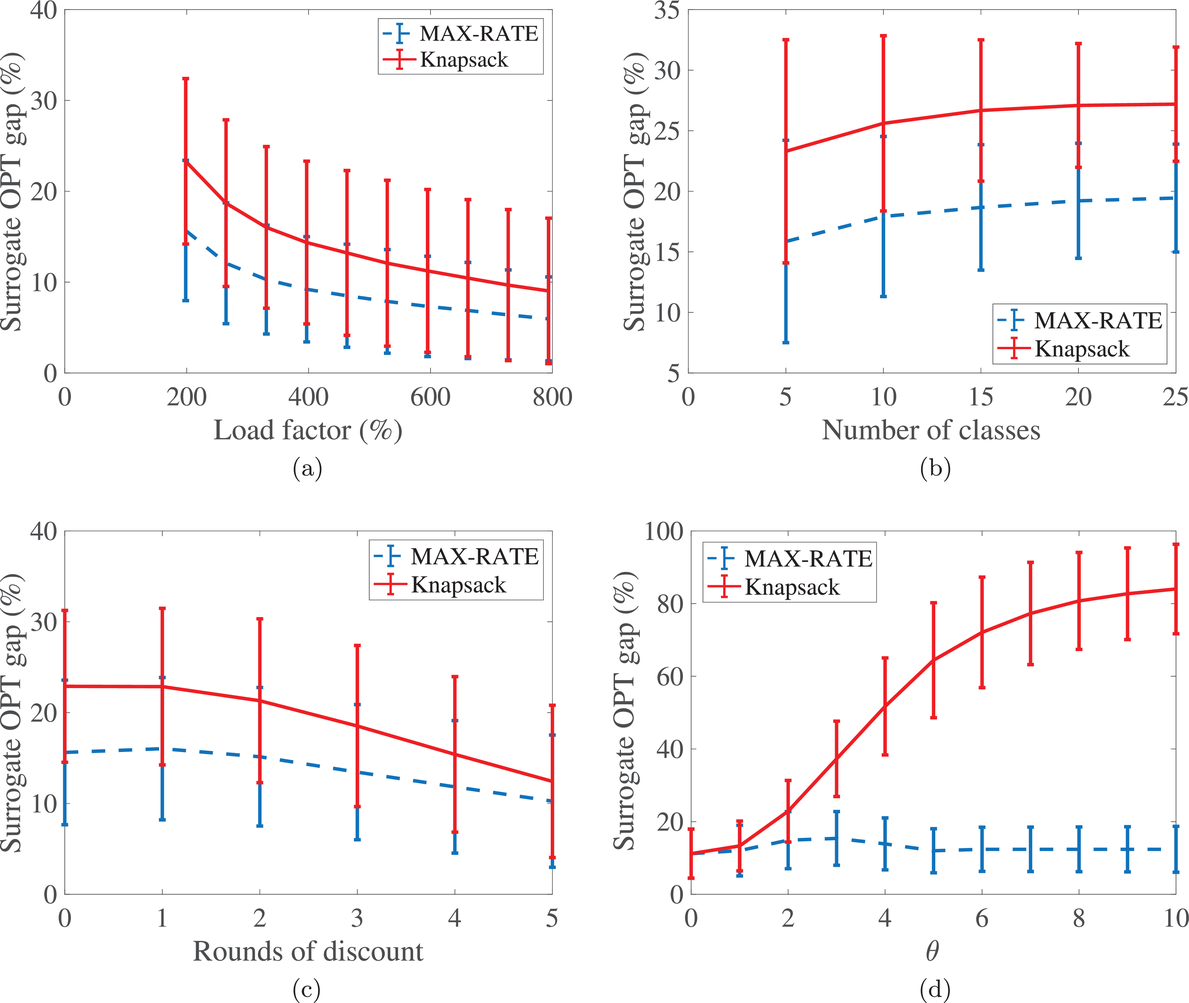
The effect of various parameters on the surrogate OPT gap. (a) The effect of load factor. (b) The effect of the number of patient classes. (c) The effect of no‐show probabilities. (d) The effect of θ
The effect of the number of patient classes
To see the effect of the number of patient classes, we increase the number of classes from 5 to 25 with a step size of 5. In each increment, we keep the service duration of the five new classes as 30,40,50,60, and 70, and the total number of patients unchanged to maintain the same load factor. The results presented in Figure 3(b) show that the surrogate OPT gap increases only about 8% as the number of classes increases from 5 to 25. This indicates that the
The effect of no‐shows
Another factor that varies among hospitals is the no‐show rate of patients. Specifically, some hospitals have a low number of no‐shows while others face significant number of no‐shows. To see the effect of no‐shows, we decrease the parameter 

The effect of overtime cost
The cost of overtime operations depends on various factors. As a result, there is a variation among hospitals in terms of the compensations and other expenses that they incur due to overtime operations. To examine the effect of the overtime cost (parameter θ), we increase it from 0 to 10 with a step size of 1. From the results presented in Figure 3(d), we observe that the surrogate OPT gap first increases from 14% to 18% as θ increases from 0 to 2. It then drops from 18% to 11%, and remains at 10% for any 

EXTENSION: MULTIPLE VISITS
Put together, our analysis and numerical experiments so far reveal that the
In this section, we showcase how one can readily generalize our policy to accommodate multiple visits, and perform numerical analysis that demonstrate that the 


To extend our 


We numerically evaluate the 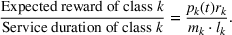
We allow the number of visits of each class to be randomly sampled from the sets 

The effect of multiple visits on the surrogate OPT gap
CONCLUSIONS
Adoption of new technologies enable firms in the healthcare sector to materially improve the quality of the service they offer. Because adoption often requires significant resources, healthcare organizations strive to utilize the available capacity as efficiently as possible. In this paper, motivated by the introduction of proton therapy—a new technology that provides superior treatment for many cancer patients—at our partner hospital (MGH), we studied the problem of admitting and scheduling patients for service in a way that addresses operational issues that arise in this context.
In particular, we presented a model of allocating service capacity in the presence of (a) patient‐ and time‐dependent no‐show behaviors, and (b) overtime operations. To make admission and scheduling decisions, we limited ourselves to simple and interpretable index rules that can be implemented in practice. We proposed a simple index policy, which balances the expected benefit from providing service to patients with the risk of overtime cost. For this policy, we derived analytical performance guarantees that compare favorably with existing results in the literature for the simpler class of generalized assignments problems.
Furthermore, we conducted in‐depth numerical performance analyses using both empirical data from MGH and synthetic data. The analyses revealed that simple rules of the type we propose are capable of efficiently balancing performance and interpretability, and hence, are good candidates for use in practice. Specifically, we found that, while simple and interpretable, our proposed policy was able to (a) substantially improve upon current policies used at MGH, and (b) yield results that are not too far from being optimal. In addition, our results revealed that our proposed policy is robust to a variety of factors that are hard to estimate (e.g., no‐show probabilities) and/or might vary from hospital to hospital (e.g., overtime cost, demand‐to‐capacity ratio, etc.). Thus, it offers a “one‐size‐fits‐all” rule that can be robustly used in practice. Given the importance of devising simple, interpretable, and robust policies that can effectively allocate scarce capacity of new technologies to consumers, we hope that future research continues our efforts in this vein.
Footnotes
1
Penalizing users who do not show up is often not an effective mechanism, as such penalties cannot be very large due to a variety of regulatory constraints (among others). Thus, even when imposed, such penalties are not large enough to offset the opportunity cost accrued due to unused expensive technology. Moreover, in many nonprofit organizations (e.g., some hospitals), there is no tangible financial gain for the service provider that can be gained by imposing a penalty: the wasted capacity simply implies loss of some social good (e.g., treatment that could be offered to a different patient).
2
For simplicity, we refer to all last‐minute cancelations as “no‐shows.” However, the reader should note that in proton therapy there might be several reasons for such cancelations, and some of them can be beyond the patient's discretion not to come. Example for last‐minute cancelations include medical (e.g., sudden changes in medical conditions indicating a need for more chemotherapy or more time to recover from surgery or chemotherapy) and financial (e.g., a much cheaper or logistically more convenient treatment option becoming available).
3
For example, reserved capacity can be first deducted from the available capacity, and the related patients can be removed from the set of patients awaiting capacity allocation. Our proposed allocation rule can then be used for the remaining patients and capacity.
4
For any positive integer Z, we denote the set
5
6
To develop the capstone scoring system, the MGH Proton Center conducted a series of questionnaires, in which physicians were asked to rank hypothetical patients based on the efficacy that they expected proton therapy to have on the patients. Using these as input data, a regression model was fit by the center so as to calculate this score for each applicant.
7
Karnofsky score is a measure between 0 = death and 100 = perfect health, and is typically used in medicine to inform on a patient's general well‐being.
References


Supplementary Material
Please find the following supplemental material available below.
For Open Access articles published under a Creative Commons License, all supplemental material carries the same license as the article it is associated with.
For non-Open Access articles published, all supplemental material carries a non-exclusive license, and permission requests for re-use of supplemental material or any part of supplemental material shall be sent directly to the copyright owner as specified in the copyright notice associated with the article.