
Abstract
We describe the pioneering role of the Production and Operations Management (POM) in promoting empirical research in innovation, operations, and supply chain management. We also review and discuss the most influential empirical papers published in POM based on each paper's Google Scholar citation counts. We selected the top 200 cited papers from the 2085 papers published or forthcoming in POM to identify the most influential empirical papers. We classify these 200 papers into three categories: (a) review and conceptual development, (b) analytical, and (c) empirical papers, and then compare these papers across the categories in terms of citation counts. Next we analyze the 75 empirical papers from the top 200 cited papers published in POM by covered topics, data sources, and data analysis methods. Focusing the analysis on empirical papers among the top 200 cited papers can underrepresent emerging themes among the more recently published empirical papers. Therefore, we also analyze 19 more recent empirical papers from 2016 to 2021 that are not covered in the top 200 cited papers but have been impactful given the brief time since their publication. We conclude by offering our thoughts on how editors, reviewers, and authors can work together to further enhance and ensure the quality and influence of future operations management (OM) empirical science research.
INTRODUCTION
The establishment of Production and Operations Management (POM) coincides with the founding of the Production and Operations Management Society (POMS) in 1989. POM published its first issue in 1992. In the inaugural issue, its founding editor Singhal (1992, p. 2) wrote, “The editors realize that authors have not written articles on certain topics or articles that use certain research paradigms simply because the outlets for publishing them have been limited. In POM, papers do not have to fit into an established mold, follow one of the traditional research paradigms, concern an ‘accepted’ topic, or conform to conventional wisdom.” At that time, two of the leading operations management journals, Management Science and Operations Research, rarely published operations management (OM) empirical research. Among the few papers were two pioneering papers on production and employment smoothing (Holt et al., 1955, 1956).
In the inaugural issue of POM, the lead article employed empirical research; and the first volume had 12 papers containing empirical data, corroborating POM’s strong support of rigorous empirical research from the outset. POM continued to supply robust coverage of empirical research. Gupta et al. (2006) reviewed empirical papers published in POM in the early years 1992 to 2005. From its inception to today, POM continues to publish a wide variety of high‐quality, empirical research; and thereby, it continues to make a clear statement regarding its advocacy for advancing OM empirical science. The early emphasis of the POM in publishing empirical research likely had some positive spillover effects on other leading OM journals. In the mid‐nineties the Journal of Operations Management (JOM) editors decided to focus on empirical research. Manufacturing Service and Operations Management (MSOM), which Institute for Operations Research and the Management Sciences (INFORMS) founded in 1999, also published empirical research and had a special issue dedicated to empirical science (see Fisher, 2007; Roth, 2007).
To celebrate POM's last 30 years, we highlight the most influential empirical papers it published, based on each article's overall citation count. For semantic clarity, citation counts capture a paper's relative influence on its impact and relevance. Still, they do not reflect any other measures of research quality, such as the peer‐reviewed papers accepted (Aksnes et al., 2019), a criterion that all POM published articles have met. We first characterize the broader influence of the top 200 out of 2085 papers in POM since its first volume. Following the successful startup of POM in the early 1990s, the OM community expanded its research domain from a dominant focus on theoretic analytic modeling to embrace high quality empirical research with or without analytical modeling. Yet, as empirical research became more widely accepted in the OM community, other OM journals started ramping up their acceptance of empirical publications (Roth, 2007; Roth et al., 2008).
Of top 200 cited papers in POM, we classified 75 as empirical. We ask these four questions to understand better the relative influence of empirical research in POM based upon citation counts: (1) How does empirical research in POM stack up against analytical and review papers, respectively, in terms of citations? (2) Of the 75 top‐cited empirical papers, what generic general topics appear to be the most amenable to empirical scrutiny? (3) What were the predominant data sources for each of the top empirical papers? Because total citations can grow over time from prepublication access to 2021, we also ask this question. (4) Are the observed patterns of dominant themes overall versus those in the past 5 years “sticky”?
BACKGROUND ON THE NATURE OF EMPIRICAL RESEARCH
The body of rigorous empirical research embodies a variety of scientific approaches (Roth, 2007), which collectively cover the gamut within two basic types: (1) “Qualitative methods” are typically employed to induce theory or form logical inferences. Take, for example, the following types: case and observational field studies, interviews, focused groups, and textual analyses of narratives and historical accounts, among others. Qualitative research is a critical source of propositions that offer general statements of derived associations. (2) “Quantitative methods” typically draw upon theoretical foundations and well‐formulated hypotheses to evaluate an existing theory or observations. 1 Quantitative approaches take on multiple forms of data collection, including natural (causal‐comparative research) and controlled experiments, survey research, data scraping, and secondary data sources. The resulting data are inputs into econometric and other statistical models to test theories and inform their boundary conditions to OM practices, strategies, and policies. The body of OM empirical studies collectively investigate OM's proverbial “good, bad, and ugly” from the cradle to the grave (e.g., best practices and interventions to operational risks and unsustainable strategies).
Interestingly, one of the most central themes across the study's review papers is that the empirical reach of papers, which shed insights into significant OM problems, is long and wide. Consider the following: (1) It's reach spans all types of organizations (e.g., for‐profit and the not‐for‐profit sectors in manufacturing, service, or hybrid organizations and focal firms’ upstream and downstream global supply networks. (2) It also covers a diversity of internal operating system types, for example, job shops versus flow shops accompanied by an everchanging stream of technological and software systems, which are increasingly extensive in scope. Operating systems span entities from small to large to conglomerate global organizations and networks; and they include a multiplicity of ownership structures in every sector (e.g., private, public, franchised firms, and not‐for‐profit and government entities). Thus, the degree and intensity of variability is significantly heightening an entity's complexity in its social–technical interactions among its upstream and downstream institutions or industries and customers in its value chain.
Rigorous empirical scrutiny of particular OM phenomena also means the researcher must choose appropriately from a vast array of choices, including the following: (1) a qualitative or quantitative approach, (2) the unit of analysis and target population, and (3) if needed, an appropriate sampling frame for addressing the research questions (e.g., workers, customer, machine/specific technology [e.g., stand‐alone, systems, platforms], organizational levels [e.g., employees, middle management, C‐suite Division], single or multiple sites at local, regional, national or global). OM issues needing resolution are ubiquitous, dynamic, and complex. Yet, our OM empirical research base continues to capture and inform the transformational aspects of both the “hard” (technical, brick, and mortar) and “soft” (behavioral and infrastructural) components of OM.
RESEARCH APPROACH
Measuring influence
Given that recent reviews of empirical OM research have focused on publication trends and methodologies, and approaches, it would be repetitive in this paper to conduct a similar analysis for the empirical research published in POM. Instead, we focus this article on the influence of POM empirical papers as judged on citation counts. We do so with this caveat: Citation counts are a good objective measure for this research, but we recognize they include only one coarse proxy for assessing overall research quality, a multidimensional construct. It is argued that citations reflect aspects related to scientific impact and relevance. On the contrary, there is no evidence that citations reflect any other key dimension of research quality … [C]itation indicators in research evaluation and funding may imply less attention to these other research quality dimensions, such as solidity/plausibility, originality, and social value. (Aksnes et al., 2019, p. 1)
We also note that citation counts will vary from one discipline to another and across OM‐based journals (Waltman, 2016). Therefore, using citations solely for POM papers reduces this variability, and so, we avoid the need to apply normalizing techniques for comparing citations across OM journals.
We use the number of Google Scholar citations as the primary measure to gauge each paper's influence, reflecting impact and relevance (Section 4). In reviewing the implications of empirical research in POM, we focus on four sets of analyses: First, we provide an overview of the overall influence of POM that includes papers of all types published from 1992 to 2021 (Section 4.1). Second, we selected the top 200 cited papers published in POM. We classify these 200 papers into three categories: (a) review and conceptual development, (b) analytical, and (c) empirical papers. We then compare papers across categories in terms of citations (Section 4.2). Third, we analyzed the 75 empirical papers from the top 200 cited papers published in POM. Section 4.3 examines these papers by covered topics, data sources, and data analysis methods. Fourth, focusing the analysis on empirical papers among the top 200 cited papers can underrepresent emerging themes among the more recently published empirical papers. To address this particular issue in Section 4.3, we analyze 19 more recent empirical papers from 2016 to 2021 that are not included in the top 200 cited papers but have been impactful considering their recent publication. In addition to the quantitative impact analyses of empirical papers, we offer our thoughts on how authors and reviewers can work together to enhance the quality and impact of future empirical research (Section 5). We predicate our ideas on our wide range of experiences as authors and as journal reviewers, senior and department editors.
Data collection procedures
We compiled a comprehensive database of papers in November 2021 that represented POM’s 30th anniversary. First, Wiley‐Blackwell, the publisher of POM, provided a master list of all papers that appeared in POM from 1999, Volume 1, until November 2021, Volume 11. We exclude biographical items, corrections, editorial material, and proceedings papers. The list also had 70 early access papers that we added to the citation count total for 2021. However, this list was incomplete for our purposes as it excluded earlier POM papers. Therefore, to ensure full 30‐year coverage of the papers in our database, we first made a list of all papers from 1992 to 1998 and manually reviewed each one.
Second, we obtained the information on each paper's Google Scholar citations from Publish or Perish. Publish or Perish is a software program that uses a variety of data sources to retrieve and analyze academic citations and presents several citation metrics such as total citations, citations per year, and indices such as the h‐index (see
Third, we merged the list of papers with the citation information to create a complete citation information database for all POM published or early access papers. Although we have exercised great care and effort in assembling the database and believe that we have identified all papers, it is still possible that we may have missed a few. Nonetheless, it is unlikely to affect the insights from our high‐level impact analyses.
RESULTS
Summary statistics on overall impacts
Using our comprehensive database, we now offer summary statistics. Figure 1 depicts the total number of papers published in POM over time. Until 2014, the journal had two periods of capacity constraints. From 1992 to 2006, POM was a quarterly publication, and the number of papers published per year averaged about 28. From 2007 to 2013, POM switched to bimonthly publications, and the average almost doubled to about 55 articles per year. To accommodate the increasing number of submissions, POM started publishing monthly beginning in 2014 to the present; and the average number of papers published per year rose threefold over the bimonthly issue period to about 154. The 287 articles published for 2021 incorporate papers up to November 2021 plus 70 early access papers that have yet to appear in print. In total, POM has published 2085 papers. As shown in Figure 1, the growth in annual publications is bound by the two episodic caps on annual page limits—and not necessarily capturing the natural evolution of submissions and accepted papers. Without those caps, it is reasonable to assume the yearly publication totals would be greater than the actual recorded.
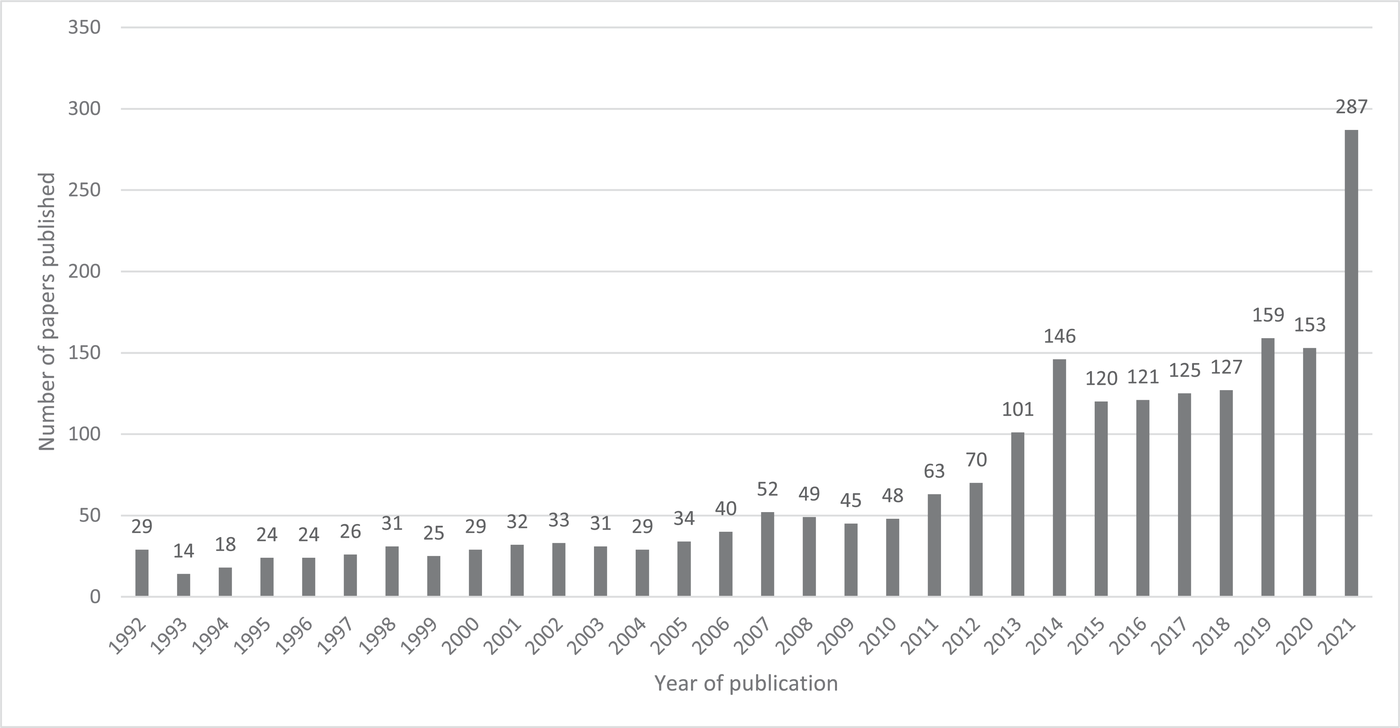
Number of papers published in POM by year. Notes: POM was a quarterly journal from 1992 to 2006, bimonthly from 2007 to 2013, and monthly from 2014 to the present. The total number of papers published over 30 years is 2085. The number of papers for 2021 includes all papers published from January 2021 to November 2021, including 70 early access papers.
Figure 2 presents the percentile distribution of Google Scholar citations for all the 2085 papers. About 1% of the papers each have 652 or more citations, and 10% have at least 143. The mean and median citation counts are 62 and 23, respectively. Figure 3 presents the percentile distribution of the citations per year. About 1% of the papers each have 52 or more citations per year, 10% have at least 16 per year. The mean and median citations per year are 7 and 4, respectively.
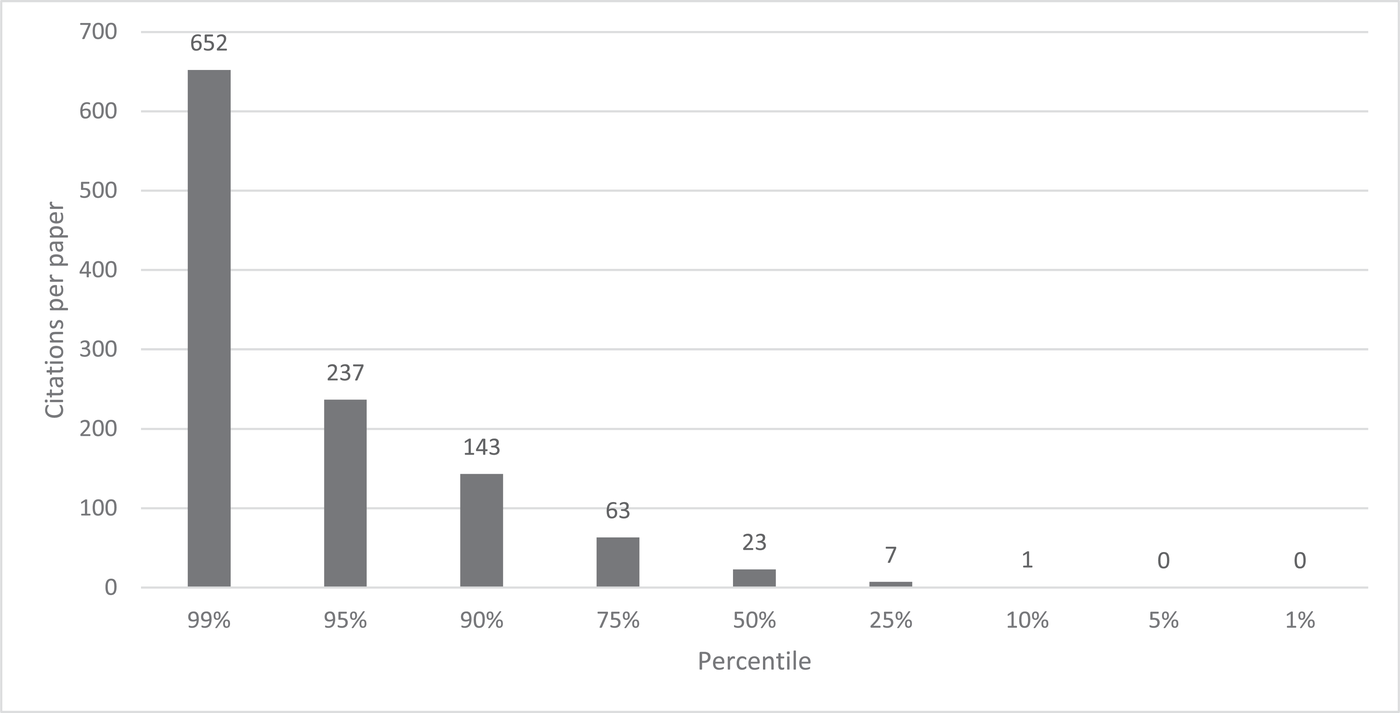
Percentile distribution of citations per paper from publication through 2021 of all 2085 published or early access papers in POM
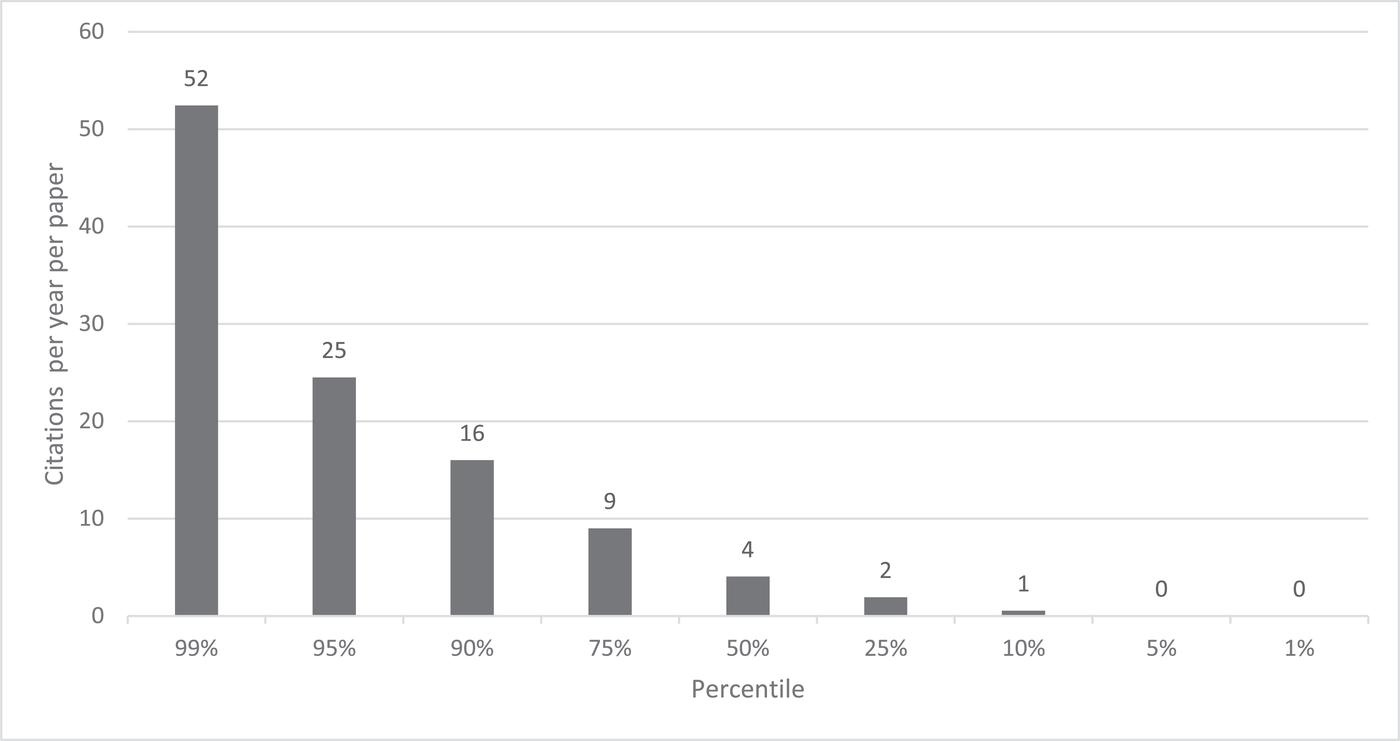
Percentile distribution of number of citations per year per paper of all 2085 published or early access papers in POM
Table A1 in the online supplement, Supporting Information A, lists the top 200 POM papers based on total citations. Of the top 10 cited papers in POM, four are classified as “empirical.” Kleindorfer and Saad (2005) with 2355 citations ranks first, and is followed by Hendricks and Singhal (2005) with 1393 citations; Bowen et al. (2001) with 1176 citations; and King and Lenox (2001) with 1095 citations. Of the remaining six top 10 cited papers, four are classified as “review and conceptual development.” Of these, Kleindorfer et al. (2005) lead with 2054 citations, which is followed by Cayirli and Veral (2003), with 1189 citations; Spohrer and Maglio (2008), with 1024 citations; and Sampson and Froehle (2006) with 1024 citations. Two of the top 10 papers are classified as “analytical.” Fleischmann et al. (2001) leads with 1093 citations and is followed by Tsay and Agrawal (2004) with 1040 citations. The top 10 most cited papers occurred between 2001 and 2006, coinciding with the early interest in our field to grasp emerging topics and methods and is coupled with the longer length of time since then to garner citations. Notably, the four empirical papers, with Kleindorfer and Saad (2005) taking the top spot overall, and four review and conceptual development papers dominate analytical papers in terms of citations. The top four highly influential empirical papers, in part, lend credence to the expanded acceptance of OM empirical research in POM from the early 1990s. Conceptual and theory‐building review papers are the catalyst for defining and structuring OM issues, and they point to gaps that present opportunities for early empirical inquiry.
Description of POM’s top 200 cited papers
Having presented the summary statistics on the overall impact of POM, we now offer a more detailed analysis of the top 200 cited papers. Focusing on the top 200 cited papers ensures a sufficient sample size to capture the depth and breadth of the types of influential articles published in POM. Collectively, these papers represent about 10% of the papers published in POM. The detailed review of these 200 papers aims to identify the representation of empirical research among the top articles published in POM and the relative size of its impact versus other methods. Naming the top empirical papers is also necessary to collect information on the diversity among empirical papers on various dimensions, including topical areas covered, data sources used, and data analysis methods employed.
The mean (median) citations of the top 200 cited papers is 351 (239). The earliest year represented in this sample is 1992 (four papers), and the latest year is 2018 (three papers). Notably, assessing impact takes time. The average age of the top 200 papers is 15.5 years. The mean (median) citations per year is 25 (20). Next, we reviewed all 200 papers and classified them by their most dominant method used into one of the following three mutually exclusive categories (see Table 1): Review and conceptual development (45 papers). This category includes “review and conceptual” papers summarizing the literature and often showing current research gaps or developing a framework guiding future research. Most of these papers are qualitative, with some papers using real examples to support or illustrate the concepts or framework. This category's top three papers are (a) Kleindorfer et al. (2005), who review sustainable operations research published in POM; (b) Cayirli and Veral (2003), who synthesize the literature on outpatient scheduling in health care; and (c) Spohrer and Maglio (2008), who lay out the background for the growing demand for service research and the need for research to develop service science. Analytical (80 papers). This category includes four papers that (a) evaluate a model's performance using simulation or (b) develop a simulation model. Some analytical papers use actual data to demonstrate a model's value or to conduct numerical analysis. This category's top three papers are (a) Fleischmann et al. (2001), who develop a model to analyze the impact of product return flows on logistics networks; (b) Tsay and Agarwal (2004), who analyze channel conflict and coordination in an e‐commerce setting; and (c) Ferguson and Toktay (2006), who study the effect of competition on product recovery strategies. Empiric (75 papers). The number of empirical studies in the top 200 cited is about the same as the “analytical” category. This number is both surprising and encouraging. It is surprising as analytical research has long been the dominant paradigm of OM research. Thus, we did not expect this empirical category to almost reach parity with the number of top analytical papers. It is also encouraging as the data show that not only is the pace of empirical research steadily increasing, but also their greater mean citations as discussed below. Thus, POM is publishing impactful, empirical research. We derive our analyses of empirical papers in Section 4.3 solely from this top 75 group.
Summary statistics for top 200 cited papers by methods
Table 1 also presents summary statistics for the three categories of papers, including citations. The mean age of both “review and conceptual” and “empirical” categories is about 17 years, while it is 14 years for analytical. While the “review and conceptual” category has higher citations than the analytical or empirical groups, more citations accrue to empirical papers than analytical papers. The mean (median) citations of empirical papers is 369 (237), 25.5% higher than 294 (228) for analytical papers. The mean (median) citations per year of empirical papers is 25 (20) and 23 (21) for the analytical papers.
Analysis of the 75 empirical papers in the top 200 cited papers published in POM
This section provides more details about the 75 empirical papers among the top 200 cited papers published in POM. Figure 4 plots the distribution of the year of publication of the 75 papers. The earliest publication year is 1992, the first year of POM. The two papers published in 1992 are Christensen's classic technology S‐Curve papers (1992a, 1992b). The latest publication year is 2018, with two papers. One paper is by Srinivasan and Swink (2018), who study how demand and supply visibility is associated with developing analytical capabilities. The other is by Cui et al. (2018), who examine how social media can improve operational efficiency performance. Both these papers address emerging topics and issues at that time; and it is commendable that they have made it to the top list of empirical papers in a short span of 3 years.
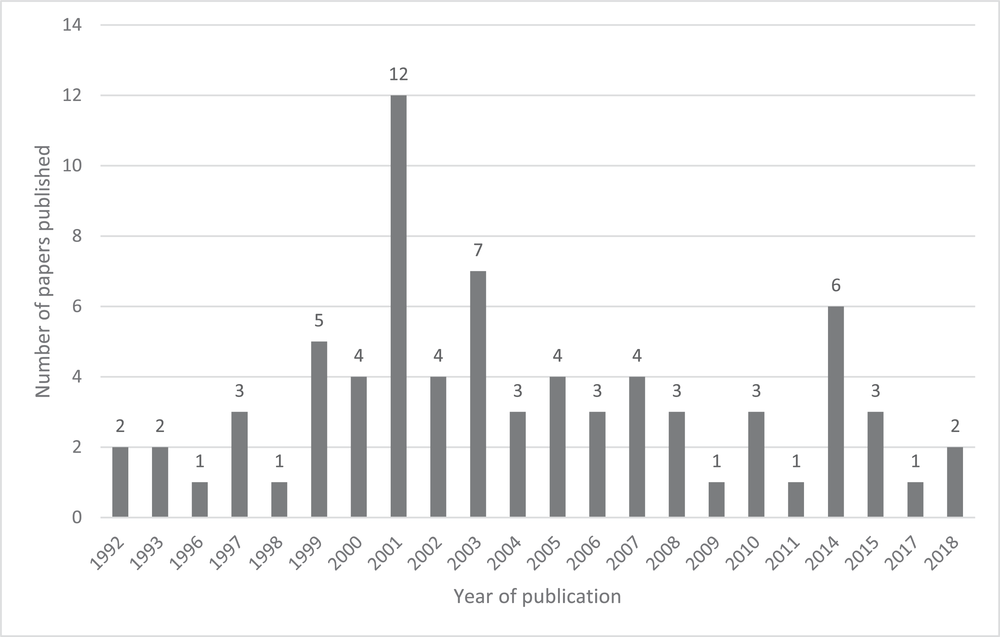
Distribution of the number of papers published by publication year for the top 75 cited empirical papers
Interestingly, 2001 had 12 of the top 75 empirical papers published, the highest yearly. In 2001, POM published two special issues on Environmental Management and Operations Management edited by Charles Corbett and Paul Kleindorfer. These two issues attracted empirical papers influential in motivating research on environmental issues. Rounding out the top three publication years for the 75 empirical papers, POM published seven in 2003 and six in 2014.
We reviewed each of the top 75 empirical papers to collect information about generic types of topics and nature of the data source covered. Tables 2 summarizes statistics by ten broad, topical categories. We now briefly discuss the top four topical areas. Responsible Operations (18 papers): accounts for the highest number of empirical papers out of the 75 papers. It covers environmental management, sustainability, social responsibility, humanitarian efforts, and remanufacturing papers. The mean age of the papers is 15 years. Authors heavily cite POM papers covering responsible operations papers, with the highest rank in overall mean (median) citations of 463 (375). The top two papers on this topic are: (a) Bowen et al. (2001), who consider critical supply chain capabilities for ensuring “green” supply; and (b) King and Lenox's (2001) examination of the relationship between lean production and environmental performance (2001). These two papers account for 1176 and 1095 citations, respectively. Supply Chain Management (14 papers): It is the second most addressed empirical research topic. Notably, this topic is broad and includes papers on the bullwhip effect, risk management, information sharing, capabilities, and partnership building, purchasing competency, and supply chain finance. The mean age of the papers is 16 years, which are heavily cited with mean (median) citations of 457 (223). The top two papers on this topic are Kleindorfer and Saad (2005) and Hendricks and Singhal (2005). Both papers deal with the issue of supply chain risk management. These two papers account for 2355 and 1393 citations, respectively. Manufacturing Strategy (10 papers): As the third most cited topic among the 75 empirical papers, it includes subtopics like developing and implementing manufacturing strategy, elements of manufacturing strategy such as flexibility, building mass customization capabilities, just‐in‐time manufacturing, and business process reengineering. The papers are a bit older, with a mean age of 19 years, reflecting that earlier empirical work in OM was in manufacturing strategy. The mean (median) citations for papers on this topic is 338 (288). The top two papers on this topic are (a) Boyer and Lewis (2002), who examine whether there is a need for trade‐offs among competing priorities in developing operations strategy; and (b) Anand and Ward (2004), who discuss how the fit between different environmental dynamism and manufacturing flexibility affects performance. They account for 856 and 434 citations, respectively. Quality management (seven papers): As the fourth most researched topic among the 75 empirical papers, quality was one of the earliest areas of empirical research in POM. Five of the seven papers on this topic appeared in 2001 or before, as Japanese manufacturing proved that cost and quality are not trade‐offs (Giffi et al., 1990). Thus, TQM gained momentum in U.S. manufacturing. The mean age of the papers is 18 years. The mean (median) citations for papers on quality management is 370 (234). POM published the top two papers on this topic in 1999. Dow et al. (1999) examine the issue of whether firms need all of the quality management practices to achieve superior quality performance; and Anderson et al. (1999) explore whether firms seek ISO 9000 certification due to regulatory compliance or instead to gain a competitive advantage. Their respective citation counts are 924 and 615.
Summary statistics for 75 top cited empirical papers by generic topics covered in the 75 top cited empirical papers
Note: Papers were classified into only one of these categories based on the dominant topical theme of the paper.
Six other topics covered by the 75 empirical papers include the interface between operations and information technology, product development and innovation management, service management, and inventory management. Two papers, Gu and Ye (2014) and Cui et al. (2018) explored the role of social media in improving operational performance. They both cover an important emerging area for empirical research, especially given the growing presence of social media in the daily lives of individuals and firm operations. It enables firms to connect directly with its customers. Furthermore, social media firms have developed a repository of rich data sources for empirical research.
For each of the 75 papers, in Table 3, we show the main data sources used in the empirical analyses: (1) primary, (2) secondary, and (3) hybrid (e.g., both primary and secondary). Table 3 shows that primary data are the main data source of two‐thirds (50) out of the 75 papers. Of these, we find POM publishes papers that represent both quantitative and qualitative research. Of these 50 papers, 60% (30 papers) employ surveys research, 18% (nine papers) case studies, 16% (eight papers) experiments, and 6% (three papers) interviews. Some papers may incorporate more than one data source. For example, we found survey research papers that incorporated supplemental interviews, which are typically among first steps (1) for designing relevant surveys for the sample population of interest and (2) in interpreting managerial implications of the results. A few papers also mentioned archival data or company records as the second data source.
Summary statistics for 75 top cited empirical papers by data source
Secondary data are the primary source of data in 18 papers. Of these, one‐third (six papers) reported using data obtained directly from firms; 16% (three papers) from publicly available financial databases, for example, Compustat and CRSP; Environmental Protection Agency (two papers); industry (two papers). Also, authors collected secondary data from other sources like web crawling (two papers), Information Week (one paper), Kinder, Lydenberg, and Domini (KLD) (one paper), and United States’ Industrial Production Index (one paper). Seven hybrid papers incorporated data from both primary and secondary sources.
Table 3 reports the citations by type of data used. The mean (median) citation counts for papers based on secondary data is 527 (281), higher than 322 (233), the mean (median) that are from primary data. The mean (median) citations per year of papers based on secondary data is 37 (26), which is higher than 22 (17), the mean (median) based on primary data. While papers based on secondary data are more likely to receive more citations due to their perceived validity; Roth et al. (2008) point out measurement and other issues with secondary data that authors should consider.
Gupta et al. (2006) lists the various data analysis methods used by the empirical papers in POM during 1992–2005. For more details, figure 6 of their paper provides a tabulation of the approaches. Since our list is similar to theirs, we chose not to tabulate this information.
Analysis of the highly cited empirical research published during 2016–2021
We derived the subset of 75 top empirical papers analyzed above from our list of the top 200. Since papers published earlier are likely to have more citations than papers published later, therefore, selections based on the total citation counts of the more recent empirical papers versus the earlier ones will be underrepresented in terms of impact. For example, Figure 1 indicates that although POM published 970 papers from 2016 to 2021, only three of them made it to the set of 75 empirical papers that we previously analyzed (see Figure 4). To address this underrepresentation of more recently published empirical papers, we separately analyze 19 empirical papers from 2016 to 2021, excluding the top 75 cited empirical papers.
We find these 19 empirical papers using the following steps. First, we identified 965 POM papers published from 2016 to 2021, which are distinct from the top 200 cited papers. We chose 50 or more citations as a reasonable lower limit baseline indicator that POM publications during the last 5 years (hereafter, recent papers) have been impactful. Of the 965 papers, we found 59 with 50 or more citations.
Second, of the remaining 906 papers, we further select papers that have more than 20 citations per year, corresponding to the median of the Top 200 (Table 1). Using citations per year as a selection criterion is an attempt to include papers published in the last few years, which are being cited but may have not yet reached the 50‐citation count threshold. Twelve of the most recent papers met a criterion of 20 or more citations per year. Thus, the selection process in steps 1 and 2 above resulted in 71 papers.
Third, we analyze these papers using the same procedures used to analyze the 200 most cited papers. Highlights of these more recently published 71 papers are as follows: (1) Thirteen of the 71 (18%) papers were published during 2020–2021, 24 (34%) during 2018–2019, and 34 (48%) during 2016–2017. (2) The mean (median) citations of the 71 papers is 67 (65). Notably, the mean (median) citations per year is 24 (21) is remarkably similar to the mean (median) citations of 25 (20) per year in the top 200 cited papers. It is plausible that a subset of these 71 papers could garner significantly more citations over time. (3) We find that almost one‐quarter (17) of the 71 papers were “review and conceptual,” 49% (35 papers) “analytical,” and 27% (19 papers) “empirical.”
The relative difference of 1.5% between percentages of “review and conceptual” papers is negligible. Yet, there is a notable juxta positioning of the “method category” distributions between the top 200 and most recent 71. For the “analytical papers,” the top 200 had a lower percentage (40%) than the most recent (49%); and for “empirical” papers, the top 200 had a higher percentage (38%) in contrast to the most recent (27%). Next, we selected the top five with the highest citation counts from the 71 recent papers (2016–2021). None are empirical papers. Two are “review and conceptual development” papers, that is, Choi et al. (2016) with 130 citations and Hastig and Sodhi (2020) with 129 citations, and three are “analytical papers,” that is, Tan and Carrillo (2017) with 122 citations, Esenduran et al. (2017) with 117 citations, and Tian and Jiang (2018) with 113 citations. Thus, for POM, there appears to be a backward shift in the more substantial influence of analytical research versus empirical research.
Of the 71 most recent papers, we analyzed 19 empirical papers using the same process used for 75 most cited empirical papers in the top 200. Highlights on these 19 empirical papers are given below: The mean (median) total citation counts are 70 (70). The mean (median) citations per year is 17 (18), which is lower than the mean (median) citations per year of 25 (20) from 75 most cited empirical papers. Responsible operations (four papers) and product development and innovation management (four papers) are tied as the two most influential recent topics, each standing for 21% of the 19 papers. In contrast, supply chain management, service management, and inventory management have two papers, and each stands for 10.5% of the 19 recent papers. Using the same topical counts in Table 3, we calculate that the responsible operations and new product development, the top two topics included 24% and 8%, respectively, out of the 75 published empirical papers. Supply chain, service management, and inventory management correspondingly had 18.7%, 8%, and 5.3% of the top 75 papers. Contrasting these relative percentages with the most recent 19, we discern the following differences. We see a slight recent decline (net −3 loss) in the percentage distribution for responsible operations and a substantial recent rise (net +13 gain) in influence for new product development and innovation management. Similarly, surprisingly, we discover the most recent papers supply chain make up 10.5% of papers, which is down (net −8.2%), reflecting a steep decline in supply chain papers. Seven out of the 19 recent papers (37%) are based on primary data sources whereas 9 out of 19 papers (48%) are based on secondary data sources. This distribution is quite different from the distribution of data sources for the 75 most cited empirical papers where 67% of the papers are based on primary data sources and 24% of the papers are based on secondary data sources. It is unclear if this finding is indicative of a trend toward using more secondary data, which is consistent with the increasing use of econometric modeling in OM. The top three cited empirical papers from these 19% papers are Moshtari (2016) with 106 citations, followed by Abbey et al. (2017) with 99 citations, and Chan et al. (2016) with 98 citations.
To close our analysis of the impact of the empirical papers, Panel A of Table 4 lists the top 10 cited empirical papers published during 1992 to 2021 from the list of 75 empirical papers. Panel B lists the top five cited empirical papers published during 2016 to 2021 from the list of 19 recent papers. We hope this list is informative, and both researchers and practitioners have the opportunity to read these POM papers and appreciate their impact on the OM field.
List of top cited empirical papers published during 1992–2021 and 1996–2021
ENHANCING THE INFLUENCE OF OM EMPIRICAL RESEARCH
Our analysis shows that the pace of empirical POM research is steadily increasing, as is its relevance and impact. To continue this encouraging trend of empirical OM research, we offer our thoughts that will enhance future OM empirical research's impact, relevance, and scientific rigor. Specially, we encourage authors, reviewers, and editors to consider the following four empirical issues to improve quality and evaluate submissions when considering acceptance of empirical papers and their potential influence on the profession and practice.
Empirical findings are obvious and not surprising: Effect sign and size
The call for researchers to report and interpret effect sizes and their corresponding confidence intervals has never been stronger. … We define effect size as a quantitative reflection of the magnitude of some phenomenon that is used to address a question of interest. (Kelley & Preacher, 2012, p. 137)
During the review process, authors may receive comments that a paper does not discover anything unexpected and that the main results are intuitive and unsurprising. Such statements are sometimes made about findings where null hypotheses significance tests indicate that the effect signs (−/+) are so obvious that there is no need to explain it theoretically or empirically confirm them. But what may not be expected or intuitive are the sizes of the effects. Yet, the size of the effects and their confidence intervals are indicators of a variable's practical importance.
As an analogy, we intuitively or anecdotally know things that are obviously “good” or “bad.” Take the following examples. We know that natural disasters are “bad” because they are destructive. They often result in unimaginable harm to their victims’ lives and livelihoods and the surrounding infrastructure (e.g., roads, bridges, and utilities). We also know that cancer can kill. But for research findings to be influential on these issues, it is imperative to empirically document the extent of the negative consequences of natural disasters or the fatality rate from a particular type of cancer. Thus, the magnitude of the effect size and its confidence intervals help us figure out whether one should respond aggressively to these issues (e.g., act fast and where and how to distribute scarce resources). For example, evidence on the size of impacts of natural disasters has influenced the level of investment in infrastructure, raising awareness among communities on how to react to disasters, and building quick response capability to deal with natural disasters. The fatality rates of different cancers influence where to allocate R&D dollars in finding a cure. Therefore, if authors discuss statistically significant effects merely in terms of their signs and p‐values, they convey a belief to the reader that certain things are “obviously” good or bad. In contrast, if the authors discuss the effect size of how good or bad the effects are, the results can be a catalyst for change.
Prior experience with our research and interactions with managers and policymakers indicate that they will pay attention to the effect size of the impact, and business publications are more interested in reporting the size. Consequently, they increase the odds of a paper's dissemination to practitioners and the likelihood of media coverage. Reporting similar comparative information on effect sizes from research using results from other papers dealing with similar research can influence OM research.
Furthermore, authors providing statistics (e.g., confidence intervals) related to the effect sizes lay the foundation for future meta‐analyses, which can establish the robustness of its effect sizes across multiple relevant studies (see Rosenzweig & Easton, 2010). Or, if a study covers various industries, geographic regions, plants, supply networks show statistically significant differences in a variable's effect sizes can supply future researchers information concerning boundary conditions for theory development and practice. Over time, these studies contribute to the overall OM knowledge base. Through the lens of Kuhnian logic (see Roth & Rosenzweig, 2020), encouraging such papers is also essential for building up an empirical OM observational research base, and more so if its central findings buck conventional wisdom on significant theoretical contribution. Focusing only on the sign and statistical significance of the effect size is insufficient. It does not provide a complete picture, as trivially small and economically inconsequential effects can be statistically significant with large sample sizes. Conversely, large, and financially consequential effects can be statistically insignificant with small sample sizes.
The significance of publication bias in research
Publication bias, the phenomenon in which studies with positive results are more likely to be published than studies with negative results, is a serious problem in the interpretation of scientific research. Various hypothetical models have been studied, which clarify the potential for bias and highlight characteristics which make a study especially susceptible to bias. Empirical investigations have supported the hypotheses that bias exists and have provided a quantitative assessment of the magnitude of the problem. (Begg & Berlin, 1988, p. 419) There is increased concern about poor scientific practices arising from an excessive focus on P‐values. Two particularly worrisome practices are selective reporting of significant results and P‐hacking. The latter is the manipulation of data collection, usage, or analyses to obtain statistically significant outcomes. (Chuard et al., 2019, p. 1)
Unfortunately, some journal editors and referees may view the lack of statistical significance as unimportant and not worthy of publication. Thus, authors face a conundrum when their key findings are nonsignificant after taking much time and effort to collect and analyze empirical data. There are several reasons why OM journals should be open and receptive to papers that find insignificant results. First, we can better understand what works or does not work; and journals’ editorial policies, whether explicit or implicit, do not unintendedly force authors to take steps to “make the paper appear more acceptable.” Thereby, the current editorial policies of OM journals should explicitly reinforce and encourage authors to provide more robust, unbiased scientific empirical research that may confirm or refute prior‐related research and refinements. Second, insignificant results can indicate new or unexpected findings, challenge conventional wisdom, motivate further investigation, and mostly advance scientific inquiry. Third, it is as important to let practitioners know what does and does not matter. Knowledge of what does and does not matter can lead to improved effectiveness of resource allocation. Further, when the results are insignificant, the managerial implications can differ.
Willingness to publish insignificant results can also mitigate other publication biases. Kerr (1998) describes a questionable data mining strategy called Hypothesizing After Results are known or HARKing. In one version of HARKing, authors go hunting without a map of what they plan to investigate and subsequently go to extremes to find statistically significant effects through one or more forms of data manipulation, and then try to make post hoc formal hypotheses. Another type of questionable data mining is “selective reporting” or “cherry picking” of results or searching for statistically significant results (Chuard et al., 2019). These types of workarounds add significantly to “publication bias” in scientific academic inquiry. Franco et al. (2014, p. 1502) describe the adverse impacts of publication bias in social sciences and report the following: “[W]e provide direct evidence of publication bias and identify the stage of research production at which publication bias occurs: Authors do not write up and submit null findings.” OM scholars embarking on empirical research should understand the severely perverse effects of publication bias on the diminution of the scientific value not only their own research but also more broadly on our OM discipline. Rather than HARKing, authors, editors, and reviewers, should know that there is nothing wrong with hypotheses generated from exploratory empirical research, and require authors to always disclose those details fully. Moreover, reviewers should refrain from asking authors to generate new post hoc hypotheses, unless the research is explicitly stated as exploratory.
Focus on the consistency of the results
One of the most common arguments against a scientific finding is confirmation bias: the scientist or scientists only look for data that confirms a desired conclusion. Confirmation bias is remarkably common … [The] deliberate use of confirmation bias is held in low esteem by scientists and allowing confirmation bias to get the better of your results is a particularly sad form of incompetence. (Lee, 2010, p. 1)
Most first submissions of empirical papers will report the results of one or more statistical tests. It is natural for reviewers to comment on a first submission and request changes that require the authors to make substantial changes to the analyses presented. For empirical research, our experience is that the final paper will have more iterations of analyses from one or more rounds of revision and comments from multiple reviewers. These added analyses can include segmenting the sample in new ways, collecting new data, and adding and subtracting variables incorporated in the study model(s). Furthermore, the authors conduct other robustness tests by running the results for different periods, different firm characteristics, and using different methodologies.
While the added analyses and results add to the rigor of the empirical research, not all the results and tests in the review process will align perfectly. If the paper is about the failure to reject the null, there can be instances of Type I errors with multiple tests, where the results incorrectly reject the null. Similarly, if the paper is about rejecting the null, there can be instances of Type II errors with multiple tests where the authors incorrectly fail to reject the null. We mention this because reviewers often focus on the results that do not line up perfectly to the hypothesized expectations, and will request explanations and additional analysis for the results. This quandary may put authors in a tough spot and seem unreasonable if the results are consistent or inconsistent with the original paper, potentially resulting in confirmation bias. Thus, we recommend that reviewers should focus on the overall consistency of the results from the original paper to the final revision. Authors can also apply statistical tools to enhance the decision making to confirm (or disconfirm) the likelihood of consistency (Hollander et al., 2014; McHugh, 2009).
No research is perfect. All research, both analytical and empirical, has limitations. There is variation in how a researcher structures the analytics (e.g., the mathematics tools used to solve it, the set of assumptions, choices of variables, optimal results versus heuristics). There is always noise in the data used in empirical studies. Author‐induced variation exists in their decisions about which models and variables to use or not, and the sources and methods employed to collect and clean the data. Still, to avoid confirmation bias in their investigations, authors should discuss the probable sources of any inconsistencies in model results and assumptions made in the paper. Doing so will generate problems that calls for new research, such as asking: (1) What? (What factors influence the theory or its boundary conditions?). (2) Where? (In what types of situations do they occur?). (2) When (Is there a temporal aspect to the problem?). Together they give insights into the “Why.” To avoid confirmation bias, authors should consider opposing views or arguments. It is also important for authors to remember that any paper is part of an ongoing conversation and debate and not the final word on a topic.
Dealing with endogeneity
“[A]uthors and gatekeepers should realize it is impossible for any one study to fully mitigate all endogeneity concerns.” In other words, no study is perfect, and if we hold that ideal, we may not advance understanding in a systematic way and thus miss important knowledge. This recommendation may be difficult, as norms in … research have tended to coalesce around more unequivocal statements of findings (which will also affect whether more transparent prognoses become the norm as well). … Only through repeated studies of a research question using different designs and analyses can we gain confidence that a specific endogeneity threat is fully addressed. Even the idealized experiment requires triangulation with different designs, samples, and operationalization of variables before causal claims free of any validity threat can be made. (Hill et al., 2021)
As defined econometrically, endogeneity is an issue when an independent variable is correlated with the regression error term. Roberts and Whited (2013, p. 498) note that “there is no way to empirically test whether a variable is correlated with the regression error terms. Consequently, there is no way to ensure that an endogeneity problem has been solved statistically.”
We have found few POM papers addressing the issue of endogeneity emanating from econometrics. For example, only four of the top 75 cited empirical papers published in POM from 1992 to 2021 address the issue of endogeneity. In contrast, six of the 19 highly cited empirical papers published from 2016 to 2021 addressed it. It is interesting to reflect on why endogeneity has only recently appeared as an issue of concern in empirical OM research, while these issues and practical solutions are well established in the econometrics and applied economics literatures (e.g., Engle et al., 1983). Thus, addressing endogeneity could reflect the maturity in early OM empirical research and its more recent recognition and its emergence as important to conducting rigorous research related to causal inferences. Causality is best determined through randomized controlled experiments. It could also be that empirical research in OM is following trends in other management disciplines, where scholars have raised and tackled issues about endogeneity in their respective fields. Some of the review papers on endogeneity include Chenhall and Moers (2007) in accounting, Roberts and Whited (2013) in finance, Mithas and Krishnan (2009) in information systems, Antonakis et al. (2010) in leadership, Zaefarian et al. (2017) in marketing, Hamilton and Nickerson (2003) in strategic management, Hill et al. (2021) in management, and Ho et al. (2017) and Ketokivi and McIntosh (2017) in OM. These papers report that ignoring endogeneity and/or not correcting for it can lead to biased and inaccurate results and incorrect conclusions. These papers review the various tools available to address endogeneity and we recommend that scholars address the challenges posed by endogeneity.
Since most OM empirical research is not based on randomized experiments, endogeneity is likely to be present in these studies with varying degrees. It is not helpful when reviewers simply say that the paper has an endogeneity problem and, therefore, the results are incorrect. Authors can and should use theory, logic, and common sense to argue when endogeneity is not a significant concern in their research. Unfortunately, reviewers often consider this concern to be suboptimal compared to rigorous econometric procedures. Such review comments can be discouraging and can negatively affect the value and advancement of empirical research. Ketokivi and McIntosh (2017) provide a very thoughtful discussion of how to address endogeneity issues and make the case of being pragmatic and flexible rather than strict in dealing with endogeneity. Hill et al. (2021, p. 118) make the case that to address endogeneity, authors must first address its cause(s) and then its “extensive toolbox of methods that can be used to address specific causes of endogeneity.”
CONCLUSIONS
This paper reviewed and discussed the most influential empirical papers published in POM based on each paper's overall Google Scholar citation counts. In reviewing the implications of empirical research in POM, we presented four sets of analyses: First, we provided an overview of the overall influence of POM that includes papers of all types published from 1992 to 2021. Second, we selected the top 200 cited papers published in POM, classified papers into three categories: (a) review and conceptual development, (b) analytical, and (c) empirical papers, and then compared papers across categories in terms of citations. Third, we analyzed the 75 empirical papers from the top 200 cited papers published in POM by covered topics, data sources, and data analysis methods. Fourth, focusing the analysis on empirical papers among the top 200 cited papers can underrepresent emerging themes among the more recently published empirical papers. We addressed this issue by 19 more recent empirical papers from 2016 to 2021 that are not in the top 200 cited papers but have been impactful given the brief time since their publication.
The number of empirical papers in the top 200 cited is about the same as analytical papers, which is both surprising and encouraging. It is surprising as analytical research has been the dominant paradigm of OM research and continues to be. Thus, we did not expect this category to have this number of empirical papers. We also demonstrate that the pace of OM empirical research is steadily increasing in depth and topical reach. The mean (median) citations of the top review and conceptual papers is 424 (268), higher than either the analytical or empirical papers. POM empirical papers have more citations than analytical papers.
In conclusion, while our analyses show that the pace of empirical POM research is steadily increasing, as is its relevance based on their citations' impact. We document how POM has successfully fulfilled its original goal of playing a pioneering role in publishing and promoting empirical research in innovation, operations, and supply chain management and is continuing to do so. Drawing upon a growing body of evidence from more mature disciplines, coupled with probability theory, we offer pragmatic advice on how OM authors, reviewers, and editors can continue on our journey of methodological improvements and further incentivize increased scientific rigor in the conduct of our empirical research, and in turn, increase OM's value to future research, practice, and policy. We sincerely hope that the issues raised in this paper will shed new light on the impact of POM empirical research in terms of citations and general topics of interest. Furthermore, we aim to galvanize momentum towards the next generation of advanced OM empirical research.
Footnotes
ACKNOWLEDGEMENTS
We thank Li Ding (Ph.D. student at the Scheller College of Business, Georgia Institute of Technology) and Hongli Ye (Ph.D. student at the College of Business, Clemson University) for their excellent and invaluable research assistance and support to compile the database and the analysis. We also thank Chris Tang (the editor for the special issue), Kaylan Singhal (POM Editor‐in‐Chief), and colleagues Manpreet Hora and Brian Jacobs for their constructive comments.
1
Observational research often comes to play when the unexpected recurs without explanation. One glaring example of this phenomenon is when OM moved from trade‐off models, like cost versus quality to cost and quality, which that were first observed in Japanese manufacturing during the late 1980s and was extended to the early nineties for a theoretical explanation (Rosenzweig & Roth, 2004; Roth, ![]() ).
).