
Abstract
The service sector has become increasingly important in today's economy. To meet the rising expectation of high‐quality services, efficiently allocating resources is vital for service systems to balance service qualities with costs. In particular, this paper focuses on a class of resource allocation problems where the service‐level objective and constraints are in the form of probabilistic measures. Further, process complexity and system dynamics in service systems often render their performance evaluation and optimization challenging and relying on simulation models. To this end, we propose a generalized resource allocation model with probabilistic measures, and subsequently, develop an optimal computing budget allocation (OCBA) formulation to select the optimal solution subject to random noises in simulation. The OCBA formulation minimizes the expected opportunity cost that penalizes based on the quality of the selected solution. Further, the formulation takes a Bayesian approach to consider the prior knowledge and potential performance correlations on candidate solutions. Then, the asymptotic optimality conditions of the formulation are derived, and an iterative algorithm is developed accordingly. Numerical experiments and a case study inspired by a real‐world problem in a hospital emergency department demonstrate the effectiveness of the proposed algorithm for solving the resource allocation problem via simulation.
Keywords
INTRODUCTION
The past few decades have witnessed a rapid growth of the service economy globally (Buckley & Majumdar, 2018). Nowadays, the service sector plays a vital role in a wide range of industries, including retail, healthcare, hospitality, finance, and IT. Traditional industries such as manufacturing have also seen the trend of servitization (Örsdemir et al., 2019) by introducing more service components in product offerings, requiring manufacturing processes to be more dynamic and flexible (Dmitry et al., 2021). Such service‐oriented systems are often tailored to meet different customer requirements and expectations, and are complicated in process dependencies and dynamics. Further, many activities in service systems deal directly with humans rather than machines, thereby introducing various forms of variability and challenges in measuring system performance. This paper focuses on service systems without tractable mathematical structures in view of the operational complexity, process nonlinearity, and performance variability, thus relying on simulation models in system evaluation and optimization.
A notable challenge of the service systems under study is to meet rising expectations on services without overspending on relevant resources. On the one hand, service providers are required or incentivized to meet and improve service quality as measured by certain metrics, such as waiting time (WT) in call centers and hospitals, on‐time ratio in online food ordering and delivery platforms, and availability percentage in IT services. These service goals are expressly provisioned in a service contract or perceived as crucial to customer satisfaction and market share. On the other hand, service providers work with a given set of resources, such as personnel with specific skills or training, space and equipment availability, and an operating budget. With the limitation on resources, they are motivated to improve service by intelligently allocating resources in place (e.g., functional areas) and time (e.g., shifts). For example, a hospital can improve care delivery by managing bed assignments and nurse schedules (Best et al., 2015; Kim & Mehrotra, 2015); a retail store can optimize product variety and quantity by properly utilizing storage and shelf spaces (Ton & Raman, 2010). This paper studies a class of service problems where one service level is optimized, and several others are imposed as constraints, subject to given resource limitations.
A case in point is a real‐world resource allocation problem in a hospital emergency department (ED) (see Section 3.1 for the formulation and Section 5.2 for the case study). Common resources in an ED include specialized medical staff, beds, medical equipment, and salary budgets. The ED has established a set of achievable service goals as measured by WTs for different categories of patients. While the target service levels on urgent patients are high and satisfiable, the ED has recognized the need to improve the service quality on less‐urgent patients. Therefore, it is desirable to seek resource allocation scenarios that improve the “nice‐to‐have” service goal while continuing to meet all other “must‐have” requirements. Furthermore, the imposed service levels on WTs are expressed in the form of probabilistic measures; that is, a service level is defined as the percentage of customers not waiting longer than a given threshold.
Such probabilistic constraints (or chance constraints) are often used in measuring quality of service (Hong et al., 2015), and thus problems with similar structures appear in other service systems. Call centers may operate under a delay‐percentile contract, where delays for a certain percentage of contract customers should be within a fixed delay bound, and noncontract customers have no guarantees on delay (Milner & Olsen, 2008). A call center may seek an operator schedule to minimize the delay for noncontract customers, while satisfying the requirement for contract customers. Such problems are also prevailing in public service offices, such as governmental departments that issue passports, driver licenses, and ID cards. They need to determine the staffing level for a specific time slot, such that at least a certain percentage of customers would wait less than a given time limit (Taigel et al., 2018). In this paper, we will use the term “resource allocation” for the aforesaid staffing schedules, equipment assignments, and other allocation of resources in place and time.
To study these service systems with probabilistic measures, simulation models can be deployed to evaluate the performance of different resource allocation scenarios so as to identify the best one. However, one notable drawback of performing analysis using simulation is the existence of random noises and thus the need to run a large number of simulation replications in order to evaluate each scenario accurately. With sizable alternatives, it will be very time consuming to run sufficient replications for every scenario, and thus an efficient strategy is necessary to search for the optimal one subject to the computing budget (i.e., the total number of simulation replications). This line of research falls under the domain of ranking‐and‐selection (R&S). To this end, we will develop an optimal computing budget allocation (OCBA) formulation using the expected opportunity cost (EOC). Further, the proposed formulation will follow the Bayesian framework and impose a correlated prior belief, as treated in Frazier et al. (2009), on the performance of resource allocation scenarios. As such, it utilizes prior knowledge accumulated by the service provider on these scenarios and captures the performance correlation on “neighboring” scenarios.
The remainder of this paper is organized as follows. Section 2 summarizes related literature on applications of stochastic service systems and methodologies of simulation optimization. Section 3 introduces the resource allocation model and the OCBA formulation, with the solution methodology developed in Section 4. Section 5 presents the numerical results, and Section 6 concludes this paper. Proofs of lemmas and theorems, as well as additional analysis and numerical results, are enclosed in the Supporting Information.
LITERATURE REVIEW
In this section, we will review relevant literature from both application and methodology viewpoints. As the problem under study considers probabilistic measures, we limit the review to those dealing with stochastic systems.
From the application point of view, most modeling papers studying stochastic resource allocation in service systems focus on problems with tractable mathematical structures. These well‐structured problems can be modeled and solved as stochastic optimization problems, such as stochastic programming (Bodur & Luedtke, 2017), robust optimization (Mattia et al., 2017), and Markov decision process (Huh et al., 2013). These problems typically have one or more stochastic constraints and/or objective with others being deterministic. While the stochastic constraints/objective are often in the form of expectations (see, e.g., Bodur & Luedtke, 2017; Gans et al., 2015), some problems study probabilistic constraints as those formulated in this paper. For example, Beraldi et al. (2004) developed a stochastic programming framework to determine the emergency medical service site locations and the number of emergency vehicles, where the service‐level constraints are probabilistic constraints; Robbins and Harrison (2010) studied a call center scheduling problem subject to a service constraint that a proportion of calls must be answered within a fixed time.
For stochastic service systems that do not possess tractable structures, simulation has been the tool of choice for analysis. Simulation can be used to evaluate the stochastic feasibility requirements, such as passenger processing targets at an airport (Mason et al., 1998), and average WT requirements for patients in EDs (Izady & Worthington, 2012). Simulation can also be combined into optimization procedures to search for the optimal solution, known as simulation(‐based) optimization, or optimization via simulation. For example, Atlason et al. (2008) and Cezik and L'Ecuyer (2008) solved call center staffing problems with non–closed‐form service‐level functions evaluated via simulation; Tsai and Zheng (2013) addressed a two‐echelon inventory problem, where one constraint requires the expected response time at each depot to be within a threshold; Guo et al. (2017) and Chen et al. (2020) studied staffing problems in hospital EDs while satisfying stochastic service quality requirements. This paper contributes to the above literature on studying a generalized resource allocation problem in service systems, where two unique structures exist: (1) The performance of neighboring resource allocation scenarios may be correlated and the modeler can obtain prior knowledge on their joint distribution; and (2) the objective and multiple constraints are stochastic and in the form of probabilistic measures.
To tackle these special structures, this paper contributes to the R&S literature from the methodology point of view, particularly to those constrained R&S methods for solving problems with stochastic constraints and/or objective. One stream of research on constrained R&S is based on the sequential indifference‐zone (IZ) framework and aims to identify the optimal solution with a probability exceeding a stipulated threshold (Andradóttir & Kim, 2010; Batur & Kim, 2010; Healey et al., 2014; Hong et al., 2015). Another type of formulation is based on the OCBA framework and aims to maximize the probability of correct selection (PCS) (Lee et al., 2012). A heuristic procedure was developed in Choi et al. (2021) by considering the precision of the sample means when maximizing PCS, so as to improve the algorithm performance when large simulation noise exists. Finally, large‐deviation approaches have also been investigated, where Hunter and Pasupathy (2013) and Pasupathy et al. (2015) seek to maximize the rate of decay of the probability of false selection (PFS). Gao et al. (2019) further incorporated quadratic regression metamodels in the large‐deviation framework to improve the search efficiency.
While these existing methods optimize the PCS or PFS measure, this paper develops a new Bayesian OCBA formulation using the EOC measure, motivated by the aforesaid structures of the resource allocation problem under study. First, the OCBA formulations with the PCS or PFS measure aim to identify the best solution with the maximum probability, treating all nonbest solutions equally. However, for the service systems under study, the industry is more interested in the economic value of the selection than its statistical significance. In other words, the decision makers are more concerned with the loss incurred in selecting a solution, rather than the statistical significance of selecting exactly the best one. As such, the OCBA formulation proposed in this paper uses the EOC measure as the objective, which penalizes for the quality of the selection. While EOC has been used as an objective in unconstrained R&S problems (Chick & Wu, 2005; Gao et al., 2017), it has rarely been studied in the constrained R&S counterparts. Second, in order to capture the prior knowledge on the solution performances and the correlation of neighboring solutions, the proposed formulation uses the Bayesian framework. While Pujowidianto et al. (2013) proposed a frequentist version of EOC for a constrained R&S problem, to the best of our knowledge, this is the first Bayesian EOC formulation developed in the constrained R&S literature that accounts for the prior belief and correlation of solutions. Third, the probabilistic measures in the objective and constraints of the problem provide convenience in the formulation and its theoretical properties, including a strong finite‐time convergence property of the proposed algorithm. We mention that although the probabilistic measures can be written as expectations of an indicator function following a Bernoulli distribution, the information on the Bernoulli distribution makes our method more efficient and robust, as pointed out in Hong et al. (2015).
Finally, this paper is more tangentially related to the literature on stochastically constrained optimization via simulation (COvS) and stochastically constrained Bayesian optimization (CBO). Both COvS and CBO are constrained optimization problems where samples from the objective and constraint measures can be treated as being generated from a black box. This black box is the simulation model for COvS and is the real system for CBO. In COvS and CBO, the set of candidate solutions is much larger, and search‐based heuristic methods need to be developed to find the optimal or near‐optimal solutions. Such heuristics can be based on penalty functions (Park & Kim, 2015), gradients (Luo & Lim, 2013; Nagaraj & Pasupathy, 2013), random search strategies (Chen et al., 2020; Gao & Chen, 2016), or acquisition functions (Gardner et al., 2014; Letham et al., 2019; Ungredda & Branke, 2021). A valuable future research is to extend the methodology developed in this paper to solve the COvS and CBO problems.
PROBLEM DESCRIPTION
In this section, we first introduce a resource allocation problem in a hospital, and then generalize the model to other service systems. Then, a Bayesian OCBA model is formulated to efficiently identify the optimal solution of the model via simulation.
A resource allocation model with probabilistic measures
A motivating example of our model is a resource allocation problem in the ED of a large public hospital in Hong Kong. This hospital had large patient flows with an average of 350 to 430 patients per day to the ED. Sixty‐five percent of the patients were walk‐in patients, while the others were brought in by ambulance. All patients were labeled by triage categories based on their clinical conditions, including categories I (critical), II (emergency), III (urgent), IV (semiurgent), and V (nonurgent), of which categories III and IV patients made up the major proportions (about 90%). The hospital committed to provide high‐quality services to ED patients, where WT serves as a key metric. An example of such service‐level requirements measured by the patient WT and length of stay (LOS) is shown in Table 1.
Time limits and service levels for an ED in Hong Kong
Time limits and service levels for an ED in Hong Kong
As seen from Table 1, patients in category I should be treated immediately with any available resources. The WT and service‐level expectations for patients in categories II, III, and IV lower as the urgency drops, while no requirement is imposed on category V patients alone. The ED also maintains a goal of treating at least 98% of patients in all categories within 4 h, measured by LOS. While these requirements were established based on benchmarks and attainability, the focus was mainly on urgent patients. The hospital leadership believed that, with an efficient allocation of resources, it is possible to improve the service level for category IV patients (semiurgent and 48.76% of total) while meeting all other service requirements. Indeed, different categories of patients undergo different treatment procedures, and occupy different medical resources such as manpower, machines, and spaces. By properly assigning medical staff to each service area and each shift, the ED can find a scenario to improve the WT of category IV patients while maintaining the service for urgent patients. More specifically, define 


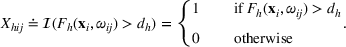
The aforementioned decision problem can be generalized to other service systems, such as call centers and public service offices. To this end, we define a stochastic performance measure 


A simulation model will be used to evaluate the above probabilistic measures, 


A Bayesian OCBA formulation
Suppose there is a total of K alternative solutions (resource allocation scenarios) in 


To capture the prior knowledge on solutions and correlated samples of neighboring solutions, we proceed to develop an OCBA formulation from a Bayesian perspective. Specifically, since 


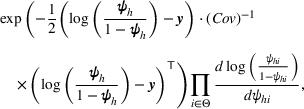
Here, we first make a mild assumption on the prior distribution (Russo, 2020) in Assumption 1. The prior joint distributions 


Assumption 1 is a mild assumption that covers a large class of distributions, such as the multivariate normal distribution (Howard, 1998) that we will use in the numerical experiments in Section 5. In particular, for any continuous function 


Let 


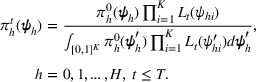
The posterior distribution in Equation (10) may not have a closed form if the prior distribution is correlated. In this case, we need numerical integration methods to solve integrals in Equation (10). In the case of high‐dimensional integrals if the total number of solutions, K, is large, Monte Carlo estimation and the importance sampling method can provide robust estimates with high accuracy.
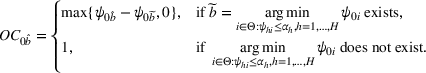
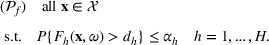
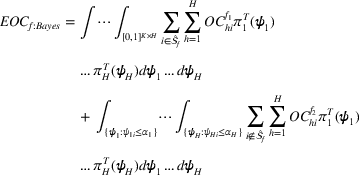
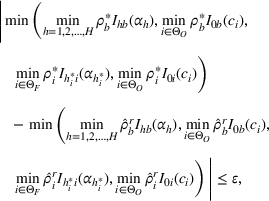
We are now ready to introduce the OCBA formulation that minimizes the Bayesian EOC. More specifically, based on T simulation samples, the selected solution 
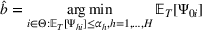
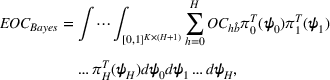


Subsequently, the Bayesian OCBA formulation of problem 
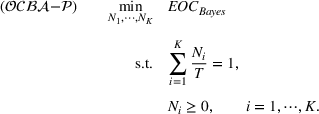
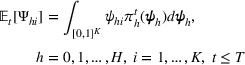
We assume that in problem 


The 
SOLUTION METHODOLOGY
Although 


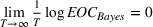
Rate of decay of Bayesian EOC
Considering the definition of the selected best As 


In fact, under Assumption 2, we will show in the sequel that 


To facilitate the analysis, we first divide the set of indices for nonbest solutions into two exhaustive and mutually exclusive sets, 


Furthermore, for any 


The proof is given in the Supporting Information EC.1.1 to this paper.
Although 


We now proceed to analyze the rate of decay of For any 


The proof is given in the Supporting Information EC.1.2 to this paper.
Consider positive sequences 


The rate of decay of 


By Equation (16) and Lemma 3, we have Next, consider the term in Equation (21) for any Applying Lemma 2 to the right‐hand side of Equation (29), Equation (19) readily follows, since 


We mention that the only approximation used in Theorem 1 to arrive at 


Optimality conditions
Since neither minimizing Let 


Since 


Intuitively speaking, the simulation replications allocated to solution 


Theorem 2 provides a simple closed‐form formula for allocating the total computing budget to all solutions, such that the It may be of interest to consider two degenerate cases of problem 


Iterative algorithm and convergence analysis
Recall that 


Iterative Sample Allocation Algorithm for Solving 
In Step 5 of Algorithm 1, for 


While the asymptotic performance of Algorithm 1 is guaranteed by Theorem 2, a more important practical concern is its finite‐time performance. Specifically, two metrics are critical: (1) How close is the posterior mean Suppose the prior joint distributions 


The proof is given in the Supporting Information EC.1.3 to this paper.
Suppose Assumption 1 holds. For any sufficiently small 
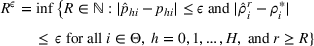


The proof is given in the Supporting Information EC.1.4 to this paper.
By the Chebyshev inequality, the finite expectation and variance indicate that by a very high probability, Note that by Equation (19), the empirical value of 


NUMERICAL EXPERIMENTS
In this section, we provide numerical results that show the effectiveness of the proposed algorithm. To this end, we test randomly generated test cases and a case study inspired by the real‐world staff allocation problem introduced in Section 3.1.
Random test cases
We first test the performance of Algorithm 1 (short for PB in the following context) using randomly generated test cases. Three benchmark algorithms are selected in comparison, namely, the OCBA for constrained optimization in Lee et al. (2012) (short for CO), the stochastically constrained R&S via SCORE in Pasupathy et al. (2015) (short for SC), and the heuristic procedure based on statistical hypothesis tests in Choi et al. (2021) (short for HE). Although the CO, SC, and HE algorithms do not consider the performance correlations in solutions as PB does, they are the most relevant algorithms developed to solve the constrained R&S problems under study in this paper. As such, we test the PB algorithm with an uncorrelated uniform prior (short for PB u ) as a direct comparison to the three benchmarks. Further, we test the PB algorithm with a correlated prior (short for PB c ) in order to quantify the benefit of using a correlated prior in the PB implementation. To this end, we generate random test cases with different parameter settings, and compute the optimal solutions using the aforesaid five algorithms by varying computing budgets. Note that the true optimum for each random test case can be analytically computed (to become apparent once we introduce the generation procedure for random cases below) and will be used as ground truths for performance comparison. Note further that our implementations of all algorithms strictly use sample approximations without leveraging the knowledge of the true optimum.
We compare the algorithm performance under different values of Generate the value of Generate the value of For each solution For a normal underlying distribution, For a uniform underlying distribution, For an exponential underlying distribution, 


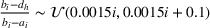

For each random test case, the value of 


In the PB
c
implementation, we set the prior distribution of 


For each random case, its true (theoretical) optimal solution for the attendant problem Probability of correct selection (PCS): the percentage of cases where a true optimal solution is identified using the chosen algorithm; Probability of selecting an infeasible solution (PIF): the percentage of cases where an infeasible solution is identified as an optimal solution using the chosen algorithm; Expect opportunity cost (EOC): the expected performance gap between the selected solution and the true optimum. Specifically, the frequentist opportunity cost of selecting 


Here, PCS measures an algorithm's expected performance (i.e., how good it is in selecting the optimal solution); PIF measures its worst‐case performance (i.e., how bad it is in selecting an infeasible solution); and EOC measures the expected performance gap between the selected solution and the true optimum (i.e., the overall performance on the solution quality).
Table 2 exhibits the performance comparison results for the normal underlying distribution. Specifically, the table shows the PCS, PIF, and EOC metrics for three groups of settings, 


Performance comparison with normal underlying distributions (

From Table 2, it is seen that, for the PCS metric, PB
u
clearly outperforms three benchmarks for all three groups of problems; particularly, for the hardest (third) group, PB
u
reaches a PCS of 77.5% when 

To check the robustness of PB across different underlying distributions, Table 3 and Table 4 exhibit performance comparisons with uniform and exponential underlying distributions, respectively. It is seen that PB is superior to all three benchmarks robustly across various underlying distributions. We also point out that the advantage of PB is more significant for the hardest group of cases, indicating that PB is a better choice when the size of problem becomes large.
Performance comparison with uniform underlying distributions (

Performance comparison with exponential underlying distributions (

In the Supporting Information EC.3, we modified the procedure of generating random test cases by setting the values of 


In summary, these numerical results show that, compared to CO, SC, and HE, PB is more likely to correctly select the optimal solution, and less likely to select an infeasible one; even if an optimal solution is not selected, PB is much more likely to select a near‐optimal one. All these are desired characteristics for an R&S algorithm. Further, the performance improvement is quite significant even when the computing budget is relatively small. This will benefit many applications as each simulation replication can be expensive and time consuming to run and the decision‐making time frame may be short (e.g., within hours or half a day). Finally, when prior knowledge is available for a problem, it would be beneficial to incorporate a correlated prior.
An ED case study
In this section, we will demonstrate how the proposed model and algorithm can be used to improve services in the ED example introduced in Section 3.1. A discrete‐event simulation model is used to evaluate the performance of the highly complex and dynamic processes in ED. The data used in this case study were collected from July 1, 2009, to June 30, 2010, and the service process and simulation model used have been verified in Guo et al. (2017) and Chen et al. (2020).
From the historical data obtained, the ED received various patients with the volume varying from 350 to 430 per day, where the patients fall into five categories with the following percentages on average (from categories I to V): 0.87%, 1.45%, 42.09%, 48.76%, and 6.83%. In the simulation model, the patient arrivals follow a nonhomogeneous Poisson process, whose hourly arrival rates were calculated empirically based on the historical data and are shown in the Supporting Information EC.4.
The discrete event simulation model follows the actual service processes (Chen et al., 2020), where the detailed process map and the distributions used to generate the service times at each process are displayed in the Supporting Information EC.4. Specifically, an incoming patient, depending on the situation, may go through different service areas, including registration and triage, resuscitation (for critical patients), consultation, laboratory test and imaging investigation, and observation. Main medical resources required include different types of nurses, doctors with different seniority levels and expertise, different medical devices (e.g., electrocardiography [ECG] and ultrasonography [USG]), as well as different spaces (offices, rooms, and labs). Medical staff worked three shifts around the clock: morning shift (from 8 a.m. to 4 p.m.), evening shift (from 4 p.m. to 12 p.m.), and night shift (from 0 a.m. to 8 a.m.).
The simulation model was implemented in Arena, and was validated using the 1‐year data collected. For the model validation, we set the length of the simulation to be 1 month with a 7‐day warm‐up period and ran the simulation model for 500 replications. We used three indicators, waiting time at the triage (WTT), waiting time for physicians (WTP), and length of stay (LOS), to assess the validity of outputs, as shown in Table 5. Note that the data of WTT and WTP for category I patients are not available from the cooperative hospital. It is seen that the simulation can closely mimic the real data.
Simulation model validation results
Next, we experiment with the simulation model to identify the optimal solution Solutions were filtered by the deterministic constraints specified in Equation (5), including the personnel and budget constraints. Specifically, the personnel constraint imposes practical bounds on the number of medical staff of each type and shift. Any solution resulting in a staffing cost of more than 85.5 CUs was also filtered, since the ED preferred maintaining the current budget. Solutions dominated by others were filtered. For example, consider solution A with 2 SDs for the night shift and solution B with 1 SD for the night shift, while all other staff assignments are equal. We expect solution A to dominate solution B without evaluating them since the objective is to find a solution that maximizes the service level of type IV patients, thereby excluding solution B from the solution space. Solutions were further filtered by consulting domain experts, who would remove nonpromising solutions based on their prior experience on staff schedules or preliminary simulation runs.


The full set of the 73 candidate solutions is included in the Supporting Information EC.4. We mention that the above filtering process substantially reduces the solution space, making it suitable to construct an R&S problem studied in this paper, while the original problem without filtering is more suitable to be solved using a search‐based algorithm, such as the one developed in Chen et al. (2020).
We compare the performance of PB to two benchmarks: One is the CO in Lee et al. (2012) and the other is the equal allocation (EA). The EA approach is a simple strategy of allocating the computing budget equally among all candidate solutions, and is often used in the literature as a baseline. The computations were conducted in Arena 14.0 via VBA codes. The prior belief was set to have a density 


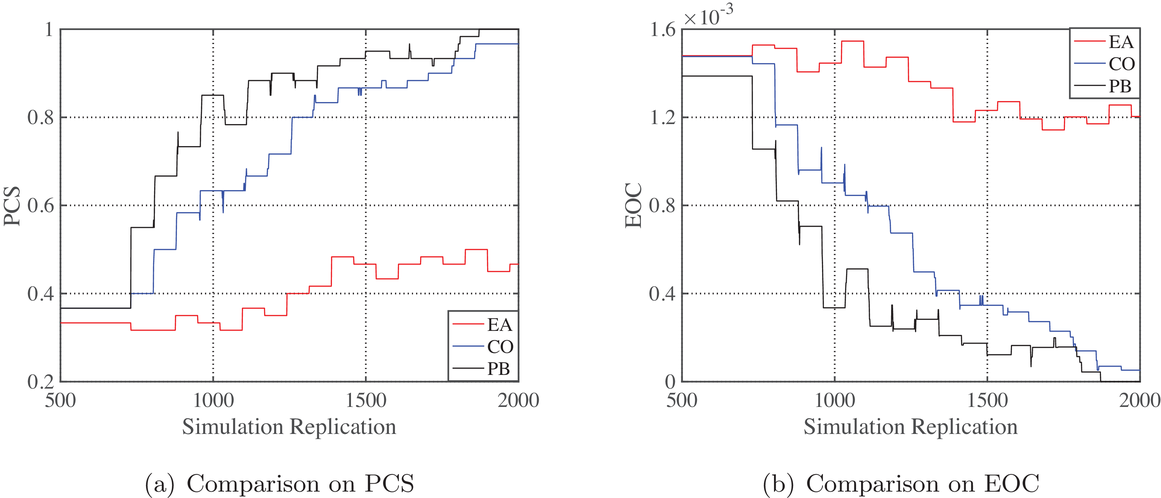
Performance comparison on the ED example
It is seen from Figure 1 that the PCS converges to 1 and EOC converges to 0 faster when using PB than using CO, while the PCS and EOC do not converge within the tested range of the computing budget when using EA. EA is apparently not a good strategy, and needs a much larger computing budget to conclude a reliable solution. To further illustrate that the optimal solution obtained by PB is indeed better than the actual staff allocation schedule, we simulated both solutions for 500 replications. Table 6 shows the performance comparison between the actual solution implemented by the hospital and the optimal solution obtained by PB, where 


Comparison between the actual and optimal solutions


CONCLUSION
The purpose of this research is to formulate a model to study resource allocation problems in service systems, where the system performance is evaluated via simulation. Particularly, the objective and constraints in the class of problems under study are in the form of probabilistic measures. Simulation models are known to be capable of capturing complex processes and system dynamics, which are hard to model in mathematical programs but are often present in service systems. However, a major challenge in optimizing systems using simulation models, known as the research field of simulation optimization or optimization via simulation, is the trade‐off between simulation accuracy and the affordable computing budget. To this end, we formulate an OCBA model to efficiently balance the effort of exploring the solution space and exploiting given solutions with more simulation replications. From the methodological point of view, the OCBA problem formulated in this paper possesses a couple of unique features compared to the literature: (1) Instead of maximizing the PCS, the problem under study aims to minimize the EOC, considering that the service provider is typically more concerned with the quality of the selected solution than the statistical significance of selecting the true optimal one; and (2) the proposed model considers the prior knowledge accumulated on solutions, as well as the performance correlations on solutions, and hence uses a Bayesian modeling approach. To the best of our knowledge, such a Bayesian OCBA model has not been studied in the literature. Next, based on the property of the probabilistic measures, we derive the asymptotic optimality conditions of the OCBA formulation. Then, an efficient iterative algorithm is developed to sequentially allocate the simulation budget to the most necessary solutions, guided by the optimality conditions. The efficiency of the algorithm is shown via the theoretical finite‐time convergence analysis, as well as the numerical experiments.
From a practical vintage point, the generalized resource allocation problem is motivated by a real‐life resource allocation problem stemming from a hospital ED, and is widely applicable to service systems, such as hospitals, call centers, and public service offices. The proposed algorithm can expedite the identification of an optimal resource allocation scenario using a simulation model, with the presence of probabilistic constraints and objective. Extensive numerical examples with known true optimum conducted in this paper have demonstrated the superiority of the proposed algorithm compared to benchmarks, evaluated by the PCS, PIF, and EOC metrics. Further, we apply the algorithms to the aforesaid staff allocation problem in the ED in Hong Kong, whose simulation model is driven by real data. This case study has further validated the practicality of the proposed model and algorithm.
Several future research directions are available to explore. Sometimes, the service system may want to guarantee the PCS (e.g., 90%) and minimize the required computing budget (Chen et al., 2014). Thus, a future research direction is to explore alternative simulation optimization methods, such as the IZ approaches. Further, this research considers problems with a manageable size of solution space. In the proposed algorithm, every solution is simulated for a minimum number of replications and evaluated to obtain an initial assessment. For a large‐size problem, it may not be computationally feasible to provide an initial evaluation for every solution. As such, a metamodel‐based or random search–based method needs to be developed to balance the exploration of unknown solutions and the exploitation of known solutions with more simulation replications. Finally, when the resource constraints in Equations (1)–(5) or Equations (6)–(8) can be expressed as mathematical constraints, it would be interesting to explore a combined simulation optimization and mathematical programming approach.
Footnotes
ACKNOWLEDGMENTS
We gratefully thank the department editor, the senior editor, and the two reviewers for their valuable comments that have greatly improved the paper. Siyang Gao thanks the support by the City University of Hong Kong (Grants 7005269 and 7005568). Jianzhong Du thanks the support by the National Natural Science Foundation of China (Grant 72091211).
References
Supplementary Material
Please find the following supplemental material available below.
For Open Access articles published under a Creative Commons License, all supplemental material carries the same license as the article it is associated with.
For non-Open Access articles published, all supplemental material carries a non-exclusive license, and permission requests for re-use of supplemental material or any part of supplemental material shall be sent directly to the copyright owner as specified in the copyright notice associated with the article.