
Abstract
We document the evolution of academic research through a bibliometric analysis of 123 retail analytics articles published in top operations management journals from 2000 to 2020. We isolate nine decision areas via manual coding that we verify using automated text analysis (topic modeling). We track variation across decision areas and method‐usage evolution per analytics type, featuring the degree to which big data (e.g., clickstream, social media, product reviews) and analytics suited for these new data sources (e.g., machine learning) are used. Our analysis reveals a rapidly growing field that is evolving in terms of content (decisions, retail sector), data, and methodology. To determine the state of practice, we interviewed global practitioners on the current use of retail analytics. These interviews shed light on the barriers and enablers of adopting advanced analytics in retail. They also highlight what sets companies on the frontier (e.g., Amazon, Alibaba, Walmart) apart from the rest. Combining the insights from our survey of academic research and interviews with practitioners, we provide directions for future academic research that take advantage of the availability of big data.
INTRODUCTION TO RETAIL ANALYTICS: DEFINITION AND CLASSIFICATION
The retail industry is a major contributor to global economies (Mou et al., 2018), employing a substantial portion of the labor force in many nations. Given the importance of this industry to economic growth, Fisher et al. (2000) call for an infusion of “rocket science” into retail, citing the need for improved analytical decision‐making. In a book published a decade later, Fisher and Raman (2010) hail analytics as the centerpiece of their “new science of retailing.” Since the book's publication, interest in the use of analytics has only grown 1 , and researchers are publishing papers that use advanced analytics to solve a range of retail‐related challenges (Caro et al., 2020). What accounts for this growing interest? Key drivers include (1) ever‐increasing data availability (e.g., Point of Sales), (2) the adoption of new technologies yielding new, richer data sources (e.g., traffic sensors, video), and (3) the advent of new business models (online at first, then omnichannel) triggering both hypercompetition and the need to improve decision‐making.
To document the evolution of academic research on retail analytics, we conduct bibliometric analyses of retail analytics papers published in top operations management journals. We also characterize the state of retail analytics in practice by conducting interviews with global retailers and retail analytics providers. We assess the progress of retail practice pertaining to analytics and identify barriers to and catalysts for adopting advanced analytics.
Throughout our analyses, we define retail analytics as “an approach to solving problems that starts with
Our definition is more specific than typical data‐driven or empirical research in that our focus is on the use of data and analytics to drive retailer decision‐making (De Langhe & Puntoni, 2021).
2
To illustrate: a study that tests empirical relationships (e.g., between inventory levels and stock returns) without linkage to a retailer decision corresponds to an empirical study, but
Five unique types of analytics exist (Davenport & Harris, 2017; Intel, 2017), and we use the classification presented in Figure 1 to categorize each academic study on retail analytics published over the past two decades (see Section 2). The first two types,
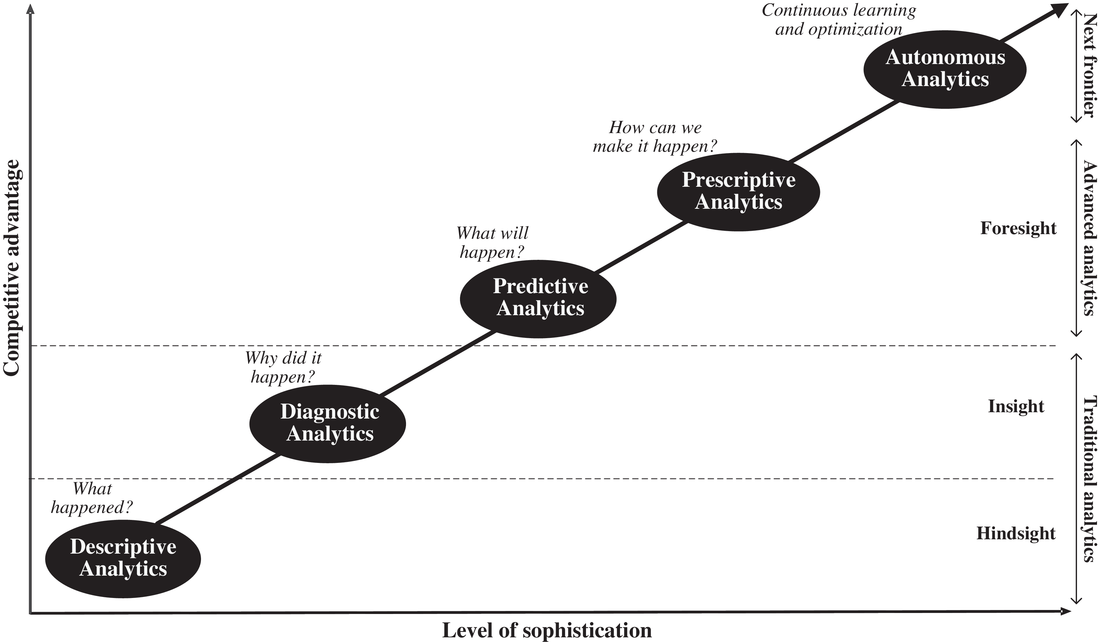
The analytics continuum.
The term “advanced analytics” refers to both
To illustrate how each type differs, consider assortment planning. Retailers may first compute historical sales of assortment items—a case of
We also make a distinction between data and big data because the rise of business analytics coincides with the advent of big data (Feng & Shanthikumar, 2018; Fisher & Raman, 2018; Guha & Kumar, 2018). IBM (2016) characterizes big data along five dimensions:
Our bibliometric analyses of retail analytics papers combined with our assessment of retail analytics in practice result in the following contributions. We identify gaps in the literature pertaining to different decision areas, types of analytics, methods, and new data sources to help guide the type of problems for future research to address. We also highlight the extent to which firms are using the analytical tools proposed by academics. Here, we find substantial room for improvement. We therefore identify several barriers to and enablers of the adoption of advanced analytics. Ensuring that practice can readily implement our research is relevant to both academics and practitioners alike, especially when seeking to have a material impact on retailer performance.
We organize the remainder of this paper as follows. Section 2 tracks how the academic study of retail analytics in top operations management journals has evolved during the 21st century. We feature practitioner interviews about the present and near future state of retail analytics in Section 3. We discuss in Section 4 general directions for future research. We conclude by summarizing the most important insights of our paper in Section 5. We present a schematic overview of our paper in Section B in the Supporting Information.
EVOLUTION OF ACADEMIC RESEARCH ON RETAIL ANALYTICS
We characterize both the scope and growth of academic research in retail analytics since 2000 by applying bibliometric analyses (Ara & Cuccurullo, 2017) to a collection of retail analytics papers. Our objective is to catalog the
Coding procedure and sampling methodology
Our population of interest is all retail analytics papers published in top operations management journals (both on the FT50 and UT Dallas lists):
Next, we used manual coding to distill the set of query‐delivered papers. To this end, we enlisted multiple raters, including the authors, plus a carefully instructed research assistant. We first jointly coded a set of 50 papers to refine our coding scheme. Next, two raters coded each paper with a third on hand to settle any disagreement. We excluded papers not proving to be original empirical articles, such as editorials, literature reviews, addenda, errata, and so on. We used three criteria to ensure the identification of an analytics paper (deemed a subset of empirical papers). Specifically, the data used should be (i) real, 4 (ii) firm specific, and (iii) linked directly with an actual decision within the domain of retail operations. We thus excluded industry‐level studies, such as those on the Operations–Finance interface, using Compustat data. We also required a paper to use its findings to inform operational decisions. For the case of an empirical study that identifies a relationship between two variables, for example, knowledge about this relationship should be a useful input for operational decision‐making. In cases where authors did not explicitly illustrate how to use their insights for operational decision‐making, an alert reader should be able to apply their results for that purpose (e.g., to formulate “what‐if?” analyses or optimization problems).
We included articles pertaining to retailers or manufacturers interfacing with end‐users. For example, articles about B2C models, direct‐to‐consumer activities, supermarkets, DIY stores, book stores, and so on. We also retain articles describing retailer–supplier relationships, namely, papers detailing the bullwhip effect. We elected to remove papers featuring services in disguise (e.g., DVD rental) or servitization (repair, maintenance, etc.). We also excluded activities unrelated to selling goods, as well as those occurring mostly
Of the 824 papers retrieved by the initial query, 14.9% met our inclusion criteria for a total of 123 papers. We refer to these 123 papers as our
Coding of article characteristics
We used the same multiple‐rater, manual coding procedure previously described to code several characteristics of each paper: (i) decision area(s) covered in the article, (ii) decision level, (iii) type of analytics used, (iv) retail sector, and (v) geographical site of data. Specific definitions to follow.
Following Caro et al. (2020) and Mou et al. (2018), we identified
Bibliometric analyses
We list our full set of papers on the website
Retail analytics publication count and growth over time
We document in Figure 2 the evolution of research analytics articles. This includes a count of articles over time as well as the distribution of these articles across journals, decision areas, and analytics types. Specifically, Figure 2, panel a, shows a steady contribution of approximately three articles per year until a sudden increase post‐2013. It took a decade (period I: 2000–2009) to produce 22.0% of the research analytics articles in our full sample. It only took 6 years (period II: 2010–2015) to produce the next 22.7% of our sample, followed by another 3 years (period III: 2016–2018) for another 25.2% of our sample. The remaining 30.1% of our sample was drawn from only a 2‐year period (period IV: 2019–2020).
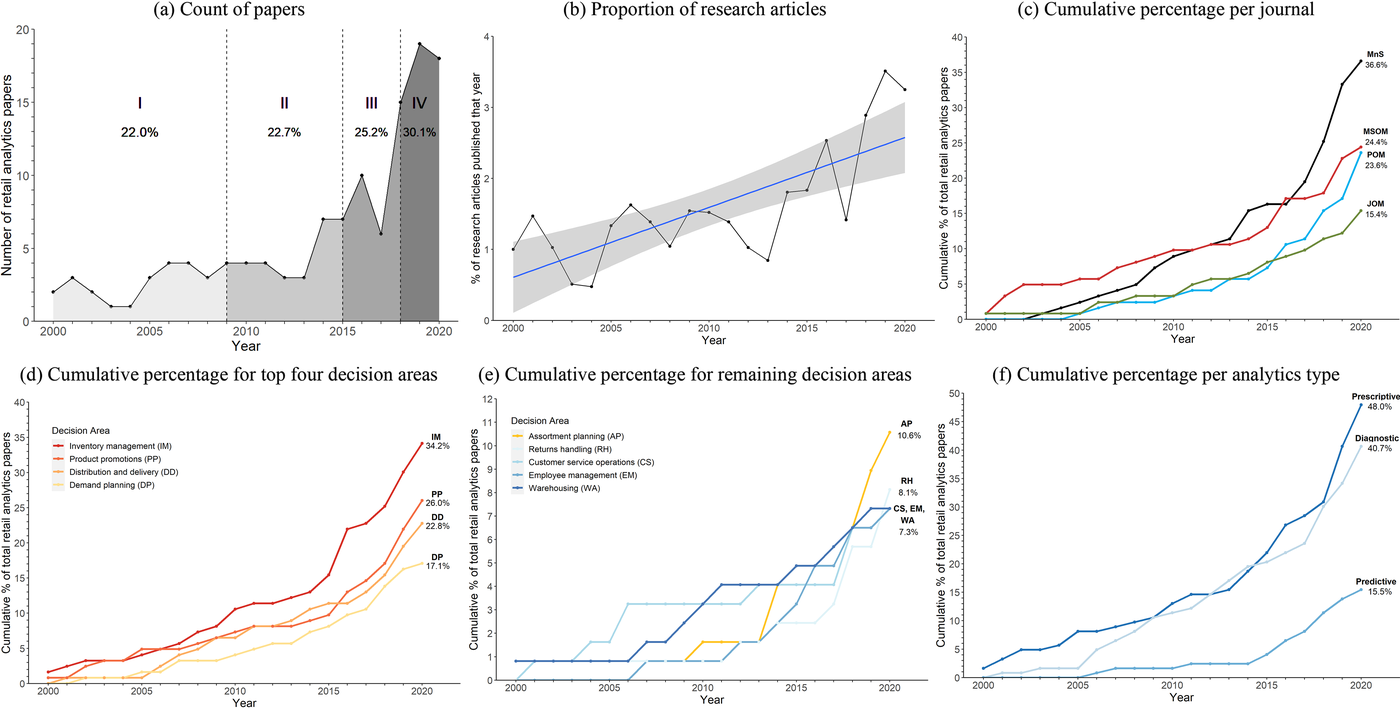
The evolution of retail analytics research: magnitude and distribution across journals, decision areas, types of analytics.
This rise in the number of retail analytics articles coincides with the publication of more articles in both MnS (journal space doubling approximately 3000 to 6000 pages from 2015 to 2020) and POM (more articles per issue in 2013, doubling from 6 to 12 issues in 2014). This begs the question: to what extent is this observed growth of retail analytics simply due to the availability of more journal space? Therefore, we computed the
Article distribution across journals, decision areas, decision levels, and analytics types
Journals
We depict in Figure 2, panel c, the cumulative percentage of retail analytics articles for each journal type. Over the entire period sampled, we observe that MnS consists of the largest share of retail analytics articles (36.6%), followed by MSOM with 24.4% and POM with 23.6%. JOM consists of the smallest share, with only 15.4%.
Decision areas
Figure 2 shows the cumulative percentage of retail analytics papers falling within a given decision area for the four largest, panel d, and the remaining five, panel e, decision areas. Most of our dataset (64.2%) addressed a single decision area, whereas 30.9% of our dataset addressed two decision areas, and only 4.9% covered three decision areas. We found the mean number of decision areas per paper to be 1.4.
Since 2007, inventory management has been consistently the most represented decision area, covered in slightly more than one‐third of papers in our dataset. Product promotions and distribution and delivery represent the second (26.0%) and third (22.8%) largest decision areas, respectively. The last of the big four, demand planning, comprises 17.1% of our dataset. Each of these four decision areas has grown substantially since 2005 and especially since 2015, as evidenced by the change in slope. The other decision areas, namely, assortment planning and returns handling, represent 10.6% and 8.1% of our sample, respectively. We observe strong growth in recent years within both these decision areas. Warehousing, customer service operations, and employee management each represent 7.3% of all retail analytics papers. Note that the total of 140% reflects 1.4 decision areas per paper.
Decision level
Our classification finds most research articles to be either tactical (49.6%) or operational (39.0%), with few (11.4%) identified as strategic. Table 1 summarizes the distribution of decision levels per decision area. Notable variety exists across areas. For example, decisions at the strategic level dominate distribution and delivery. Bell et al. (2018), for example, explore the decision to add a physical channel to an online operation. However, no studies within the assortment planning, customer service operations, or employee management decision areas feature decisions at the strategic level. Returns management studies typically focus on tactical decision‐making, with demand planning and warehousing labeled as mostly operational. We provide examples of studies within each decision area for each decision level in Section G in the Supporting Information.
Decision level distribution per decision area
Types of analytics
We depict in Figure 2, panel f, the growth of each analytics type over time. Most of the papers in our dataset (118 of 123 or 95.9%) feature one type of analytics, while the remaining five papers include two types—diagnostic and prescriptive analytics. Overall, nearly half (48.0%) use prescriptive (how?) and 40.7% feature diagnostic (why?) analytics, with each type moving in parallel since 2009. We observe predictive analytics less frequently, representing 15.5% of all research analytics papers. The growth in predictive analytics from 2014 onward may be related to the rise of decision areas such as returns handling, where forecasting product returns is central, as well as the advent of newer techniques—such as machine learning (ML)—that are especially suited for prediction.
Dataset description in terms of retail sector and geographical location
Retail sector
Across the 123‐article sample, we counted 132 different datasets 8 representing 153 retail sectors. We have sufficient detail to code the retail sector for 134 of the 153 (87.6%) identified. The most frequently featured retail sectors include (1) groceries (24.6% of known retail sectors), (2) clothing (20.1%), (3) electronics and appliances (14.2%), (4) home furnishings (7.5%), (5) books and news (6.0%), (6) health and personal care (6.0%), (7) jewelry, luggage and leather goods (5.2%), and (8) furniture (4.5%).
Geographical location
We identified the geographical location for 108 of 132 (81.8%) datasets identified. We find more than 72% to be associated with North America and nearly always the United States. Asian (Chinese) businesses represent 12.0% of the datasets, with 84.6% of the papers published since 2017. This likely coincides with the advent of large Chinese platforms such as Alibaba and JD.com. European businesses also represent 12.0% of the datasets, and 3.7% pertain to commerce in Latin America.
Automated content analysis through topic modeling
To address potential concerns regarding the subjectivity of manually coding our decision areas, we conducted automated text analysis. More specifically, we used latent Dirichlet allocation (LDA), the most popular topic modeling method introduced by Blei et al. (2003). In essence, LDA is a statistical model that aims to uncover latent topics from words contained in a collection of documents.
We detail in Section H in the Supporting Information our entire process of text preparation, model estimation and selection, as well as our postprocessing efforts. With LDA, words have a probability of occurring under a given topic, just as a topic has a probability of occurring within an article. This approach revealed nine latent topics within our dataset of papers. Table 2 displays the top 10 stemmed terms 9 with the highest conditional probability of occurring under each topic, and we use these to label the topics. The average probability of a topic occurring across all papers offers insights into the relative importance of each topic.
Topic modeling results and comparison between automated and manual decision area classification
To compare our manual decision area coding to the automated topic solution, we report, in the lower part of Table 2, the average probability of a topic occurring in a paper for each manual decision area. For each decision area (row), we compute the mean probability of each topic (column) occurring among the set of papers classified into that decision area. For six of the nine decision areas (shaded cells), a clear correspondence with one of the latent topics exists. In other words, one topic has a higher chance of occurring in papers assigned to that focal decision area than all other decision areas, and that same topic has better odds of appearing in papers of that focal decision area than those of other areas. These six decision areas include assortment planning, customer service operations, returns handling, employee management, warehousing, and demand planning.
In support of our manual coding, we find corresponding topics to be consistent with the decision area labeling. One notable exception is the customer service operations decision area, where the corresponding topic label is (online) delivery—a very specific component of customer service operations. The topic with the second highest average probability for this decision area (0.22) is the returns management topic label. Although inventory management does not clearly gravitate to a single topic label, it corresponds well to topic labels “warehousing” and “inventory accuracy and replenishment”—two obviously related topics. Product promotions, a decision area linked to pricing and promotions, corresponds most to the topic of assortment planning, reflecting that quite a few studies focus on joint assortment‐pricing challenges. The promotional planning topic exhibits the best chance of appearing in articles associated with the product promotions decision area. Finally, distribution and delivery is strongly associated with the topic labeled (online) delivery, while the topic (omnichannel) distribution has the highest feature probability in distribution and delivery decision papers. In sum, distribution and delivery covers topics related to (omnichannel) distribution and (online) delivery. In aggregate, these results validate our manual categorization. 10
Content evolution
To understand the evolution of research content beyond decision area(s), we performed a keyword analysis. Consistent with existing practices in bibliometrics (e.g., Mela et al., 2013), we aggregated distinct keywords associated with similar concepts. We also classified each keyword as referring to a topic, method, or data type. We provide details of the keyword consolidation in Section I in the Supporting Information and present therein word clouds that illustrate their evolution over time.
Focusing on the analytics
Herein, we focus on two key dimensions of retail analytics: the
Decision area and sector
We present in Figure 3 a map of the retail analytics research for each decision area. Figure 3, panel a, links topic and data keywords in gray with decision areas in red. We collocate keywords and decision areas with close ties. This panel also shows a network graph for decision areas where arc thickness indicates the degree of co‐occurrence in the same article. 11 This network reveals that many decision areas co‐occur. Both inventory management and distribution and delivery co‐occur with numerous decision areas (six each). Inventory management often co‐occurs with product promotions.
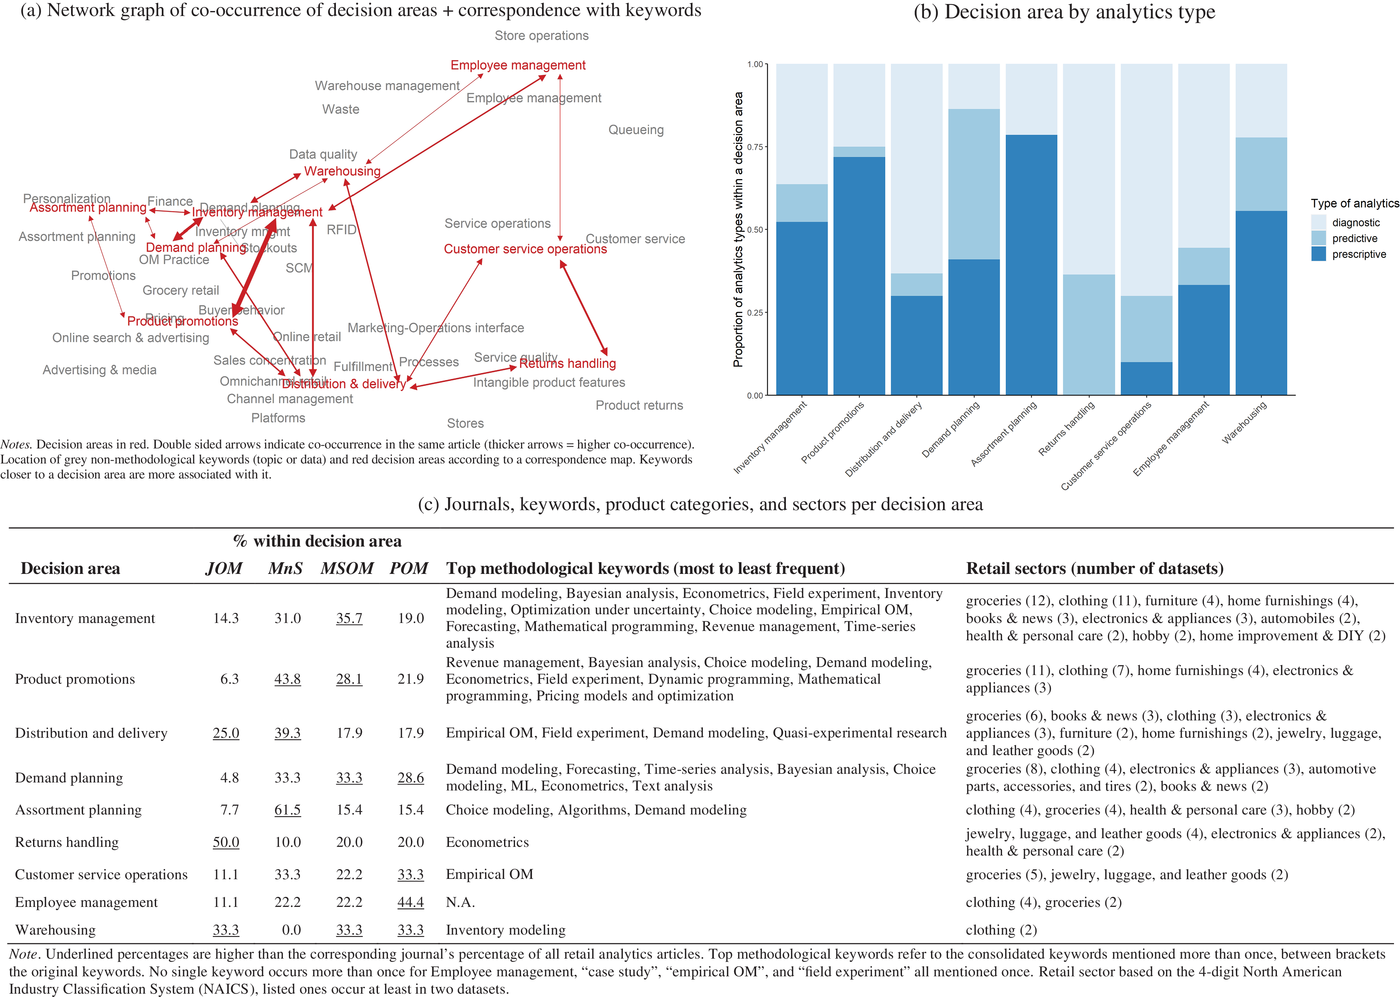
Characterizing the retail analytics research per decision area
Figure 3, panel b, features the distribution of analytics types across decision areas. As multiple analytics types may be present in the same article, we divided the specified analytics type appearances inside a decision area by the total number of analytics types occurring within that same decision area. For each decision area, we tabulate (Figure 3, panel c) the (i) distribution of articles across four journals, (ii) most frequently used methodological keywords (after consolidation via thesaurus), and (iii) retail sectors most often involved. Figure 3 shows that decision areas correspond with different topics and even journals. Figure 3, panel b, highlights that established decision areas (e.g., inventory management or warehousing) exhibit more advanced analytics (especially prescriptive). A notable exception is distribution and delivery, which features mostly diagnostic analytics. Emerging decision areas such as returns handling, customer service operations, and employee management also focus mostly on diagnostic analytics. See Section J in the Supporting Information for additional details.
Regarding the specific sectors represented in our datasets, three—groceries, clothing, electronics and appliances—comprise nearly 60% of all research settings. We present in Section K in the Supporting Information further analyses of specific sectors by examining the decision level of each study (strategic, tactical and operational).
Analytics
We depict in Figure 4 a correspondence map of the analytics type used per article versus its keywords. The closer positioned a keyword is to one analytic type, the tighter linkage between the two. That is, they co‐occur more often in our dataset. Underlined keywords refer to
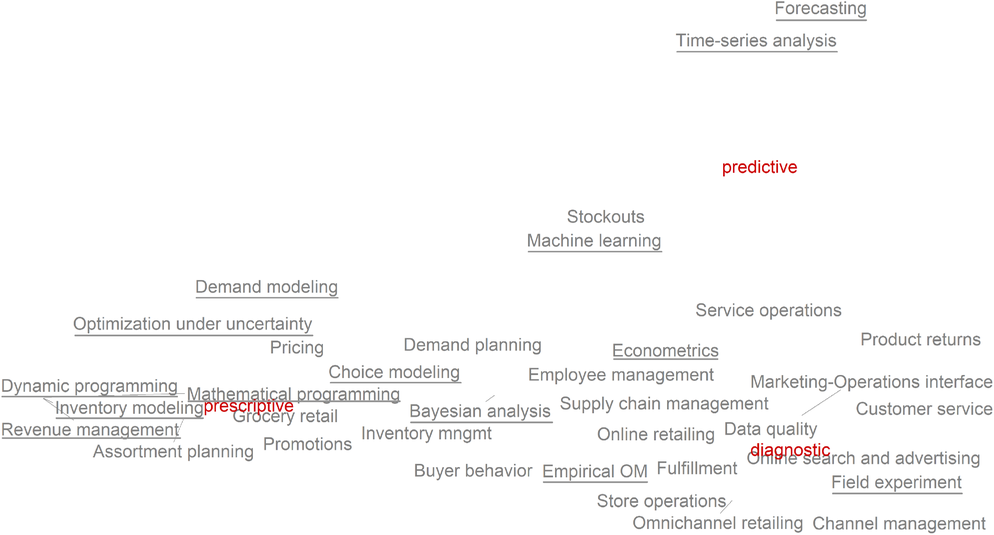
Correspondence map of type of analytics versus keyword.
In terms of applications, channel management, online and omnichannel retailing, store operations, and customer service are positioned close to
Methods best linked with
Finally,
STATE OF RETAIL ANALYTICS IN PRACTICE AND THE ROAD AHEAD
To evaluate the state of retail analytics in practice, we conducted global interviews with a diverse set of retail executives and analytics providers. We are interested in the extent to which companies are using advanced analytics to tackle retail operations challenges, whether usage varies across decision areas, and identifying the enablers for and barriers to adopting modern analytics. By contrasting the state of retail analytics in practice with that of academic efforts, we can detect emerging opportunities for research. For example, there may be unresolved questions facing practitioners that could lead to novel research questions or novel methods being used in practice that have yet to be explored in academia. Should we find that academia leads practice, then that may point to an opportunity for improved dissemination of existing research. We also highlight emergent data sources and their potential impact on future research.
Conceptual framework
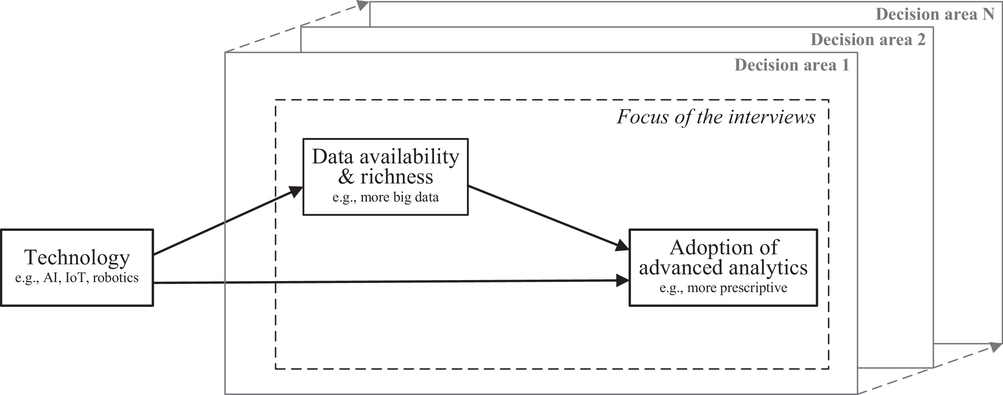
Conceptual framework for future adoption of advanced analytics
Sampling procedure and overview of participants
We identified participants using the mailing list of the Consortium for Operational Excellence in Retailing (COER). We list our interviewees, each occupying senior positions (C‐suite or right below) in Section M in the Supporting Information. They represent a diverse set of firms (retailers, distributors, consulting firms, and analytics providers) active in the retail value chain across four regions (North America, South America, Europe, and Asia). The sectors represented include apparel, department stores, food and beverage, gardening, groceries, home furnishing, jewelry, luxury goods, pet food, and sporting goods.
On the frontier
A few of our interviewees represent retailers perceived by their peers to be at the forefront of analytics. This includes online platforms (Wayfair), digital‐first ecosystems (Alibaba, Amazon), or omnichannel retailers (Walmart). Common to these business models is the need for large‐scale, real‐time decision‐making. We use the phrase “on the frontier” to refer to these companies.
Results
Current state of retail analytics
The broad consensus among interviewees is that the retail analytics currently in use are mostly
Practitioners perceived inventory management, product promotions, distribution and delivery, and demand planning to be the most advanced of the nine decision areas, with inventory management and demand planning cited most often. Despite this perception, we encountered scant use of predictive or prescriptive analytics except among retailers on the frontier. At the same time, many of the interviewees mentioned good use of analytics in inventory management and demand planning, but mostly at the distribution‐center level.
Most interviewees deemed the nine decision areas collectively exhaustive. Nevertheless, several explicitly referred to both customer analytics (“developing a better understanding of the consumer targeted at more granular levels”) and in‐store analytics (“getting a better grip on what's happening in the store and using data to improve store operations”), suggesting additional decision areas. We believe the former indicates a customer‐centric approach to all retail analytics (versus product‐ or decision‐centric). The latter stresses the (unique) store setting, or rather some stage of operations (e.g., customer service, assortment planning) where measurement of operations and customer behavior differs from other venues, such as at the website.
In addition to using analytics to improve current retail operations, some of our interviewees envisioned two further purposes. The first is
Barriers to and enablers of successful retail analytics usage
After characterizing the current state of retail analytics in practice, one wonders why practice has not adopted more advanced tools. Our interviewees offered their perspective, which we summarize in Figure 6. We classify each suggestion as either a barrier to or an enabler of the successful use of advanced retail analytics, and we group each suggestion by culture, organization, people, processes, systems and data 12 .
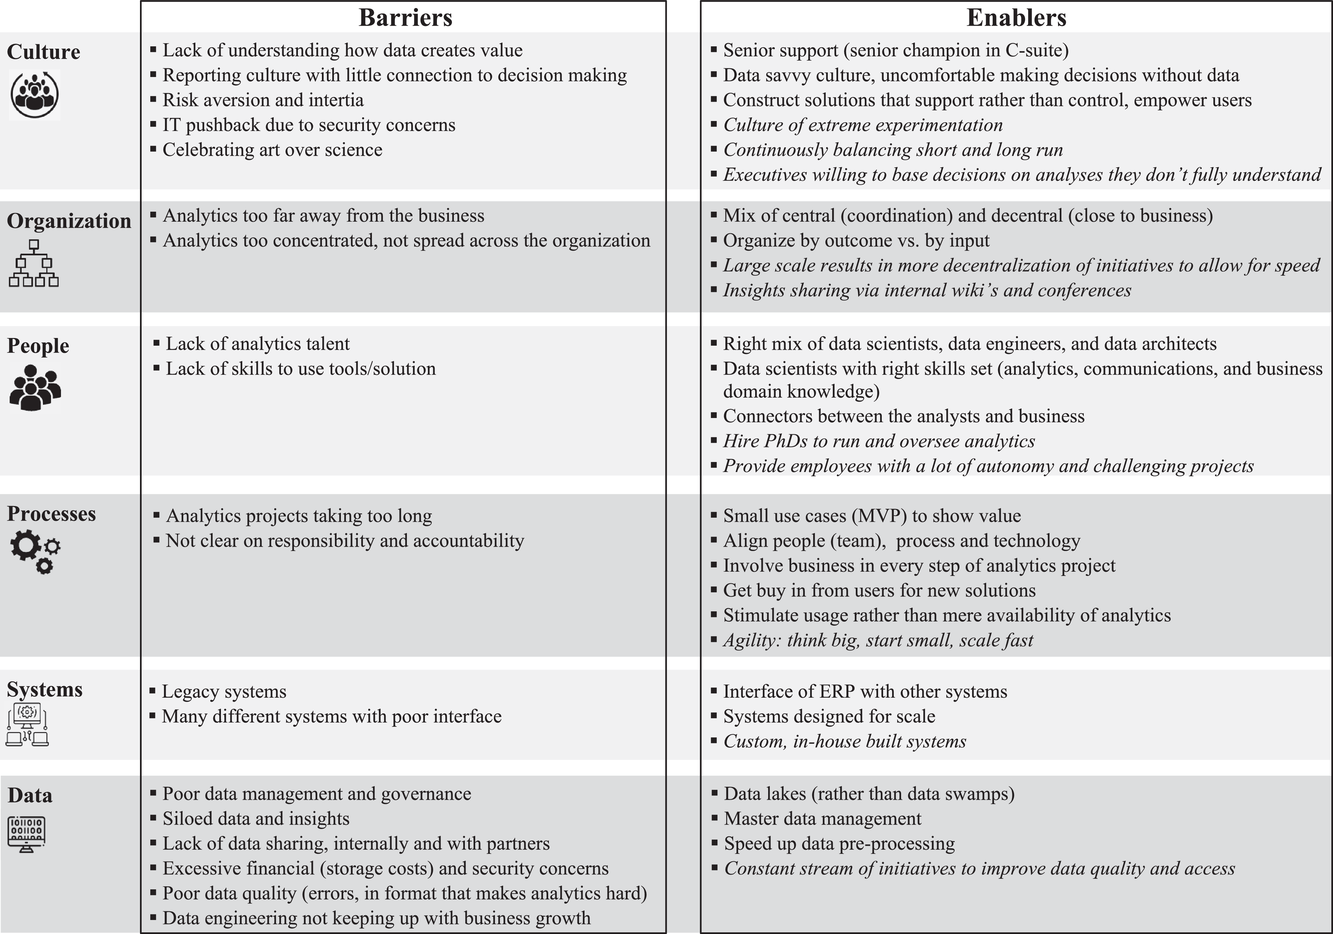
Barriers to and enablers of retail analytics according to interviewees.
Culture
Risk aversion (“high price tags, but no clear gains”) and inertia (“thus far we have managed without”) hinder the adoption of retail analytics. These two psychological barriers have also hampered other organizational developments, such as sustainable procurement (Preuss & Walker, 2011). Some practitioners perceive analytics as a
Interviewees from firms on the frontier describe a culture of frequent experimentation, including decentralized field experiments (e.g., at the DC level), where insights scale rapidly to the enterprise level. Another defining aspect of this culture is the desire to continuously look ahead, to anticipate changes in technology and to balance short‐ and long‐run operational performance. For example, one interviewee described jointly considering short‐term profitability along with planned utilization of owned versus third‐party resources to fulfill customer orders. Often, interviewees of firms on the frontier highlighted the role of senior leadership. In one instance, an interviewee identified the following key to their success with analytics. Senior management, having sufficient trust in the analytics team, would make large, often strategic, investment decisions even without fully comprehending the analytics methods used.
Organization
Interviewees emphasized that concentrating a firm's analytics functions and capabilities in the hands of a few individuals who do not understand the business context limits success. Organizing for successful analytics application requires a mix of coordinated oversight and decentralization. This aligns with the hub‐and‐spoke network advised by Fountaine et al. (2019) on how to best organize for artificial intelligence (AI). It requires coordination among data engineers so they can collaborate on methodologies and the placement of data engineers within the business units to be close to the operational problems.
Participants who work for retailers operating on the analytics frontier mention ‘striking the right balance’ between centralized coordination (e.g., IT, data systems) and decentralized analytics initiatives (e.g., market/country level). Some interviewees argue that decentralized analytics results in greater decision‐making speed. Others mention the importance of centralized efforts to facilitate internal knowledge transfer related to analytics through company wiki's and analytics conferences as well as having the support and participation of program managers in these efforts. Another suggestion was to organize by outcome (e.g., customer satisfaction) rather than by input (e.g., inventory management). That is, take a more holistic approach beyond one specific decision area.
People
A lack of analytics talent or employees with the skills to work with data or analytic tools is an obstacle expressed by several participants, particularly those in mid‐sized businesses or in emerging economies. Hiring the right mix of data scientists, engineers, and architects is a necessity, according to some. It is also important that analytics staff be able to communicate with the problem owners and possess business acumen. Otherwise, as one of our interviewees put it, “the business will just reject the input from the analytics team.” Another way to align the business team with the analytics team is to enlist translators—employees able to bridge functional gaps—or, as one participant described, “the glue between the two.” One of the interviewees from a retailer on the frontier explicitly mentioned hiring PhDs, instead of MBAs, to run the analytics. Others mentioned that to recruit the best talent, especially in a competitive market, firms need to provide analytics staff with a lot of autonomy and interesting challenges to solve.
Processes
Many participants noted that analytics projects that take too long or lack clear accountability fail. Firms that succeed in analytics put the business and users of the analytics at the core. They design analytics solutions tailored to end‐users. They also carefully design the “onboarding of new solutions” because the usage of analytics is more important than its mere presence (Berman & Israeli, 2022). Davis's (1989) technology acceptance model prescribes the need to focus on perceived usefulness and perceived ease‐of‐use in the rollout of new analytics solutions. With limits on time and human capital, prioritization is vital. Rapidly building small‐use cases or minimum viable products (MVPs) may help here. The interviewees from retailers on the frontier embrace experimentation and often cite the importance of
Systems
A frequent frustration among many interested in enhancing their analytics capabilities was the hodge‐podge of legacy systems within their firm. At the heart of most firms is the ERP, and ensuring the presence of a proper interface between this core system and the analytics solutions is essential but difficult. Others noted that with the exponential growth of data, especially online, they needed their systems to be able to scale with their business better. Custom‐built, in‐house systems seemed to be a hallmark of companies leading the way in analytics. Limited off‐the‐shelf solutions exist to address analytics interfaces.
Data
The number one barrier to successful retail analytics mentioned by our participants is siloed data. Siloed data, many noted, coexist with poor data management and a lack of data governance. The combination of data growth, security concerns, and high storage costs leads many retailers to store their limited data in a decentralized fashion, hindering analytics. To make data available, reliability and proper format are concerns, especially website log data according to one participant. Making the most from the available data requires (1) data lakes that permit centralized storage of all structured and unstructured data, (2) proper master‐data management to ensure quality, and (3) proper cleaning and preprocessing of the data. Ideally, this is coordinated so that multiple users can access the same data. Interviewees from retailers on the frontier mentioned the presence of a continuous stream of initiatives that improve data availability and data quality in every decision area.
Investments in new technologies and analytics solutions on the horizon
Planned investments
When outlining the desire to improve analytics, interviewees often cited two factors: fierce competition from Amazon and Walmart and the weakness revealed by the COVID‐19 pandemic. Plans to improve target seven themes: (1) advancing analytics to build more resilient supply chains, (2) more localization of decisions at the store level (e.g., assortment and inventory), (3) taking cues from online environments and improving measurement of in‐store customer behavior via new technologies, (4) reinforcing omnichannel orientation by better blending offline and online channels, including enhanced inventory‐sharing and more efficient omnichannel distribution and delivery, (5) extending data access, for example, to demand forecasts within the company and across the value chain, (6) using more external and contextual data such as social media, weather information and local events, and (7) connecting different decision areas such as inventory optimization with product promotions, or demand forecasting with anticipated returns. We next discuss what new technologies, data sources, and analytics solutions our interviewees plan to leverage in the next few years to further improve their analytics capabilities.
Technologies
The first type of technology meriting investment, according to our interviewees, is cloud‐based data storage and computing. This represents the direct path between technology and advanced analytics illustrated in Figure 5. The cloud, for example, provides retailers the ability to offer (near) real‐time recommendations for mobile users, resulting in more relevant personalization.
The second type of technology highlighted by our interviewees centers on obtaining
The third type of technology centers on
One specific technology noted by our interviewees was video technology. Video data mining can reveal customer characteristics (e.g., gender), individual‐level store trajectories, and customer engagement (e.g., Musalem et al., 2021). Mobile applications (apps) were also cited frequently. Consumers using mobile apps merged with Near Field Communication (NFC), for instance, can peruse product information and product reviews when visiting the physical store. Technologies such as augmented reality (AR) can also merge with apps to offer richer product experiences. One of our interviewees remarked that customers using these apps may sample a wider range of products, providing more data input on shopper preferences. In essence, these types of technology equip retailers with the ability to offer customers an omnichannel experience. Technologies such as self‐order kiosks or virtual shelves that link to online‐only assortments do as well. Note that many of these technologies represent the indirect route of advanced analytics (Figure 5). Specifically, technology adoption can result in new data and ultimately advanced analytics.
Data
Several interviewees expressed a desire for better product attribute data, as these data were often lacking in physical stores. Several participants mentioned the importance of external data such as weather or event occurrence (e.g., sports matches, concerts) for demand planning. Participants also referred to several types of unstructured data, mainly video, images, and anything related to the “voice of the customer,” including social media, product reviews, and interactions with call centers. Mining such unstructured data can inform many decision areas, such as product returns (“why is a product returned?”), customer service operations (“what did customers (dis‐)like today?”), and assortment planning (what product characteristics do customers feature in online images). Ultimately, these data can provide useful input for predicting customer preferences for products and services.
Analytics
Interviewees recognized that the majority of their tools were backward‐looking and often sought ways to be more forward‐looking through the use of existing and new data. One obstacle to this, many noted, was the lack of data quality and their firm's inability to link different data sources in a structural way (master‐data management). Interviewees also sought to adopt tools that help facilitate decision‐making at more granular levels—customer instead of segment or store cluster instead of chain wide—and to manipulate all the unstructured data that is becoming available. Many discussed the potential role for ML and artificial intelligence within retailing. One interviewee highlighted the value of
AGENDA FOR FUTURE RESEARCH ON RETAIL ANALYTICS
We present herein our agenda for future research on retail analytics. Subsection 4.1 offers general guidelines based on practitioner priorities, changes in consumer behavior, the advent of new big data sources (detailed in Subsection 3.3.3), and gaps in extant literature identified through our bibliometric analyses. We provide, in Subsection 4.2, several detailed recommendations whereby we identify an important retail challenge (
General directions for future research
Future research on retail analytics can contribute to existing work by (i) studying
(i)
(ii)
(iii)
(iv)
Description of (new) big data sources in retail and relevance to decision areas
(Continues)
(Continued)
We omit the
First, opportunities exist to apply Bayesian frameworks, including Bayesian statistics, Bayesian decision theory and Bayesian learning. Starting with Bayesian statistics, this can be applied beyond choice modeling (Rossi & Allenby, 2003). Bayesian hierarchical modeling can also be used to capture latent drivers of consumer behavior while jointly modeling input (e.g., store traffic, labor, store execution metrics) and outcome (e.g., revenues, returns) to account for endogeneity. Typically, the estimation of such models can be challenging. However, advances in computational efficiency, such as Hamiltonian Monte Carlo methods, make these estimation problems more feasible (Stan Development Team, 2022). In addition, Bayesian decision theory, which associates an action with a loss function, is also a natural way to integrate diagnostic analytics (estimation) with prescriptive analytics (optimization). Finally, empirical Bayesian learning models can be used to account for consumers accumulating experiences to infer the underlying quality of a product or a service or to generate expectations about future discounts (e.g., Erdem & Keane, 1996). Integrating these learning models within a prescriptive framework could help account for the evolving behavior of customers when making dynamic decisions about prices and service levels.
Second, quasi‐experimental methods can enhance the ability of retailers to conduct diagnostic analytics. There is room for such approaches to become more prevalent in the future. The analysis of quasi‐experiments, however, often relies on two‐way fixed effects (TWFE) models (diff‐in‐diff) that ignore effect‐size heterogeneity (e.g., across product categories, locations, and consumers) and dynamics. Chaisemartin and D'Haultfœuille (2022) survey several extensions to the standard diff‐in‐diff models that account for effect‐size bias. Studies utilizing field experiments also ignore effect‐size heterogeneity. Causal trees (Athey & Imbens, 2016) can merge ML (regression trees) with the field of causal inference in ways to partition data into subgroups that differ in their average treatment effect when using observable covariates. These insights about heterogeneous treatment effects are particularly relevant for online settings where a retailer can more easily customize/personalize its offerings to different customer segments.
Third, given that existing ML studies have displayed impressive forecasting improvements over traditional methods, there are opportunities to apply these methods to other retail challenges. Specifically, one could combine unsupervised with supervised learning techniques. Unsupervised learning techniques can distill features from unstructured big data (e.g., social media, product reviews), whereas supervised learning techniques (e.g., regression trees) can use those features for predictive analytics. With the dimensions of big data rapidly increasing, along with the potential for nonlinearity, we expect to see more applications of neural networks to both unsupervised and supervised learning, as noted by Lau et al. (2018).
Reinforcement learning (Sutton & Barto, 2018) is a ML technique that forces decision makers to dynamically choose actions that resolve uncertainty. This method is notably absent from retail analytics papers. A benefit of this method is that it allows decision makers to acquire knowledge about the true state of the world (“learn”) and achieve some long‐term objective (“earn”). Retail challenges that can be informed by these prescriptive analytical techniques potentially include product placement on the website and assortment personalization.
ML can be used not only to analyze data as described above but also to conduct large‐scale optimization under uncertainty. For example, online and omnichannel business models have drastically cut the time window for making decisions. In those settings, the integration of ML algorithms and combinatorial optimization—advocated by Bengio et al. (2021)—holds great promise for rapidly solving onerous optimization problems.
Specific avenues for future research
We detail three research projects in the spirit of the guidelines provided above. Each of them relies on better knowledge regarding consumer behavior and their responses to varied operational decisions.
Demand planning using big data
Description and motivation
A common theme in our conversations with practitioners was the desire to use multiple sources of data to better predict demand at the SKU‐store‐period level. More accurate demand predictions can improve the effectiveness of a wide range of retail decisions by better aligning operational resources with consumer demand. Interesting opportunities arise from the availability of new data sources, some of which are facilitated by new technology, as described in the “Data sources” section. The challenge is to combine diverse structured and unstructured data sources in a coherent and effective way that yields more accurate, granular, actionable demand predictions.
Model and solution strategy
Demand modeling approaches typically used in the literature originate from stochastic processes (e.g., Poisson arrival), economic theory (e.g., discrete choice models), statistics (e.g., log‐linear models), and ML (e.g., regression trees). Interesting possibilities arise when feeding new and diverse data into these models in the form of additional demand predictors. Such new data, however, may lack structure (e.g., text, audio, images, or videos). A solution strategy is to transform these raw inputs into structured data. Beyond manual coding and its limited scalability, a variety of ML methods may be applied: (i) text‐mining techniques for consumer activity in social media, transcripts of customer service interactions, and online reviews (e.g., LDA, word2vec), and (ii) image recognition algorithms for digesting photos of products, shelves, shoppers or social media images (e.g., deep learning).
The availability of these methods will allow researchers to deepen our understanding of the role and predictive value of social media posts, online reviews, and video archives of in‐store customer activity and store execution. Some of the retailers we interviewed are already deriving value from these tools (e.g., in‐store videos), using these insights to adjust their actions in real time. Moreover, some academic work has already begun assessing the value of these new information sources such as social media (e.g., Cui et al., 2018; Lau et al., 2018), search data (Boone et al., 2018), and in‐store videos (e.g., Musalem et al., 2021). Demand models have also been formulated as a function of product attributes. Because product attribute information is, according to several practitioners we interviewed, sometimes unavailable, the use of text mining to transform product descriptions into attributes may prove a promising way to improve demand forecasting.
Finally, another issue mentioned by our interviewees is the importance of model interpretability that helps users (problem owners) grasp the logic and mechanisms driving a particular prediction or recommendation. Models that make sense bolster confidence in analytics solutions, thus favoring adoption. Greater interpretability could be achieved by using theory in the feature engineering stage to motivate the inclusion of predictors that have a theoretical connection to the outcome variables. In addition, by enhancing the interpretability of the ML exercise, the findings could be more easily contrasted to theory or even help build new theory.
At the same time, greater interpretability may come at the cost of reduced predictive performance. Future research can address this issue in at least two ways: (i) assessment of the interpretability‐accuracy tradeoff by ranking the predictive performance of alternative models at varying levels of interpretability (see Bertsimas et al., 2022 for an application in the health sector) and (ii) development of approaches that open up black‐box ML algorithms to reveal greater understanding about why a particular ML model is selected or why a particular prediction is made. For example, Shapley values (Štrumbelj & Kononenko, 2014) are a useful metric that represents the average marginal contribution of a given feature toward a model score. Future research could further develop new metrics and tools that enhance the interpretability of ML models.
Data sources
Practitioners expressed interest in complementing traditional data sources (e.g., historical sales data, customer traffic, labor) with additional sources, such as weather, in‐store customer activity, census and demographic data, social media activity, clickstream data, and online search trends. As discussed above, other interesting opportunities stem from nonstructured data such as audio archives of customer service interactions, images and videos of in‐store behavior, customer reviews, and virtual fitting‐room usage.
Anticipated insights
Efforts in this line of research should produce demand models with better accuracy, a greater understanding of the role and predictive value of different data sources, and deeper insights into the tradeoff between interpretability versus accuracy in demand model types.
Forecasting product returns and optimizing restocking decisions in the omnichannel context
Description and motivation
Existing work on product returns has been mostly diagnostic in nature, with researchers exploring several drivers of product returns such as size information in online apparel retail (Gallino & Moreno, 2018) and salesperson traits (Ertekin et al., 2020) as well as customer impacts of returns (Griffis et al., 2018). Predictive work, that is, forecasting product returns, has been restricted to single‐channel settings: brick‐and‐mortar (e.g., dataset 1 in Shang et al., 2020) or online‐only (e.g., dataset 2 in Shang et al., 2020). To help retailers reinforce their omnichannel orientation and localize decisions, two key priorities laid out by our interviewees, any future work on returns management should target an omnichannel orientation (e.g., buy online, return in store) with a more modern analytics approach. More specifically, research could address the challenge of forecasting returns in an omnichannel context (volume and channel). It could also develop methodology to help retailers decide whether to restock an item in store or ship it back to the DC.
Model and solution strategy
Inspired by Shang et al. (2020), modeling approaches could either predict the volume of individual‐level returns based on transaction‐level data, which are then aggregated to forecasts of SKU‐level returns (predict‐then‐aggregate), or first aggregate the data to then forecast returns at the SKU level (aggregate‐then‐predict). To jointly model both channel and volume, two approach options can be weighed. First, in a two‐stage approach conditioned on volume, the share (volume) of each channel can be predicted. Second, a simultaneous approach could directly forecast the volume per channel. To illustrate, in a parallel (volume and channel)
To aid retailers in the decision to restock a product return in store or ship it to the DC, a heuristic can be developed that tracks the expected demand in store until the next resupply from the DC to in‐store inventory, appraising opportunity costs of potential lost sales from (expected) stockouts of the same item at
Data sources
The above models require transaction‐ and return‐instance‐level data across all channels. Further input of product traits—and, ideally, consumer‐level characteristics—would likely boost the quality of forecasts and recommendations. Product review data also represent a promising input for predicting return rates over time. It would be interesting to explore their forecasting power for the return channel. Product review data and social media content could also be used to understand the drivers of returns. These insights could be leveraged by retail employees handling the in‐store returns to suggest substitutions.
Anticipated insights
This line of research would equip retailers with the tools to predict return rates in an omnichannel context. The rise of “buy online, return in store” behavior further underscores the urgency for these insights. In addition, this research stream would help retailers optimize their omnichannel inventory management in coordinating positions across stores and the DC.
Leveraging store employees to improve customer service
Description and motivation
Customer service involves several dimensions affecting shopper experience. Some of these include wait times, product availability, and pre‐ and post‐purchase assistance and support. An important issue mentioned in the interviews is the efficient allocation of employees to different customer service roles. One interesting challenge is how to adjust this allocation in real time in response to customer behavior patterns. For example, one of our interviewees who used delivery scooters for home delivery mentioned the profound effect of weather. When it rains, more people order groceries—quickly incurring a driver shortage. The use of satellite forecasts could curb this problem. Another case is where employees can assist customers who experience a stockout in a store by ordering those products online using a mobile terminal. A third example uses video cameras to measure customer traffic in different sections of a store that can be used to implement the real‐time allocation of employees to different store departments. These examples illustrate the digitization of physical stores where features and data that have typically favored online store application (e.g., customer traffic to different departments, conversion, ordering products from other locations) can now be used in physical stores.
Model and solution strategy
The efficient allocation of employees to service roles requires both
Data sources
Such analyses require a combination of multiple data sources, some being more easily available, such as high‐frequency sales data (e.g., sales by product category for time intervals smaller than 1 hour). This information could be supplemented by storing traffic data that may be obtained, for example, from traffic sensors or video cameras. These data should ideally feed from the store department‐, category‐, or aisle‐level, including information about employee availability in those sections. Finally, as motivated by the insights of our interviewees, this input should be complemented with data on other demand predictors, such as weather, promotions, and online activity.
Anticipated insights
As a result of pursuing these research questions, investigators could develop tools that support a retailer's labor allocation for real‐time reaction to events driving changes in consumer demand.
DISCUSSION
As shown by bibliometric analyses, retail analytics is a field of growing salience in top operations journals. Four main decision areas emerge: inventory management, product promotions, distribution and delivery, and demand planning. At least one of these has been the focal topic in 77.2% of retail analytics papers. Substantial heterogeneity exists across decision areas in terms of the distribution of analytics type used, methods employed, retail sectors studied, and even the outlets that eventually publish these works.
Overall, prescriptive analytics has been most frequently applied, with diagnostic analytics a close second taking off after 2005. Predictive analytics—a late starter since 2014—currently offers a steady contribution to the retail analytics literature. The application of diagnostic analytics has stretched beyond econometric modeling to include quasi‐experiments and field tests. Predictive analytics has focused mostly on demand forecasting, but fresh efforts have emerged in decision areas such as returns handling. Over the last 5 years, predictive analytics has been most closely associated with big data (e.g., search data, social media data, product reviews) versus other analytics types. Such new data sources have cued the use of big data analytics: unsupervised ML, which extracts demand signals, and supervised ML, that is, regression trees and neural networks, which are even able to anticipate future demand indicators. Prescriptive analytics has mostly targeted optimization under uncertainty (arguably not yet at scale) and combinatorial optimization, as well as dynamic programming.
Interviews with practitioners worldwide have revealed analytics as still mostly in its infancy in practice. Barriers to successfully using analytics in retail cover a wide range of factors: culture, organization, people, processes, systems, and data. Meanwhile, there are clear paths related to each of these for enabling analytics. In addition, companies on the frontier of analytics seem to have found ways to make things work at scale, driven by a “think big (including strategic), start small (local, decentralized), scale fast (to the organization, leveraging institutionalized insights sharing)” mindset. To better collaborate with businesses and enhance the impact of our academic research, it is vital for scholars to be aware of these barriers to and enablers of successful implemention of retail analytics.
Advanced analytics usage of existing data is high on the agenda for all involved in the retail value chain. This will be stimulated by investments in data management systems, analytics solutions, and expertise. Many interviewees also expect to substantially invest in three types of technologies, the first type pertaining to technologies that ease analytics data handling, such as cloud infrastructure and computing. The second type will permit companies to more precisely track assets such as product inventory and shopping carts, RFID and IoT being popular examples. The third type includes technologies that help obtain a better sense of what happens in terms of in‐store traffic and shopper activity—video being most often mentioned here. Adoption of these technologies will spawn rich, new data sources, albeit mostly unstructured.
We see great opportunities for future research in retail analytics. Eliciting the priorities of practitioners (
Footnotes
ACKNOWLEDGMENTS
We gratefully recognize the excellent research assistance of Yvanca de Graaf. We also thank participants of the 2020 Annual EURO Working Group on Retail Operations, the 2021 Annual KÜMPEM conference, and the 2022 MSOM conference. We are indebted to our panel of industry experts, as well as to Marshall Fisher, Ananth Raman and Anna Sheen for providing access to members of the Consortium for Operational Excellence in Retailing (COER). In addition, we would like to thank Sebastian Gabel for constructive comments on earlier drafts of the manuscript. Andrés Musalem acknowledges partial funding from ANID AFB180003 and from ANID Fondecyt 1221554.
1
Section A in the Supporting Information illustrates this with Google search data.
2
As De Langhe and Puntoni (![]() ) explain, (decision‐driven) business analytics anchors on a decision to be made and seeks data for a purpose, while data‐driven decision‐making anchors on data that are available, finding a purpose from such. In addition, they argue that while analytics empowers decision makers, data‐driven decision‐making typically empowers the data scientists instead.
) explain, (decision‐driven) business analytics anchors on a decision to be made and seeks data for a purpose, while data‐driven decision‐making anchors on data that are available, finding a purpose from such. In addition, they argue that while analytics empowers decision makers, data‐driven decision‐making typically empowers the data scientists instead.
3
4
This meant excluding data from lab experiments not validated by field testing, as well as (empirically motivated) synthetic data.
5
See Section E in the Supporting Information for more detail about the three decision levels.
6
We did not encounter purely descriptive papers.
7
Section F in the Supporting Information details how we manually coded the annual tallies of research articles per journal.
8
Some papers use multiple datasets.
9
Stemming refers to the process of reducing words into a common base form (e.g., transactional and transaction to the common base transact).
10
We consider, in Section H in the Supporting Information, papers with only a single decision area and find even higher correspondence between our manual categorization and the automated text analysis. Therein, clear correspondence exists for eight of the nine decision areas.
11
The absence of an arc between a pair of decision areas implies no linkage within the
12
These factors closely relate to the building blocks of sociotechnical systems theory (culture, processes, goals, people, infrastructure, and technology), which states that social and technical factors interact to create successful organizational performance (Davis et al., 2014; Trist & Bamforth, ![]() ).
).
13
Technologies meant to enhance customer experience often have the added benefit of providing more insight into customer behavior. For instance, handheld scanners that allow customers to skip checkout also enable the retailer to observe how customers traverse the store and in what sequence they place items in their baskets.