
Abstract
This paper explores how innovation breakthroughs can stimulate future progress in individual innovation. It does this by introducing a new contest mechanism—one that shows signals of performance can yield information about the solution space. Simply put, observing another's high performance is a clue that can lead solvers to devise ways of achieving their own breakthroughs. Using a unique dataset of predictive modeling contests from Kaggle, we use 25,898 distinct attempts at innovation to highlight this new learning effect in contests and show how discontinuous leaps in innovation (as opposed to incremental steps) result in different outcomes. We achieve this by exploiting differences in the problem complexity. First, we find that leaps increase rates of entry and improve overall contest performance in complex problems. This effect applies not only to the best‐performing solvers but also to trailing solvers. Second, we provide evidence that suggests solvers actually change their approach and tackle innovation problems differently after a leap. This adds a new understanding about innovation contests and their incentives and has implications for contest design.
INTRODUCTION
This is a story about what happens when an ideator makes a big leap forward in innovation, and it begins with Kaggle, an online platform for data prediction contests. Kaggle contests are competitions set up by firms and organizations to crowdsource solutions to their difficult data problems. As an example, one contest asked participants to predict travel times on Sydney's M4 freeway from past observations. Another sought to improve credit‐scoring calculations by predicting the probability that someone experiences financial distress within two years. Such contests have been shown to be effective mechanisms for producing high‐quality ideas and stimulating innovation (Terwiesch & Ulrich, 2009; Terwiesch & Xu, 2008). Early on, employees at Kaggle noticed that big improvements to a contest's best score were often surpassed more quickly than smaller improvements. In our discussions, the founders flagged this phenomenon as surprising and wondered what might be causing it.
Our fundamental question looks at the effect of innovation progress on future innovation efforts. Let us ponder for a moment two seemingly similar events from track‐and‐field: Roger Bannister setting the mile world record and Usain Bolt setting the 100‐m world record, each in spectacular fashion. In 1954, the time of 4:01 had stood as the record mile pace for just shy of a decade. The 4‐min mile threshold seemed daunting (and had even been debated as physiologically impossible) when Roger Bannister broke through it. More recently, Usain Bolt shattered the record in the 100‐m sprint. His improvement to the world record over 15 months starting in 2008—an astonishing 0.16 s—equaled the improvements over all the previous 16 years. In both cases, the breakthroughs set a new bar for their respective sport. However, the stories played out in different ways. Just 46 days after Bannister's breakthrough, the mile record fell again, starting a string of record‐breaking runs over the next decade. In contrast, Bolt has held the world record for 13 years and counting (with no one coming within 0.11 s of his mark). We refer to these phenomena as the Bannister effect and Bolt effect—the first describing a situation where a breakthrough leads to more breakthroughs and the second describing when no such future improvements directly follow.
In the canon of innovation literature, there are many examples of Bolt effects. A host of strategic incentive mechanisms behave this way—including aspects of competitor heterogeneity, information structures, and contest timing, to name a few—and are well‐studied by economists (Casas‐Arce & Martínez‐Jerez, 2009; Konrad, 2009). In dynamic contests, a whole class of mechanisms known as discouragement effects predicts similar effort reductions (Dechenaux et al., 2015; Konrad, 2009). Such outcomes might occur if a new innovation raises the standards so high that it discourages other participants (especially weaker ones). A big jump forward might reduce uncertainty about the outcome and insulate the leader from future challenges.
Our first contribution is articulating how a signal of contest improvement can work in the opposite direction and act as a Bannister effect—as a new information signal about what is possible in the innovation landscape. The main idea is that if a solver sees someone else's high performance, that signal proves high performance is possible and can lead them to devise ways of achieving their own breakthroughs. This might occur if a new innovation teaches participants something about the solution space or the process. Such Bayesian updating would help solvers know what is feasible and might inspire new efforts or approaches. Our second contribution is demonstrating this new Bannister effect using a novel framing of problem complexity and showing how it leads to different behaviors from solvers in terms of their approach to innovation.
The term “innovation” has been used in conjunction with many concepts in the academic literature, often with various meanings. For our setting, we focus on innovation at the level of the individual, with innovation specifically referring to a solution that is better than the best prior solution for a given problem. To explore these possibilities, we look at the antecedents of two types of innovation—continuous (or incremental) and discontinuous (or radical)—in innovation contests. Refining or improving in small steps, in line with an existing trajectory, characterizes continuous innovation (Dewar & Dutton, 1986; Gatignon et al., 2002; Nelson & Winter, 1982), while discontinuous innovation involves disrupting that trajectory (Dosi, 1982; Green et al., 1995). Within the contest setting, we refer to specific continuous improvements as steps and specific discontinuous improvements as leaps.
Empirically addressing the research questions around this new mechanism is challenging for a number of reasons. First, there exists a measurement challenge. Objective measures of innovation outcomes are often imprecise or nonexistent. Second, there exists a selection challenge. Often, many solution attempts are not realized; without the entire distribution of innovation outcomes, any sample is distorted and captures a view of innovation biased toward the winners. Third, there exists an attribution challenge. Distinguishing the source of an effect is difficult and often requires appropriate within‐sample variation.
We develop a unique dataset to satisfy the above challenges using contests from Kaggle, with complete information about the contests, submissions, participants, and performance provided by the company. In all contests, participants get the same starting data and are tested identically (entrants must submit predictions in order to determine how well a particular algorithm scores). Participants are permitted multiple entries over the course of a contest, and we analyze all 25,898 of those solutions across 16 contests. This allows us to study many attempts at solving the same problems and—by leveraging differences in the complexity of the problems—use within‐sample variation along a relevant dimension to get some purchase on disentangling and demonstrating our Bannister effect.
Can a signal of contest improvement help future innovation attempts? Most importantly, we find that leaps increase effort and improve overall contest performance for complex problems. Just knowing that someone has made a big improvement—without visibility into the actual solution—results in better future innovation. We confirm these contest effects by estimating how the number of entries, rate of entries, time to new innovation, and maximum score trajectory change, accounting for the size of improvement. We also provide evidence that after leaps, solvers change the types of solutions they submit; by analyzing how subsequent scores differ, we find evidence that solvers may be searching the solution landscape differently. Incorporating competition characteristics, we find that leaps spur effort from close competitors (as expected) but also encourage all other solvers—especially in complex problem settings. We find the above results after accounting for some well‐known incentive effects around progress and superstars. Overall, we find evidence that Bannister effects can exist for contest improvement signals, with improvements leading to additional effort and better ultimate outcomes. This has important implications for contest design in terms of information disclosure choices and administrator decisions around participation.
RELATED LITERATURE
Contests have been shown to be effective mechanisms for generating new solutions (Terwiesch & Xu, 2008; Terwiesch & Ulrich, 2009), and there is a growing body of work on such contests in both the economics and operations management literature as a result. Much of the early contest research has dealt with basic questions around fixed contest characteristics, 1 although recent work has begun to look at the dynamic elements that play out as the contest unfolds. The question of how contest solvers respond to innovation progress fits into the latter and includes elements of both competition and feedback. We summarize a set of closely related papers here before developing a set of hypotheses to test our main questions in the next section.
Overall, participants seemed to pay attention during contests. In the case of expertise projects (with little uncertainty), a good solution submitted early in a contest reduces the number of subsequent entrants, especially among prior winners (Liu et al., 2014). Competition is defined in terms of solution performance and echoes early economics literature in innovation races (e.g., Fudenberg et al., 1983; Harris & Vickers, 1987). Early works on innovation contests (which seek the best solution with no predefined performance target) often frame competition in terms of the number of competitors faced, touting the negative impact of more solvers on effort (e.g., Fullerton & McAfee, 1999). However, an increased number of entrants does not always mean less effort; building on the model insights around heterogeneous solvers from Moldovanu and Sela (2006), recent works show that high‐quality solvers facing more competitors may exert more effort due to the expected increase in the winning score (Boudreau et al., 2016; Körpeoglu & Cho, 2018). All the above look at competition effects in one‐shot contest settings; we broaden that scope to include repeated‐entry contests.
The nascent literature on feedback in repeated‐entry contests is of growing interest and centers on the administrator–solver link during the contest, which communicates performance information to participants and has the ability to impact outcomes. Mihm and Schlapp (2019) model solver effort under various feedback regimes and find differences in how solvers exert effort. Under public feedback conditions, solvers spend substantial effort to win when contest performances are close—but reduce effort (both the leaders and followers) when one solver is way ahead. Their setting is nearly identical to ours, except that their model requirements limit feedback to be an incentive effect (i.e., how do the scores compare), with no effect around the informational content of feedback (i.e., where to direct search efforts). Looking at a set of Kaggle contests, Dissanayake et al. (2018) explore what influences effort allocation as a contest goes from start to finish and empirically find evidence that solvers who are closer to the winners tend to exert more effort. There is also some evidence that feedback effects how contestants search. In a field experiment with logo design contests, solvers behave differently—paying attention to the content of feedback and not just the score—depending on the type of information their feedback contains (Wooten & Ulrich, 2017). Similarly, Jiang and Wang (2020) find an informative role of feedback in logo contests, which results in increased solver effort as the information asymmetry between the seeker and solvers is mitigated. Finally, Gross (2020) explores how feedback scores influence solver creativity; a solver receiving a high score sharply decreases their subsequent originality in logo contests, while laggards change their approach—submitting artwork that is less similar to prior submissions. However, feedback scores here only relate to prior submissions by that solver, so learning is limited to oneself.
The above studies are all related to the question of how solvers respond to information during a contest. In general, the literature has looked at a solver's response to either the relative quality of their submissions or the presence of other solvers. Our paper fills two gaps in this literature: it articulates how feedback about competitors’ entries can help solvers search for better solutions and reveals how the magnitude of innovation improvement impacts both effort and performance.
HYPOTHESIS DEVELOPMENT
What happens when someone pulls ahead in an innovation contest? Can a big improvement result in a Bannister effect? To formalize our setting, consider an innovation contest that is open to the public, is sequentially scored upon submission (not batched) via a public leaderboard, and allows repeated entry by participants over the course of the contest. In observing a new signal of performance (score), solvers are learning both about the quality of the competition and also something about the solution space. However, there may be cases in which the information about the solution space is more salient. If an innovation problem is particularly tricky, for example, learning about what type of progress is possible becomes especially valuable. To delineate this complexity component in problems, we turn to a common innovation framework.
The process of innovating in a setting featuring high uncertainty and rewarding extreme values requires broad searching in addition to appropriate incentives (Boudreau et al., 2011) and is often characterized by a search for solutions on a rugged landscape of opportunities (Erat & Krishnan, 2012; Fleming, 2001; Sommer & Loch, 2004). The NK model, derived from biology (Kauffman, 1993; Kauffman & Levin, 1987), represents possible search solutions topographically, with higher elevation signaling better innovations. Figure 1 shows two such stylized search landscapes. On the left, a smooth, unimodal topography suggests a solution space where consistent improvement is possible and innovation is straightforward. On the right, a rugged landscape with multiple peaks suggests a different solution space, more representative of complex, uncertain innovation tasks. In this rugged environment, progress is subject to false steps, uncertainty, and dead ends (Fleming & Sorenson, 2001; Kavadias & Sommer, 2009; Sommer & Loch, 2004). We use this framework of contest search and complexity to develop six hypotheses that will guide the empirical analysis for our Bannister effects.
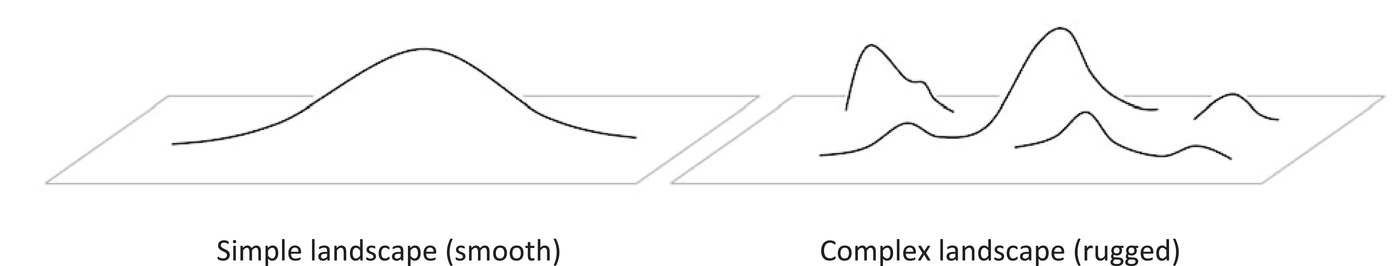
Stylized search landscapes
Individual participation in complex contests
Before describing what happens in the overall contest after a successful innovation, it is worth understanding the behavior of individual participants. If solvers do learn more about the solution landscape in certain settings, then we should observe some differences in their behavior in those settings.
Individual incentives and how participants react to various contest conditions make up much of the early work on contests in the economics literature. The importance of the gap—a participant's distance behind the leader—features prominently in the literature on rank‐order tournaments, for instance. Early analytical models hypothesize a pattern of increasing dominance in patent races in which overtaking the leader never occurs as long as the leader can ensure its advantage through effort or investment (Fudenberg et al., 1983; Harris & Vickers, 1987). Similar results arise from other setups where certain contest participants enjoy an advantage, including head starts in labor markets tournaments (Schotter & Weigelt, 1992) and valuation and ability asymmetries in R&D contests (Baik, 1994). The resulting impact on strategic decisions is that followers slow down (or reduce effort) as the gap with the leader widens. This common pattern is known as the discouragement effect (Dechenaux et al., 2015; Konrad, 2009) and can be observed in many contest settings. One of the reactions to a large gap in contest performance is that of an individual choosing not to continue with the contest. In other words, if someone falls far behind they quit.
However, we know that the discouragement effect does not work uniformly in all contest settings. Konrad (2009) details how incomplete information—as uncertainty around the solution, the path to achieve the solution, the feedback, or the competitors—weakens the discouragement effect. An example of this phenomenon shows up in software innovation contests, where uncertainty around the best approach to solving a problem results in a dampening of incentive effects, with competitors not responding to rivalry as much in multidomain problems (Boudreau et al., 2011). For problems with smooth solution landscapes (see Figure 1), the discouragement effect should be especially salient, as a head start in searching for the lone peak confers an important advantage. For rugged solution landscapes with many peaks and dead ends, ambiguity about the location of the global peak (uncertainty around the solution) and how to get there (uncertainty around the path) are more prevalent. These uncertainties match two sources of incomplete information above. Thus, rugged solution landscapes should feature more incomplete information, so we emphasize problem complexity as the driver of our first hypothesis. Innovation contests featuring more complex problems will have lower rates of abandonment compared to contests with less complex problems.
Effect of innovation progress on future entries
If solvers are abandoning complex contests less frequently, then the overall contest effort should change. The question of how contest solvers specifically respond to improvements has received some attention in the contest literature. A high‐quality answer submitted early in a contest has been shown to deter future entry as well as reduce the quality of subsequent submissions and overall outcome (Liu et al., 2014). Those effects are driven by deterring experienced users. This is evidence of a Bolt effect, with early innovations stifling additional efforts. However, the Liu et al. (2014) contests are translation and programming crowdsourcing tasks (described as expertise‐based projects with little uncertainty). Our first contribution is articulating how the contest setting matters for solver response. Imagine our two illustrative search landscapes (Figure 1). In both cases, a new innovation means solvers are farther away in terms of their distance behind the leader. Additionally, a new innovation teaches participants something about the solution landscape. However, the learning differs by landscape type. In a simple, smooth landscape, there is only so much that solvers can learn, but in a complex one, there is a much richer set of information to be discovered. Bayesian updating after contest progress would help solvers know what is feasible and might inspire new efforts or approaches. Seeing full solutions (in an unblind or open feedback contest) might permit detailed mapping of the solution landscape, but even simple metrics (such as submission scores from a leaderboard) would permit learning about the heights of the peaks. This is critical because, in a rugged topography, incremental local improvement does not confer the same benefit if you are on a diminutive peak. In this context, the size of the improvement matters. A big leap might serve as an informative signal about the potential for gains. Simply put, small step improvements might not change a solver's mental model of the solution space or their strategy, but leaps certainly could. Thus, in addition to an incentive effect, observing the size of improvement should have an information effect in rugged solution landscapes.
There is even some evidence that suggests effort may increase in such innovation settings. Examples include technological innovation races in the computer (Khanna, 1995) and disk drive (Lerner, 1997) industries in which followers are able to pass the leader after being behind. More recent studies have incorporated knowledge accumulation—instead of relying on the memoryless characteristic of earlier models—which leads to similar patterns of action–reaction, with firms that fall behind engaging in catch‐up behavior (Doraszelski, 2003). Across several settings, the takeaway is the same: followers do not seem to give up as early discouragement models suggest. We predict that rugged solution spaces encourage such additional effort thanks to the information effect of leaps and learning what is possible. Discontinuous leaps in innovation contests featuring complex problems will increase overall effort more than continuous steps, resulting in more aggregate entries per time period.
If being in a rugged solution landscape allows for an information effect, then that effect should be strongest as ruggedness increases. Work on landscape search has focused on how information changes search behavior (Fleming & Sorenson, 2001, 2004) and knowledge of the landscape can improve the economics of search and increase the optimal number of entries (Ales et al., 2021; Sommer & Loch, 2004; Wooten & Ulrich, 2016). The critical lever in these settings is the ruggedness of the landscape. We expect the same to hold here. Solvers should rationally attempt more entries for contests with more rugged solution landscapes, and observing what is possible from other solvers will contribute to that. If ruggedness is the lever, we should expect to see the effect more pronounced for the most complex problems. The positive impact of discontinuous leaps on overall effort will increase with problem complexity (for innovation contests featuring complex problems).
However, there are likely some limits to the benefit of information in a rugged solution landscape. For example, even if a leap signals what is possible, solvers still must put in efforts to realize the benefit, so structural limitations (like time) may impact decisions. With contest timing specifically, we know that solver effort generally increases at the end. Grossman and Shapiro (1987) describe this in R&D races as the pure progress effect—with increasing investment the closer a firm gets to the finish line. The same effect shows up in innovation contests, as Kaggle solvers increase effort at the end (Dissanayake et al., 2018). However, such results are predicated on having a chance to win, as increased effort must not be futile. Expectancy theory tells us that motivation should be highest for those who perceive that additional effort could change the outcome of the tournament (Casas‐Arce & Martínez‐Jerez, 2009; Vroom, 1964). Dissanayake et al. (2018) describe this trade‐off as a balance between the probability of winning and the cost of effort. Here, there is a distinction to be made between leaps and steps. At some point near the end of a contest, a leap forward should tip the balance of the incentive equation because the probability of winning (and overcoming a bigger gap) becomes too low—whereas the same is not yet true for a step. By considering the size of an improvement, a new tension emerges between the pure progress effect and the discouragement effect. So, while we expect the pure progress effect to hold, we predict that it will not impact all contest solvers and situations equally. The positive impact of discontinuous leaps on overall effort will decrease at the end of contests (for innovation contests featuring complex problems).
Effect of innovation progress on future performance
While the previous section focused on entry quantity, contest performance (not entrant behavior) is the ultimate measure of success in tournaments. It is generally assumed that more effort yields better performance in innovative endeavors. While that is partly because objective measures of innovation are scarce, Terwiesch and Xu (2008) model effort as both a deterministic and stochastic driver of solution performance in innovative problem‐solving and emphasize its role in three stylized contest types: ideation projects, expertise‐based projects, and trial‐and‐error projects (which characterize effort as the number of attempts). The expected yield from effort also shows up in the empirical innovation contest literature. In a set of scientific problem‐solving contests, more hours of effort invested by an entrant results in a greater chance of winning (Jeppesen & Lakhani, 2010). Similarly, in a set of logo design contests, more submissions by an entrant result in a greater chance of success—both winning and placing in the top three (Bockstedt et al., 2016). Thus, if effort increases, the literature suggests performance should as well.
The above evidence pertains to the quantity of effort. The quality or direction of effort could also matter. A more creative approach or effort redirected along a more fruitful path could also improve performance. We know that local search works best on simple, smooth landscapes—but those same local approaches are unpredictable in complex landscapes and can trap solvers on a local peak (Fleming & Sorenson, 2004). Indeed, in complex landscapes, there is a benefit of abandoning local optima in order to find more fruitful areas via more distant, radical search. One way this could occur is by observing the performance of others, which would provide information about the solution space and the existence of more fruitful areas. A scientist at IBM Research (and top performer in one of our Kaggle contests) emphatically stated that just given a dataset, he would not have performed nearly as well—that he was motivated to try new things after others overtook him on the leaderboard. More directly, evidence from the contest literature supports this view. Gross (2020) finds that solvers in online logo contests submit solutions that are better (on the order of half a standard deviation) when they deviate from their prior entries and try new approaches. That result focuses on what solvers learn from feedback on their own entries. If we believe that leaps from others in the contest confer informational effects in terms of the landscape, then similar benefits could result. Importantly, we predict that a leap within a complex landscape will spur others to abandon local optima and search for more promising solutions. Coupled with our positive effort‐performance link, this leads to our next hypothesis, which predicts increased performance after bigger breakthroughs. Discontinuous leaps in innovation contests featuring complex problems will increase overall contest performance more than continuous steps, resulting in a faster rate of improvement.
While looking at overall contest improvement directly addresses the Bannister effect, looking at other performance metrics may help bolster the claim. As mentioned previously, contest success hinges on the single best answer and top solutions are difficult to achieve. Because solution quality is hard to predict a priori for complex problems and rugged solution landscapes, looking at solver choices with respect to their direction of effort has value. In a lab experiment using a combinatorial product design search task, Billinger et al. (2014) conclude that the availability of information about the search landscape (such as peak magnitude) likely impacts the process of searching because exploration is riskier and reference points drive risk attitudes, in line with prospect theory (Kahneman & Taversky, 1979). If solvers are reacting to information effects revealed by a discontinuous leap, then we would expect to see more exploration afterward from all solvers. Discontinuous leaps will induce more divergent solver exploration (for innovation contests featuring complex problems).
It is important to note that several other factors are intertwined with contest performance, including temporal effects, skill levels of competitors, and so forth. Even though these related factors do not receive additional theorizing here, attempts to control for these variables and provide additional analyses to account for alternative explanations (in order to reinforce the hypotheses above) are included in the Results section.
DATA AND METHODS
To address the hypotheses posed above, we rely on detailed contest data from an algorithm tournament platform. Innovation tournaments are settings that often divorce the problem owner from the solution generator. They generally offer little visibility into the specific genesis of an idea (which is rarely easy to observe) but high visibility into the interaction between the solution generators and the problem owners. This section summarizes our contest setting and that data.
Contest platform
Kaggle, the leading online platform in the crowd‐sourced predictive modeling market, provided the data we analyzed. It offers mathematical measures of success as a numerical score, requires submitting an answer set to be evaluated, occurs in a stable setting where the evaluation is consistent from start to finish, and captures every submission set (both successful and not). Since 2010, Kaggle has hosted public data science competitions where sponsors post their problems and data scientists from all over the world compete to create the best solution. Companies such as General Electric, Merck, Allstate, Facebook, and Ford have hosted contests.
Contest winners are awarded predetermined cash prizes whose amounts vary significantly, with most between $1000 and $100,000. Typical contests last 2–4 months. In its first 10 years, Kaggle has hosted over 450 public competitions (as well as 13,500 private competitions for school classroom use) for its community of over five million members (535,000 of whom are active), amounting to more than $10 M in cash prizes. Our sample of contests is restricted to cash prize contests from its first 2 years of operation.
A common concern in innovation tournaments is the discrete nature of single, winner‐take‐all prize structures and the possibility of limited motivation on the part of the solvers (Boudreau et al., 2011). Here, that is less of a concern; Kaggle features a for‐hire practice that rates and matches talent from its contests with companies looking for project consultants. Facebook has even run two contests where the winning prize was a job at Facebook, so there is real value (and motivation) in the platform for entrants.
Algorithm contest details
At any given time, a dozen or more contests (Supporting Information Appendix A) are active on Kaggle. Most contests permit teams to submit multiple entries over the course of the contest. This allows teams to submit, observe the quality of their algorithm's predictions (as a score), and iterate. There is often a cap on the number of submissions per day—typically between one and five—and contests run for a predetermined amount of time.
Each contest includes a competition overview, datasets, a leaderboard, and administrative details (including the prize amount, deadlines, and number of participating teams). The leaderboard is visible to the public and shows how well each of the participating teams is doing in the competition. It contains each team's name, score, member profiles, current rank, 1‐week change in rank, number of entries, and timestamps for best and last submissions. Participants do not observe the actual submissions of entrants, only the informational data above. A sample leaderboard is shown in Supporting Information Appendix B.
Once a contest has begun, participants may download the datasets and begin submitting entries to Kaggle for scoring. There are typically two distinct datasets. The first is a training set, which is used to develop an algorithm and includes filled‐in values for the response variable of interest. The second set is the test file and has the response variable omitted. An entry consists of a team's predictions for the missing response variables in the test file. Winners are chosen based on the ability to accurately predict the missing responses. Kaggle scores entries by comparing teams’ predictions to the actual answers. A fraction of the test dataset (usually 25–33%) provides scores for the public leaderboard (Supporting Information Appendix B). Final placement is calculated from the reserved, private portion of the test set.
Platform overview
Kaggle granted us access to the full database records of their contests over a period from 2010 to 2011, which includes 26,082 entries in 23 contests. After removing those contests that did not allow repeated entry, were publicity stunts, or were test launches, our sample consists of 25,898 entries across 16 contests. As these are blind contests with repeated entry, entrant information is restricted to their own private information and that which is publicly available on the leaderboard. Table 1 shows overall, contest‐level characteristics for the 16 contests in the sample. To measure effort and performance, we observe a set of detailed, entry‐level contest variables—shown in Table 2. Table 3 contains the descriptive statistics and correlations on those variables.
Contest overview
Data definitions
Descriptive Statistics (entry‐level) and Correlations
Measuring discontinuous leaps in innovation
In order to analyze whether innovation breakthroughs stimulate or impede future progress, we must first be able to characterize whether a particular entry is a breakthrough. Within the contest setting, we refer to continuous improvements as steps and discontinuous improvements as leaps. How many of each do we observe?
Over the 16 contests, 418 of the 25,898 entries (or 1.6%) result in a new best score for the contest. Thus, improvement is hard to come by—suggesting that solutions to these data science problems are tricky and nonobvious. Of those 418 improvements, determining a classification methodology for steps and leaps is also nonobvious, thanks to several contest features that must be accounted for.
First, contests occur over time, leading to a changing environment. The problem remains the same, but each contest is dynamic, so an entry's timing is important. The second entry must only best the score of one other, while the 99th must best 98 others in order to be an improvement. As might be expected, our contests display a diminishing rate of improvement over time, with big gains early on and smaller gains as the contest draws to a close. This resembles the expectation for both ideation and trial‐and‐error projects, which display diminishing improvements over time, with each increase requiring more entries in expectation (Terwiesch & Ulrich, 2009; Terwiesch & Xu, 2008).
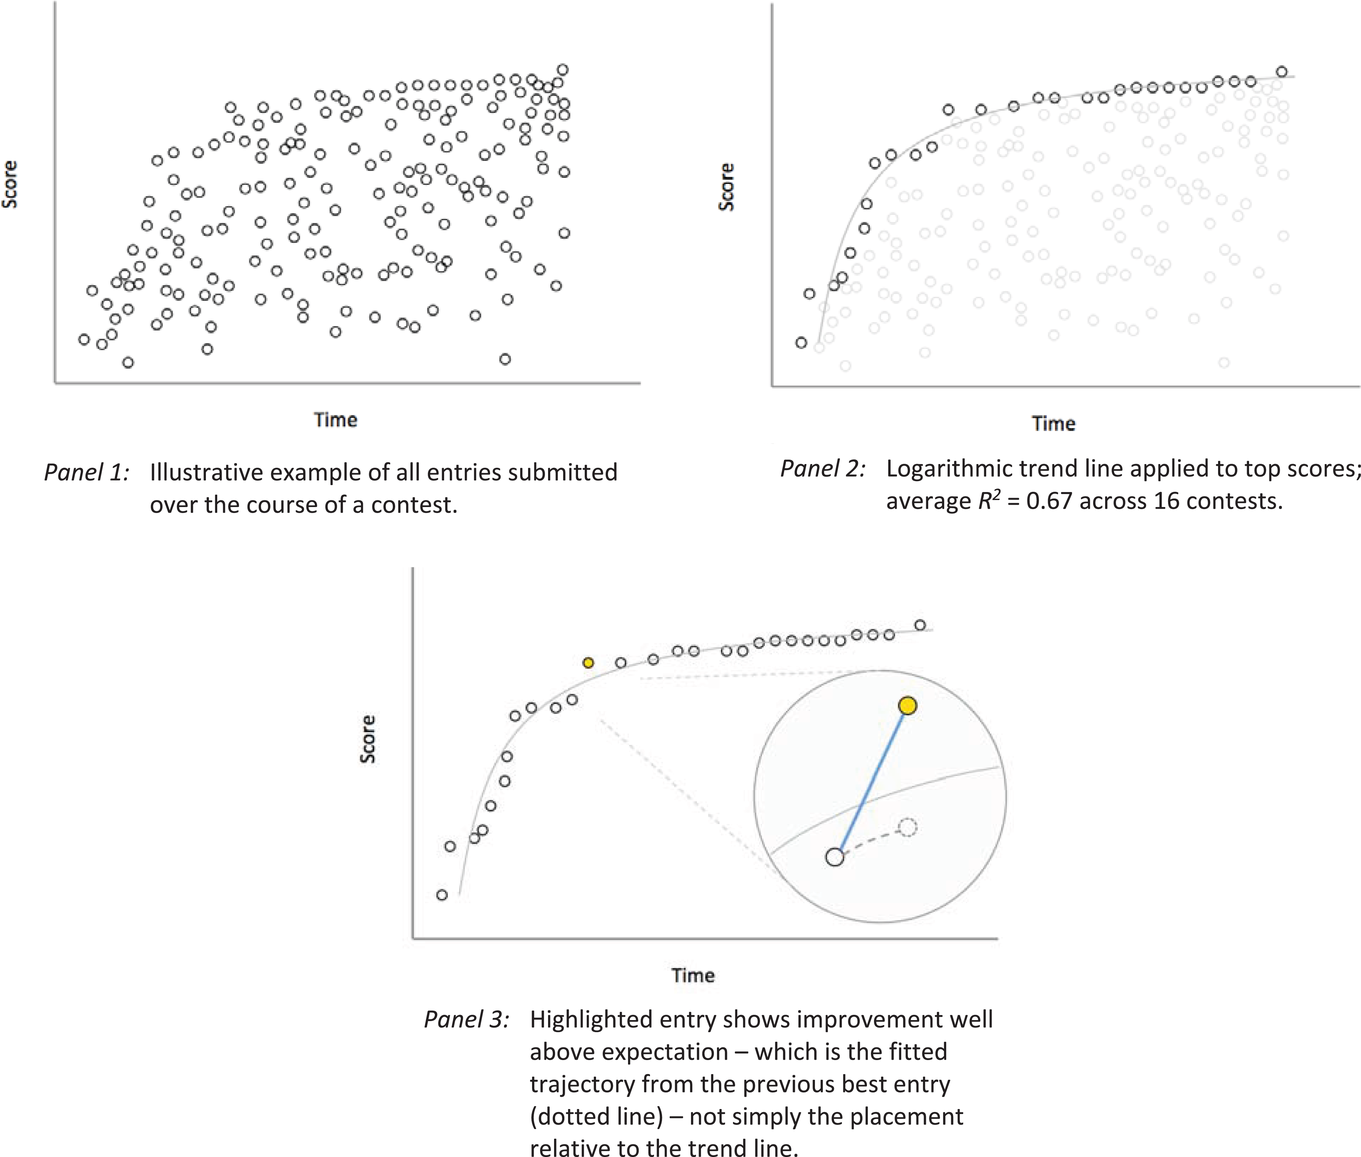
Any measurement of improvement should take into account that improvements later in the contest are more difficult. However, each contest is distinct in its problem and level of difficulty, so these allowances should be unique to each contest. Our approach is to characterize the rate of improvement of the best entries over time. Evaluating the contests ex post, we fit each contest i with a logarithmic trend line, S = βi ln(T) + c, where S is given by the normalized top scores and T is elapsed time. From that, we calculate the expected rate of improvement at every point using βi so that when a new top score occurs, we can assess whether it is more or less than expected, given the trajectory of that contest's progress. One technical point concerning the methodology bears mentioning—when calculating the expected improvement from a previous top score to a subsequent submission, we use our ex post trend line rate of improvement but anchor it to the previous top score. This links a submission's expected value to the previous top score. Were the evaluation based solely on whether a point was above or below the trend line, you could end up with a misestimated expectation. For example, if an entry Z is well above the trend line but imperceptibly above the previous best score, the jump in performance should be credited to an earlier entrant (and not Z). We accomplish this via our anchor. An illustrative example of these steps is shown in Figure 2.
Identification of innovation leaps
Finally, we must decide on a rule that determines which improvements are steps and which are leaps. We contemplated several measures of improvement before choosing two. The first is an absolute measure, given by (Improvement observed) − (Expected improvement); the second is a relative measure, given by (Improvement observed)/(Expected Improvement). We consider both the absolute and relative measures because of our diminishing improvement rates. Late in the contest, large absolute gains are unlikely, but even small improvements could represent an enormous relative improvement. Conversely, early on, large absolute gains are expected but large relative gains are mathematically infeasible. (This is also why a binary classification system works better than relying on a single continuous measure to evaluate the degree of improvement.) To flag an improvement as a leap, it must be in the top 20% of either our relative or absolute measure. That corresponds to an absolute gain greater than 0.0046 or a relative gain greater than 9, which yields 116 leaps (28% of top scores) and 274 steps over 16 contests. Forty‐nine of the 116 leaps meet both the relative and absolute cutoffs. We exclude the first three entries in every contest from being tagged as an improvement (giving us 390 total improvements instead of 418). Distributions of contest performance based on our measurement approaches can be seen in Supporting Information Appendix C.
We also relax the threshold, as a more generous sensitivity test, to include any improvement where the absolute measure (the gain over expectation) is greater than zero. This definition yields 191 leaps (49% of top scores) and generally similar results in our analysis.
Measuring contest complexity
The other important measure to capture to test our hypotheses is the complexity of the problem. We assert that each of these algorithmic Kaggle contests is more complex than a simple contest on a smooth landscape—such as an expertise‐based project with no uncertainty in performance function where expertise and effort completely dictate the solution quality (Terwiesch & Xu, 2008)—but differences within the set could still be informative.
For our purposes, a good complexity metric will capture the ruggedness of the solution landscape (see Figure 1). A poor metric might capture a prospective entrant's perception of task difficulty, which could prove to be accurate or not. While solvers likely understand which problems are complex early on, they may not understand the particulars of how a problem is complex, which must be learned. One Kaggle solver we spoke with summed up this perspective nicely: It's very hard to tell how hard the contests will be without getting a feel for the nuances of the data shared, something I think takes a ton of time and is the most important dimension of difficulty… the data generating distribution is a big part of what defines the structure/smoothness of that complexity landscape.
To operationalize complexity, we make use of one feature of the Kaggle prediction set. As mentioned above, the test dataset (for which solvers submit predictions) contains both a public and private portion. A classic machine learning pitfall is overfitting, which occurs when models adhere too closely to the public data portion. An overfit solution set will match the public data well but the private (holdout) data less so. Rugged solution landscapes would be more prone to such overfitting with their high degree of interaction. This phenomenon has been documented for Kaggle contests using changes in submission scores (Roelofs et al., 2019) and rank placement (Trotman, 2019) to determine how much the public and private predictions differ—a measure known as shake‐up. We rely on the comprehensive analysis conducted by Trotman (2019) and use its established shake‐up measure for each contest as an approximation for complexity.
Contests with high shake‐up are those with less prediction stability. For our contests, the highest shake‐ups were observed in an INFORMS contest predicting short‐term stock price movements (0.157) and a contest predicting HIV progression using a small nucleotide sequencing dataset (0.118); the lowest shake‐up was observed in a Wikipedia contest predicting the number of edits an editor would make (0.007). Complexity is defined as high for any contests where shake‐up is >0.050, a clear breakpoint in our distribution that results in 6 high‐complexity and 10 low‐complexity contests. A binary variable is used since the base measure (shake‐up) is simply a proxy for ruggedness and could be influenced by other aspects of overfitting or solver strategy and may differ in its functional form, although results are largely the same with the continuous measure. Future work could certainly craft a landscape to explore complexity in more detail via an experiment.
Data and variables
Having identified the top scores as leaps or steps, evaluating our hypotheses requires quantifying their effect on effort and performance. To evaluate effort, we define two variables that measure the rate of entries at a particular point in time—# entries and change in entry velocity. The first captures the number of entries appearing in the 5% of contest time after a particular entry. Because of the dynamic environment, change in entry velocity is defined as a difference measure, equal to the number of entries in the 5% of contest time after a particular entry minus the number of entries in the 5% of contest time prior. Entries from the solver who submitted the reference entry are excluded from all counts. This velocity metric captures whether more or fewer innovation attempts occur after a submission, relative to the number of prior entries. This means entries from the first and last 5% of the contest are omitted from that analysis.
To evaluate performance, we define three variables to measure the speed of progress, rate of progress, and degree of solver exploration. To capture the speed of progress, we define days elapsed to innovation as the time elapsed (in days) until another improvement occurs (from a different entrant). By ignoring immediate improvements from the same entrant, this metric captures how quickly the other competitors react. To capture the rate of progress, we define max score trajectory as the amount of improvement observed in the top score over the next 30 submissions. The calculation does not include the current point; it measures the difference in MaxScore( n +30) − MaxScore( n +1), relative to the current entry, n. The 30‐submission cutoff (which in magnitude is similar to the median number of entries in 5% of time during the first half of contests) is used in order to provide a measure that contrasts the time‐based metric using days elapsed. To capture the degree of solver exploration, we must rely on indirect measures. Actual solutions cannot be observed and hence cannot be used to classify divergent search directly; instead, we use score as a proxy. This final performance metric focuses on how much absolute difference exists between a solver's entry and their best prior score; it aggregates that measure over the next 30 entries as average score movement. This captures how different (on an absolute basis) subsequent entries are from prior solver bests and is designed to reveal something about the types of entries being submitted based on how close they are to a solver's past successes.
Three variables are included as contest controls in every model—prize amount, contest length, and contest appeal—to account for differences in contest characteristics. In addition, day of the week and contest progress are included in all models detailing specific entry behavior to account for the temporal elements of the contest.
In this setting, we have many aspects that are well controlled by the Kaggle platform. For instance, the submission and scoring procedure is well designed and resistant to obvious attempts to game the system. It requires that a solver submit a prediction set to observe performance but also sets limits on daily submissions so that infinite search cannot be automated. These are good with respect to the validity of our data. However, because we are investigating dynamic elements within a complex environment, identification is a concern. Specifically, issues with respect to autocorrelation crop up in the context of time series panel datasets. The Arellano–Bond test for autocorrelation is well suited for dynamic panel models in small T, large N environments. Our dataset is large T, small N. Additionally, we do not have discrete time periods in our data, since our analysis occurs at the level of each submission. 2 In some contexts, it is possible to exploit timing differences (e.g., around feedback dissemination or platform changes) and use the variation as a lever to improve identification. The automated platform gives instant feedback upon submission, and we are not aware of any disturbances that we can fruitfully exploit. We employ difference measures as dependent variables in several of the models and only use a randomly selected subset of data points to avoid oversampling, both of which could help remove some serial correlation. By employing a wide variety of controls, from contest characteristics to contest effects (fixed and random) to solver controls, we attempt to account for as many obvious threats as possible.
RESULTS
Individual participation in complex contests
To begin, we ground this study in the documented discouragement effect from the incentive literature but add our key descriptor of search landscape topography—contest complexity. Our first hypothesis predicts that more complex problems will experience lower abandonment rates if performance signals contain information about the solution landscape for individual solvers. Table 4 presents the results, with future participation as both a binary indicator and a count of future entries and with complexity as a binary measure (see Section 4.5).
Future Participation
Note: Standard errors are given in parentheses.
Significance levels * < 0.10, ** < 0.05, *** < 0.01.
Column 4‐1 reports estimates from a simple logit model. The coefficient estimate on the distance between an entrant's first score and the best contest score at the time is negative and significant (−0.66, p = 0.00). This indicates that entrants who are farther behind the leader after their first entry are less likely to submit another entry, in line with the discouragement effect. For complexity, we observe a significant, positive coefficient (0.41, p = 0.00), indicating that more complex problems are more likely to induce continued participation.
To handle differences across contests, which could influence our behavior measures if not accounted for, we include several control variables—prize amount, contest length, and contest appeal. Another salient characteristic of our contests with respect to motivation is the deadline. As the end of the contest approaches, motivation is high but time is short. Grossman and Shapiro (1987) describe this in R&D races as the pure progress effect—with increasing investment the closer a firm gets to the finish line. We include contest progress to account for when an entry shows up in the contest, as in Dissanayake et al. (2018). These additions (column 4‐2) do not change the results.
To increase confidence, we also model the dependent variable as the number of future entries (instead of a binary measure of participation) with a negative binomial regression (columns 4‐3 and 4‐4). In all cases, the coefficient on complexity is positive and significant, while the coefficient on distance behind remains negative and significant. This shows that new entrants are less likely to abandon trickier problems, supporting our first hypothesis. However, our analysis cannot yet suggest why or how. The next sections probe the specific ways in which solvers react to new innovations to gain more insight into the process.
How leaps influence entries
Having observed a solver response to complexity, we now investigate how innovation advances impact the volume of future submissions. We expect that innovation leaps can motivate increased solver effort thanks to the information effect of landscape height. From the full dataset of 25,898 entries, this analysis includes all 390 leaps and steps, as well as a randomly selected 5% subset of data points that exhibit no improvement. We do this to establish a baseline yet avoid oversampling; if we included absolutely every entry, we would be including the same values many times over since the dependent variables are measurements over time.
Table 5 shows the results of our linear regressions—including controls for entry timing and contest effects. Since our contest controls (prize amount, contest length, contest appeal, and especially complexity) are interesting but time‐invariant, random effects for each contest are used after confirming appropriateness through a Hausman test for each model (e.g., p = 0.99). Fixed effects models, with those characteristics subsumed, show similar results. A simplistic approach to determine innovation's impact on competitive effort might look at the number of subsequent entries over a standardized period of time to see if they differ depending on the type of improvement (none, step, or leap). We append this to our analysis (column 5‐1) to serve as a benchmark. The coefficient estimate on leaps is positive, significant, and bigger (24.44, p = 0.00) than the coefficient estimate on steps (15.76, p = 0.01). The controls for the day of the week show up as negative coefficients on Wednesday through Saturday because our dependent measure extends several days from the day of measurement and weekends are less busy than weekdays. Contest progress is included to capture the elapsed contest time.
Comparison of leaps and steps on effort
Note: Standard errors are given in parentheses. The number of observations varies since DVs are time‐dependent (i.e., 5% after vs. 5% before/after) and dropped if missing.
Abbreviations: DF, degree of freedom; DVs, dependent variables.
Significance levels: * < 0.10, ** < 0.05, *** < 0.01.
The rest of Table 5 shows our main analysis with a more sophisticated dependent variable. Column 5‐2 reports estimates from regressing change in entry velocity on the improvement type. The coefficient estimate for leaps is positive and significant (30.94, p = 0.00). Thus, observing a leap improvement in the best score increases the number of entries in the next 5% of the contest (accounting for the previous rate of entry). An increase is also observed for smaller step improvements, with a coefficient that is positive and statistically significant (15.61, p = 0.01) from the base case (none) but of a smaller magnitude than after leaps. This magnitude difference just misses our significance threshold (p = 0.11); the individual coefficient test in our robustness models with solver controls, however, is significant for model 5‐1 (p = 0.03, see Supporting Information Appendix F). These first two models provide weak evidence that participants submit more entries after leaps (H2a). This is the first hint of a Bannister effect and that solvers may be doing something different after a big innovation.
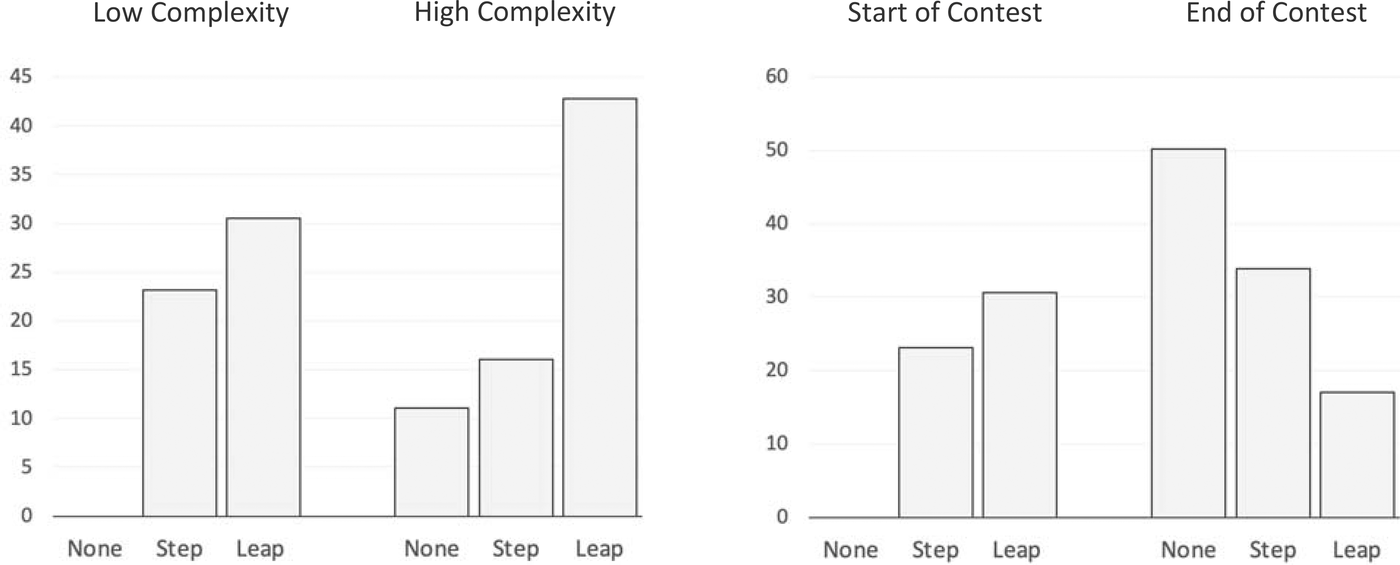
To analyze this further, we include complexity as an explanatory variable to tease apart the within‐sample variance of our data (column 5‐3). The coefficient on complexity is positive and significant (11.09, p = 0.00), meaning complex problems generate more entries than simpler problems in our algorithmic contests. Together, the fact that leaps and complexity both result in more entries helps rule out alternate explanations for what could be happening. For example, it is unlikely that solvers are simply hoping for an exogenous shock; if that were the case, we might see a positive coefficient on complexity but would be unlikely to see one on leaps simultaneously. Furthermore, the interaction effect on steps is negative and significant (−18.21, p = 0.00). That exacerbates the difference from the main effect and results in much bigger effort after leaps in complex landscapes, lending support to H2b.
Figure 3 depicts the summed coefficients to highlight the main insights. First, leaps in complex contests inspire solvers to enter much more often (left panel). This suggests that a signal of high performance in the case of a complex problem carries more information about the solution space and what is possible. That knowledge appears to lift up the effort of solvers, substantiating our Bannister effect. Second, we observe more entries at the end of contests (right panel), as the pure progress effect would predict (Grossman & Shapiro, 1987). Neither leaps nor steps are as motivating as no‐improvement entries at a contest's end (−63.74 and −39.56, column 5‐3). A realistic explanation is that big performance gaps at the end of contests seem insurmountable. Big improvements at the beginning of contests, however, inspire the biggest increase in entries. In fact, looking at the summed coefficients as contest progress changes, balance does not shift away from leaps until after the midway point. These results lend support to H2c.
Change in entry velocity based on problem complexity and contest progress.
How leaps influence performance
The next question is whether more effort after leaps translates to better contest entries. Increased entries alone are insufficient to conclude that solvers are changing their approach or improving the ultimate outcome. Our next models (Table 6) examine how leaps change the performance of future entries—do subsequent submissions score better? Controls for entry timing and contest effects are the same as in Table 5. 3
Comparison of leaps and steps on performance
Note: Standard errors are given in parentheses. Days elapsed DV (6‐1, 6‐2) measures the number of days until the next improvement of any kind (whether a step or leap); Max score trajectory (6‐3) measures improvement over next 30 entries; robust to 10, 50, 100 entries instead; Average score movement (6‐4) measures the average absolute difference of next 30 scores and their best prior score.
Abbreviations: DF, degree of freedom; DVs, dependent variables
Significance levels: * < 0.10, ** < 0.05, *** < 0.01.
The first model (column 6‐1) is a baseline model that relates number of days elapsed to innovation to whether leaps or steps were present. The dependent variable captures how many days it takes for another improvement of any kind (from a different solver). The coefficient estimate on leaps (−0.34, p = 0.81) is significantly smaller than steps (2.42, p = 0.02). This indicates that in our contests, a new innovation (from a different solver) arrives more quickly after a leap than after a step. This remains true throughout the contest, as the interaction terms on progress do not change this relationship. Column 6‐2 adds in our measure of problem complexity. In the full model, the story is largely the same. The main effects on leaps and steps are no longer significant; however, problem complexity now accounts for the difference. The main effect of complexity is positive and significant—creating an improvement takes longer for more complex problems, which matches what one would expect. More importantly, the interaction terms are significant. We again see that it takes longer to achieve another improvement after a step (but not a leap)—but only when the problem is complex. This result matches perfectly with our proposed Bannister effect, in which there is a benefit to seeing a big improvement in innovation for complex problems (H3a).
Our next model introduces a second measure of performance to evaluate how future entries improve the top score (column 6‐3). Max score trajectory is the amount of improvement observed in the top score over the next 30 submissions. The coefficient on leaps is positive and significant (0.086, p = 0.00), resulting in future top scores that are higher than those after steps or submissions without any improvement. The dynamic characteristics behave as strategic incentive models might predict, with contest progress and problem complexity both reducing the rate of innovation progress. However, after summing the main and interaction effects, the coefficient on leaps is always higher than that of steps or no‐improvement—sometimes significantly higher but never worse off. We also assess the robustness of these results by considering alternate measures of our dependent variable, max score trajectory. We find no differences in the estimates as reported, whether the innovation trajectory is measured over the next 30 entries (as shown in column 6‐3) or alternate specifications (over 10, 50, or 100 entries). All of this evidence points to leaps producing better rates of performance for future entries, which supports our performance hypothesis (H3a). In order to gain insight into the mechanism at work, we look at one additional analysis.
Column 6‐4 employs average score movement as a measure of solver exploration to see if solvers may actually be searching differently on the solution landscape. Imagine a solver who submits a solution that is virtually identical to their best scoring solution. With high probability, their new score will be close to their prior best and their score movement will be tiny. Now imagine a solver who submits a solution that is wholly different than their best so far. It is more likely than before that their new score will be substantially different, resulting in a larger score movement. This simple idea is the basis for our final dependent variable. A big score movement is more likely when a solver tries something new, as complex solution landscapes permit large deviations with exploration. If there is no change, that would provide some evidence that the search process before and after may be similar. If, instead, there is a change, then that might suggest that entrants are employing a different process in their search for solutions. The main effect on leaps (0.077, p = 0.00) is positive and significantly different than those for no improvements or steps, which is also positive and significant (0.053, p = 0.00). This confirms that scores are more varied after a leap. Including a number of controls on the entry characteristics does not eliminate the difference. Additionally, using a different measure of entry variety—a differences measure around the variation in scores for submitted entries (conceptually similar to our entry velocity metric)—yields similar results, with a positive and significant coefficient estimate on leaps (0.022, p = 0.001) and an insignificant coefficient estimate on steps (−0.000, p = 0.971). All of these are consistent with increased exploration by solvers after leaps.
Thus, among all our performance measures, we observe some differences favoring leaps. Both the lower days until entry (columns 6‐1, 6‐2) and higher trajectory (column 6‐3) provide support for H3a. Our measures around average score movement (column 6‐4) are consistent with H4b. Future performance seems to be improved by an extremely innovative entry. Since leaps should be more difficult to overcome than steps, seeing the opposite results provides support for our Bannister effect (with an improvement leading to more, quick progress). The evidence of a different process being used after leaps and in complex landscapes has some parallels in the creativity and search literature. Audia and Goncalo (2007) show that an individual's past creative success is positively related to generating future creative ideas but negatively related to generating ideas that diverge from prior solutions. In an experiment on search strategies, Billinger et al. (2014) find that success tends to constrain the search for new alternatives to the area previously explored and that failure is what motivates more exploratory search. This represents a new type of learning that can occur in dynamic, repeated‐entry contests.
Robustness tests
We perform a number of robustness checks in order to strengthen the validity of our results. Several have been mentioned in the text but are reiterated here for completeness: Leaps: Definition relaxed to include any improvement where gain over expectation is positive (Section 4.4) Problem complexity: Continuous measure used for complexity instead of binary (Section 4.5) Expertise: Including a measure of skill in data science contests using Kaggle's internal point system.
4
Individual effort models: Analysis run as both binary and count models (Section 5.1) Complexity models: Analysis run as both binary and count models (Section 5.2) Changing entry velocity: Using nonoverlapping entry sets, so excluding any entries from effort analysis if something from that timeframe is already in the analysis set (Section 5.3) Max scoring trajectory: Robust to using the next 10, 30, 50, or 100 entries (Section 5.4) Average score movement: Score variation (entry‐centric DV) used instead of average score movement (entrant‐centric DV) (Section 5.4)
For all of the above, we obtain largely similar results that reinforce the models presented. Supporting Information Appendices D and E show our robustness checks for the alternate specifications of our leaps and complexity measures. We also replicate all presented analyses while controlling for who submits. Prior conclusions are confirmed, with very similar results (see Supporting Information Appendix F for an example). In several cases, the effects become larger (or more obvious) in the theorized direction, as in column F‐3, where solvers expend even more effort after leaps occur in complex problems. This further supports our evidence in favor of information effects. We default to reporting the models without solver controls since many of our models only use a portion of the data for the temporal analyses. Because most submissions from a given solver are omitted, many solver effects may not be specified for a contest. Including solver controls is another way to account for solver‐related effects that we might otherwise omit. The fact that results remain the same should increase the confidence in the conclusions.
Additionally, we extend our analysis to account for the relative contest position among the solvers. The classic economic incentive argument—namely, that effort is simply a function of the probability of winning and that competitor closeness is what influences a solver's decision to expend effort (Konrad, 2009)—could explain some of the effects we are seeing. For example, a recent paper models effort in Kaggle‐type innovation contests and (by including feedback and uncertainty) shows that effort in subsequent rounds is substantial for similarly‐performing solvers (Mihm & Schlapp, 2019). That effect shows up empirically as well, with increased effort when solvers get closer to winning positions (Dissanayake et al., 2018). Other variations include increased effort from top solvers in response to more participants (Körpeoglu & Cho, 2018) and increased performance from top solvers in response to more skilled competition (Boudreau at. al, 2016). These results rely on the incentive effects based on the probability of winning.
Here, interestingly, we find that effort increases for both solvers who are competitive and those who are farther behind. To measure this, we disaggregate the entry velocity dependent variable 5 in order to measure how entry velocity changes for the top 10 solvers and everyone else for every point in time (see Supporting Information Appendix G). Overall, top leaderboard solvers submit significantly more after a leap (9.62, p = 0.00). This is somewhat expected, as this is the group for which the incentive effect will be highest since they are in close competition with the new leader. More surprisingly, we still see a big effect of leaps on all other entrants. The main effect is positive and significant (but not distinguishable from steps). However, taking problem complexity into account results in the impact from leaps and steps moving in opposite directions. The summed effect of leaps in a complex environment for non‐top‐10 solvers is 32.57, versus 13.39 for steps. If feedback only confers an incentive effect, this result would be unlikely. The fact that we observe a positive impact of leaps that increases with problem complexity for solvers who are not at the top of the leaderboard supports our hypothesized Bannister effect. The positive impact of discontinuous leaps on effort is not limited solely to the most competitive solvers.
The above analysis accounts for heterogeneous reactions to innovation progress based on who is at the top of the leaderboard. However, there is another phenomenon in contests related to the participation of superstars (high‐quality solvers who consistently outperform). In a study of one‐shot programming contests, the mere presence of superstar entrants decreases entrant performance on average (Boudreau et al., 2016). In the same setting, Zhang et al. (2019) show that superstar presence negatively impacts win probabilities but also that positive spillover effects exist because losing competitors learn more and have more future success. The unhelpful impact on performance is mixed in other competitive contexts—it shows up in golf (Brown, 2011) but replication studies find little evidence of such an effect in a wider set of sports settings (e.g., Babington et al., 2020). All these studies look at the impact of superstars in one‐shot contests. The dynamics and incentives could be different in a repeated‐entry innovation contest, but to our knowledge, no one has looked at them. Here, we account for this possible effect by including a superstar variable in our analysis. Using our measure of experience, which is based on Kaggle skill points (see Section 4.6), we take the top 10 individuals from our 2438 solvers (0.4%) as superstars. In our 16 contests, these solvers show up 23 times. We then design a binary measure to record whether a superstar has entered a contest at a given point in time. We include superstars present in our models on effort and performance and see identical results as reported in Tables 5 and 6. The superstar coefficients from each of those models are shown in Table 7. Results are robust to a variety of designations for who counts as a superstar (we show top 10 and top 15) and other interactions with a superstar (such as contest progress).
Effect of superstars on effort and performance
Note: Standard errors are given in parentheses; Replicates the models from Tables 5 and 6 with a control for whether a superstar had entered the contest.
Robust to including contest progress interactions with superstar variable.
Significance levels: * < 0.10, ** < 0.05, *** < 0.01.
Looking at Table 7, all of our prior results remain the same, but we also observe superstar effects. Coefficients on change in entry velocity are positive but not significant, so we do not observe more or less effort from contestants when a superstar joins a contest. We do see significant impacts on performance. The presence of a superstar appears to speed up the rate of innovation overall (which makes sense) but dampen the trajectory of future improvements. Looking at the average score movement from solvers (−0.068, p = 0.00), one explanation is that solvers are less exploratory in the presence of a superstar. This is consistent with our theory and provides a possible explanation. While solvers pay attention to the problem characteristics and invest more if the solution landscape can deliver positive shocks, they can still be influenced by particularly good competitors. If superstars are dampening future performance, it may not be from effort‐reducing pathways; instead, it appears that solvers may be less inclined to try different approaches. This would be an interesting area for future research.
DISCUSSION
What is the effect of innovation progress on future innovation efforts? The bulk of this paper distinguishes between two types of improvements that can happen in innovation—the iterative, incremental step and the radical, discontinuous leap—and their effect on further innovation. Analyzing entry‐level data from 16 algorithmic data science contests, we find empirical evidence for the following. First, behavior after discontinuous leaps differs from behavior after continuous steps in innovation contests. We find that (1) leaps result in weakly increased rates of entry submission (accounting for temporal patterns, submission history, and solver), (2) higher problem complexity yields higher effort, especially after leaps, (3) after accounting for the pure progress effect, which generally results in more submissions at the end of contests, we observe a slackening of effort after leaps and steps that resembles strategies in one‐shot contests, (4) leaps lead to quicker innovations and higher rates of improvement from a performance standpoint, and (5) leaps lead solvers to submit solutions that deviate more from past successes than in other cases, suggesting increased exploration of possible solutions. We also examine competition characteristics and find that (a) leaps spur effort from close competitors (as expected) but also encourage all other solvers—especially in complex problem settings and (b) superstar entrants do impact performance, possibly affecting the ways solvers look for solutions (reducing how exploratory/novel their searches are but not their effort).
Given the increasing use of contests as a recognized and productive pathway for innovation, quantifying the precise workings of solver–administrator interactions is important. Most broadly, the question of how contest solvers respond to innovation progress is a question centered on the effects of information. With the above results, we provide additional evidence against reductive forms of contests with few participants and restricted entry (e.g., Boudreau et al., 2011). Complex innovation contests benefit from many solvers and the exploration of many pathways. In addition, if solvers derive value from the information effects of feedback—specifically, learning from others’ information (even just scores, as demonstrated here)—then that opens up additional paths to assess contest formats. For example, we know that public feedback is optimal for low uncertainty contests and private feedback is optimal for high uncertainty contests (Mihm & Schlapp, 2019). However, those equilibrium efforts are derived under incentive effects only; if informational effects can positively impact effort and performance in contests, then augmented models might suggest a greater benefit of public information disclosure for complex contest problems—possibly even enough to make open public feedback optimal.
Managerial implications
The first implication is that not all innovations are created equally. The antecedents of innovation contest improvements differ based on the degree of improvement and complexity of the contest. Do more significant innovations always lessen the effort and creativity of other innovators as might be expected? No—in fact, the opposite can happen. Similar to high‐ability individuals in rank‐order computer coding tournaments (Boudreau et al., 2016), the reaction to increased competition can be positive thanks to a learning effect. In more complex contests, solvers derive value from learning about the performance of others. Shortly after a big leap in our setting, entry rates increase (early in the contest) and better scores are submitted. In other words, we observe a Bannister effect, with big improvements supporting more effort and further improvement from challengers. Participants are engaged and pay attention. Even in blind contests, where solutions are not revealed to the public, participants follow the trajectory of the contest and are impacted by the top score and how it changes. This implies that contest administrators should leverage the information effect of public feedback. One recommendation is to use leaderboards to display contest scores. Our analysis shows that solvers (even using limited information) are adept at leveraging information that can help them deal with complex problems. Also, given that our Bannister effect shows that innovation begets more innovation, it seems motivating early progress would benefit the ultimate contest outcome. Encouraging early participation (through prizes, recognition, etc.) could reinforce this.
The second implication is that not all contests are created equal. Previously, Bolt effects (e.g., incentives) show up in less complex, expertise task contests. Incorporating an analysis around problem complexity, we demonstrate that problem characteristics impact search response. Thus, contest administrators should make sure to understand the type of contest problem in their contest. Specifically, we highlight differences in how complex contests derive value from solvers. Additionally, we show that average solvers play an important role in pushing the frontier of innovation forward in contests, with increased entry velocity and more divergent entries after leaps. These all demonstrate ways in which contests differ, and as contests become more understood, increasingly good prescriptions can be made in terms of how to set up and run contests.
Limitations
With respect to our recommendations above, there are some limitations. Figuring out which approaches best encourage early participation is a topic that requires future investigation. Related to this, we also recognize that all solvers may not respond to new signals about the solution space the same. It is possible that our Bannister effect is particularly motivating for a certain type of solver—this, we also leave to future research to uncover.
Overall, our use of real‐world contests is mostly a benefit but does include some hurdles. By examining challenging, complex problems that real companies seek to solve through tournaments, we avoid many issues of irrelevance. The fact that only 1.6% of all entries resulted in a new top score highlights that these are not trivial problems and may even generalize to broader innovation contexts. The drawbacks, however, are the challenges encountered without the randomness of a true intervention. Internal validity and confounding variables are a concern, as the real, public nature of these contests requires that lots of elements be outside the control of the investigator. We do not observe the true amount of effort exerted by each solver for each entry—such as the number of hours worked—but the contests have the nice property that an entry must be submitted in order to be evaluated.
Two issues crop up in our analysis that deserves further mention. There is a chance that strategic waiting is occurring in submissions. Even though entries must be submitted in order to be evaluated, it is certainly possible that solvers with potentially promising approaches could (1) wait to submit until later in the contest or (2) game the submission process by submitting a partial file of predictions (which would artificially lower their resulting score—masking their progress to the world—but still provide some useful data since they would know how much data were submitted). The fact that we analyze both effort and performance as responses help mitigate this concern. Even more, if leaps encourage “strategic waiters” to go ahead and submit, then the benefit of leaps is further validated and the extent of the phenomenon could simply be explored in future research. Additionally, we explore one particular type of innovation tournament in this paper. Algorithmic data prediction contests represent only a small fraction of the total contests and innovation efforts being pursued. While we think that the rigorous and challenging nature of these uncertain scientific problems represents general areas of innovation fairly well, the results may not generalize to all blind, repeated‐entry tournaments.
Overall, this paper contributes a new understanding to the contest literature by demonstrating that a leap in improvement can result in a novel Bannister effect that lifts up future innovation attempts. Previous research has not broadly explored elements of repeated‐entry innovation contests. The goal of this paper is to shed light on one aspect of that dynamic ‐ how solvers respond to innovation progress ‐ and begin to understand the mechanics of how solvers navigate such issues. Understanding how contests induce better solutions ultimately leads to better contests and better practices.
Footnotes
1
2
One option would be to aggregate our data into more orderly time series buckets (e.g., days) and reframe the analysis. This would throw away much of the specific, granular nature of the dataset, which is critical to observing detailed reactions.
3
Day is included but not shown in the chart because unlike effort, which is influenced by site volume during the week, there is little reason to believe performance will differ by day (and that is confirmed, with no significant patterns in the coefficients).
4
Kaggle ranking points gathered retrospectively (∼2 years after our contest timeframe) on over 129,000 solvers. The upside is a more stable representation than if we had collected at the time of the contests and no penalty for first‐time entrants. The downside is possible undervaluing of some users who become inactive. Additionally, our measure only captures Kaggle platform experience; general experience with data contests is unobserved.
5
Including a control variable for solver quality is not sufficient, as that would control for the quality of the entrant. Here, the impact to the top solvers is the critical analysis, so new DVs that split the old velocity into two parts—and allocate the applicable portion to solvers at the top of the leaderboard and to everyone else—is better.