
Abstract
The coronavirus disease 2019 (COVID‐19) pandemic has disrupted normal operating procedures at transplant centers. With the possibility that COVID‐19 infection carries an overall 4% mortality rate and potentially a 24% mortality rate among the immunocompromised transplant recipients, many transplant centers considered the possibility of slowing down and even potentially pausing all transplants. Many proposals regarding the need for pausing organ transplants exist; however, much remains unknown. Whereas the impact of the COVID‐19 pandemic on the overall healthcare system is unknown, the potential impact of pausing organ transplants over a period can be estimated. This study presents a model for evaluating the impact of pausing liver transplants over a spectrum of model for end‐stage liver disease‐sodium (MELD‐Na) scores. Our model accounts for two potential risks of a pause: (1) the waitlist mortality of all patients who do not receive liver transplants during the pause period, and (2) the impact of a longer waiting list due to the pause of liver transplants and the continuous accrual of new patients. Using over 12 years of liver transplant data from the United Network for Organ Sharing and a system of differential equations, we estimate the threshold probability above which a decision maker should pause liver transplants to reduce the loss of patient life months. We also compare different pause policies to illustrate the value of patient‐specific and center‐specific approaches. Finally, we analyze how capacity constraints affect the loss of patient life months and the length of the waiting list. The results of this study are useful to decision makers in deciding whether and how to pause organ transplants during a pandemic. The results are also useful to patients (and their care providers) who are waiting for organ transplants.
INTRODUCTION
The triumphs of modern medicine have rendered the promise of solid organ transplants—a field of medicine that draws from advances in surgery, medicine, anesthesia, critical care, immunology, and blood medicine, saving more than 26.4 million life months in the United States (Rana et al., 2015). These advances have allowed solid organ transplants to become the standard of care for many patients suffering from end‐stage kidney or liver diseases. In 2019, a total of 23,401 kidney transplants and

The decision of whether to pause organ transplants during a pandemic is undoubtedly a complex one because of many unanswered questions. For example, (1) What is the risk of donor transmission? (2) What is the impact of immunosuppression in the setting of the pandemic infection? (3) What is an appropriate use of healthcare (both inpatient and outpatient) resources for transplant recipients, and is consuming more resources in a time of scarcity appropriate? The first two questions can only be answered as data continue to be collected. Such assessment will also need to be adjusted and appraised on an ongoing basis, because the risk of transmission relies on not only the pathological features of the pandemic, but also the burden of disease within a hospital. The third question will also need to be answered at the hospital and local levels, because not all hospitals have the same resources, infrastructure, or burden of disease.
This study focuses on quantifying the risk of pausing organ transplants on the providers and patients. More specifically, using liver transplants as the clinical setting, we address four important questions: (1) Should a decision maker pause organ transplants? (2) If so, which categories of patients should be paused and which categories should not? (3) Can a decision maker achieve better outcomes by considering the heterogeneity across transplant centers? (4) How do capacity constraints affect the loss of patient life months and the length of the waiting list?
The first question about whether to pause organ transplants is interesting to decision makers at the country level. For example, CMS recommends the continuation of organ transplants (CMS, 2020), and the American Society of Transplantation (AST) recommends the suspension of living‐donor transplants (Alasfar & Avery, 2020) across all transplant centers in the United States. As another example, Swisstransplant coordinates with the six transplant centers in the country and the Federal Office of Public Health to develop a six‐stage plan, of which the first stage is to stop all living‐donor transplants and the final stage is to stop all transplants (Ahn et al., 2020). A main challenge to addressing the first question is the patients on a waiting list for organ transplants change over time—new patients are added to the waiting list and existing patients are removed from the waiting list due to organ transplants, deaths, or inactivations. 2 Also, some patients become sicker while waiting for organ transplants. To address these challenges, we first develop a system of differential equations to capture the dynamics of a waiting list. We then compare the scenarios in which centers continue or pause organ transplants. Finally, we identify the threshold probability above which a decision maker should pause organ transplants.
The second question considers the heterogeneity across patients by analyzing which categories of patients should be paused (i.e., patient‐specific). Given the risk of a pandemic and the capacity of transplant centers, the possibility exists that some patients should be paused for organ transplants and others should not. For example, in the setting of liver transplants, patients with high scores from the model for end‐stage liver disease (MELD) cannot be paused for liver transplants, because these patients can survive only a few days without liver transplants. Recognizing the differences in patients' condition, Kumar et al. (2020) propose a phased approach that pauses liver transplants for patients with MELD scores below 25 and 30 when a center needs to reduce its surgical capacity by 50% and 75%, respectively. Similarly, Syed et al. (2020) propose pausing liver transplants for patients with MELD scores below 15, 20, and 30 when the severity of resource shortage is “mild,” “moderate,” and “severe,” respectively. However, these studies are perspective articles that do not have rigorous analyses to support their proposals. We fill the gap in the literature and address the second question by developing an analytical approach to identify the categories of patients whose organ transplants should be paused.
The third question considers the heterogeneity across centers by analyzing which centers should pause organ transplants (i.e., center‐specific). Because the severity of the pandemic varies across different areas, the possibility exists that some centers should pause organ transplants and others should not. For example, as of December 1, 2020, the number of active COVID‐19 cases per 1000 people was 45 in North Dakota and 3.25 in Vermont. 3 Because an increase in the number of COVID‐19 cases increases the risk of organ transplants, centers in North Dakota might need to pause organ transplants more than those in Vermont. To address the third question, we compare two scenarios: (1) A decision maker uses country‐level data to make a nation‐guidance recommendation to all centers and (2) a decision maker uses center‐level data to make center‐specific recommendations. Intuitively, a center‐specific policy is superior to a nation‐guidance policy for a center, because the former considers the situation of the center. However, how much a center‐specific policy is better than a nation‐guidance policy is what we address in this study.
Whereas the first three questions focus on the direct impact of the pandemic (i.e., the probability of mortality due to the pandemic), the fourth question focuses on the indirect impact of the pandemic by incorporating capacity constraints into our model. Besides preventing risk exposure of recipients to the virus after transplants, centers may have to direct scarce healthcare resources toward the care of COVID‐19 patients. As a result, the capacity or throughput of centers may be reduced. For example, as of December 1, 2020, the number of ventilators in shortage was 1073 in Texas and three in Vermont. 4 The lack of healthcare resources such as ventilators undoubtedly affects the surgical capacity of transplant centers. To analyze the impact of capacity constraints, we perform sensitivity analyses by considering scenarios with different capacity constraints. The results are useful to policymakers in understanding the impact of capacity constraints on patient outcomes.
We make three contributions to the existing literature. First, by using a system of differential equations to capture the dynamics of a waiting list and analyzing the costs and benefits of pausing organ transplants during a pandemic, we explicitly calculate the threshold probability above which a decision maker should pause organ transplants. Second, we compare complete shutdown and tiered shutdown policies to illustrate the value of a patient‐specific approach and compare nation‐guidance and center‐specific policies to illustrate the value of a center‐specific approach. Third, we analyze how capacity constraints affect the loss of patient life months and the length of the waiting list. The results of this study are useful to decision makers in deciding whether and how to pause organ transplants during a pandemic. The results are also useful to patients (and their care providers) who are waiting for organ transplants.
LITERATURE REVIEW
In the medical literature, a growing number of studies estimate the impact of COVID‐19 on the mortality of organ transplant recipients. For example, Pereira et al. (2020) study 90 patients who received organ transplants at two New York transplant centers and were subsequently infected with COVID‐19 during the first three weeks (i.e., between March 13, 2020, and April 3, 2020) of the outbreak in New York City. The authors find the probability of mortality due to COVID‐19 is 18% among infected recipients and 24% among hospitalized recipients. In another multicenter study, Kates et al. (2021) study 482 patients who received organ transplants at over 50 transplant centers and were subsequently infected with COVID‐19 between March 1, 2020, and April 15, 2020. The authors find 20.5% of the hospitalized recipients died within 28 days after COVID‐19 infections. The authors also find old age, congestive heart failure, chronic lung disease, obesity, and abnormal chest imaging significantly increase the probability of mortality.
The increased risk due to COVID‐19 raises an important question to both patients and their care providers about whether to pause organ transplants. Kumar et al. (2020) are among the first to provide a personal viewpoint on the impact of COVID‐19 on organ transplants. By comparing the practices from different countries, the authors suggest mitigation strategies such as donor screening, resource planning, and a phased approach to new transplant activities. This study has two main strengths. First, the authors of this study are from different countries such as Canada, Italy, Japan, Korea, Spain, and Switzerland. Their collective experience is valuable to the transplant community, especially those that do not have a large enough sample size, to analyze the impact of COVID‐19 on organ transplants. Second, the study discusses various types of organ transplants such as kidney, liver, heart, and lung transplants. The results are useful to hospital managers and policymakers in implementing organ‐specific policies, because the impact of COVID‐19 and medical urgency differ across different types of organ transplants. The main caveat of this study is that it is a perspective article without empirical data or theoretical models.
Massie et al. (2020) conduct simulation studies from patients' perspective to analyze the costs and benefits of organ transplants during the COVID‐19 pandemic. More specifically, the authors first analyze waitlist and posttransplant mortalities using Poisson regressions. The authors then compare transplant and nontransplant outcomes using a Markov decision model. Then, the authors use their estimated benefits of organ transplants during the pandemic as outcomes and classify patients into different groups using the classification and regression trees. Finally, the authors identify the relative importance of different patient characteristics and epidemic parameters using a random forest. Similar to Massie et al. (2020), Vinson et al. (2021) use a Markov model to analyze the impact of discarding deceased donor organs and find that, although the life expectancy of both patients on the waiting list and those receiving organ transplants decreases as the pandemic situation worsens, the benefit of organ transplants outweighs the risk of infection.
Our study differs from these studies in four main ways. First, these studies analyze the impact of COVID‐19 on organ transplants from patients' perspective. By contrast, we study the impact from decision makers' perspective and analyze whether transplant centers should pause organ transplants, and if so, which categories of patients should be paused. Second, these studies do not consider how a patient's health condition changes on the waiting list and how a patient's probability of receiving an organ transplant depends on other patients on the same waiting list. By contrast, we use model for end‐stage liver disease‐sodium (MELD‐Na) scores to model how the condition of a patient changes over time and a system of differential equations to model how the probability of receiving an organ transplant depends on the size of the waiting list. Third, whereas these studies do not account for local resource availability, we consider capacity constraints and analyze how these constraints affect patient outcomes. Finally, whereas these studies analyze only the costs and benefits to patients of pausing organ transplants, we compare different pause policies and illustrate the value of patient‐specific and center‐specific approaches to both patients and healthcare providers.
In the operations management literature, Arıkan et al. (2018) study the effects of organ quality, median waiting time for a transplant, and competition among transplant centers on the intent to procure organs. The authors find the intent increases with organ quality, median waiting time for a transplant, and competition among transplant centers. In particular, the authors find lower quality organs are more likely to be procured in a donation service area (DSA) with longer waiting times. Using a counterfactual study, the authors show sharing the bottom 15% quality kidneys increases the intent to procure organs. Arora and Subramanian (2019) develop a game‐theoretic model to analyze how the decisions of the organ procurement organization (OPO) and the hospital affect their respective payoffs and societal outcomes. The authors identify possible misalignments in the objectives of the social planner, the OPO, and the hospital, especially when the quality of recovered organs is heterogeneous. The authors recommend contracts that can better align the objectives without harming the OPO and the hospital when the operating room utilization is sufficiently high or low. Similarly, our study considers a hospital's operational decisions concerning organ transplants that impact patient and societal outcomes. However, we study these decisions under a novel and complex setting of the COVID‐19 pandemic.
In a recent study, Anderson et al. (2020) create a computer simulation model to analyze the impact of suspending elective surgeries on the flow of patients in a midsize hospital. The authors find the number of patients waiting for surgeries triples compared with pre‐COVID‐19 levels, and returning surgical rates to pre‐COVID‐19 levels will take 5 months if the hospital can double its surgical capacity in the short term. The authors make several recommendations to ramp up capacity for serving the pent‐up demand: (1) allowing surgical staff to work overtime, (2) reactivating furloughed personnel, (3) hiring temporary workforce, (4) diverting to ambulatory surgery centers, and (5) triaging.
Our study differs from Anderson et al. (2020) in three main ways. First, from the perspective of the clinical setting, we study whether transplant centers should pause organ transplants, whereas Anderson et al. (2020) study the impact of suspending elective surgeries. Second, from the perspective of analytical methods, we use a system of differential equations to capture the dynamics of a waiting list, whereas Anderson et al. (2020) use a computer simulation model to analyze the flow of patients. Third, from the perspective of managerial insights, we compare different pause policies to reduce the loss of patient life months, whereas Anderson et al. (2020) study how much capacity increase is needed to serve the pent‐up demand.
MATHEMATICAL MODELS AND PAUSE POLICIES
To analyze whether a decision maker should pause organ transplants during a pandemic, we need to compare the loss of patient life months due to delays of organ transplants in the case of a pause with the loss of patient life months due to infections in the case of no pause. In this section, we first introduce a system of differential equations to capture the dynamics of a waiting list for organ transplants. We then describe how to calculate the loss of patient life months with and without pausing organ transplants. Then, we introduce different pause policies for decision makers to consider. Finally, we describe how to find the optimal pause policy and calculate the threshold probability above which a decision maker should pause organ transplants. Note that the analyses in this section are from the providers' perspective. We calculate the threshold probability from the patients' perspective to guide the decision of accepting or declining an organ offer in Appendix A of the Supporting Information for comparison purposes.
Differential equations
We denote by


Description of key parameters
Note: This table describes the key parameters used in this paper. The subscript 
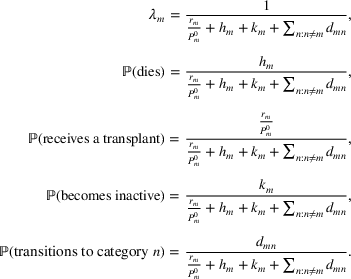
To derive a system of differential equations that capture the change in 


We denote by 


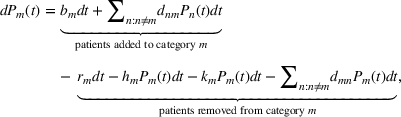


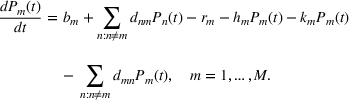
Taking derivative with respect to 
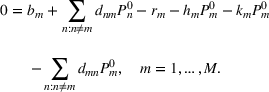
Observing that the number of patients in each category remains almost the same (i.e., in a steady state) before the pause, we can find the steady‐state solution 

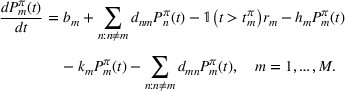
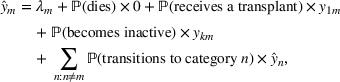
We denote by 


Loss of patient life months
A patient on the waiting list may have one of the following four outcomes: (1) The patient dies and leaves the waiting list before receiving a transplant; (2) the patient receives a transplant, leaves the waiting list, and dies afterwards; (3) the patient does not receive a transplant, becomes inactive, and dies afterwards; (4) the patient does not receive a transplant and transitions to other categories. We denote by 


To allow the possibility that the severity of a pandemic changes over time (e.g., COVID‐19 variants), we consider multiple periods such that the probability of mortality due to the pandemic is the same within the same period and different across different periods. Without loss of generality, we consider two periods (denoted by 


If a decision maker does not pause organ transplants, the loss of patient life months due to the pandemic is
If a decision maker pauses organ transplants under the policy 

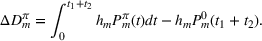
The second metric is the number of extra deteriorations from healthier categories to sicker categories. We calculate this metric by patient category because the rate of deterioration differs across different categories of patients. We denote by 


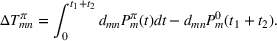
We denote by 


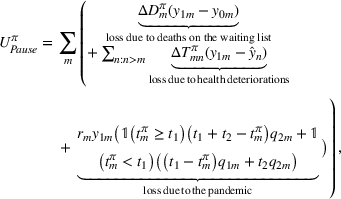
where the three terms indicate the loss of patient life months due to deaths on the waiting list, health deteriorations, and the pandemic, respectively.
Pause policies
In this section, we first describe the difference between the complete shutdown and tiered shutdown policies to illustrate the value of a patient‐specific approach. We then describe the difference between nation‐guidance and center‐specific policies to illustrate the value of a center‐specific approach. Finally, we describe different pause policies with examples.
Complete shutdown versus tiered shutdown policies
Under a complete shutdown policy, a decision maker pauses organ transplants for all categories of patients for the same period. As a special case, when the pause period equals zero, the decision maker does not pause any organ transplant. Under a tiered shutdown policy, the decision maker pauses organ transplants for categories 1 to 

Nation‐guidance versus center‐specific policies
Under a nation‐guidance policy, the decision maker does not consider the difference between centers and pauses organ transplants at different centers in the same way. Under a center‐specific policy, the decision maker considers the difference between centers and pauses organ transplants at different centers in center‐specific ways. Intuitively, the center‐specific policy is superior to the nation‐guidance policy, because the former considers the heterogeneity across centers (i.e., more center‐specific). However, the two policies may be similar if centers are homogeneous.
Description of different pause policies
Considering different combinations of complete shutdown versus tiered shutdown and nation‐guidance versus center‐specific policies, we have four different pause policies (see Figure 1). We illustrate these policies by using a simple example with two centers (center 1 and center 2) and two categories (category 1 and category 2) of patients. Nation‐guidance complete shutdown policy: A decision maker does not consider the difference between patient categories or the difference between centers, by pausing all organ transplants in all centers for the same period. An example of this policy is to pause both categories in both centers. Center‐specific complete shutdown policy: A decision maker considers the difference between centers but not the difference between patient categories, by pausing all organ transplants in some centers and no organ transplant in the other centers. An example of this policy is to pause both categories in center 1 and neither category in center 2. Nation‐guidance tiered shutdown policy: A decision maker considers the difference between patient categories but not the difference between centers, by pausing the same categories of patients in all centers by the same period. An example of this policy is to pause only category 1 in both centers. Center‐specific tiered shutdown policy: A decision maker considers both the difference between centers and the difference between patient categories, by pausing different patient categories in different centers. An example of this policy is to pause category 1 in center 1 and both categories in center 2.

Illustration of different pause policies Note: This figure depicts different pause policies. Under the complete shutdown policy, the decision maker does not consider the difference between patients and pauses all categories for the same period. Under the tiered shutdown policy, the decision maker considers the difference between patients and pauses categories 1 to
Optimal pause policy and threshold probability
When the risk of a pandemic is known, a decision maker can analyze the effectiveness of a pause policy (denoted by 


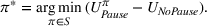
When the risk of a pandemic is unknown, a decision maker cannot calculate 


DATA AND PARAMETERS ESTIMATION
In this section, we first describe liver transplants as the clinical setting of our study. We then describe a unique set of data we obtain from the United Network for Organ Sharing (UNOS). Finally, we explain how we empirically estimate the parameters from the data.
Background and clinical setting
The liver is one of the largest organs in the body and has many metabolic functions, such as taking toxic substances and converting them into harmless substances. 6 Patients are at increased risk when their liver fails. A liver transplant refers to a set of surgical procedures that remove a diseased liver and replace it with a healthy liver from a donor. A liver transplant is the only cure for liver failure or insufficiency in practice, because no device or machine can perform all the functions of a liver. Patients in need of liver transplants are first evaluated by a medical team and then added to the waiting list for organ transplants.
UNOS uses the MELD score to estimate the likelihood of a patient dying without a liver transplant within the next 3 months. Before 2016, the score was calculated based on three lab test results: (1) bilirubin, (2) international normalized ratio (INR), and (3) creatinine. 7 Since 2016, UNOS has updated the model to include an additional lab test result—serum sodium (Na). 8 The MELD‐Na score is ideal for us to categorize patients, because it captures both the sickness of patients and the priority of different patients to receive liver transplants.
When a liver becomes available, it is offered first to sicker patients (i.e., those with high MELD‐Na scores) in the same DSA and then to healthier patients (i.e., those with low MELD‐Na scores) in other DSAs of the same region. A DSA is a CMS‐designated geographic area (usually a state) that is served by one OPO, one or more transplant centers, and one or more donor hospitals. A region consists of several neighboring DSAs/states. For example, region 5 includes Arizona, California, Nevada, New Mexico, and Utah (see Figure 2).
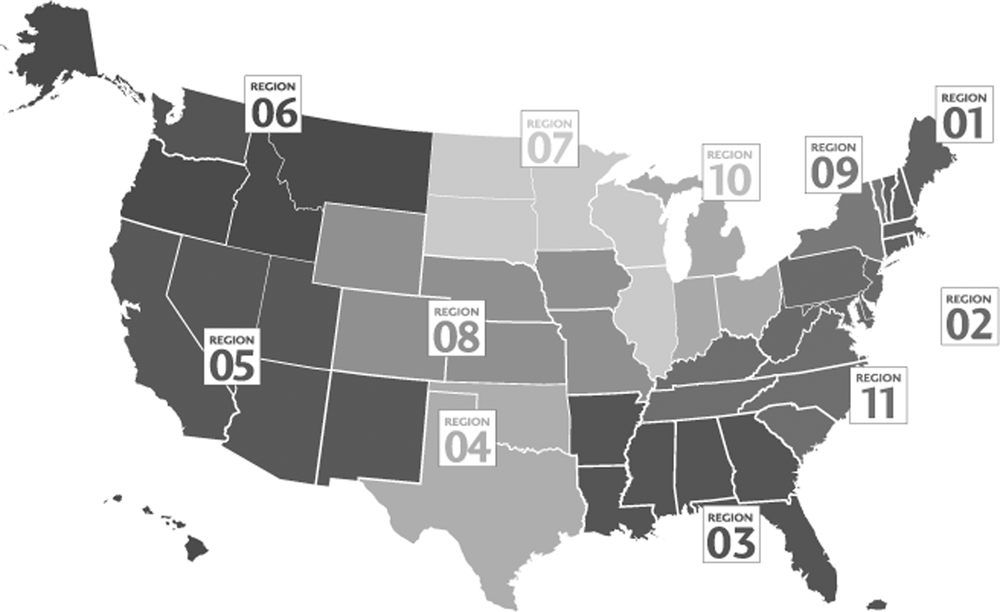
Regions defined by United Network for Organ Sharing (UNOS). Note: This figure depicts the regions defined by UNOS for organ procurement and allocation. More details about these regions are available at
Data description and preparation
We obtain the organ transplant data as of September 1, 2020, from UNOS as the contractor for the Organ Procurement and Transplantation Network (OPTN). One unique feature of our data is that they include both patients who are added to the waiting list and those who are removed from the waiting list due to organ transplants, deaths, or inactivations, which allows us to track the change in the waiting list over time. Another unique feature is that our data record the change in a patient's health status over time, because UNOS updates a patient's MELD‐Na score periodically. These panel data allow us to calculate the number of deteriorations due to delays of liver transplants. Finally, our data include detailed features of both patients and donors (e.g., demographics, blood type, and diagnoses), which allows us to control for the sickness of patients and the quality of organs when we estimate the expected life months.
We use the data from January 1, 2007, to March 31, 2018. These long‐panel data allow us to estimate the rates of waitlist mortality and transition and the expected life months. However, because MELD scores were used before 2016, we need to convert them into MELD‐Na scores using UNOS' formula. We exclude pediatric patients because UNOS uses a different rule to allocate organs to these patients. We also exclude patients with status 1, because these patients are likely to die in the next few days without transplants. In addition, we exclude patients who require multiorgan transplants, because the probability of these patients receiving transplants depends on other types of organs (e.g., kidneys). Finally, we exclude patients with missing MELD‐Na scores, because we cannot calculate the change in these patients' health condition. Table 2 provides summary statistics of the observations used in this study.
Summary statistics for the liver transplant
Note: The malignancy in the diagnoses category includes hepatoma and cirrhosis, fibrolamellar, cholangiocarcinoma, hepatoblastoma, hemangioendothelioma, hemangiosarcoma, angiosarcoma, any other specify (e.g., klatskin tumor, leiomyosarcoma), bile duct cancer, and secondary hepatic malignancy.
Parameters estimation
In this section, we first describe how to estimate the rates of patient arrival and organ transplant, and the rates of mortality, inactivation, and transition for individuals. We then describe how to estimate expected life months.
Rates of arrival and transplant
We estimate the arrival rate of a category using the average number of patients added to the waiting list per day. For example, in the United States, a total of 8339 patients with MELD‐Na scores between 16 and 20 were added to the waiting list between January 1, 2011, and December 31, 2015, so the arrival rate of this category is 8339 patients 


Similarly, we estimate the arrival rate of patients across all categories using the average number of patients added to the waiting list per day. For example, in the United States, a total of 39,431 patients were added to the waiting list between January 1, 2011, and December 31, 2015, so the arrival rate across all categories is 39,431 patients 


The first two rows of Table 3 summarize the arrival rate and transplant rate of patients across all categories in the country and three different centers. Note that the rates of patient arrival and liver transplant in the country are larger than those in a center, because the former are calculated based on all patients in the country, whereas the latter are calculated based on only patients in a center. From the table, we see a sizable difference between the country and a center. For example, the ratio of the transplant rate and arrival rate is 

Basic information at the country level and the center level
Note: Mortality and inactivation rates are for individuals. Center A locates in California and has one of the largest transplant programs in the country for more than 60 years. Center B locates in Pennsylvania and has been a pioneer in organ transplants for more than 50 years. Center C locates in Pennsylvania and is a leader in organ transplants for more than 40 years.
Abbreviations: ELMs, expected life months; LT, liver transplant.
Rates of mortality, inactivation, and transition for individuals
We estimate the rates of mortality, inactivation, and transition by first calculating the respective daily rates and then the average of these daily rates. Consider a hypothetical scenario in which the number of patients on the waiting list is 9000, 10,000, and 11,000 over 3 days, and the number of patients dying on the waiting list is 5, 6, and 7 over these 3 days. The daily rates of mortality are 


Table 4 summarizes the rate of transition using the country‐level data. We include “death” as an additional state because some patients die on the waiting list. From the table, we see the majority of patients remain in the same category. Note the rate of a patient transitioning from a category to a nearby category is higher than that to a remote category. The rate of a patient dying on the waiting list increases as the MELD‐Na score increases, which is consistent with the observation that patients with higher MELD‐Na scores are more likely to die in the next few months.
Rates of transition and mortality for individuals at the country level
Note: All rates are in percentages.
Abbreviation: MELD‐Na, model for end‐stage liver disease‐sodium.
Expected life months
We follow existing studies (see, e.g., Luo et al., 2018) to estimate a patient's likelihood of survival using the generalized gamma survival model.
9
The density function of the generalized gamma survival model is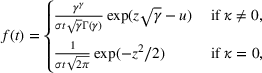


We estimate the model by treating the parameters 


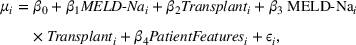


Table 5 summarizes the results from the survival model estimated at the country level. From the upper part of the table, we see all coefficients of 
Results from the survival model estimated at the country level
Abbreviation: MELD‐Na, model for end‐stage liver disease‐sodium.

In the middle part of the table, the coefficient of 

For each patient category, we can estimate the effect of liver transplant by adding the coefficients of 


RESULTS AND DISCUSSION
In this section, we first compare different pause policies to illustrate the value of patient‐specific and center‐specific approaches. We then present the threshold probability above which a decision maker should pause organ transplants. Next, we discuss how capacity constraints affect the loss of patient life months and the length of the waiting list. Finally, we discuss different phases of the pandemic, potential challenges of implementing an optimal policy, and how to extend our model to other settings.
Pause policies
How to pause organ transplants depends on the periods (i.e., 


The left part of Table 6 describes four scenarios as examples. In the first scenario, the two periods include 15 days and 350 days, respectively, and the probability of mortality across all categories is 40% during the first period (i.e., 

Description of scenarios and policies to pause organ transplants


Note: The left part of this table describes different scenarios, in which 


The right part of Table 6 summarizes the optimal nation‐guidance tiered shutdown policy (see column “Nation/tiered”) and the optimal center‐specific tiered shutdown policy (see column “Center/tiered”). We use the nation‐guidance tiered shutdown policy as an example to illustrate the results. In the first scenario, the optimal nation‐guidance tiered shutdown policy is to pause category 1. From different rows of the table, we see the optimal nation‐guidance tiered shutdown policy changes as the probability of mortality changes across different periods or different categories. For example, comparing scenarios 1 and 2, we see a decision maker should pause more categories when the pandemic is more severe in period 2. Comparing scenarios 1 and 3, we see the decision maker should pause more categories when the severe period of a pandemic lasts for a longer time.
Comparison of policies
To analyze the potential value of the patient‐specific approach, we compare a complete shutdown policy with a tiered shutdown policy. The left part of Table 7 compares the nation‐guidance complete shutdown policy and the nation‐guidance tiered shutdown policy at the country level. We use scenario 1 to illustrate our results. In this scenario, the loss of patient life months is 62,204 when the country pauses all liver transplants and 54,711 when the country does not pause any liver transplant. The difference between pause and no‐pause scenarios is 
Comparison between different pause policies for country and center
Note: This table compares 


Under the optimal nation‐guidance tiered shutdown policy, the decision maker pauses category 1 and the loss of patient life months is 54,653. Comparing 


To analyze the potential value of the center‐specific approach, we compare a nation‐guidance policy with a center‐specific policy. The right part of Table 7 compares the nation‐guidance tiered shutdown policy and the center‐specific tiered shutdown policy at the center level. We use scenario 2 to illustrate the results. In this scenario, the loss of patient life months is 2539 under the nation‐guidance tiered shutdown policy and 2536 under the center‐specific tiered shutdown policy, which suggests the center‐specific policy leads to a better outcome than the nation‐guidance policy. Comparing different scenarios, we see the potential value of the center‐specific approach depends on the periods under consideration and the mortality probabilities across different periods.
Threshold probability
We solve the system of differential equations (4) numerically and calculate the threshold probability using Equation (12). Table 8 summarizes the threshold probability for the nation‐guidance tiered shutdown policy at the country level. We use category 3 to illustrate the results. The threshold probability for patients with MELD‐Na scores between 16 and 20 is 0.449, which suggests a decision maker should not pause transplants for the patients with MELD‐Na scores below 21 unless the probability of mortality due to the pandemic is higher than 44.9%. 10
Threshold probability under nation‐guidance tiered shutdown policy
Note: This table shows the threshold probability above which a country‐level decision maker should pause transplants. For example, a decision maker should not pause any transplant if the probability of mortality is lower than 0.075, and should pause transplants for only patients with MELD‐Na scores below 11 if the probability of mortality is higher than or equal to 0.075 but lower than 0.236.
Abbreviation: MELD‐Na, model for end‐stage liver disease‐sodium.
We perform the same analysis for the center‐specific tiered shutdown policy at the center level. Table 9 summarizes the threshold probability for three different centers. We find that a 30‐day pause of liver transplants for patients with MELD‐Na scores of 16 or higher requires a mortality probability ranging from 42.2% to 89.8%. Though the threshold probability differs across centers, these large numbers suggest a decision maker should be cautious in pausing liver transplants for patients with MELD‐Na scores of 16 or higher when the risk of a pandemic is unknown.
Threshold probability under center‐specific tiered shutdown policy
Note: This table shows the threshold probability above which a center‐level decision maker should pause transplants.
Abbreviation: MELD‐Na, model for end‐stage liver disease‐sodium.
We also note center C has a lower threshold probability than the other two centers. A possible explanation is the difference in expected life months with and without liver transplants. Compared with patients in the other two centers, patients in center C have longer expected life months without liver transplants but comparable expected life months with liver transplants. Pausing liver transplants in this center reduces expected life months by less than the other centers and therefore requires a lower threshold probability.
Capacity constraints
Our main analysis focuses on the direct impact of COVID‐19 on organ transplants (i.e., the probability of mortality due to the pandemic). The pandemic may affect organ transplants indirectly by reducing the capacity of transplant centers if they have to redirect scarce healthcare resources such as medical staff and beds toward the care of COVID‐19 patients. In this section, we incorporate the capacity constraints into our model and analyze how these constraints affect the loss of patient life months and the length of the waiting list.
We follow Kaplan et al. (1992) to analyze the impact of overall‐capacity constraints. To describe this approach, we denote by 


We first analyze the impact of capacity constraints on the loss of patient life months. Figure 3 depicts the results by using scenario 1 (see Table 6) and the nation‐guidance tiered shutdown policy as an example.
12
The horizontal axis indicates the reduction in the overall capacity, and the vertical axis indicates the loss of patient life months.
13
From the figure, we see that the loss of patient life months increases as the reduction in the overall capacity increases. For example, when the overall capacity reduces by two transplants per day, the loss of patient life months increases by 


Impact of overall‐capacity constraints on the loss of patient life months. Note: This figure depicts the impact of overall‐capacity constraints on the loss of patient life months. The results are estimated based on scenario 1 (see Table 6) and the nation‐guidance tiered shutdown policy.
We then analyze the impact of capacity constraints on the length of the waiting list. Figure 4 depicts the results by using scenario 1 (see Table 6) and the nation‐guidance tiered shutdown policy as an example. The horizontal axis indicates the reduction in the overall capacity, and the vertical axis indicates the average number of extra patients on the waiting list across the periods under consideration (i.e., 
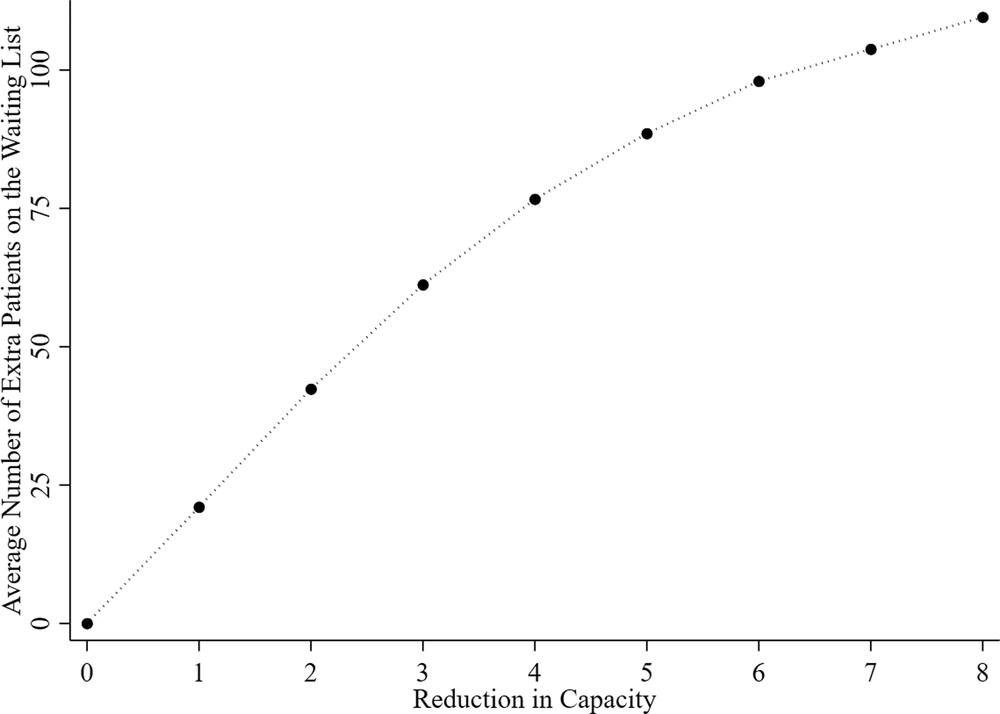
Impact of the overall‐capacity constraints on waitlist length. Note: This figure depicts the impact of overall‐capacity constraints on the average number of extra patients on the waiting list. The results are estimated based on scenario 1 (see Table 6) and the nation‐guidance tiered shutdown policy.
Finally, we note that the impact of capacity constraints on threshold probability is heterogeneous across patient categories. First, the threshold probability for healthier patient categories decreases, because the tiered shutdown policy prioritizes sicker patients for capacity allocation. Second, the threshold probability for sicker patient categories increases, because these patients are more likely to die on the waiting list due to scarce healthcare resources.
Discussion and insights
The pandemic has gone through three phases since its start. The first phase is nonpharmaceutical interventions, which include federal and state policies such as stay‐at‐home orders, school closures, and mask mandates. These nonpharmaceutical interventions reduce human‐to‐human contact and therefore the transmission of the virus. The second phase is vaccine development. In December 2020, several effective and safe vaccines (e.g., Janssen/Johnson & Johnson, Moderna, and Pfizer‐BioNTech) had been successfully developed and were approved for emergency use in the United States. 15 These vaccines help reduce the probability of infection as well as the probability of mortality due to the pandemic. The third phase is the occurrence of mutations. Existing studies find mutations such as the delta and omicron variants are more contagious than the original COVID‐19 virus. 16 The risk of infection exists even for vaccinated persons. Fortunately, the risk of mortality due to the infection is lower for those who are vaccinated. The combination of higher contagiousness and lower mortality suggests transplant centers are likely to face more capacity constraints and fewer risks of performing organ transplants. Researchers and policymakers can apply our model to a current or future phase of the pandemic by updating input parameters such as the probability of mortality to the pandemic, the number of patients on the waiting list, and the capacity of transplant centers.
Regardless of the phase of the pandemic, our comparison of different pause policies suggests that the center‐specific tiered shutdown policy is a more accurate response to a pandemic. But its implementation presents three potential challenges. The first challenge relates to data collection. Whereas nation‐guidance policies require data to be collected at the country level, center‐specific policies require data to be collected by individual transplant centers. Data collection can be challenging to some transplant centers, especially those with limited healthcare resources. The second challenge relates to empirical estimation. Because the sample size is larger at the country level than at the center level, the results from country‐level analyses are more reliable than those from center‐level analyses. When a center does not have a large enough sample size, it may have to follow a nation‐guidance policy. The third challenge relates to patient selection. If centers follow different policies, a patient may switch from the waiting list of one center to that of another center or join multiple waiting lists. As a result, some centers may not have enough patient volume after they resume organ transplants. Fortunately, the first two challenges can be addressed when more healthcare resources/data or new econometric techniques become available (see, e.g., Hopp et al., 2018). The third challenge can be addressed by better aligning incentives for centers and patients.
Though this study focuses on liver transplants, our model can be applied to three other settings. First, in the setting of other organ transplants such as kidney transplants, we can apply our model by replacing MELD‐Na scores with the estimated post‐transplant survival (EPTS) scores to capture the condition of patients waiting for kidney transplants. Second, we can apply our model to other high‐acuity procedures such as cancer surgeries (classified as tier 3a by CMS). Similar to patients with kidney or liver diseases, patients with cancer need to balance the trade‐off between infections due to the pandemic and health deteriorations due to the progression of cancers. We can apply our model to this setting by using the size of a tumor to capture the condition of a patient. Finally, we can apply our model to analyze the costs and benefits of pausing elective surgeries such as hip and knee replacements (classified as tier 2a by CMS). Compared with patients who need organ transplants or cancer surgeries, patients who need hip or knee replacements are likely to live for a long period even without the surgeries. But their quality of life may decrease due to the pause of elective surgeries. We can apply our model to this setting by using the quality of life or inconvenience of move to capture the condition of a patient.
CONCLUSION
The COVID‐19 pandemic has changed many aspects of our life, from the closure of workplaces, schools, and restaurants, to the suspension of elective surgeries and nonessential doctor visits. The pandemic has also ignited hot debates regarding pausing organ transplants. Whereas proponents believe a pause will reduce the risk of infections and save scarce healthcare resources for COVID‐19 patients, opponents argue patients waiting for organ transplants will become sicker and even die on the waiting lists.
Using liver transplant as the clinical setting and a system of differential equations, we show pausing organ transplants has a sizable negative effect on waitlist length and patient life months. Our results support the CMS and AST's recommendations that organ transplants should not be paused, given the current risk of COVID‐19 to organ transplant recipients. However, if the risk of COVID‐19 increases, a decision maker may need to pause organ transplants, based on our estimated threshold probability.
We also compare different pause policies for a decision maker to consider when the risk of a pandemic is known. In particular, we compare complete shutdown and tiered shutdown policies to illustrate the value of the patient‐specific approach and compare nation‐guidance and center‐specific policies to illustrate the value of the center‐specific approach. Whereas the center‐specific tiered shutdown policy is a more accurate response to a pandemic, its implementation presents potential challenges related to data collection, empirical estimation, and patient selection.
Finally, from an operations management perspective, we analyze how capacity constraints affect the loss of patient life months and the length of the waiting list. We find that, as the reduction in the overall capacity increases, both the loss of patient life months and the average number of extra patients on the waiting list increase. Interestingly, the impact of capacity constraints on both the loss of patient life months and the average number of extra patients on the waiting list is nonlinear.
The results of this study are useful to decision makers in deciding whether and how to pause liver transplants during a pandemic. The results are also useful to patients (and their care providers) who are waiting for liver transplants. Though this study focuses on liver transplants, our model can be applied to many other settings such as kidney transplants, cancer surgeries, and elective surgeries.
Footnotes
ACKNOWLEDGMENTS
This work was supported in part by Health Resources and Services Administration contract 234‐2005‐370011C. The content is the responsibility of the authors alone and does not necessarily reflect the views or policies of the Department of Health and Human Services, nor does mention of trade names, commercial products, or organizations imply endorsement by the U.S. Government. The data reported here have been supplied by the United Network for Organ Sharing as the contractor for the Organ Procurement and Transplantation Network. The interpretation and reporting of these data are the responsibility of the authors and in no way should be seen as an official policy of or interpretation by the OPTN or the U.S. Government.
1
More details are available at
2
Patients may be removed from the waiting list due to other reasons such as relocating to other states or transferring to other centers. We designate these reasons collectively as inactivations.
3
More details are available at
4
More details are available at
5
6
More details are available at
7
More details are available at
8
More details are available at
9
Because our data do not track patients who become inactive, we assume the expected life months of these patients are similar to those without organ transplants (i.e.,
10
The threshold probability is nonlinear because the waitlist mortality rate and the benefit of receiving organ transplants are heterogeneous across patient categories.
11
More details are available at
12
See Appendix B in the Supporting Information for center‐level analyses.
13
Figure C1 in the Supporting Information depicts the reduction in the overall capacity and the loss of patient life months in percentage numbers.
14
Figure C2 in the Supporting Information depicts the reduction in the overall capacity and the average number of extra patients on the waiting list in percentage numbers.
15
More details are available at
16
More details are available at