
Abstract
Understanding the patterns of demand evolution for a new category is important for firms to effectively manage capacity planning, market and service operations, and research and development. Our objective is to analyze how marketing at the industry level affects the evolution of primary demand in different stages of the product life cycle. We characterize the aggregate marketing activities in two constructs: marketing breadth and competitive spread. The first construct reflects the spread of spending across different marketing instruments at the industry level, and the second construct reflects the spread of spending across different firms. Though both constructs are related to the spread of spending within a category, we find that they have qualitatively different effects on category growth. An econometric model making use of the hierarchical nature of time observations within countries is estimated for each category. First, we find that high degrees of spending breadth impede market growth when the number of competitors is small (the category is young) but accelerate market growth when the number of competitors is higher (the category is maturing). Second, we find that high levels of competitive spread decrease category growth when spending levels are relatively low. However, as spending levels increase, the negative effect of competitive spread on demand growth all but evaporates.
Introduction
For decades, scholars have studied the process of categories appearing, growing, maturing, and sometimes declining. This process, referred to as the Product Life Cycle (the PLC), appears to follow something akin to a diffusion curve in which the various stages are given names such as the introductory stage, the growth stage, the maturity stage, and the decline stage as shown in Figure 1 (Levitt 1965). 1
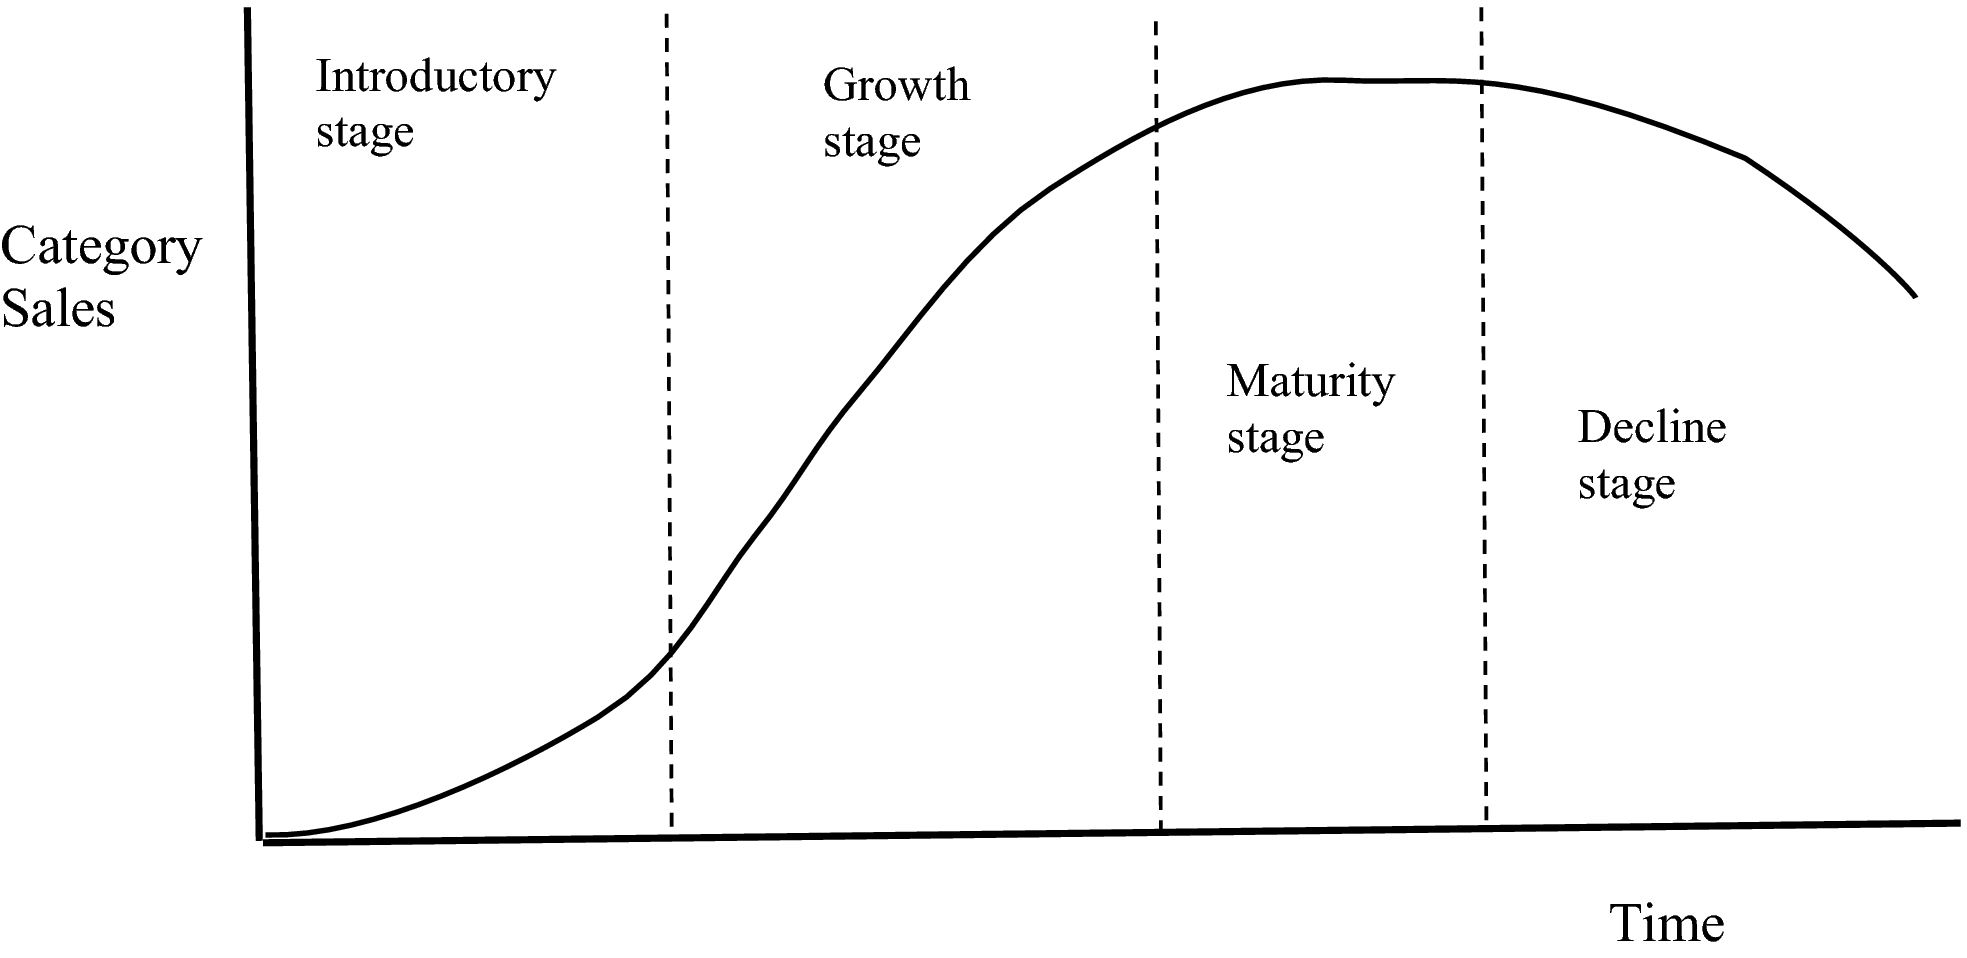
Sketch of the Product Life Cycle
The impact of a firm's strategy on its own sales through the product life cycle, including competitive dynamics, has been the object of substantial research (Lambkin and Day 1989, Soberman and Gatignon 2005). Conversely, the impact that patterns of marketing activity by all firms (within a category) have on category growth has not been well studied. The analysis of aggregate marketing on industry‐level growth is related to the idea of industry clockspeed which formalizes the challenge of linking strategic decision making by firms to the rate of change within an industry. Mendelson and Pillai (1999) discuss how high industry clockspeed places high requirements on the internal operations of a firm. This signifies the importance of understanding aggregate impact of marketing activities on category growth. For example, it is imperative for a firm to match the needs of the category to manufacturing capacity (Balakrishnan and Pathak 2014), the ability to develop new products (Carrillo 2005), and the ability to coordinate distribution (Gutierrez and He 2011). In addition, higher clockspeed industries tend to put extra pressure on firms to effectively manage product attributes and costs (Schmidt and Druehl 2005). The management of product quality and the rate at which new products should be introduced is also closely related to industry clockspeed (Souza et al. 2004). Consequently, managers need to understand the factors that influence the sales growth of a category.
These considerations lead to the question of how one should model category sales. Early models of diffusion for new products like that of Bass (1969) were based on a structural form that posited the existence of two different groups of customers: innovators who try new products on their own volition and imitators who need to observe people who are already using the innovation in order to adopt it themselves. 2 Subsequent work on diffusion highlights the instrumental role of marketing in determining both the rate of growth and market potential (Schultz and Wittink 1976) and the impact of competitive dynamics on market growth (Lambkin and Day 1989, Soberman and Gatignon 2005). In addition, academics have analyzed how competitive behavior affects the sales of a product in growing categories including the speed of reactions (Bowman and Gatignon 2000), competitive reactions to new entry (Gatignon, et al. 1989), and incumbent responses to new entrants (Gatignon, et al. 1997).
This leads to our interest in the idea that the structure of competition within a category, not just the level of various marketing activities, may affect overall category growth. Moreover, the literature suggests that the effect that the structure of competition has on category growth might change as a category matures through the stages of the product life cycle. Our approach is to construct a model which accounts for the known factors that affect the growth of categories over time (such as overall marketing spending, the number of competitors, and price) and two new constructs that represent the structure of marketing spending at any point in time. The two constructs are the breadth of marketing spending and competitive spread.
The breadth of marketing spending represents the degree to which marketing spending is distributed across the levers that firms use to market their products. 3 When marketing spending is distributed evenly across the levers, it corresponds to a high degree of breadth. In contrast, when marketing spending is focused on one or two levers, it corresponds to a low degree of breadth.
Competitive spread is defined as the degree to which spending is evenly distributed across firms. When marketing spending is distributed evenly across all firms, it corresponds to a high degree of competitive spread. Conversely, when marketing spending is focused on one or two firms, it corresponds to a low degree of competitive spread.
To preview our findings, we find that marketing spending breadth has a significant impact on category growth. When there are few firms in the market (which occurs early in the product life cycle), high degrees of marketing spending breadth impede or slow category growth. Conversely, when there are many competitors in the category, high degrees of marketing spending breadth accelerate category growth. It appears that high levels of marketing spending breadth early in the product life cycle make it difficult for new entrants to gain traction in the market. This slows category growth. In contrast, when there are many competitors, a high level of marketing spending breadth leads to higher category growth.
Second, we find that competitive spread has a significant effect on category growth; however, this effect is moderated by the overall level of category marketing spending. In general, competitive spread is negatively related to category growth, but the strength of this relationship is attenuated as the overall level of marketing spending in the category increases. The reason for the negative relationship is that low levels of competitive spread mean that spending is concentrated by one firm (or few firms). This ensures that marketing activity is operating in the part of the response curve where new customers are activated. In contrast, high levels of competitive spread increase the likelihood that the marketing spending by competitors is directed toward business stealing (and not category growth).
Market of Interest
We analyze the effect that patterns of spending have on category growth in two well‐known pharmaceutical categories: angiotensin receptor blockers (ARB) and erectile dysfunction drugs (EDDs). We have 15 years of data (the sales and marketing activity of all active firms) from the introduction of the category to the maturity stage of the PLC in seven countries for these categories.
The pharmaceutical industry offers features well suited for this research. First, categories are clearly identified by therapeutic class (the need that the product serves). Often the boundary between categories is fuzzy and this complicates analysis of the product life cycle. With pharmaceutical products, this is not the case. Second, in most pharmaceutical categories, new competitors enter categories throughout the product life cycle. This means that the impact of competitive dynamics of spending patterns is present in the categories we study. Third, there is similarity in the way that pharmaceuticals are marketed across countries: pharmaceuticals are prescribed by physicians and prescriptions are filled at pharmacies. 4 This facilitates cross‐country analysis which allows us to assess the robustness of findings. Finally, pharmaceutical prices are regulated and remain relatively stable over time (Kolassa 1997). This limits the role of price as a competitive tool. Because our objective is to better understand how competitive spending patterns affect category growth, it is advantageous to have complete data in categories where price is a minor factor.
The pharmaceutical industry is certainly one of the world's largest and most important markets. According to Statista, the global market for pharmaceuticals exceeds US$ 1.35 trillion. 5 As a result, insights and learning about pharmaceuticals alone are of significant importance. Topics explored using pharmaceutical categories include targeted communication and contagion effects on adoption (Manchanda et al. 2008), the impact of individual‐level targeting that accounts for competitive behavior (Dong et al. 2009), heterogeneous learning by customers in response to the introduction of new categories (Narayan and Manchanda 2009), and the effect of influencers and social interactions on customer behavior (Nair et al. 2010). However, a key question is whether the findings and insights obtained by analyzing pharmaceutical markets can be generalized to other categories. Admittedly, pharmaceutical categories are unique. They are highly regulated and in addition, the users of the products (patients) are not the decision‐makers (Stremersch and Lemmens 2009). However, it is important to remember that pharmaceuticals are prototypical examples of experience goods (if not credence goods). 6 Typically, experience and credence goods categories are subject to significant regulation. For example, around the world, industries such as insurance services, construction services, over the counter pharmaceuticals, food products, and airline travel are subject to substantial regulation if not industry‐specific acts of parliament (Dulleck and Kerschbamer 2006).
Regulation in these industries is designed to (a) prevent unsubstantiated claims of what products can do and (b) reduce the dangers associated with consumption of the products. Similarly, regulations associated with the development, marketing, and distribution of pharmaceuticals are designed to protect patients and physicians from (a) unsubstantiated claims of what products can do and (b) dangers associated with using the products (side effects). It seems that the primary objective (if not the effect) of regulation in these markets is to create a level playing field for suppliers and buyers. The goal is to make the transactions that occur close to what would be observed in typical search goods markets.
In the following section, we discuss the key literature related to our investigation.
Relevant Literature
As noted earlier, in the 1960s, the work of Rogers was instrumental to explain the PLC: the process by which categories appear, grow, and mature (Rogers 2003). Rogers' ideas were the foundation for the Bass model which quantified the diffusion process for the sales patterns of new categories (Bass 1969). This was the starting point for substantial research to help marketers forecast the diffusion curve for new categories based on measures that could be assessed while the category was in its infancy and over time (Mahajan et al. 1990). The approach was to relax the assumptions of the Bass model and allow the key parameters to be functions of exogenous variables. The key parameters of the Bass model are market potential, the coefficient of innovation, and the coefficient of imitation. 7
Researchers found that market potential was affected by price, retail availability, and other economic factors (Horsky 1990, Jones and Ritz 1991, Kalish 1985). In addition, researchers found that marketing decisions influenced the rate at which products diffused. Not surprisingly, advertising and price were found to significantly affect the rate of innovation (Horsky and Simon 1983, Simon and Sebastien 1987). More specifically, Jain and Rao (1990) found that price has a significant effect on estimates for key parameters of the Bass model.
An overarching theme from this body of research is that marketing contributes to growth at the category level. We might even argue that the effect of aggregate marketing activity on total category growth is uncontroversial (Hanssens 1980). 8 Significant research also demonstrates that aggregate activity on individual marketing levers affects category growth. Pricing competition attracts consumers to the market through lower prices (Jain and Rao 1990). Advertising provides more information about products and the category and this generates awareness and knowledge among consumers, resulting in more consumption (Horsky and Simon 1983, Simon and Sebastien 1987). Carefully planned distribution optimizes market coverage and facilitates transactions (Jones and Ritz 1991).
In sum, we can safely say that category sales are positively influenced by aggregate marketing effort but extant research does not account for the detailed manner by which category activity is distributed across the marketing levers (Van den Bulte and Lilien 2001).
Another area of investigation is how competitive entry and exit affect category sales and diffusion. The number of competing firms affects category demand through its influence on product development, promotion, and pricing (Horsky and Simon 1983, Parker and Gatignon 1994). For example, Kim et al. (1999) include the number of competitors as a source of variation in the parameters of a diffusion model over time. Other work examines how product benefits and consumer preferences affect rates of diffusion (Cestre and Darmon 1998, Horsky 1990). These studies show that improvements in product attributes lead to faster diffusion. Additional research analyses how firms react to each other in a competitive context. In particular, firm‐level analysis has been conducted to better understand the magnitude and nature of firm reactions (Bowman and Gatignon 2000, Horvàth et al. 2005). However, this research does not consider how the patterns of competitive dynamics affect overall category growth.
Our objective is to analyze how patterns of marketing spending within a category both across marketing levers and across competing firms affect category growth. To understand these effects, we need data for each brand from the beginning of a category to the maturity stage. In addition, it is important to control for possible endogeneity between marketing spending and the maturity of a category (Bronnenberg et al. 2000). To study this question, we build a model at the category level, where the breadth of marketing spending and the degree of competitive concentration moderate the relationship between total marketing spending and category growth. In the next section, we explain the constructs of interest, their measures, and provide our rationale as to how these measures should affect category growth.
Measures of Interest
As noted earlier, competitive behavior has been studied primarily by examining the reactions of each firm across similar or different marketing instruments (Bowman and Gatignon 2000, Hanssens 1980, Horvàth et al. 2005). At the industry level, all firms tend to use each marketing instrument to some extent. We use the degree to which firms make broad use of marketing instruments in their marketing efforts as a first dimension of industry‐level competitive behavior. The second factor, competitive spread, recognizes that firms employ different levels of combined marketing effort. These differences may be the result of firms having chosen different strategies, but it also is the natural outcome in an industry where firms have different levels of resources. Therefore, the second dimension of industry‐level competition reflects the distribution of the marketing spending across firms. In addition to these industry‐level characteristics of competitive behavior, the conceptual framework shown in Figure 2 introduces two moderating factors, namely the market structure reflected by many or few competitors and the total level of marketing spending invested by the industry.
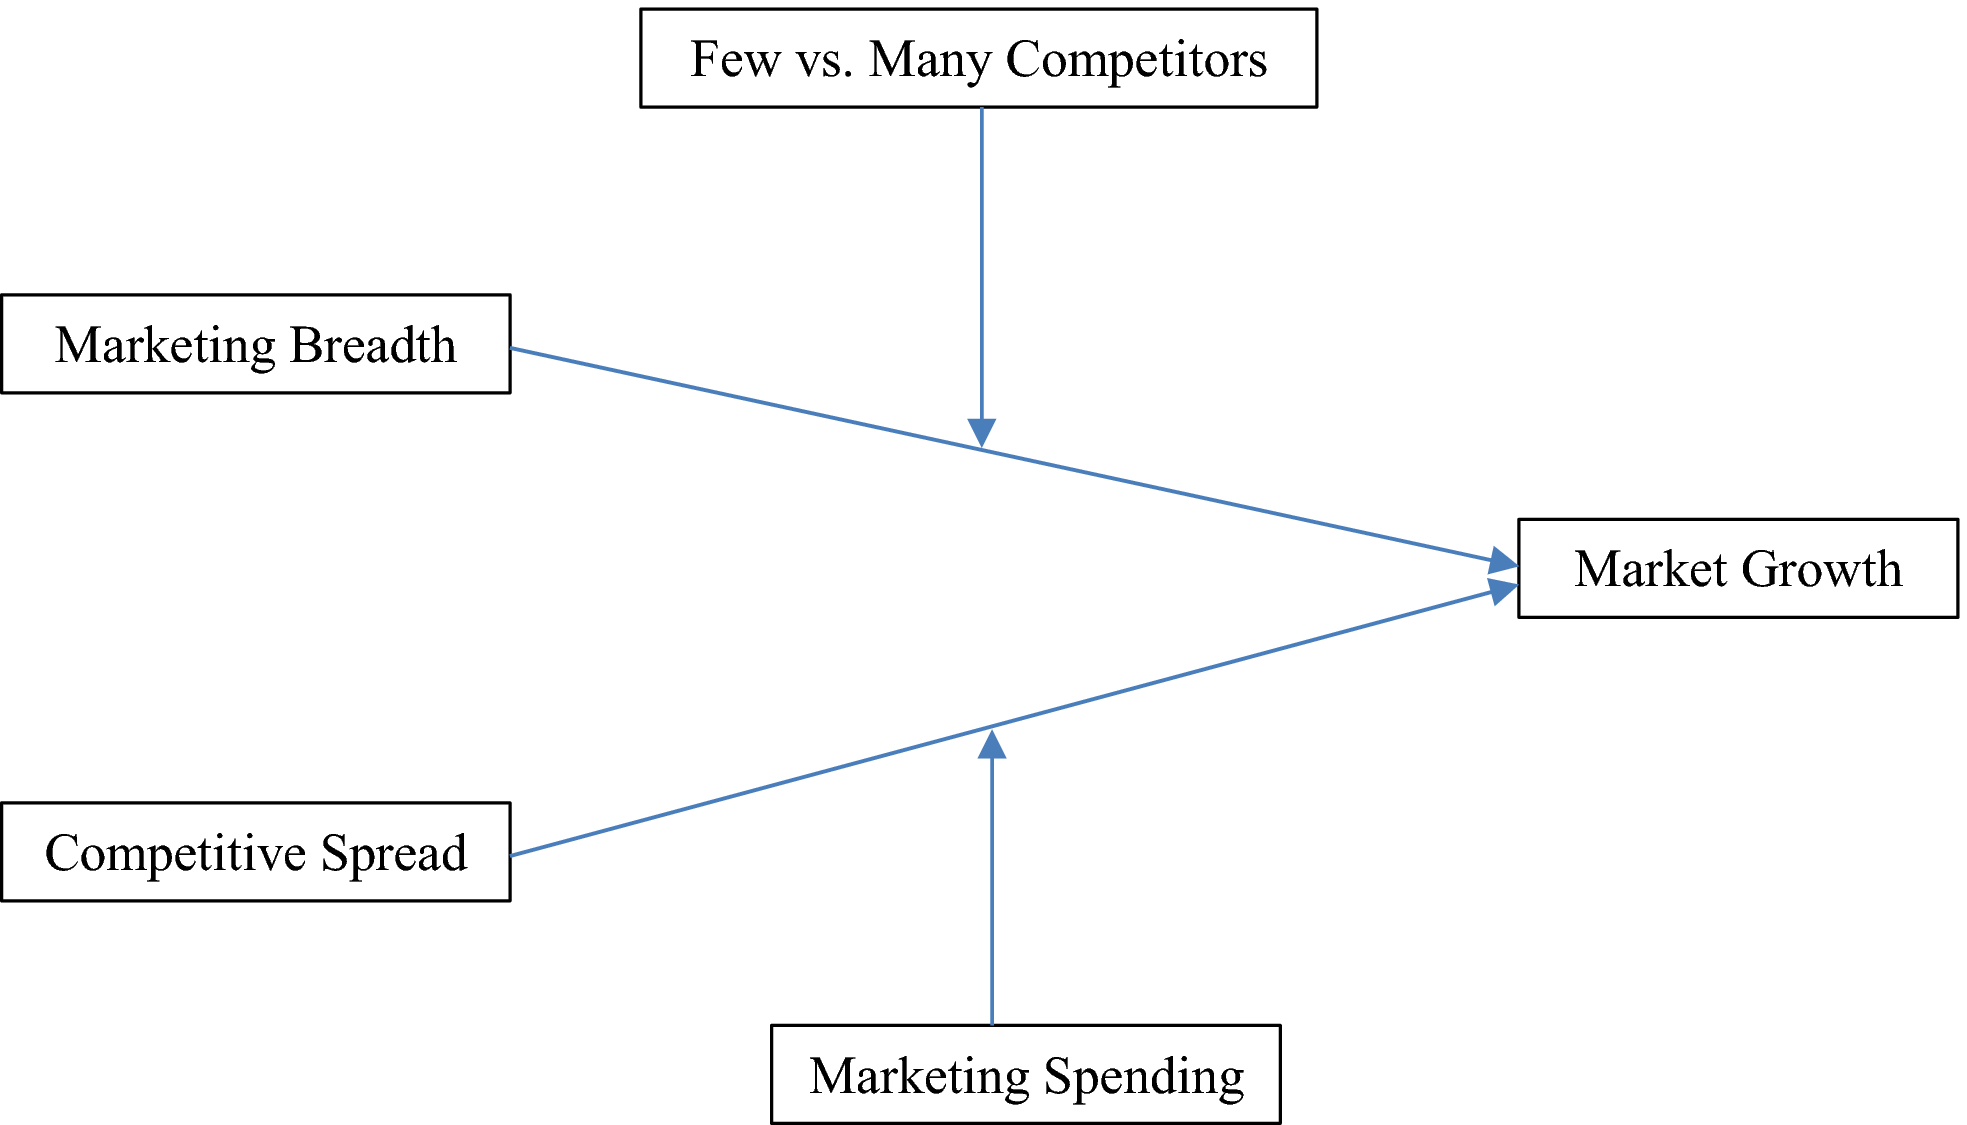
Conceptual Framework [Color figure can be viewed at
The rationale for the various relationships among these factors is developed below and specific research hypotheses follow.
The Breadth of Spending across the Marketing Levers
Marketing spending breadth characterizes the behavior of firms by considering the extent to which the industry uses the spectrum of marketing instruments, that is, do firms allocate their spending across instruments vs. a narrow breadth where industry spending is focused on a single instrument? Consequently, we define the breadth of marketing spending as the extent to which firms in the industry (as a whole) spread their marketing spending across the pertinent marketing levers. Broad marketing spending means that the industry spending is evenly distributed across the marketing levers and narrower spending means marketing spending is focused on a subset of the levers.
Our measure of marketing breadth is based on the share of spending for each marketing lever. To assess the degree of marketing breadth within a category, we utilize the inverse of a concentration measure for the share of category spending on each marketing lever. The measure we use is similar to the Herfindahl index, a common measure in competitive industry analysis. The Herfindahl index reflects the degree to which market share is concentrated within an industry (Carlton and Perloff 2000, Viscusi et al. 2005).
To be specific, we define marketing spending breadth as follows:

L is the total number of marketing levers.


This definition reflects how spending is distributed across different marketing levers in the market at period t. When all spending is focused on a single marketing lever, Mktg_Breadtht = 0. When the spending is evenly distributed across three variables (for example), Mktg_Breadtht = 0.67. Thus, a high value of Mktg_Breadtht implies that category spending is broadly allocated across the marketing mix. 9
The literature provides little guidance as to how the breadth of marketing spending across marketing instruments should affect category growth. The issue of the marketing breadth is considered in studies of competitive reactions (Gatignon et al. 1997). Broad reactions appear to be less effective responses to competitors than targeted reactions, perhaps because broad reactions do not account for differences in marketing instrument elasticities (Gatignon et al. 1989). These studies, however, do not provide a theory for how broad or focused marketing activity should affect category growth. The use of multiple marketing instruments might allow a greater number of potential customers to be reached or exposed to marketing activity. This should lead to higher awareness of the category across different consumer segments. If this is the case, broad spending should lead to higher growth rates for the category.
Conversely, broad spending by incumbents may be effective to make life difficult for firms that have recently entered the category (or firms that contemplate entry). Industrial organization research shows that preemptive behavior by established firms can be used to make successful entry costly (Salop and Scheffman 1983). Simply put, broad‐based marketing activity by incumbents may increase the difficulty to generate awareness and trial for a new product. Thus, broad spending may impede or slow category growth, especially when growth is accelerated by new firms that enter the market. Entry deterrence contributes to superior profit performance for incumbents but should reduce category growth due to reduced competition.
Effects such as this are documented in the form of contracts that dominant incumbents use with distributors and even with customers (Aghion and Bolton 1987, Ordover and Saloner 1989). Product line management can also be used to make life difficult for new entrants. When there are “space constraints,” Caves and Porter (1977) show that dominant tobacco firms used non‐profitable “fighter brands” to occupy facings on cigarette racks and blockade entry to new firms. In the pharmaceutical industry, the analogy for “the product rack” is the time the physician has available to meet with sales representatives of pharmaceutical companies. Substantial marketing efforts by incumbents may prevent new entrants from getting “on the radar” of physicians. Of course, as a category evolves and matures, more firms enter the category and the profit gain of making life difficult for new entrants diminishes.
In sum, high levels of marketing breadth might increase the fraction of potential customers who are aware of a category but also make it difficult for new firms to gain a foothold. These dynamics occur simultaneously and their effects on category growth counteract each other. Accordingly, our objective is to assess the time‐specific effect of marketing breadth on category growth as the category evolves from introduction to the mature stages of the PLC. To be specific, we measure the breadth of marketing spending in the category at each point in time and examine its impact on category growth. Our thesis is that the impact of marketing spending breadth on market growth should be related to the evolutionary stage of the category. It relies on combining the two effects described above and thinking about how the strength of the effects evolves as a category matures.
In the early stages of the category life cycle, there are few competitors; here, collusive behavior (either coordinated or tacit) is more likely (Stigler 1964). This is based on the idea that when the number of firms in a category is small, it is easier for firms to coordinate their actions (Greer 1971, Sutton 1974). To assess the moderating effect that the number of competitors might have, we consider two alternative structures, one where the number of competitors is the moderator and a second, where the moderator is assumed to have a distinct cutoff beyond which firms are unable to coordinate their actions.
Both structures have empirical support. On the one hand, the number of competitors is often used in structural models to represent the degree of competitiveness in the market (Berry 1992). Indeed, recent empirical Industrial Organization models employ reduced forms where the profit function is estimated using the number of competitors as an explanatory variable (Ciliberto and Tamer 2009, Datta and Sudhir 2012, Seim 2006, Singh and Zhu 2008). On the other hand, Carlton and Perloff (2000) suggest that when the number of firms exceeds a threshold, coordination becomes difficult if not impossible. Moreover, the ability of firms to coordinate and thereby reduce competition has been studied extensively in industrial organization; a study by Fraas and Greer (1977) finds that most cases brought to the Department of Justice alleging cartel‐like behavior involve four or fewer firms.
The primary effect of broad marketing spending (increasing awareness) should be present throughout the life cycle. The second effect of broad marketing spending (making life difficult for new entrants) should be strong when there is a small number of firms and almost nonexistent when there is a large number of firms. These effects imply that the number of competitors moderates the impact of marketing breadth on category growth. We summarize these ideas in our first two hypotheses:
When there are many competitors, broader marketing spending increases the category growth rate.
When there are few competitors, broader marketing spending decreases the category growth rate.
Competitive Spread: The Spread of Spending Across Firms
As explained earlier, competitive spread reflects the spread of spending across firms. At one end of the spectrum, one competitor might dominate the market with marketing investments (low competitive spread); at the other extreme, all competing firms might have similar marketing budget sizes (high competitive spread). In all likelihood, competitive spread is largely a function of the relative power of firms. This power might not just come from a higher level of resources but also from a pioneering advantage or product effectiveness.
Our analysis is concerned with assessing how variation in the distribution of marketing spending across firms affects category growth. Notice that competitive spread is unrelated to marketing breadth. Marketing breadth reflects industry‐level spending across different marketing levers (e.g., total advertising in the industry, total sampling, salesforce, etc.), whereas competitive spread reflects the distribution of spending across firms. The former is driven by the focus of marketing activities and the latter is driven by the degree to which one or more firms dominates spending within a category. Similar to marketing breadth, we use a measure similar to the Herfindahl index to represent the spread of spending within a category.
First, we define


When all marketing expenditures come from one firm,


The impact of competitive spread on category growth is unlikely to be monotonic. Competitive spread is a measure which has strong links to market share concentration measures used in Industrial Organization. Competition law in particular is sensitive to the level of concentration within industries because high concentration implies that a limited number of firms dominate the industry. When the number of firms is small, collusion is more likely and easier to orchestrate. 11 Even without colluding, oligopolists often try to limit head‐on competition. A key element of limiting head‐on competition may involve the creation of barriers to entry for new competitors. In any event, actions that are optimal for the firm (or firms) may be different from actions which maximize growth of the category. Our objective is to uncover the relationship between competitive spread and category growth: we conjecture that this relationship is moderated by the absolute level of marketing spending in the category for the following reason.
When competitive spread is low, spending is concentrated by one (or few) firm(s). For that one (or few) firm(s), spending should be sufficient to elicit a response from new customers. This follows from the well‐documented S‐curve that characterizes the relationship of marketing outcomes to marketing effort (Lilien et al. 1992). In contrast, high levels of competitive spread increase the likelihood that the marketing spending of firms is directed toward business stealing (and not category growth). Here, the idea is that when firms invest heavily to market to the same customers, the efforts of one firm are negated by the efforts of another: there is a canceling out effect.
The reason that total marketing spending should moderate this relationship is that when total marketing spending levels are low, the key challenge is for firms to reach the threshold where marketing generates a response. In contrast, when spending levels are high, an endemic feature of markets is the canceling‐out effect of competitive marketing efforts.
Evidence for this phenomenon is found in the study by Osinga et al. (2011) who point to the possibility of a prisoners' dilemma situation when multiple firms in a pharmaceutical category make significant investments in Direct‐to‐Consumer Advertising (DTCA). This dynamic intensifies as a category matures. 12 The declining effectiveness of marketing as a function of marketing levels is documented empirically and experimentally in a number of contexts (Ansolabehere and Iyengar 1995, Eastlack and Rao 1986). Ansolabehere and Iyengar (1995) show that when levels of spending are high in political campaigns, the main motivation of spending is to cancel the efforts of the opponent. These ideas also permeate the advertising literature (Butters 1977, Grossman and Shapiro 1984). When the advertising reach of companies in the market is low, as it would be in the introductory stage of the category life cycle, the main role of advertising is to inform or “activate” customers. In contrast, when the advertising reach of companies is relatively high, as it would be in the mature stage of the category life cycle, a firm needs advertising to inform customers about the relative benefits it provides. Here, customers have often seen advertising from many firms and sometimes a competitor's product is a better fit with the customer's preferences. As a result, information provided to the customer in the competitor's advertising cancels a significant fraction of advertising's potential benefit.
This leads to the conjectured impact of competitive spread on category growth at high spending levels; we expect the strength of the negative relationship to be weaker. Based on the arguments developed above, our expectations are summarized in Hypotheses 3 and 4.
The relationship between competitive spread in marketing spending and the category growth rate is negative.
Overall category spending moderates the relationship between competitive spread in marketing spending and the category growth rate by reducing the magnitude of the effect at high spending levels.
The Link between the Hypotheses and the Product Life Cycle
In the previous section, we develop four hypotheses that consider the impact of marketing breadth on category growth and competitive spread on category growth. We explain how these relationships might be affected by the number of firms and the level of category spending. However, our objective is also to relate this to the product life cycle. The link between our hypotheses and the product life cycle is explained as follows.
First, with regard to marketing breadth, typically the number of firms increases over the course of the product life cycle. Accordingly, we expect that early in the life of a category, marketing breadth will tend to negatively affect category growth. However, as a category matures, the number of competitors increases. Here, we expect the opposite relationship: a high degree of marketing breadth will positively affect the category growth rate. These findings are based on the idea that high levels of marketing breadth may be a mechanism that facilitates market foreclosure when the number of competitors is low.
Second, concerning the effect of competitive spread on category growth, we postulate that the negative effect of competitive spread on category growth is moderated by category spending. To be specific, the negative relationship of competitive spread on category growth relies on low levels of competitive spread increasing the likelihood that the marketing effort of one (or a small number of firms) is sufficient to reach the threshold needed for a response from customers. This dynamic is important early in the life of a category when spending levels are low. As the category grows and matures, category marketing spending levels increase. Eventually, when marketing spending levels are high, most potential customers should have been reached with effective levels of advertising even without low levels of competitive spread. As a result, the negative impact of increasing competitive spread on category growth should diminish.
Data and Preliminary Exploration
We utilize data from several countries for each of our two categories. IMS Health identified two categories for which data were available to cover the various stages of the Product Life Cycle: angiotensin receptor blockers (ARB) and erectile dysfunction drugs (EDDs). One factor that affects the use of products within a pharmaceutical category is that the number of indications increases over the category life cycle. Not surprisingly, this itself can be an important factor contributing to category growth. An attractive characteristic of the categories we use is that their therapeutic use has exhibited little change over the time periods we examine.
ARB is used for the treatment of hypertension (high blood pressure) where the patient cannot tolerate ACE inhibitor therapy, has diabetic nephropathy (kidney damage due to diabetes), or has congestive heart failure. It was first introduced in 1995 by Merck under the trade name Cozaar and Hyzaar. Our second category is the more recently launched category of EDDs. The first approved EDD was introduced by Pfizer under the trade name of Caverject in 1994. While the injectables signified the start of the category, the market for EDD was legitimized with the introduction of Viagra by Pfizer in 1998. Viagra was the first of the PDE5 inhibitors, a treatment for erectile dysfunction that is taken orally. By the end of our data (2010), three PDE5 inhibitors were on the market (Viagra, Cialis, and Levitra). We also apply our model to Statins, but we provide the estimation results in the Appendix because the data primarily relate to the mature stage of the PLC. We explain the differences in the Appendix.
Our data contain quarterly sales and marketing spending on different marketing variables (detailing, journal advertising, and direct mail advertising) from 1995 to 2010 across seven countries (Canada, France, Germany, Italy, Spain, the United Kingdom, and the United States). When a sales representative contacts a doctor directly to promote a pharmaceutical product, it is known as detailing. The cost of detailing is jointly calculated by IMS and pharmaceutical industry experts in each country. Journal advertising includes the cost of the advertisement (i.e., a function of the size, position in the journal, and color), insert charges, and the cost of artwork. Direct mail advertising is the promotional cost of producing mailed literature, including the cost of materials, number of colors used, special folds/cuts, the postage, and the packing. In addition, for the United States, which is the only country in our dataset where DTCA spending has been significant, we obtained quarterly DTCA data from Kantar Media for the categories we analyze.
We provide selected statistics from the ARB category in the United States (the largest market) in Table 1.
Marketing Spending at the Brand Level (ARB US)
Brand IDs have been assigned according to the order of entry of brands.
These statistics illustrate how the overall spending and the range of spending differ dramatically across brands. For the ARB category in the United States, we report the standard deviation of marketing breadth at the brand level for all brands in Figure 3.
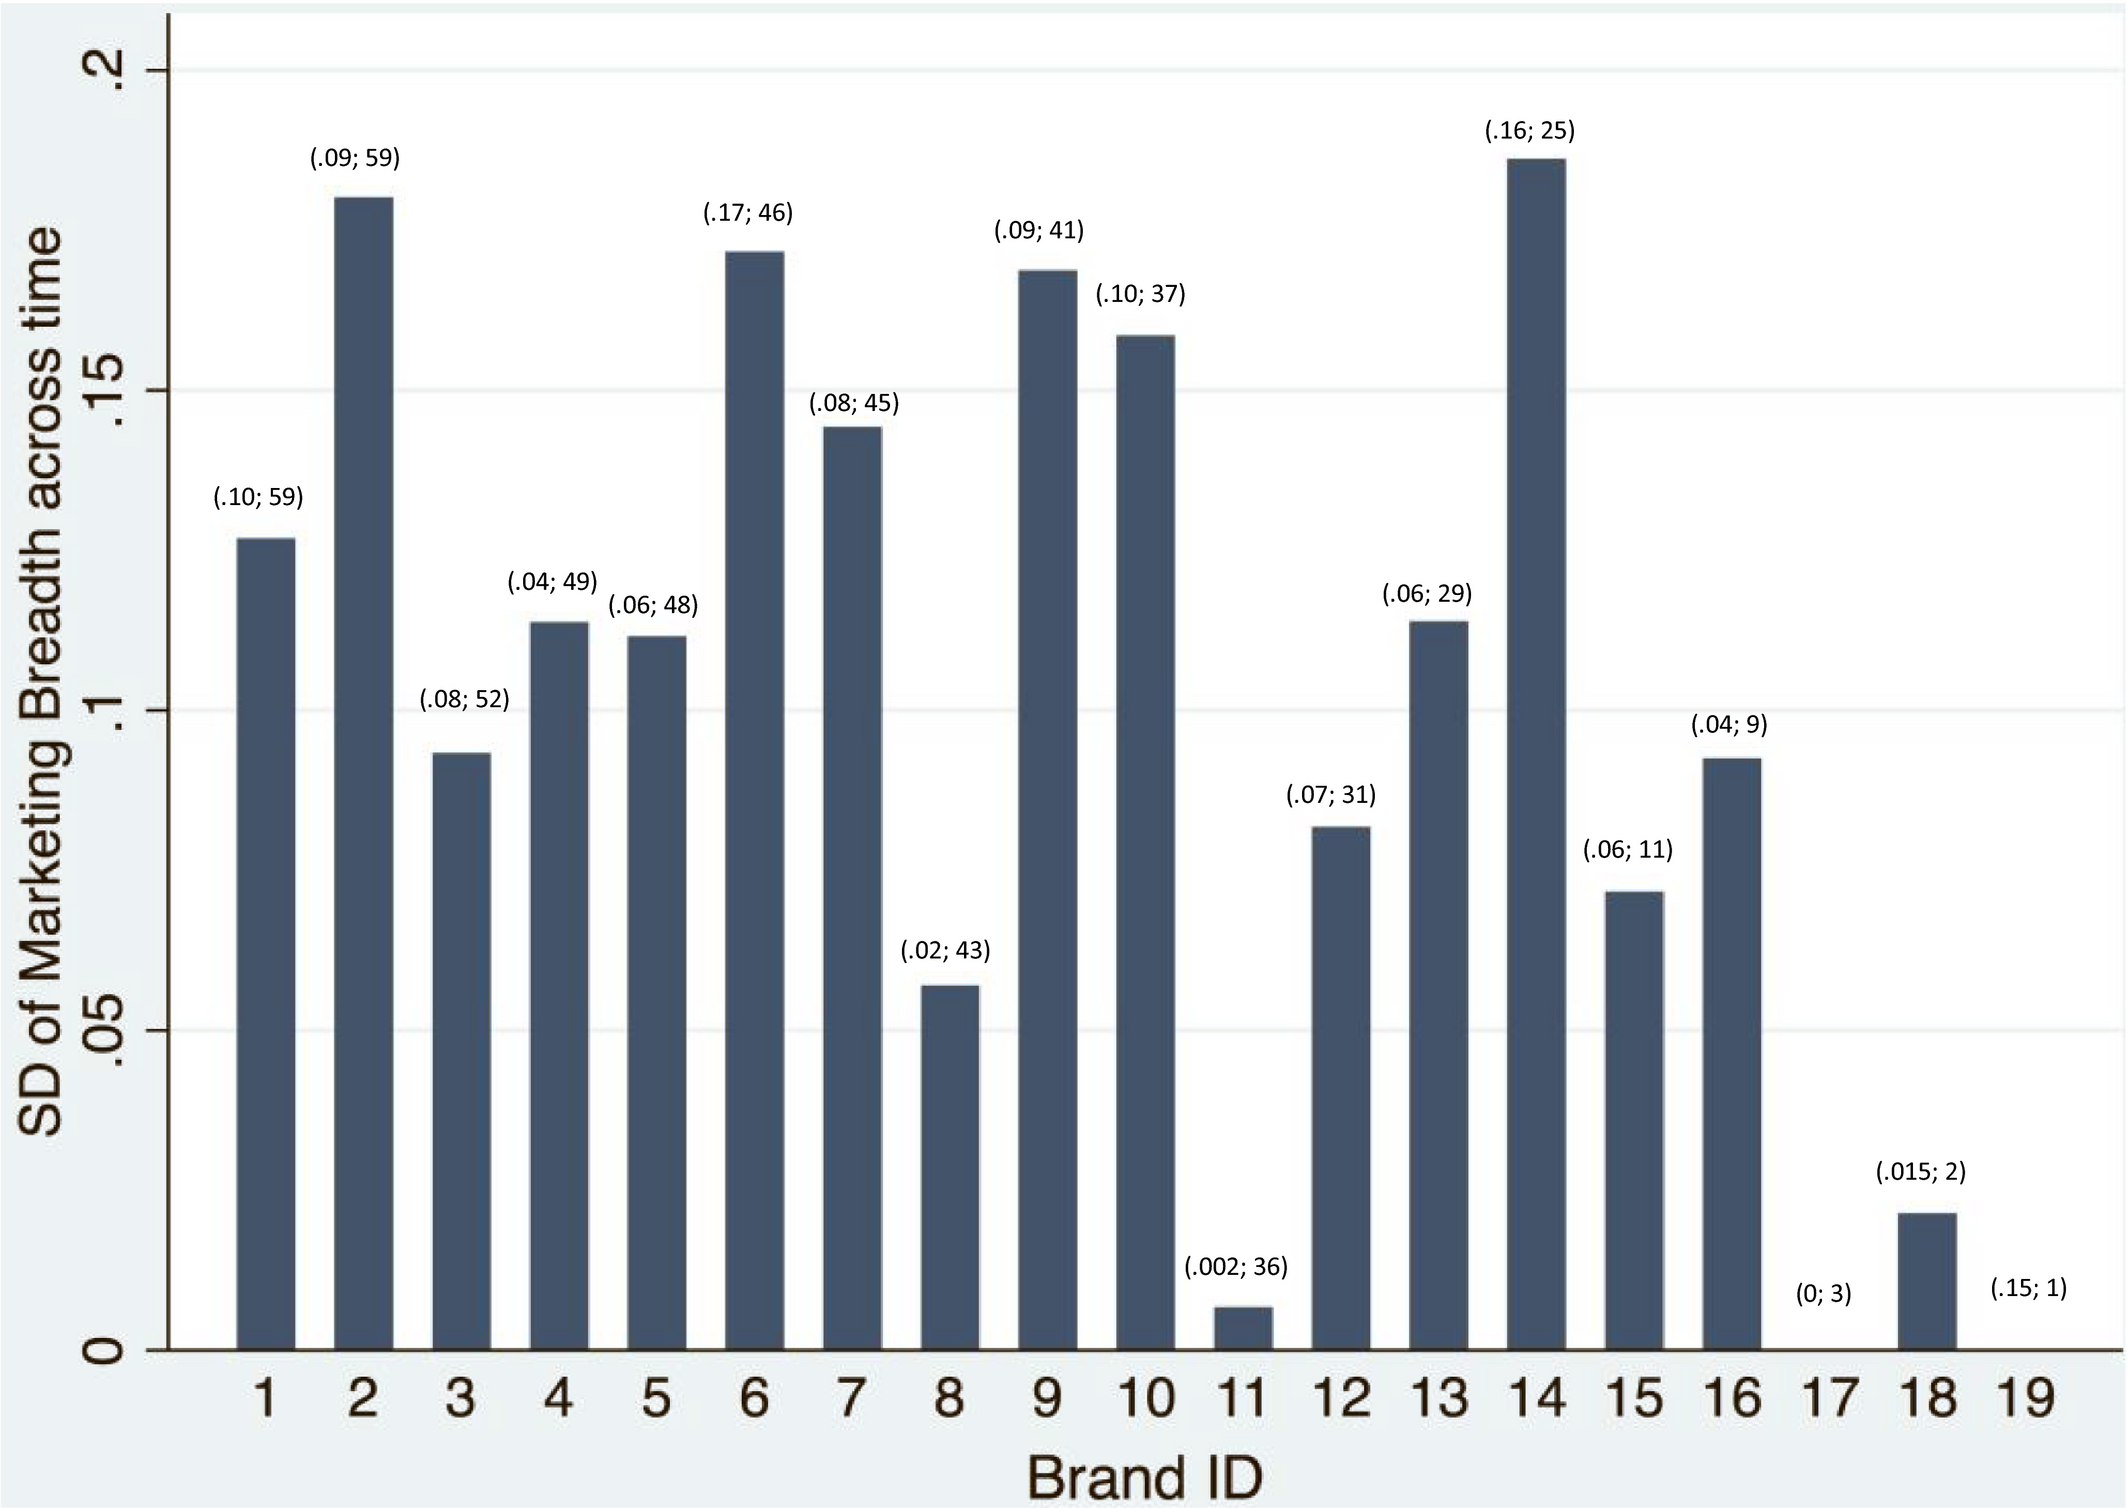
Standard Deviation of Marketing Breadth of Each Brand Over Time [Color figure can be viewed at
The figure underlines a high degree of heterogeneity that exists at the firm level in terms of how marketing spending is allocated across the marketing levers. At any point in time, industry‐level spending breadth is a function of how the industry as a whole allocates spending across the levers. 13 In Figure 4, we report both average category spending and our variable of interest, “industry‐level spending breadth” over the complete time period for the ARB category in the United States.
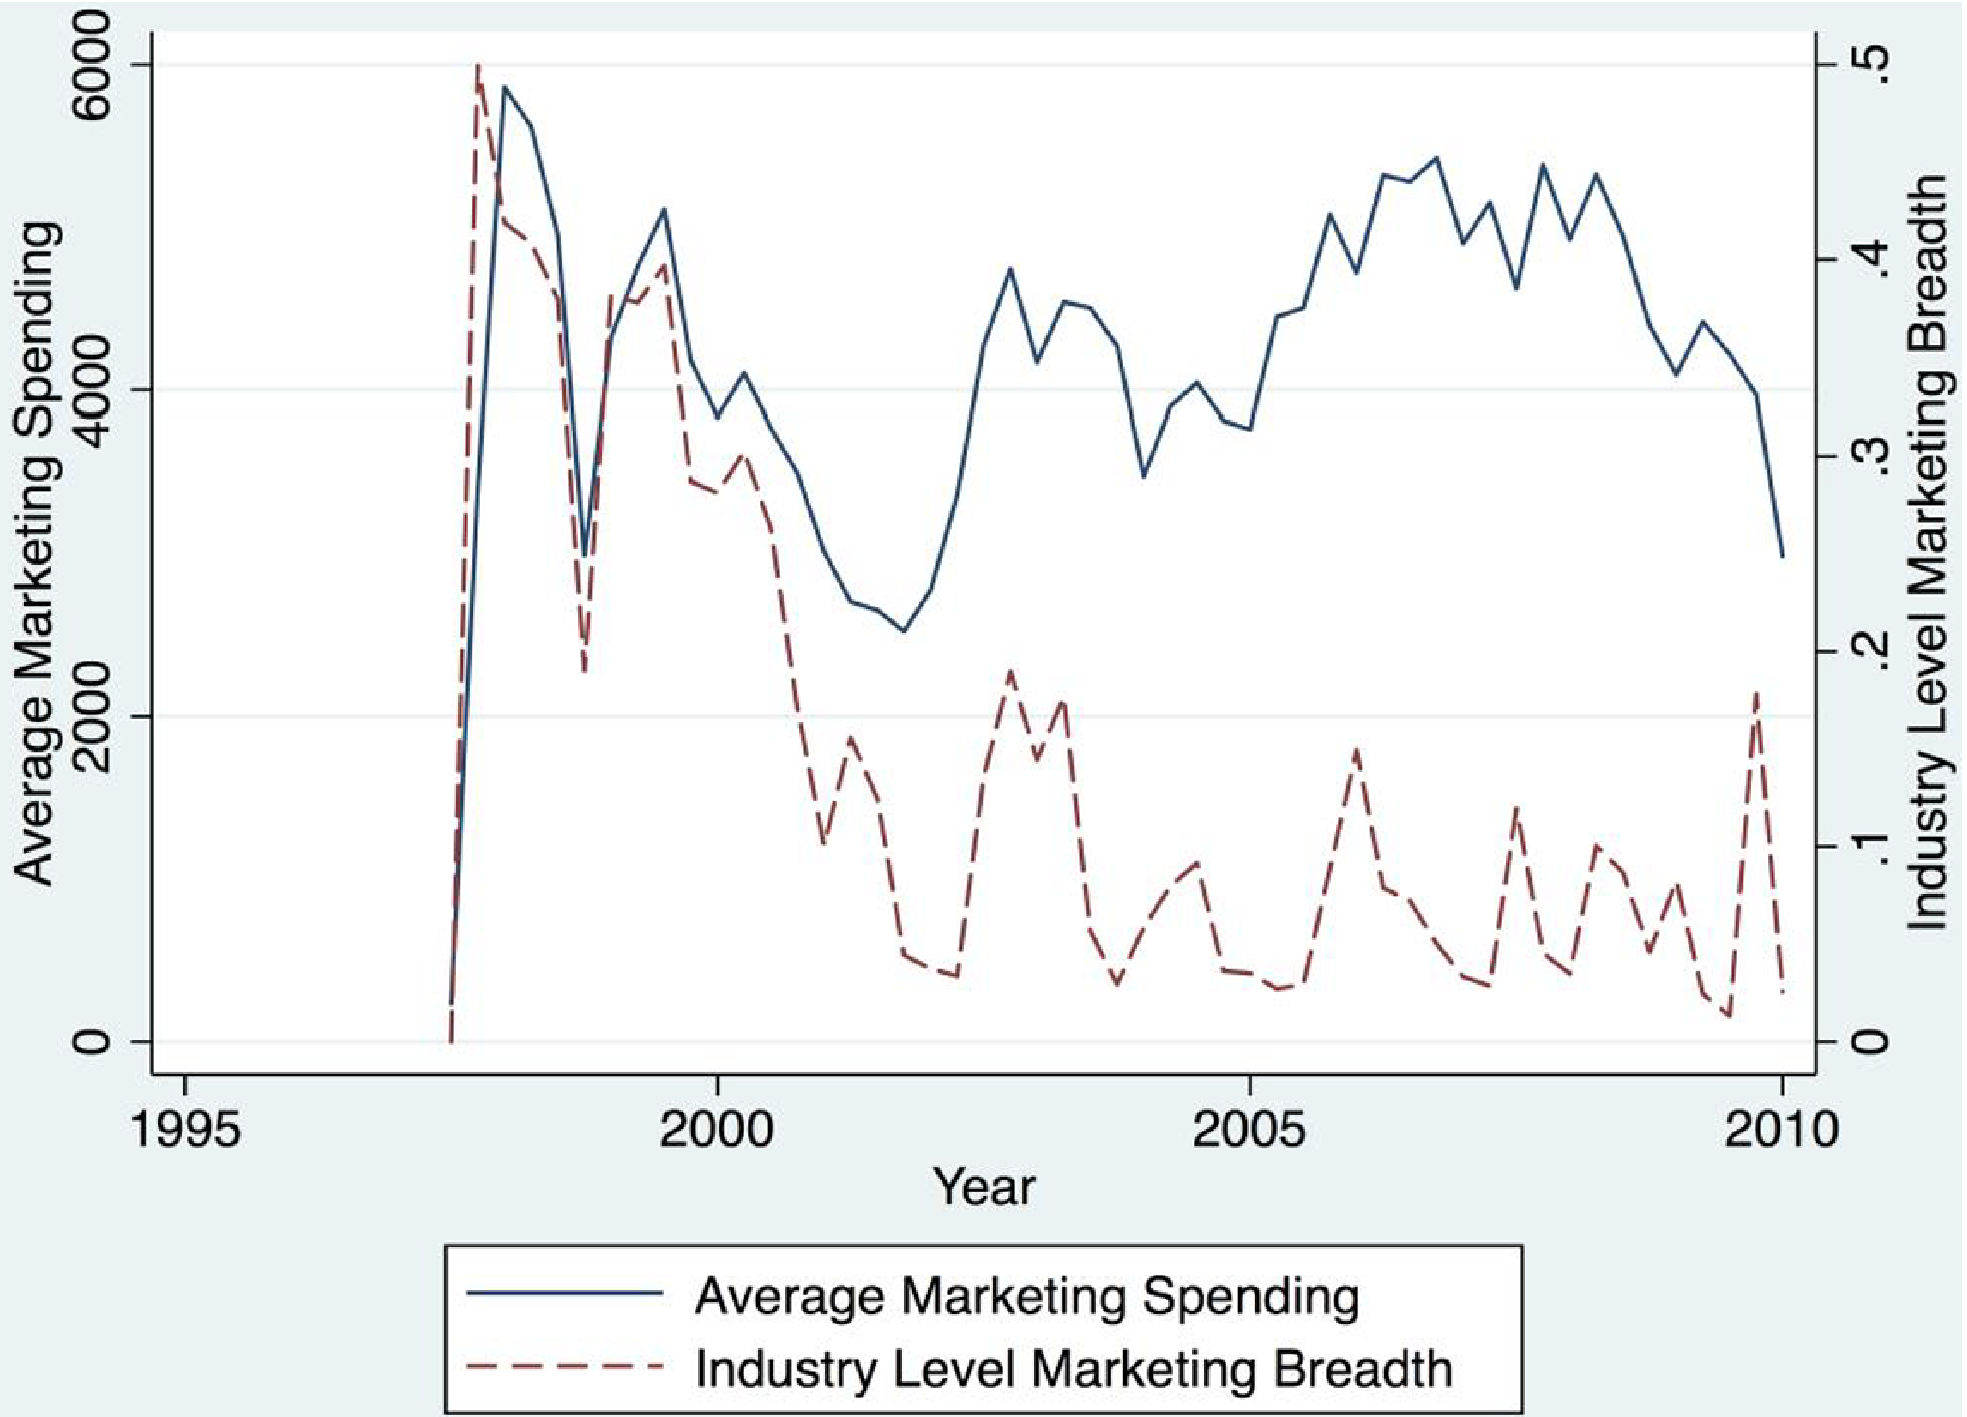
Average Spending and Industry‐Level Spending Breadth Over Time [Color figure can be viewed at
Figure 4 shows that significant variation exists for both average spending and industry‐level marketing breadth over time. The correlation between the two measures is ρ = 0.2093. At times, the measures appear to be in sync; yet, as the category matures, there are often significant changes in marketing breadth even when corresponding changes in total marketing spending do not take place.
In summary, Figures 3 and 4 illustrate that marketing breadth at the industry level is measuring a different construct than how brands individually allocate their marketing spending. Our thesis is that the allocation of total spending across the key marketing levers at the industry level is important to explain category growth.
To illustrate that the relationship between marketing spending breadth and category growth posited by our theory is visible even when spending is essentially coming from one firm, we provide two plots of quarterly data that show “marketing breadth” and “category growth” over time in the EDD category, one for the United Kingdom and the other for Italy (Figure 5a and b). 14
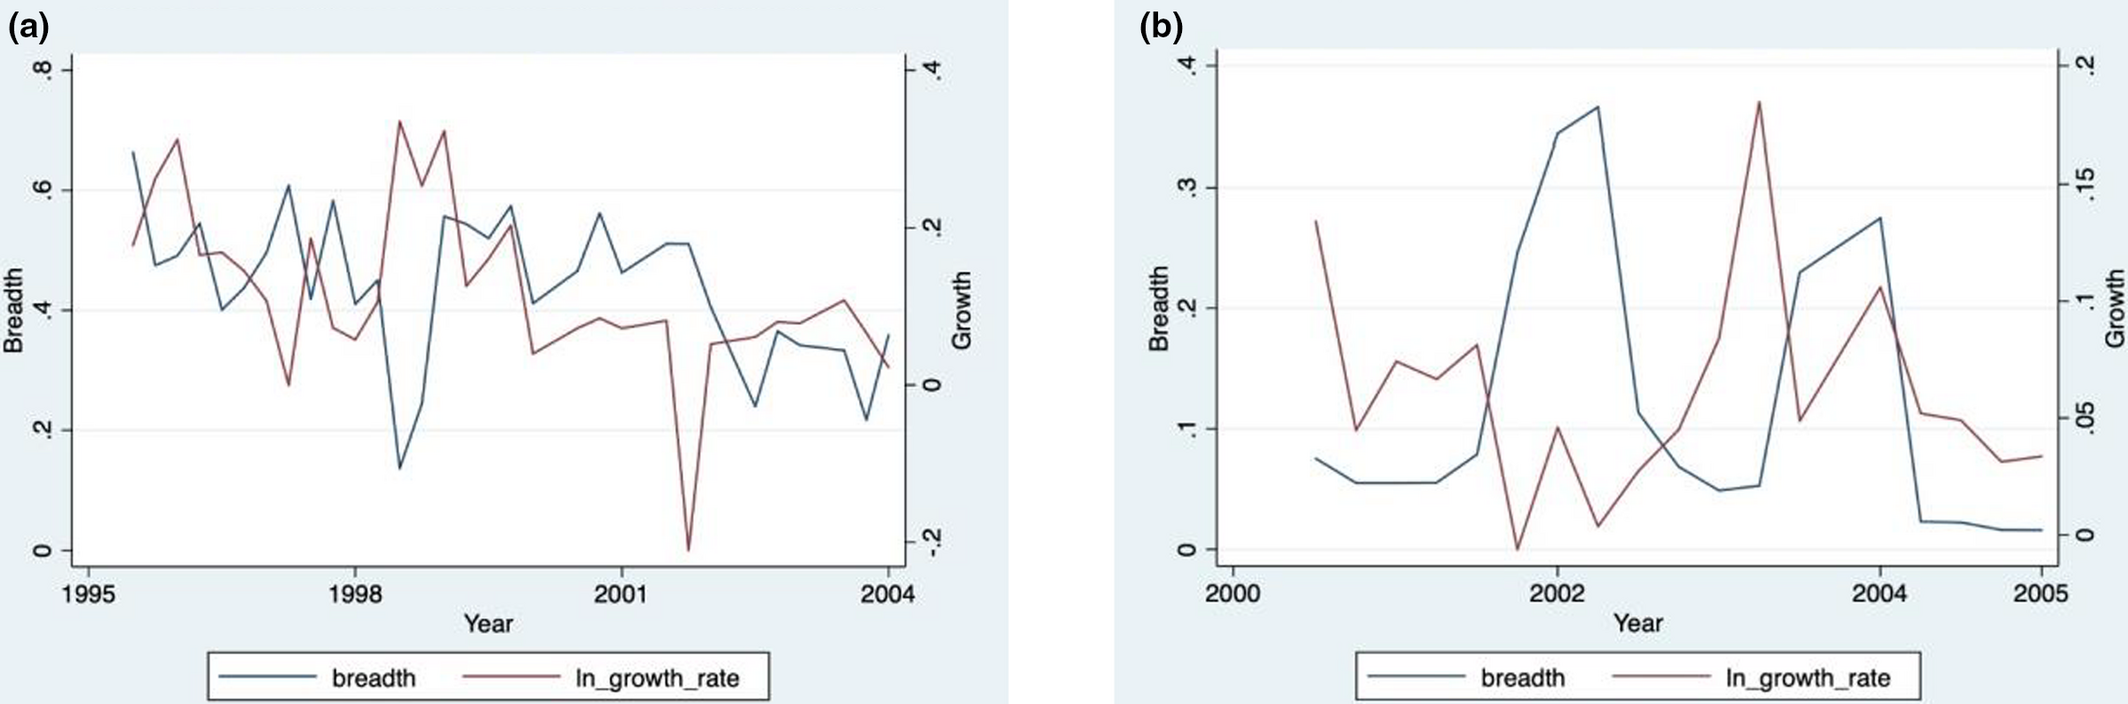
(a) Breadth and Growth in Early Stage of EDD in UK and (b) Breadth and Growth in Early Stage of EDD in Italy [Color figure can be viewed at
In the early stages of a category, we expect marketing breadth to have an inverse effect on the category growth rate. Figure 5a and b visually confirm the negative correlation between marketing breadth and category growth early in the life of the EDD category. 15 The reason that the relationship is so apparent is that the effect of competitive spread is relatively constant over the time period in the chart; the number of firms does not change between 1998 (when Viagra enters the market) and 2003 (when Cialis and Levitra enter the market). A natural question is to ask why a dominant competitor (Viagra) would choose “high breadth” if it leads to lower growth? The answer may lie in the fact that firm decisions are not driven by volume (category growth) but by profitability. Of course, once there are multiple firms and quarterly changes in competitive spread, it is significantly more difficult to see such relationships in plots due to the multivariate explanation of category growth.
In the next section, we present the model we use to assess the impact of marketing breadth and competitive spread on category growth.
The Model
The goal is to explain the variance in growth rates for each category over time. Our belief is that the impact of marketing breadth on category growth is affected by the number of competitors in the market. As noted earlier, we analyze two potential structures, one that treats the number of competitors as a continuous variable and a second that models the effect as being subject to a cutoff (number of competitors) above which the collusive effect of marketing breadth is negligible. We find that the model with a discrete cutoff is superior for explaining the data. For that reason, our study is based on a model with a discrete cutoff.
16
We reflect this by defining a dummy variable “Few”: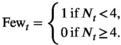
Because we explain category sales (as opposed to first purchases as in the Bass model), we model category sales as the exponential of a linear equation that contains the explanatory variables in a structure that follows Shankar (1999). Note that index i is added to the variables defined previously (Equations 1 and 2) to reflect the multicountry nature of our analysis.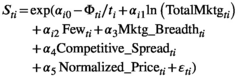


To estimate Equation (4), we take the logarithm of both sides of the equation and use the transformed equation to estimate the sales response at the country level for each category: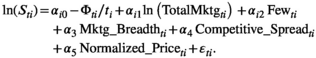
The normalized price variable allows comparison of the price effects across countries because it reflects the effect of price evolution over time within a category. While there are absolute price differences across countries, the main effect of these differences is picked up by country‐specific random intercepts. The effect of price evolution is estimated using Normalized_Price (Jain and Rao 1990). We do not expect this effect to differ across countries (
Note that parameter 


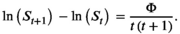
When Φ is positive (sales grow) and the higher is its value, the larger is the difference between 


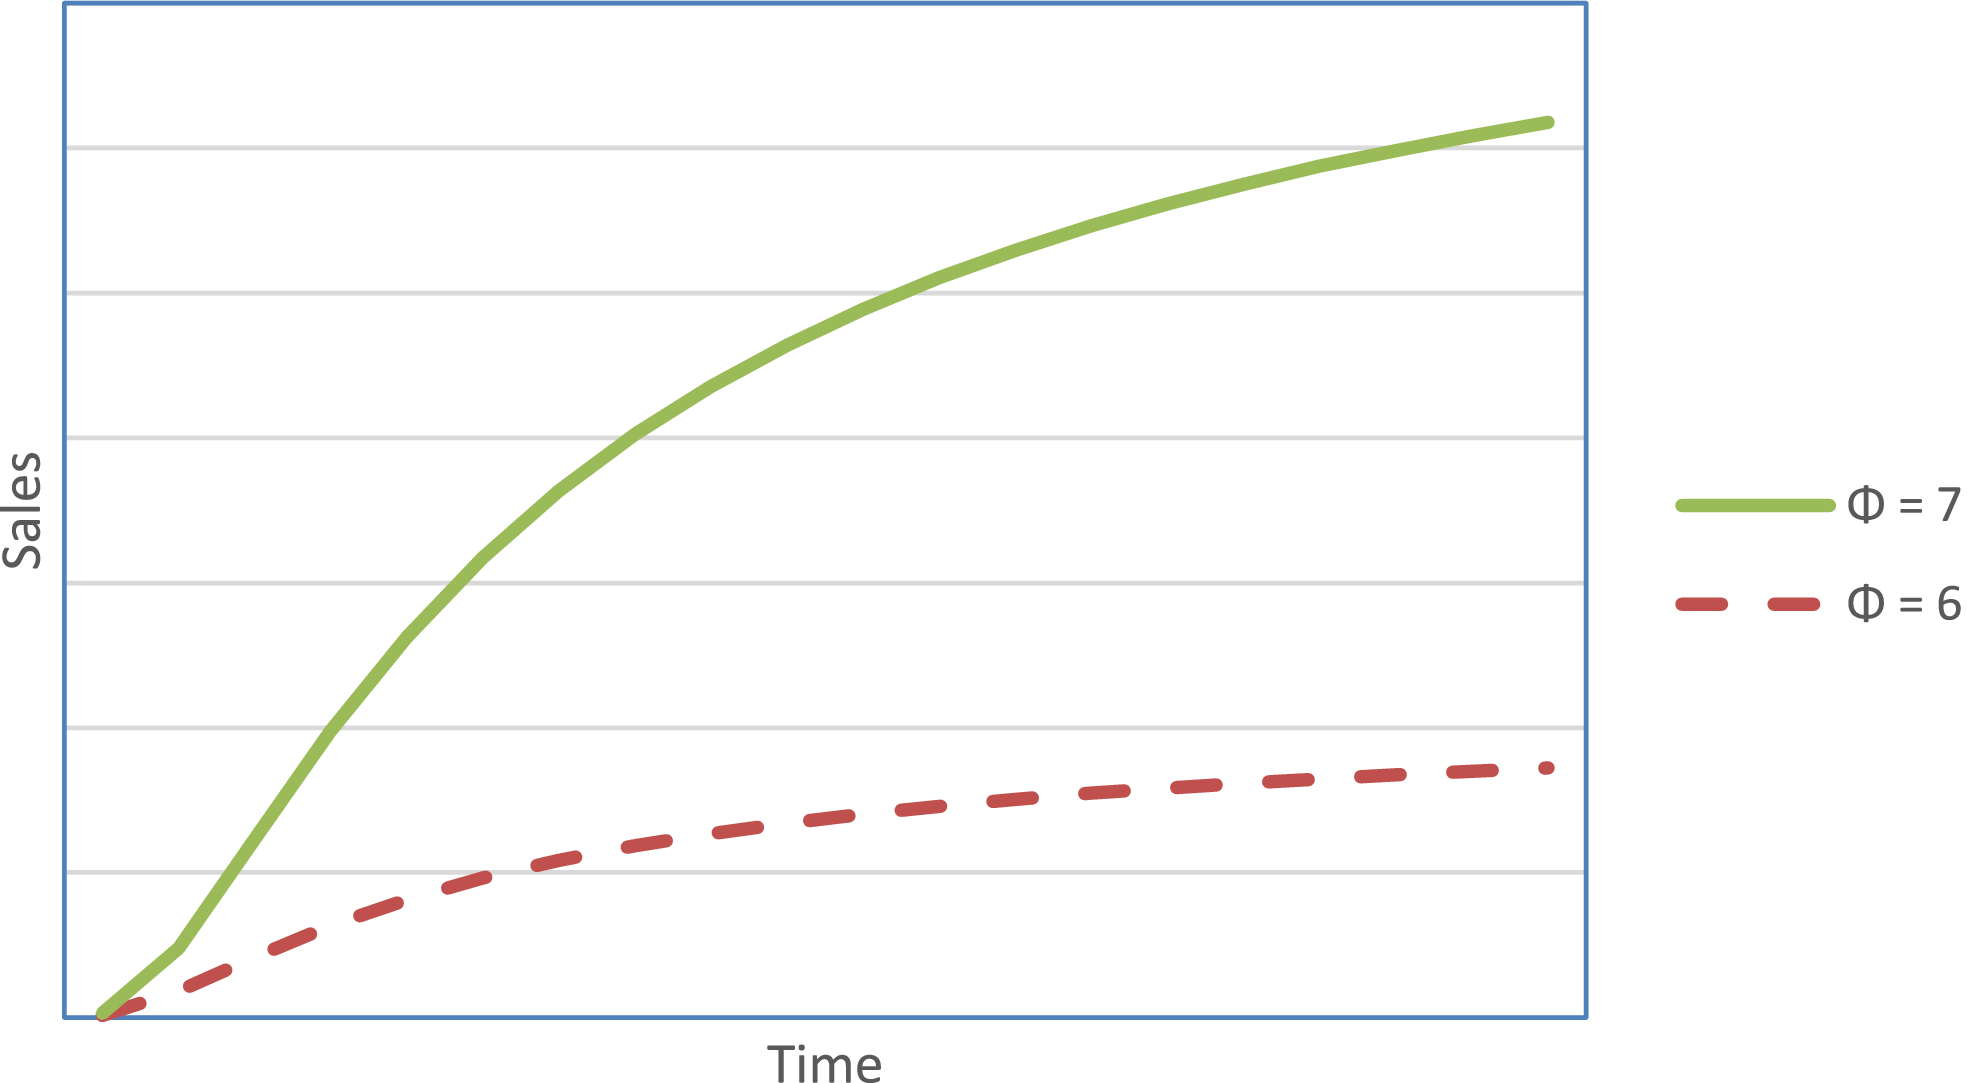
Illustration of Market Growth Rates as a Function of Parameter Φ [Color figure can be viewed at
Returning to our model, the parameter 

When there are few competitors in the market, 


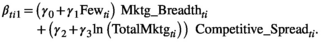
The nature of the data is hierarchical with units defined at time t within a country. Accordingly, we use a hierarchical linear model specification to capture the potential heterogeneity of coefficients across countries. More specifically, the sales response function in Equation (4) and its transformed version, Equation (5), is the first level. The second level (across countries) is described by the following distributions:
Because of multiple interaction terms with the hierarchical model, the error terms in the second hierarchical level are assumed to be independent. 18
The ARB drug category is ideal for our analysis: the first product was launched in 1995, coinciding with the start of our dataset. By 2010, there were more than eight competing brands in most countries. This means that the category is well aligned with our data needs: the ARB data covers a category from its introduction to maturity. We first focus on the ARB category for our analysis. Data from EDD are used to further examine the robustness of our model findings. Our investigation of the values (and significance) of 


Empirical Strategies
Three challenges emerge when estimating a model of market growth at the industry level. The first is autocorrelation. To assess the existence of autocorrelation in the data, we ran Lagrange multiplier tests on the data. In seven out of the 14 category markets, autocorrelation exits (Table 2). In our estimation, we control for autocorrelation using the Toeplitz method.
Lagrange Multiplier Tests of Autocorrelation


indicates significant at p < 0.01,
indicates significant at p < 0.05,
indicates significant at p < 0.10.
The second issue in estimation is potential endogeneity between the patterns of marketing spending (namely marketing breadth and competitive spread) and market growth. Our approach to control for this possible endogeneity has five steps.
In the first step, we identify two sets of instrumental variables: a set of external IVs and a set of internal IVs. We obtained external data on healthcare spending and GDP growth rate for each country from the OECD database to serve as instruments for each national pharmaceutical market. These country‐level economic measures were not strong enough to serve as the sole instruments in the model which applies to very specific pharmaceutical markets. Accordingly, we also collected country‐level data from the “Global Burden of Diseases” study on ARB and EDD‐related diseases and corresponding risk exposures. 20 These data include the prevalence of hypertensive heart diseases, the number of deaths associated with high systolic blood pressure (DHBP), and risk exposure to high systolic blood pressure. After assessing the AIC and BIC of different potential instruments, we found that a combination of healthcare spending, GDP growth, and DHBP form an effective set of external instruments. We then use these data as the set of external IVs.
The internal instruments are from within the ARB/EDD data. We use lagged variables such as marketing breadth, competitive spread, and sales in the previous period as potential instrumental variables. 21 Theoretically, these decisions are less likely to be affected by future sales and future growth (Papies et al. 2017; Rossi 2014; Villas‐Boas and Winer 1999). There is significant research using lagged variables as instruments both in marketing (Kadiyali, Sudhir and Rao 2001) and in operations (Mani et al. 2015, Yiu et al. 2020). Reed (2015) also notes that using lagged explanatory variables as instruments is effective to control for simultaneity when the lagged variables (themselves) do not belong in the estimating equation.
We also note that the primary mechanism that might lead to endogeneity is that managerial predictions of category growth (the dependent variable) influence the marketing decisions that managers make. This is possible, but other than the literature which analyses entry deterrence in the introductory stage of a category, the myopic nature of decision making “within firms” (and a focus that firms have on their own sales) is pervasive. Starting with the ideas of Levitt (1960), further support for the myopic tendencies of firms is found in Williamson (1981), Mizik and Jacobson (2007), and Kim et al. (1995).
In the second step, after identifying the appropriate instruments, we use these IVs to predict the current period breadth and competitive spread. Seemingly unrelated regression is used due to the simultaneity of “marketing breadth” and “competitive spread” (Equation 10).
Third, we compare the AIC/BIC of the estimations based on OLS, 2SLS, and the control function approach (Ebbes et al. 2011, Papies et al. 2017, Petrin and Train 2010, Wooldridge 2015). We find that the estimations with a correction for endogeneity fit better (2SLS and the control function approach). Furthermore, we find that the control function approach delivers the best fit based on the AIC and BIC statistics. Hence, in the reported estimations, we correct for endogeneity using control functions. The control function approach means that the predicted values of 

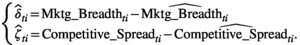
The fitted residuals capture the endogenous part of 


In a linear model, the control function approach produces results identical to the 2SLS approach (Papies et al. 2017), but in a system with interaction terms, the control function yields better results in terms of both AIC and BIC.
In the fourth step, we conduct the Hansen's J test (Bascle 2008) to further test the validity of the instrumental variables. Because of the hierarchical nature of the model, we run the test for each category and each country. Among the seven countries and two categories, only the data for Germany exhibit a concern regarding IV validity (Table 3).
Results of Hansen's J Test
The numbers in parentheses are the degrees of freedom.
Lastly, we explored our current data structure and examined the endogeneity issue with two different methods. First, we apply the Gaussian Copula method (Park and Gupta 2012) to handle endogeneity in the model (Table A7). Consistent with Papies et al. (2017), this produces the same results as the Latent Instrument Variable method. Second, we use the multilevel structure in our data and GMM to address endogeneity issue (Kim and Frees 2007). The results from both methods produce estimates that are consistent with the reported findings (Table A7). These methods serve as robustness checks for our approach to addressing endogeneity with the caveat that these methods impose a number of restrictions on the model that are not imposed for the results reported in the paper.
Aside from endogeneity issues, the third challenge in estimating a model of market growth is potential collinearity among the explanatory variables. Our approach is to use Lasso model specification to examine collinearity and assist with model selection (Gelper and Stremersch 2014). The Lasso estimation entails a process whereby a selection of coefficients for the explanatory variables is systematically shrunk to zero. With the shrinkage applied, Lasso selects variables that continue to have non‐zero coefficients to maximize the explanatory power of the model. We include the selected variables in the Lasso estimation, as well as functional transformations of certain variables in the dataset. To be specific, the extra candidate variables included in the Lasso estimation are as follows: Total_Marketing, Detailing, Mail, Journal_ads, DTCA, Number of competitors, B2B ads, the degree of competitive spread within detailing, the degree of competitive spread within mail, the degree of competitive spread within journal ads, the degree of competitive spread within DTCA, 


Variables Selected with Lasso Method †
Using EBIC, the penalty coefficient 

Estimation Results
We report our estimation findings for the ARB and EDD categories in Table 5. 23 First, we analyze the ARB category for which the data cover the introductory period to early maturity. As noted earlier, we instrument for marketing breadth and competitive spread recognizing that the decisions of managers, in how they allocate marketing resources, might be affected by the growth rate of previous periods. 24
Estimates of the Parameters for the Model of Equations (12)
indicates significant at p < 0.01,
indicates significant at p < 0.05,
indicates significant at p < 0.10.
The first observation from the results is that the estimated coefficients of the control variables (i.e., “total marketing spending,” “Few,” and “normalized price”) are consistent with expectations, even though they are not the focus of this study. In particular, more competitors tend to increase overall category sales (


The second observation relates to the main effects of the key variables of interest, that is, marketing breadth and competitive spread. The direct effect of competitive spread on sales (

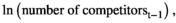
Our primary objective is to examine the impact of marketing breadth and competitive spread on the growth parameter through the decomposition described in Equations (7) and (8):
In Equation (13), 


As noted earlier, category sales are affected by industry‐level marketing activities, but our primary interest is the decomposition of the growth rate. Replacing the coefficients in Equation (8) with the estimates of Table 5, we have: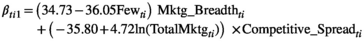
The first term on the left‐hand side of Equation (14) supports the idea that when there are many competing firms in the market (Few = 0), broader marketing spending increases market growth (


The second item in Equation (14) concerns the effect of “Competitive Spread,” which is negative (
In addition, we find that 
In a mature category, category spending is high and primarily dedicated to business stealing (as opposed to category expansion). Here, most companies operate in the part of the response curve where marketing has an effect on physicians. As a result, the marginal positive effect of lower competitive spread (observed when category spending is low) disappears. Conversely, while the marketing efforts of firms to “steal business” from each other cancel each other out at high levels of competitive spread, greater competitive spread maximizes the likelihood that any potential customer is reached by marketing. Hence, the negative effect of competitive spread on category growth diminishes and eventually becomes positive at high spending levels.
Because both ln(TotalMktg) and Competitive_Spread are continuous variables, we conduct a floodlight analysis to examine the significance of the effects at different levels of the moderating variable. The results are provided in Table 6.
Floodlight Analysis of the Moderating Effect of Total Marketing Spending on the Effectiveness of Competitive Spread
Min = minimum (ln(TotalMktg)), Max = maximum (ln(TotalMktg)), Mean = mean (ln(TotalMktg)), sd = standard deviation (ln(TotalMktg)),
indicates significant at p < 0.01,
indicates significant at p < 0.05,
indicates significant at p < 0.10.
The floodlight analysis of the ARB category shows that higher Competitive_Spread reduces category growth at low levels of TotalMktg providing further support for the idea that concentrated spending (by individual firms) in the early days of a category activates new customers and fuels growth. It is interesting to note that in the ARB category, the value of ln(TotalMktg) ranges from 6.14 to 11.52. The floodlight analysis shows that when the total marketing spending exceeds the 18th percentile in its distribution (i.e., 
To further assess our research questions, we now examine the second category: EDD. The estimation results for the analysis of the EDD category are provided in the two right columns of Table 5. The estimates from the EDD data exhibit qualitatively similar results to ARB. Here 


In the EDD category, the direct effect of competitive spread (

The estimate of 


We also note that in the floodlight analysis, the effect of competitive spread on market growth becomes insignificant as the level of marketing spending increases. The difference in the floodlight analysis between EDD and ARB is in all likelihood due to the competitive environment in the EDD category. Through 2010, three major PDE5 inhibitor brands (Viagra, Cialis, and Levitra) dominated category marketing spending. As noted earlier, we conjecture that “as a category matures, more firms enter and engage in competitive marketing activities.” However, as of 2010, it is difficult to classify the EDD market as having matured. The market is dominated by three oligopolistic firms that have learned “how to compete with each other” (i.e., the firms limit the quantity of marketing resources to avoid head‐on competition). This may explain why higher levels of marketing spending do not eliminate the impact of competitive spread on EDD category growth.
To further examine the robustness of our analysis, we also estimate the model using data from Statins. This category is relatively mature with most countries having more than four competitors by 1995. The results are consistent with ARB and EDD. Detailed estimation results are provided in the Appendix (Table A5). 25
In conclusion, the model produces similar results across different categories although with varying degree of significance. Our analysis provides evidence for the nuanced effect of marketing breadth and competitive spread over the full range of the Product Life Cycle.
A Distinct Cutoff vs. the Number of Competitors
As discussed in section 4, we consider two alternatives to reflect the “competitiveness” of the category. To maintain internal consistency, we focus on the one category for which the data cover all stages of the Product Life Cycle (Introductory, Growth, and Maturity)—the ARB category. In addition, ARB is a category where the number of competitors grows from one to more than nine and higher in some countries. We first estimate a model where the variable “Few” in Equations (5) and (8) is replaced by the number of competitors. The results pertaining to marketing breadth and market growth rate are consistent with our estimates.
However, in contrast to the estimation with a distinct cutoff, the direct effect of the “number of competitors” on category sales is insignificant (though the signs of the coefficients in Table A2 are directionally consistent). Given the observations of Fraas and Greer (1977) that collusion is significantly more difficult where there are four or more competitors, it is not surprising that the continuous measure of the number of competitors has weaker explanatory power.
To investigate the distinct cutoff formulation, we evaluated several levels for the threshold. Table A3 summarizes the estimates under different specifications of “Few.” We find that the estimates are consistent across different thresholds, and the effects are most significant when “Few” is defined at a threshold of four or more competitors. This echoes the discussion of section 4 and provides an argument for using thresholds as a basis for determining the feasibility (or likelihood) of collusive behavior in pharmaceutical markets.
Discussion
The goal of this research is to offer insight about the competitive dynamic factors of an industry that explain industry growth as it evolves over time from the introductory stage, through the growth stage and finally into maturity. Our focus is factors that characterize the nature of competitive interactions within a category. This builds on the thesis that competitive dynamics are a fundamental determinant of how markets evolve and grow (Soberman and Gatignon 2005). Using data from the pharmaceutical industry, our study provides useful insight about this relationship in the context of international marketing.
The product categories we study are for the most part, the only solution (or treatment) for a specific class of therapeutic problems. A further advantage of these categories is that comprehensive data have been obtained with standardized definitions of all major marketing levers that firms use to promote the sale (and use) of these products. This leads to less unexplained variance which helps us to uncover the relationships of interest. There are two factors about our approach that help us to generate insights that are both general and robust with regard to the diffusion of new products.
First, the pharmaceutical categories we have chosen allow us to study the complete evolution of markets from the introductory stage up to relatively advanced levels of maturity. In general, the categories in question take anywhere from 5 to 10 years before reaching maturity. A key advantage of the categories we analyze is that all stages of the product life cycle (except the decline stage) are covered by our data. The lack of data from the decline stage is not critical. The relationships that interest us focus on how competitive dynamics affect market growth from the introductory stage of a pharmaceutical category until maturity.
Second, a key challenge with analysis like this is the endogeneity of independent variables such as marketing spending breadth and competitive spread. In particular, it is well known that companies often have policies that depend on sales performance or market share levels observed in past periods. Moreover, forecasted numbers are invariably estimated utilizing historical trends and past sales. Thus, a key challenge when analyzing such relationships is to account for endogeneity in the estimation and determine whether the postulated relationship is evident. Because our data are longitudinal and contain a number of exogenous variables, we correct for this problem using control functions.
While the choice of pharmaceuticals provides well‐defined categories to study, it may also limit the generalizability of our findings. First, in pharmaceutical categories, the impact that pricing has on growth is limited. We do find a significant impact of price on category growth yet alternative classes of products may be better suited to fully assess the impact of competitive pricing dynamics on market growth. In addition, studies are needed to understand how category growth is affected by marketing variables not employed in the pharmaceutical industry. These include marketing levers such retail shelf space, product upgrades, warranties, and online advertising.
Second, pharmaceutical industries are heavily regulated. Governments across countries impose different regulations on the marketing activities of pharmaceutical firms. These may include direct manufacturer price control, regulations regarding detailing expenses, and limits on physician visits. In addition, physicians often face different prescription budgets and patients face different contexts in terms of co‐payment and reimbursement. Our study does account for country‐level differences through hierarchical models, yet more detailed studies on how regulations affect market growth are needed.
Conclusion
Our objective is to understand how competitive marketing activities, namely the breadth of marketing spending across different marketing mix variables and the degree of competitive spread impact the evolution and growth of primary demand over time.
First, our analysis shows that the two constructs, marketing breadth and competitive spread, are distinct and have very different effects on market growth. Their impact on market growth is the opposite of each other. As a result, they need to be carefully distinguished by academia and marketing practitioners. The analysis shows that when there are few competing firms in the market (as is the case early in the life of a category), a high degree of marketing breadth reduces market growth. The analysis suggests that broad marketing spending makes it difficult for new entrants to build momentum (it may even deter potential entrants from entering the market). This obtains because, on average, tacit (or explicit) collusion allows firms to make entry either unattractive or difficult for potential entrants. This echoes observations from industrial organization theory yet the ability of firms to do this relies on the number of firms being relatively small. When there are many firms, we find that broad marketing spending performs the expected role of increasing the number of customers (in this case, prescribing physicians). This expands the market and is reflected in higher levels of category growth.
We also find that market growth is closely related to (and influenced by) the degree of competitive spread. In general, competitive spread has a negative effect on category growth, because the more evenly marketing spending is distributed across firms, the higher is the likelihood that the marketing efforts of firms cancel each other out. However, the strength of this effect is attenuated when marketing spending levels are low. Here, concentrated spending by one or two firms ensures that at least one firm is operating in the part of the response curve when new customers are affected by marketing. Early in the life of a category, many firms spend less than is necessary to activate consumers.
Conversely, when the total level of spending is high, most active firms spend at levels where customers are activated. However, the main effect of marketing here is business stealing and not introducing new customers to the market. As a result, the negative effect of competitive spread on category growth diminishes and may even become positive at high levels of marketing spending.
Last, when a category reaches full maturity, the impact of marketing spending patterns on category growth is weak because the vast majority of customers have already been reached and know about the category.
A key contribution of our study is that by better understanding the drivers of category growth, firms can better forecast category sales in future time periods. Firms typically forecast volumes by asking their marketing department to estimate their expectations in terms of market share (what share of new customers do we expect in the coming quarter, the coming six months and the coming year). Then, these estimates are multiplied by the forecasting department's estimate of category sales to determine the forecasted units of the firm's offering in the category. These numbers are critical for the firm's supply chain in terms of capacity planning, raw materials ordering, and human resource management. It is through this mechanism that the results of this paper can have an important and positive effect on the efficiency and effectiveness of the firm's supply chain.
Our findings also provide useful insight for production and operations managers and marketing managers who are responsible for the allocation of operational and marketing resources in categories at different stages of market evolution. First, in the early growth stage of a category, our research provides strong arguments for firms to carefully coordinate their effort in operations and marketing. Not only does broad marketing increase awareness of the category across diverse user segments, it also makes it difficult for entrants (or smaller firms) to gain a foothold and reach critical mass. Both of these dynamics are beneficial to incumbent firms. Second, as categories mature and the number of competitors increases, managers need to measure and assess the impact of marketing. Our analysis documents a general reduction in the ability of marketing to stimulate growth as a market matures due to (a) a reduced number of potential “new” users and (b) the canceling out effect of competitive marketing efforts. Thus, an assessment of marketing's ability to “steal business” as well as stimulate category growth is essential from the perspective of each individual company. Production efficiency and cost advantage are critical in this stage of life cycle. Finally, our findings provide empirical support for analysts of collusive conduct in oligopolistic industries. While in theory, any number of firms can collude, our analysis suggests that tacit collusion is unlikely in a category with four or more competitors.
To conclude, our work provides a basis to elucidate the complex relationship between the competitive dynamics of a category and the rate at which the category expands. The analysis confirms a number of insights about markets that are based on a combination of ideas derived from industrial organization and product diffusion theory.
Footnotes
Appendix
The Bass model is based on the theory of Rogers (![]() ) from the early 1960s to explain the diffusion of innovations. Rogers argued that diffusion was a natural process governed by the appeal of the innovation, communication channels, social networks, time, and a two‐step flow of communication based on innovators who learn about product through communication (like advertising) and imitators who learn about the performance and acceptability of new product from their social network.
) from the early 1960s to explain the diffusion of innovations. Rogers argued that diffusion was a natural process governed by the appeal of the innovation, communication channels, social networks, time, and a two‐step flow of communication based on innovators who learn about product through communication (like advertising) and imitators who learn about the performance and acceptability of new product from their social network.
The levers include but are not limited to different forms of advertising (TV, radio, print, direct mail), direct selling, promotion, and/or sampling.
The term “experience good” is based on the work of Nelson (1970). Darby and Karni (![]() ) added the notion of “credence goods” to Nelson's original classification.
) added the notion of “credence goods” to Nelson's original classification.
It is possible to conceive other measures that reflect the degree to which spending is concentrated or evenly spread across the marketing levers. The coefficient of variation in the share of marketing spending allocated to each lever is another possible measure. Our model was reestimated using this alternate measure and the findings were fundamentally unaffected. Details of the re‐estimation are provided in the Appendix (![]() ).
).
It is also possible to conceive of other measures that reflect the degree to which spending is concentrated or evenly spread across firms. As before, we use the coefficient of variation in each firm's share of marketing spending as an alternative measure and reestimate the model using the alternate measure. Details of the reestimation are provided in the Appendix (![]() ).
).
In a mature category, it is more difficult for a category to grow because a high fraction of potential customers has already entered the market. Accordingly, an increased proportion of marketing spending is used to steal market share from competitors.
Unless firm allocations are highly correlated, the average spending breadth across brands is completely different than industry‐level spending breadth. Within the category, each brand has its own experience (launch date, degree of penetration, and relative efficacy versus the competitors). This explains substantial heterogeneity in brand‐level marketing breadth at any point in time and between brands.
In the early stages of the EDD category, Viagra was responsible for the vast majority of marketing spending. Sales and marketing for Caverject were minimal.
Other countries exhibit similar charts but the availability of Direct‐to‐Consumer Advertising in other countries makes the negative correlation less obvious.
Because time series data often have high levels of serial correlation, adding higher power terms can amplify problems of multicollinearity. This is the case with our data and more interaction terms in the main equation also exacerbate multicollinearity.
Convergence is rarely achieved in complex models with an unstructured covariance matrix. We estimated the model with such covariance structure but the model would not converge even with a relaxed tolerance level (1e‐5).
There are other non‐FDA‐approved brands prescribed for ED but their sales are minimal and there is little marketing spending for these brands. We retained those brands in the analysis but their contribution to the category is through their impact on the number of competitors.
We use ordinary Lasso estimation to assist with variable selection. Ordinary Lasso estimation does not generate statistically valid standard errors (Kyung et al., 2010) so we do not report the significance levels of the coefficients. Bayesian Lasso does generate significance levels (Park and Casella ![]() ); however, we do not use this method because it does not correspond to a model specification with nonlinearity and interactions.
); however, we do not use this method because it does not correspond to a model specification with nonlinearity and interactions.
The estimation is run with expectation–maximization algorithm (em in Stata). We set the em iterations number to 100,000 and the search of an optimal initial value emerges after 102 (58 for EDD) iterations.
In the Appendix, we provide the results of the first‐stage estimation where instead of using the instrumental variables to address endogeneity, only original variables are used (Table A2). The growth rate decomposition parameters are affected, which underlines the need to correct for endogeneity. We also tested our model robustness using alternative endogeneity methods, see Table A6 for a model without lagged marketing variables, and ![]() for two other alternative models using Gaussian Copula and GMM using multilevel data structure.
for two other alternative models using Gaussian Copula and GMM using multilevel data structure.
The variable Few in Statins is omitted from the estimation because the number of competitors exceeds four throughout the time series. The effect of marketing breadth is positive but insignificant. Competitive spread impedes the growth of the market (