
Abstract
We investigate the benefits of on‐site printing at remote geographic locations, where access to spare parts is intermittent and supplies are replenished at fixed intervals. Organizations typically have no solution to spare parts shortages other than expensive expediting orders, or waiting for a part to arrive with the next replenishment. We investigate whether on‐site three‐dimensional (3D) printing of spare parts can bring relief. Our work extends dual‐sourcing literature with fixed order cycles by considering two emergency supply options: expediting regular parts and 3D printing lower quality parts. We model the replenishment and emergency supply decisions as a Markov decision process and find that the optimal inventory control policy consists of two thresholds that control when to expedite, when to print and when to wait for regular parts via the next replenishment. We apply our model to a case study of the Royal Netherlands Army (RNLA) for her United Nations peacekeeping mission in Mali. Our results show that on‐site 3D printing, much more so than expediting, leads to large operational cost savings through on‐site inventory reductions and increased asset availability, thus increasing the ability of the RNLA to operate in remote locations. These results extend to many other organizations that operate in remote locations, for example, those in the mining and offshore industry.
Keywords
Introduction
Multimillion dollar capital assets, such as manufacturing equipment, weapon systems, and transport vessels, are prevalent in many of today's industries. These assets are often critical to the continuation of core business processes, and therefore, asset owners invest heavily in managing system availability. Many organizations operate sophisticated service supply chains with both local spare parts inventory, to protect against prolonged system downtime, and centralized spare parts inventory, to take advantage of pooling effects. This operation is combined with frequent resupply deliveries and effective emergency shipment options in case of stock outs. Nonetheless, spare parts inventories often represent an investment of hundreds of millions of dollars, due to the number of parts involved, their prices, and the long production lead times. The US coast guard, for example, keeps more than 60,000 spare parts in stock, with a total inventory value of more than $700 million (Deshpande et al. 2006), and Delta Airlines and KLM hold $372 million and $212 million in maintenance inventories, respectively (Delta Airlines 2016, KLM 2016). The situation is even worse for assets that operate in remote geographic areas, such as oceangoing transport vessels, mining equipment, military equipment during a mission, and assets in the offshore industry. Managing an efficient service supply chain for such assets is expensive due to the absence of supporting infrastructure and the often difficult conditions under which these assets are operated, which increases the uncertainty in spare parts demand and thus the required spare parts inventory levels. This problem is exacerbated by limitations on spare parts storage space and high condemnation rates that result from sub optimal storage conditions.
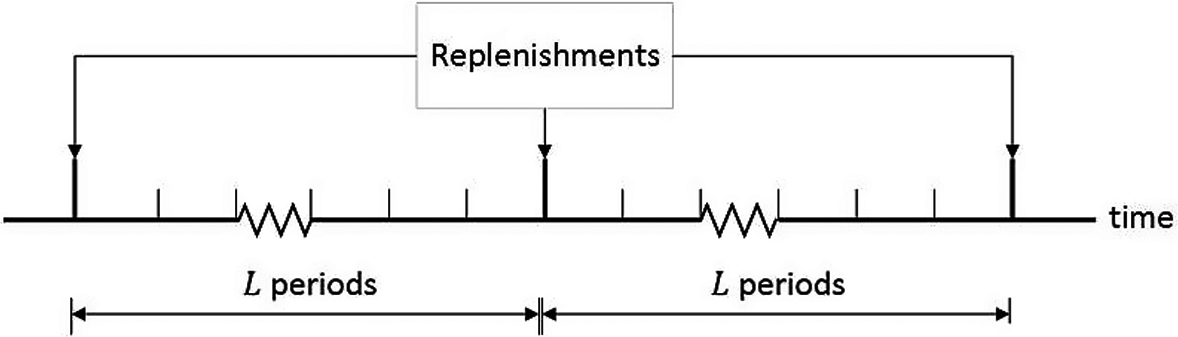
Because of the high transportation costs to reach remotely operating assets, spare part deliveries are generally part of larger, consolidated shipments that occur periodically—that is, through scheduled replenishments. Military convoys to forward operating bases, for example, may be on a weekly schedule. Spare parts are then delivered along with food, fuel, and other resources necessary in the mission area. Oceangoing transport vessels are resupplied each time they dock in a port, which is approximately monthly for ships operating between China and Western Europe (CargofromChina.com 2017).
A potential solution to spare part stock outs in between replenishments is to install additive manufacturing (AM) capacity close to the asset, or even on it, as Eruguz et al. (2017) suggest for the maritime industry. This rapidly developing technology, which is popularly known as three‐dimensional (3D) printing, uses 3D computer‐aided designs to build products layer by layer, as opposed to traditional manufacturing technologies that use subtractive methods. AM technology offers the flexibility to quickly produce a variety of parts at low setup costs from various metals and plastics. Printing thermoplastic components, for example, can be done overnight. It is also possible to print several smaller components together in one batch by cleverly positioning them in the build chamber of the AM system. In practice, different materials and printing techniques dictate the use of different printer types, each of which represents a significant investment. As a compromise, asset owners can install a single general‐purpose printer capable of producing many different types of parts from a single material type, for example, from fiber‐reinforced thermoplastics. These printers are also fairly cheap. The printer operated by the Royal Netherlands Army (RNLA), for example, costs less than € 30,000.
An on‐site general‐purpose printer can be used to quickly produce a replacement part to reduce system downtime in case of a shortage of regular parts. This can lead to reduced spare part inventory investments and higher asset availability. However, there are also drawbacks to using temporary AM parts, mostly related to the much lower reliability of parts that are printed with a general‐purpose printer (Dizon et al. 2018, Weng et al. 2016), especially if its regular counterpart is made from metal. We therefore assume that the printed parts constitute temporary solutions that are removed as soon as a regular spare part becomes available. This has the added benefit that it does not disrupt the business model of the original equipment manufacturer (OEM), that is, the regular part is still required, which improves the chances that the OEM cooperates by providing part design details. Among the organizations that are exploring this solution is the US marine corps, who recently had a simple bumper from an F‐35 landing gear door wear out while on a training mission off the Japanese coast. Rather than expedite the entire landing gear door from the US mainland, the on‐board technicians quickly printed a replacement part to restore the plane to operational status (U.S. Department of Defense 2018). Other organizations with similar initiatives are the US Navy (3DPrint.Com, 2015), shipping companies (Motorship.Com 2016), the International Space Station (NASA 2015), and the RNLA, our partner organization.
In line with extant literature on dual sourcing with periodic replenishments and emergency shipments (see section 2), we define the time between two replenishments as an order cycle. The order cycle is modeled as a discrete number of periods (e.g., 7 days) and comprises three options for managing shortages: expediting a regular part, printing a part with the on‐site AM capacity, or waiting for a part to arrive with the scheduled replenishment. This is different from existing literature, as we consider two types of emergency shipments rather than only the common expediting option, in addition to the fact that the printing option delivers much lower reliability spare parts.
The differences between the common expediting option and 3D printing at remote locations introduce several new issues to investigate. First, we must assess the new trade‐off between expediting and printing. When should organizations rely on the on‐site printer and when should they use the more conventional expediting option? Second, how does on‐site 3D printing benefit operations in remote locations in terms of operating costs, on‐site spare parts inventory, and system availability and how does the effectiveness of on‐site printing compare to expediting? Third, how much on‐site raw material is required to print spare parts and how does this compare to the previously mentioned spare parts inventory benefits?
To address the above research questions, we formulate our (original) model and a relaxed model. For the relaxed model, a single order cycle analysis is applicable, and for that purpose, we formulate a discrete‐time Markov decision process (MDP). Its optimal solution is also optimal for the original model. We show that the optimal inventory control policy has a relatively simple structure. The scheduled replenishments follow a base‐stock policy, and two thresholds control the emergency ordering decisions. For the majority of problem instances, expediting is optimal for early shortages and printing is optimal later on, followed by backordering. However, we also show when this sequence reverses for expediting and printing. In most practical settings, printing is favored over expediting during the later stages of an order cycle, which is when backorders are most likely to occur. Next, we conduct a large case study for the RNLA within the context of her United Nations peacekeeping mission to demonstrate the value of printing vs. expediting, as well as the benefit of both options combined. In this case study, we show that printing is by far the most effective emergency source in terms of operational cost savings and spare parts inventory reductions. Especially the latter aspect is very welcome for the RNLA due to the storage space restrictions at remote locations. We furthermore show that the reduction in spare parts inventory is of much greater magnitude than the on‐site raw material inventory that is required for operating the printer. Our results thus show that investments in relatively cheap on‐site printing technology create major benefits for organizations that operate in remote locations.
This study is organized as follows. In section 2 we provide an overview of related literature. We formulate our original and relaxed model in section 3, and we provide the analytical results in section 4. We apply our model to RNLA data in section 5 and we provide our conclusions in section 6.
Literature Review
We investigate a setting that features multiple supply sources. Therefore, we first review the literature on dual‐sourcing problems. Next, we examine related literature on spare parts inventory control with emergency shipments. Finally, we review the literature at the interface of inventory control and AM.
Dual‐sourcing problems generally involve two suppliers of a single product, where one supplier offers a shorter lead time than the other against a higher procurement cost (for a review on dual‐sourcing problems, see Minner 2003). Recent research efforts have focused mostly on optimization of heuristic policies, such as the tailored base‐surge policy (e.g., Allon and Van Mieghem 2010, Janakiraman et al. 2015) and the dual‐index policy (e.g., Veeraraghavan and Scheller‐Wolf 2008, Zhang et al. 2012). There are two important differences between typical dual‐sourcing problems and the one with expedited orders and 3D printing that we analyze. First, we consider two types of emergency shipments rather than only the common expediting option. Second, we do not assume that each of the emergency sources is necessarily more expensive than the regular source: The parts that the general‐purpose printer produces may be cheaper, but it does deliver much lower quality spare parts, which introduces a new element to the traditional speed vs. cost trade‐off.
To the best of our knowledge, the only work that considers multiple supply sources with different quality characteristics is that of Chen et al. (2001), who consider a general number of suppliers, each with random yield losses. These yield losses are caused by products being defective upon arrival. Inspections and rework may take place to restore these to standard‐quality products. This differs from the higher failure probability for printed parts that we model, as this probability cannot be amended and will affect future demand when printed parts are installed. In the work of Chen et al. (2001), the demand is exogenous.
A substream of the dual‐sourcing literature that is particularly related to our work is that on periodic‐review inventory management with predetermined order cycles for scheduled replenishment, in which emergency shipments can be used to manage (impending) shortages during a cycle. Chiang and Guttierez (1998) derive the optimal policy for this setting when emergency orders can be executed in any period within a cycle, while Tagaras and Vlachos (2001) assume that there is only one review opportunity within each cycle to expedite products. Teunter and Vlachos (2001) provide an approximate evaluation for a model that generalizes the models of Chiang and Guttierez (1998) and Tagaras and Vlachos (2001). Zhou et al. (2011) consider a model for shipments of perishable blood platelets to hospitals, with the maximum order cycle length due to this perishability aspect being restricted to 2 days, with an intermediate expediting option. In each of the four aforementioned models, the expedited goods are identical to replenished goods. This holds also for the expediting option in our model, but it is clearly not the case for the parts that are printed with a general‐purpose printer, which is why we include in our model the higher failure probability of printed parts compared to regular parts. We thus add two new elements to this stream of dual‐sourcing literature: We consider two types of emergency shipments rather than only the common expediting option, and the printing option delivers much lower reliability parts.
Use of emergency orders is also common in spare parts inventory control. Basten and Van Houtum (2014) provide an extensive review on spare parts inventory control, including models with emergency shipments. In a spare parts setting, emergency sources may represent an expedited parts shipment from a central warehouse or a supplier (e.g., Howard et al. 2015), or an expedited repair (e.g., Arts et al. 2016). In both cases, spare parts demand is essentially treated as a lost sale at the local warehouse if it cannot be satisfied directly from inventory. For this reason, there is a strong connection between spare parts inventory control models with emergency shipments and lost sales inventory control models. The key differences between this stream of research and our work are the higher failure probability of printed parts and the limited access to the regular supply mode (i.e., the scheduled replenishments).
Research on inventory control and AM is seen as relevant by many (see, e.g., Olsen and Tomlin 2020, Song et al. 2020), and thus, the literature on inventory control and AM has grown in recent years. Khajavi et al. (2014) and Liu et al. (2014) both model a multiechelon spare parts supply chain and numerically investigate the effect of centralized vs. decentralized AM capacity. Others evaluate a one‐time decision to either print all products or continue using traditional technology. For example, Westerweel et al. (2018) model this choice as a one‐time design decision for a component of a technical system, whereas Dong et al. (2016) evaluate the choice between traditional technology and 3D printing related to assortment planning for general inventories in a manufacturing setting. Song and Zhang (2020) consider a single location, multiple item spare parts inventory system which is partitioned into a set of parts that is printed on‐demand with a capacitated on‐site printer, and a set that is procured to stock from an overseas regular source. Sethuraman et al. (2018) assess the value of personal fabrication, by which a firm sells the design for a consumer product and delegates production to the customer who is thus able to select her preferred quality level. Chen et al. (2017) consider a manufacturer who operates a retail store that is supplied with traditionally manufactured products in build‐to‐stock fashion, as well as an on‐line sales channel with customized, build‐to‐order printed products. Alternatively, the printer can be positioned in the store. Hedenstierna et al. (2019) study bidirectional outsourcing of production between two companies who can thus manage demand variability more efficiently. The authors start from a case study involving Shapeways and Panalpina.
We are aware of only one paper at the interface of AM and dual‐sourcing: Knofius et al. (2017) numerically investigate a combination of traditional manufacturing and additive manufacturing for spare parts in a continuous time setting, with the assumption that printed parts are of inferior quality. Their experiments show savings of more than 10% compared to a single‐sourcing strategy. There are many differences between our work and this paper, primarily because Knofius et al. (2017) consider only two supply modes, which are both available at all times, which is not the case in our model. Except for the paper of Knofius et al. (2017), none of the aforementioned papers consider a reliability difference between regular and printed parts. This is especially relevant given the limitations of AM technology and, in particular, general‐purpose printers.
Model
In this section, we first describe our original model


Original Model
We consider a periodic‐review model


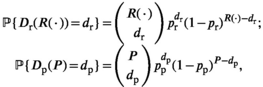
For each system in operation, we model the occurrence of a failure as a Bernoulli process. Whether or not the part fails in a single period is a Bernoulli trial. The probability of failure in a period for one part is denoted by p r and p p for installed regular and printed parts, respectively. We assume that printed parts have a higher failure probability than regular parts (i.e., 0 < p r < p p < 1). As the installed base is finite, the number of failures in a period follows a binomial distribution for both the installed regular and printed parts.
The three supply sources, i ∈ {r,e,p}, denote scheduled replenishments, expediting, and printing, respectively. Expedited parts are identical to replenished parts, and we refer to them as regular parts. Let

Periodic Review Structure
Mobile maritime assets, such as container vessels, dock periodically in ports with ready access to spare parts, which enables fast replenishments. Defense organizations typically keep spare parts inventory near the point of departure of the scheduled replenishments, thus enabling order picking shortly before the replenishment opportunity occurs. We therefore assume a zero lead time for the replenishments from a source with ample stock and we assume that ordering from this source is only possible at the beginning of each order cycle. We also assume a zero lead time for both emergency sources, which can be interpreted as meeting unfulfilled demand by means of an overnight expedite or printing job. Parts can be expedited or printed at the end of each period within the order cycle, except for the first period. In this study, we use the term shortage to refer to demand that cannot be fulfilled directly from stock. A backorder refers to a shortage that remains at the end of a period; that is, when no part is immediately expedited, printed, or ordered via replenishment.
We denote the unit ordering costs for a part through scheduled replenishment by c r and the unit expediting and printing cost by c e and c p, respectively. We assume that c e > c r to reflect that expediting incurs a premium cost. We further assume that c e > c p. In both cases, the reverse would imply that expediting incurs (non‐strictly) lower costs, while the quality of the ordered parts would be the same or higher, respectively. In other words, expediting would dominate the other ordering option. The printing costs need not be lower than the scheduled replenishment ordering costs; that is, both c r > c p and c r ≤ c p are possible.
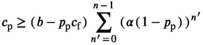
A failure occurs during a period and the corresponding unit cost is denoted by c f. This covers the inconvenience of a failure itself (e.g., in the case of a vehicle used for a peacekeeping mission, it may be the cost to bring the vehicle back to the base) and the unavailability of the system during the rest of the period. A cost of b is incurred per outstanding backorder per period; this cost represents the cost of unavailability of one system during a whole period. The failure cost c f can be larger than b, but we do assume that p p c f < b (this implies that also p r c f < b). Since p p c f represents the expected failure costs per period of a system with a printed part, it holds that if p p c f ≥ b, using a printed part in a system would never be optimal. We further assume that c r p r < b. Otherwise, it would be optimal to continuously incur backorders.
Inventory holding costs, which consist of storage and insurance costs, are incurred at the end of each period over the on‐hand inventory at a cost of h per unit of stock. We note that storage space restrictions at remote locations imply that holding costs are higher than normally in inventory management. Future costs are discounted with rate α, 0 < α < 1.
Notice that the on‐demand nature of the expediting and printing options implies that the optimal number of expedited and printed parts never exceeds the number of shortages and that rationing inventory (i.e., simultaneously having on‐hand stock and backorders) is never optimal. We further assume that it is never optimal to have outstanding backorders directly after a scheduled replenishment. A sufficient condition to achieve this is c r p r < c p p p, which will usually hold in the setting that we consider since the ratio between quality and price of printed parts would otherwise be higher than that of regular parts. These properties are useful for the MDP formulation in section 3.2.
We assume that printed parts constitute temporary solutions that are removed from the installed base at the end of each order cycle, after which they are disposed of. One reason for this assumption is that this type of printed parts is much less resistant to cyclic loading than conventionally produced parts (Padzi et al. 2017) due to more rapid crack propagation and delamination. Therefore, our partner organization (the RNLA) does not intend to use printed parts beyond the end of an order cycle. A second reason is that the RNLA does not want to disrupt the business model of the original equipment manufacturer (OEM). By using these parts temporarily the regular part is still required at the same rate, which improves the chance that the OEM cooperates by providing part designs. We finally note that running printed parts to failure leads to lower optimal costs if printed parts have a low failure probability, but if the printed parts have a much higher failure probability than regular parts, which we typically assume, costs would be similar and may even be higher; this is confirmed by a numerical experiment in Appendix A.
We focus on obtaining results for a single‐item model under the assumption of unlimited raw material because of the analytical challenges involved with incorporating this aspect into our model. Notably, it requires a multi‐item model formulation to take into account raw material inventory pooling effects. This creates interaction effects among components regarding printing decisions, which limits our ability to obtain results regarding the optimal emergency ordering policy, and it gives rise to state‐space issues when applying the model to the components in our RNLA case study, which greatly limits the model's practical value. We use the results from our single‐item model to determine the required raw material for on‐site printing operations for the RNLA in section 5.6 and find that the required storage space for raw material is an order of magnitude smaller than that required for the spare parts.
We model the following sequence of events in each period: First, component failures occur during the period, and on‐hand inventory serves to restore systems to working order if spare parts are available. Second, if it is the last period in an order cycle—that is, the period in which replenishment takes place—all printed parts in operation are removed from the systems and disposed of. Then the state of the system is observed, and expediting, printing, or replenishment decisions are made, incurring the relevant unit ordering costs. The spare parts arrive before the end of the period and are installed if there is unfulfilled demand. Finally, holding and penalty costs are incurred.
Relaxed Model
In the relaxed model, denoted as model


For the relaxed model, w.l.o.g., we take the replenishment decision in two steps. The first step is taken at the end of the order cycle and brings the inventory position back to 0. If the inventory position is positive just before this step, then we receive c r per unit. Otherwise, we pay c r per unit. In the second step, we decide with which inventory position to start the next order cycle. This will be a nonnegative number, and we pay c r per unit at the beginning of the next cycle. While the replenishment decision is taken in two steps, the physical replenishment itself is still done in one step.
Under the above procedure, we always end with a zero inventory position after the first step of the replenishment decision and hence we are always in the same state when the second step is taken. Therefore, the relaxed model can be analyzed by a single order cycle analysis that starts just before the second step of a replenishment decision and ends after the first step on the subsequent replenishment decision.
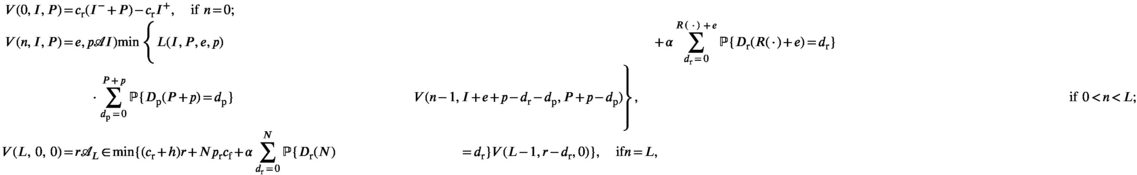
MDP Formulation
In this section, we give the MDP formulation for the analysis of a single order cycle of the relaxed model


We define the action space at the beginning of an order cycle (i.e., for n = L) as


Analysis
In this section, we first derive the optimal policy for the relaxed model


Relaxed Model
We analyze the characteristics of the optimal inventory control policy. Figure 2 illustrates our results, using the parameters in Table 1, plus c p = 125 and p p = 0.15. It shows a clear structure in dealing with shortages during an order cycle, with two control thresholds that determine when to expedite a part, when to print, and when to wait for the scheduled replenishment. We proceed to show that these are structural properties of the optimal inventory control policy, starting with Lemma 1.
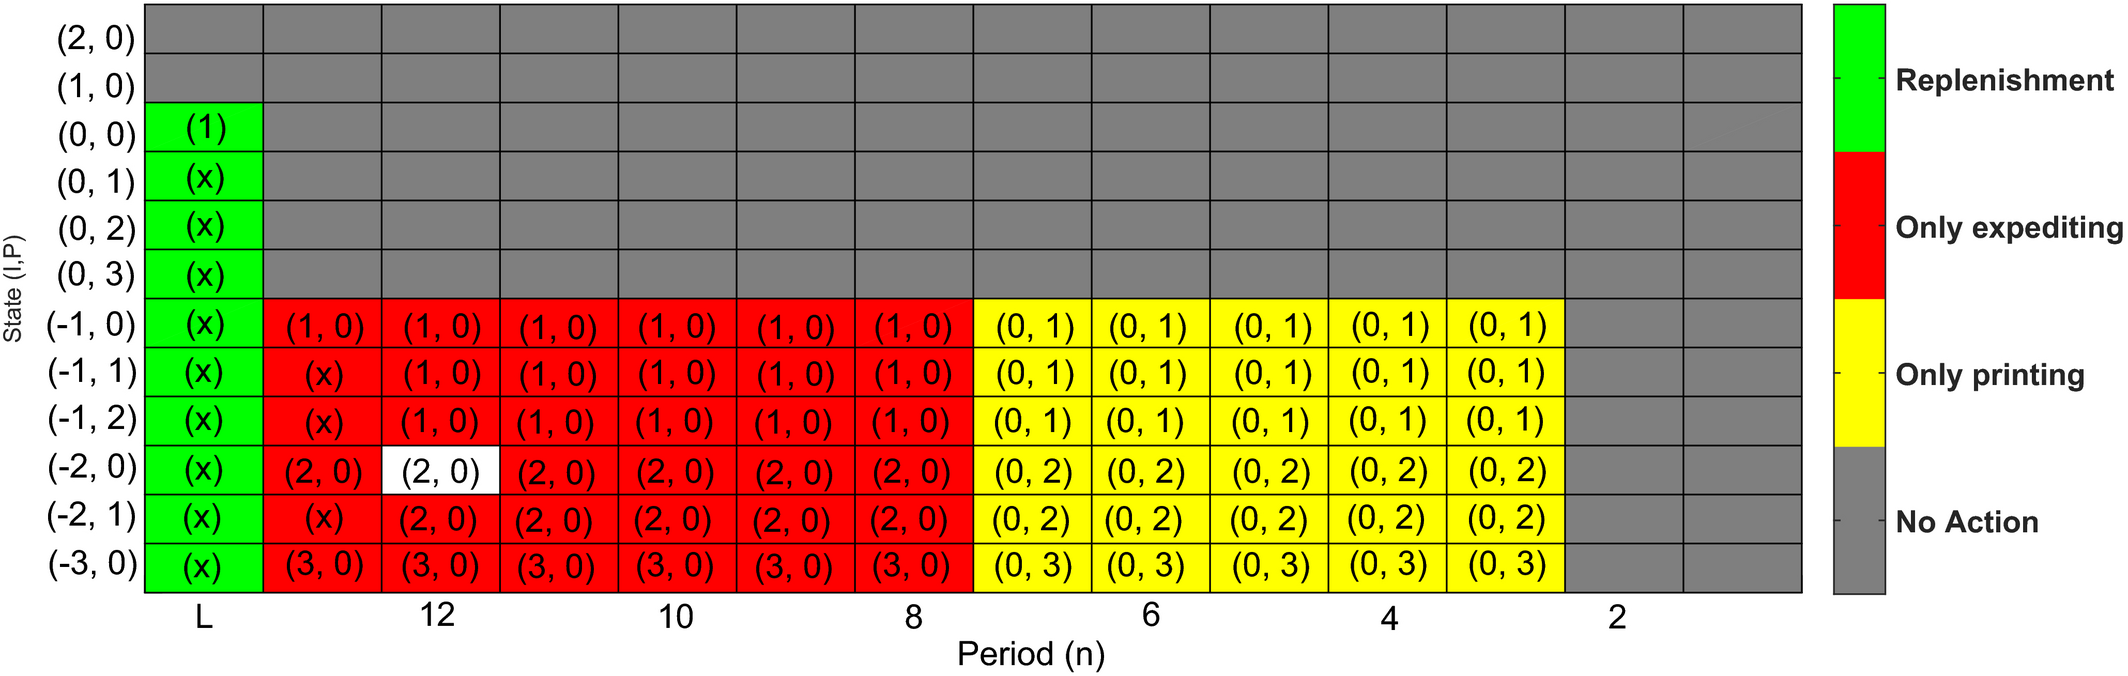
Illustration of an Optimal Policy, Including Actions and (x) Indicating Unreachable States
Parameters for Figures 2, 3 and 4
For model 
The online companion provides the proof of Lemma 1 and all other proofs. Lemma 1 implies that in any period, all shortages are either fulfilled by expediting, by printing, or they are all backordered. This is different from the case where printed parts are allowed to run to failure, as we have previously discussed and which is illustrated in Appendix A. To further characterize the optimal inventory control policy, we next characterize the backorder threshold, which controls from which point onward all shortages should be backordered in anticipation of the next replenishment.
For model 


Notice that both inequalities (1) and (2) are satisfied for n = 0. The right‐hand side of inequality (1) is either strictly increasing, constant, or strictly decreasing for n ∈ {0, …, L−1} (by Lemma 4 in the online companion). Hence, inequality (1) is satisfied for all n ∈ {0, …, L−1} if and only if inequality (1) is satisfied for n = L − 1. The right‐hand side of inequality (2) is strictly increasing for n ∈ {0, …, L−1}, and hence inequality (2) is satisfied for all n ∈ {0, …, L−1} if and only if inequality (2) is satisfied for n = L − 1. This implies that 

Figure 2 shows an optimal policy structure with a second threshold that marks the transition from expediting to printing. Surprisingly, it turns out that the optimal policy does not always transition from expediting to printing. In some cases, the ordering sequence of the expediting and printing interval can reverse, as Figure 3 illustrates, using the parameters in Table 1, plus c p = 270 and p p = 0.02. We first formalize this and then discuss the results.
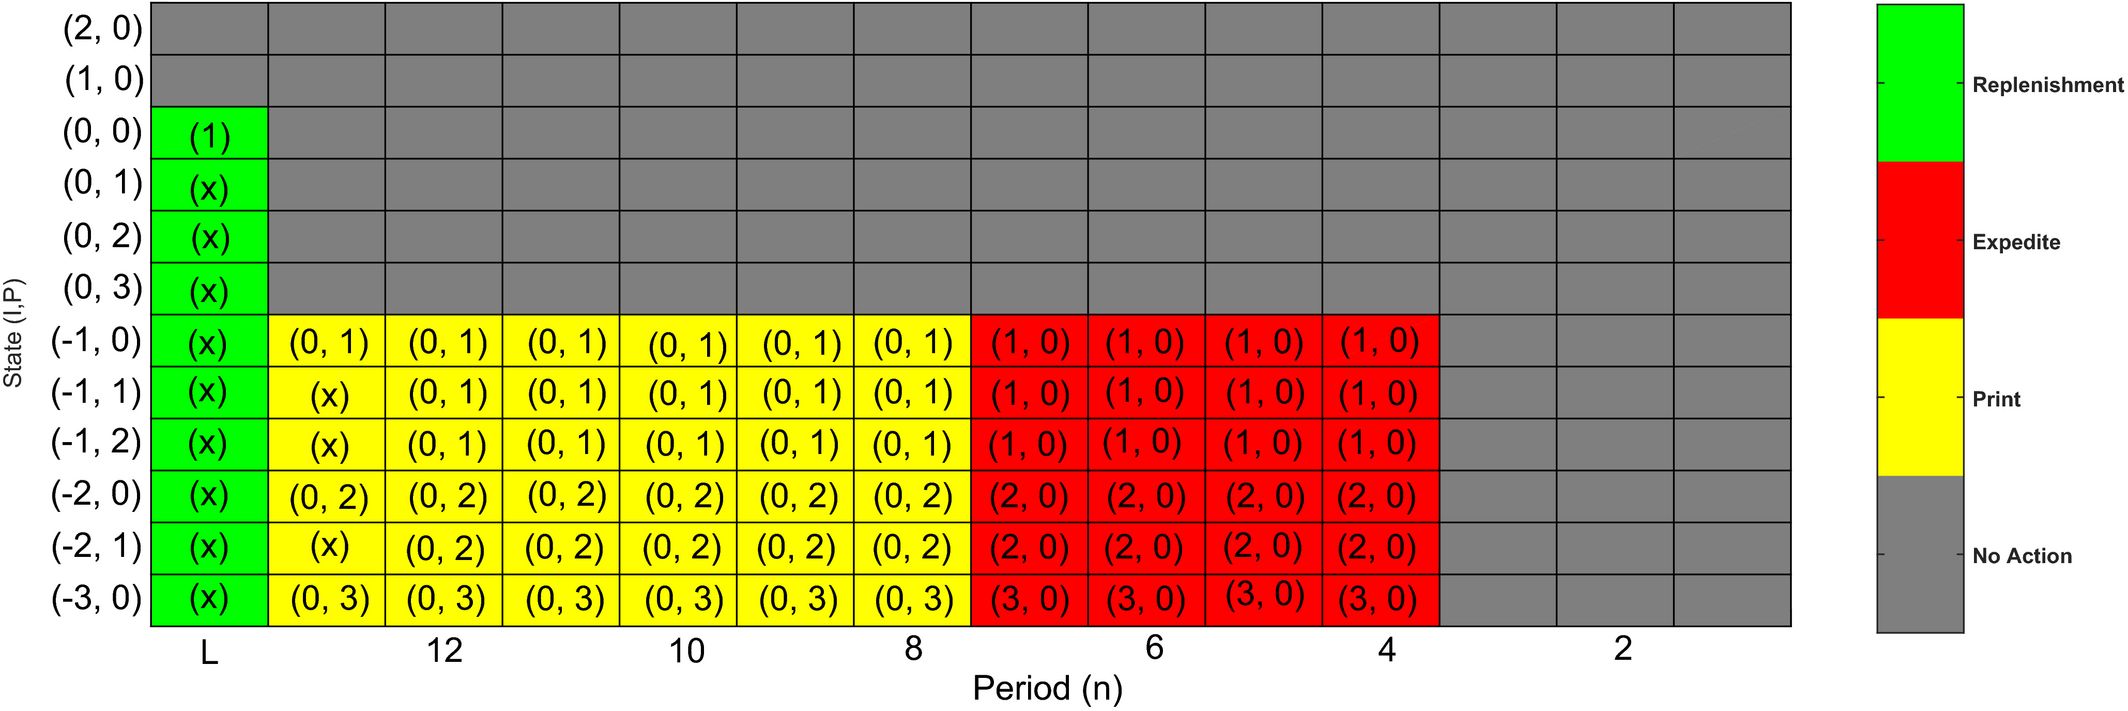
Illustration of an Optimal Policy with Reversed Sequencing Behavior, Including Actions and (x) Indicating Unreachable States
Consider model 

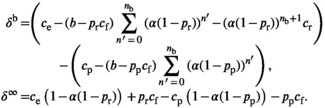
If δ
b ≥ 0, then there exists a second threshold n
p with If δ
b < 0, then there exists a second threshold n
e with


Notice that δ
b ≥ 0 if inequality (2) is violated for 


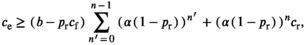
Together, Theorems 1 and 2 imply that the optimal emergency ordering policy is indeed divided into, at most, three intervals based on, at most, two thresholds. If there exists a backordering interval, it is always at the end of the order cycle. Typically, printing comes immediately before that. The reversed sequencing behavior specified by Theorem 2 part (ii) and shown in Figure 3, that is, a printing interval followed by an expediting interval, is somewhat counter intuitive. Still, Figure 4 illustrates that it occurs in a non‐negligible subset of all settings (using the parameters in Table 1). At the same time, it illustrates that the other situations are more common. Typically, one would expect that early shortages should be met by expediting an expensive but reliable part that likely survives until the end of the cycle, while shortages that occur shortly before replenishment should be met by printing a cheap temporary replacement. The higher failure probability is then less important. However, if printing is relatively expensive, but printed parts are also relatively reliable, then expediting may be interesting shortly before the regular replenishment moment: paying a high price for a printed part that has to be replaced when the regular replenishment comes in, is not interesting. As Figure 4 shows, such low failure rate may still be more than twice as high as the failure rate of a regular part. At the same time, we see in Appendix A that in this case it may be more attractive to consider the alternative model in which printed parts are run to failure.
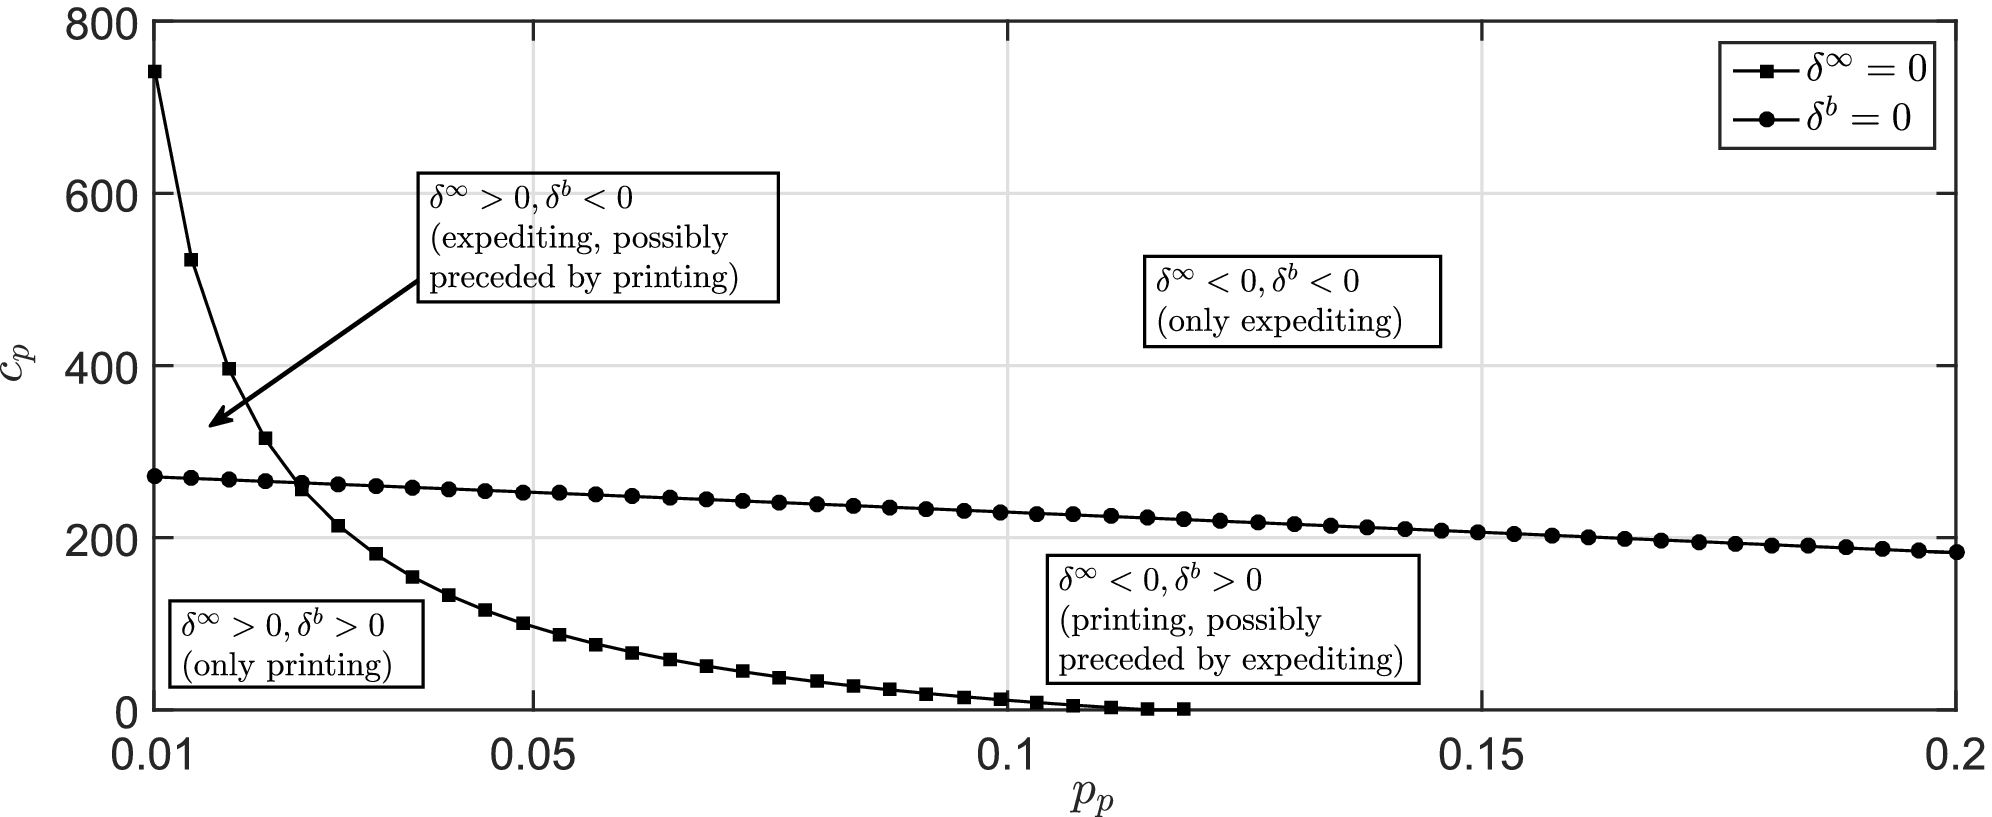
Illustration of the Occurrence of the Different Orders and Numbers of Intervals
Finally, we consider the replenishment decision at the beginning of an order cycle. The Bellman equation for V(L, 0, 0) may be rewritten as

Theorem 3 describes the optimal replenishment decision.
For model 
This completes the analysis of the optimal policy for the relaxed model 
Original Model
We now return to the original model 
The optimal policy of model 

The optimal costs during an infinite time horizon are obtained by following the optimal policy in each order cycle. Given that we start with a zero inventory position, we then obtain expected discounted costs V(L, 0, 0) in the first cycle, costs α L V(L, 0, 0) in the second cycle, and so on. The total discounted costs are then equal to V(L, 0,0)/(1 − α L ).
Additive Manufacturing at Remote RNLA Operations
In this section, we consider three mission‐critical RNLA systems to determine the impact of on‐site printing on RNLA operations. The parameters of this case study are based on data from an RNLA mission in Mali, which we describe in section 5.1. Section 5.2 provides the problem parameters, and in section 5.3, we describe the results of the analysis. In section 5.5, we investigate a few scenarios that may arise in an alternative mission context. We finally explore the magnitude of the required storage space for 3D printing raw material in section 5.6.
Context of the RNLA's Mali Mission
Per July 2018, the RNLA is involved in a total of 15 foreign missions. These range in size from a small presence as part of the United Nations mission in South Sudan, involving half a dozen soldiers, to large peacekeeping missions of up to several hundred soldiers, such as the United Nations peacekeeping mission in Mali. We now focus on the latter to provide the context of RNLA operations in remote locations.
The United Nations commenced its peacekeeping mission in Mali in April of 2013 (United Nations 2018) after the country was destabilized by militant groups over the course of 2012. The RNLA has maintained a presence in the eastern part of the country since 2014, with its main operating base (MOB) near the city of Gao. The MOB functions as the hub for all RNLA operations in eastern Mali, and it contains all mission‐critical facilities, such as a maintenance facility, a field hospital, personnel barracks, and a supply depot, where spare parts are stored in climate‐controlled storage containers. The MOB is therefore largely self‐sufficient in terms of on‐site facilities, but it must still be periodically supplied from The Netherlands to bring in new personnel, to replenish stocks of ammunition, combat equipment, spare parts, and other goods, and because storage space is limited. Figure 5 shows the simplified structure of the supply chain that the RNLA is operating between The Netherlands and the MOB, with a weekly consolidated air cargo shipment going from different depots in The Netherlands via the point of embarkation to the point of debarkation, from which domestic flights leave twice a day to the MOB. In 2017, the RNLA deployed a general‐purpose printer, the Markforged Mark II, to the MOB for on‐site prototyping and testing purposes. Among the RNLA's interests is the extent to which this printer can be used for supplying emergency parts when needed and its effect on the on‐site inventory and mission‐readiness level of her equipment.
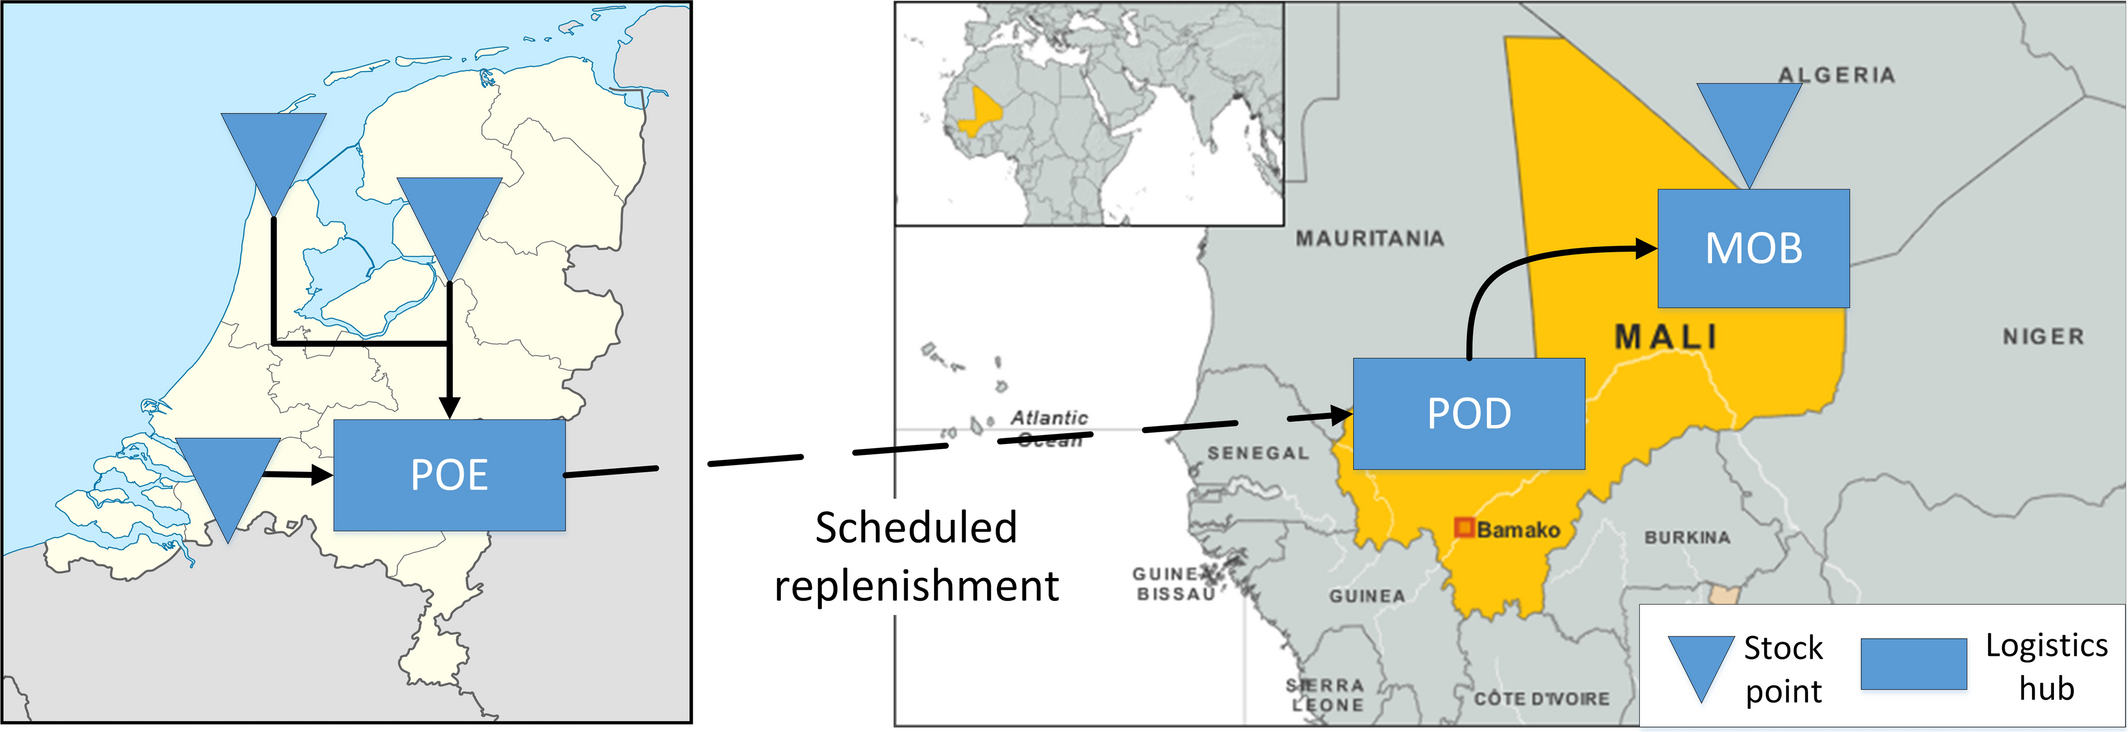
Simplified Royal Netherlands Army Supply Chain to Mali, showing the Point of Embarkation and Debarkation, and the Main Operating Base (MOB)
Parameterization
Our dataset contains data on close to 3,000 components for three systems: the Boxer multi‐role armored vehicle, the Fennek light armored reconnaissance vehicle, and the militarized Mercedes‐Benz jeep (MB). The Fennek and the MB are selected because the RNLA currently operates these systems in Mali. The Boxer is one of the RNLA's newest acquisitions, for which she also purchased the design drawings. The long years of remaining service, the readily available spare parts design files, and the fact that the RNLA originally intended to deploy the Boxer to Mali make this system a suitable candidate for our application.
The RNLA is operating 8 Fenneks and 42 MBs in Mali, and it originally intended to send 6 Boxers. We set the unit backorder costs b for MB, Fennek, and Boxer spare parts equal to 50, 400, and 600 €/day, respectively, to reflect the fact that the Boxer is the most critical of the three systems, followed by the Fennek, and then the MB. We assume that c
f = b in all cases, as it represents half a day of downtime on average plus the costs of aborting the mission in which the vehicle is involved. Inventory holding costs per year equal 100% of the regular unit order costs, which reflects the limitations and the costs imposed on keeping spare parts inventory at the main operating base. The expected lifetime of the printed parts is estimated by the RNLA's AM expert to be approximately one‐tenth of that of their regular counterparts (i.e., p
p = 10p
r). Unit printing costs are estimated by taking into account machine depreciation costs and material costs, which Atzeni et al. (2010) show to be the largest cost factors for 3D thermoplastics printing. Assuming linear machine depreciation over a five year period for a € 30,000 Markforged Mark 2 that operates at 50% machine utilization, sets the depreciation costs at d = 30,000/(5·24·365·0.5) = € 1.37 per hour. Raw material costs are c
rm = € 0.10 per cubic centimeter, and the build speed of the printer is s = 50 cubic centimeters per hour. The printing costs as a function of the print volume v
p is thus given by combining the machine depreciation costs and the raw material costs as:
We obtain the boxed volume of a spare part in inventory (v r) based on the outer dimensions of a regular part, which we use to calculate the savings in storage space via the base‐stock level reduction. Note that v r > v p. The main operating base in Mali is supplied from the Netherlands on a weekly basis, so L = 7 days. Expediting parts to the MOB in Mali is not a feasible option, but there are settings, such as NATO training missions in Eastern Europe, in which expediting is feasible. For lack of a dataset on such a mission we include an expediting option by adding € 500 to the unit replenishment cost to reflect the fact that expediting incurs a cost premium, i.e., c e = c r + 500.
Only a subset of spare parts is suitable for AM because of technical limitations of the on‐site printer. Assessing which components are suitable requires expert knowledge on AM, as well as engineering skills to project technical system requirements onto the component that is being assessed. Because this is a labor‐intensive activity that cannot be automated, we first rank the spare parts based on their economic AM potential (see Appendix B for details on this ranking procedure). Based on this ranking, we select 100 components for a technical assessment by RNLA AM experts, which yields 14 components, listed in Table 2, that are suitable for printing with the Markforged Mark 2 that the RNLA operates in Mali.
Input Parameters and Intermediary Results for 14 Royal Netherlands Army (RNLA) Spare Parts

Results
We apply our model to the set of printable parts and compare the benchmark policy, which features no emergency ordering options, to three other policies: the printing policy, which features only printing, the expediting policy, which features only expediting, and the double policy, which features both emergency options. The four policies are indexed by i ∈ {b, p, e, d} to denote the benchmark, printing, expediting, and double policy, respectively. Each emergency option can be disabled by setting its respective unit ordering cost to infinity. Because the emergency options only impact the inventory holding and backorder costs, similarly to Tagaras and Vlachos (2001), we subtract costs that cannot be prevented to better illustrate the impact of the emergency options. These costs are the discounted ordering costs over an infinite time horizon of a just‐in‐time policy with zero uncertainty and replenishments in every period: 


Results for 14 Royal Netherlands Army (RNLA) Spare Parts under the Benchmark, Printing, Expediting, and Double Policy


We find that access to both emergency options significantly decreases the costs, with savings ranging from 20% to 61%. Mean savings over the 14 spare parts are 47%. Much of the savings are generated by reductions of the optimal base‐stock level. Using each part's actual shelf space volume v
r and multiplying this with its respective optimal base‐stock level 
As a stand‐alone option, expediting only achieves 9% average savings. These savings mainly result from a reduction of the backorder costs; the reduction in on‐site inventory is limited with 0.7%. Table 3 furthermore shows that the results of the double policy are identical to the results of the printing policy, which implies that expediting does not give any further savings once the printing option is available. Table 2 already shows that printing is optimal for all parts immediately before the backordering interval, since δ
b ≥ 0. Even though some parts have 
The number of parts across all RNLA systems for which the general‐purpose printer can produce a functioning replica ultimately determines the impact of on‐site printing on RNLA operations. In this regard, we note that technical feasibility is not a criterion of the spare parts ranking method, implying that the 100 spare parts assessed by the RNLA's AM experts represent a random subset, of which 14 are suitable for on‐site printing. This suggests that our results apply to 10–20% of the RNLA's spare parts, which extends far beyond the three systems that we consider, and that subset may still increase as AM technology continues to improve.
Robustness Checks
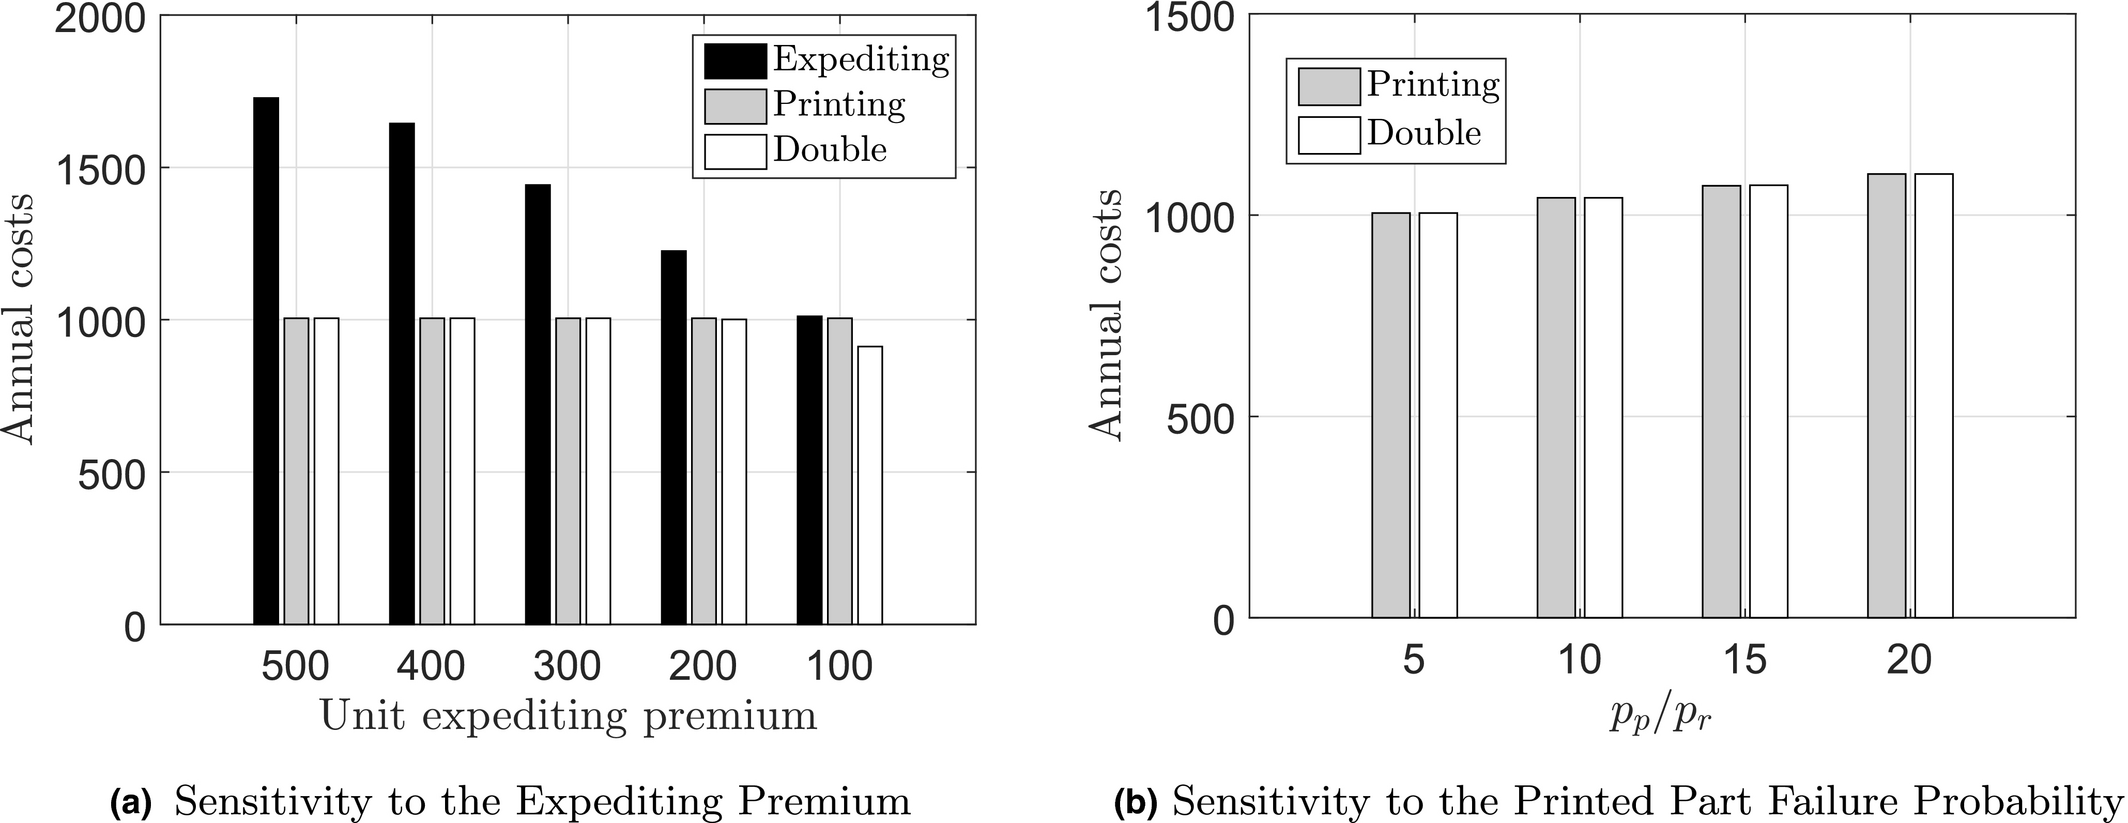
To illustrate the robustness of the results from section 5.3, we conduct a sensitivity analysis with regards to the unit expediting premium and the printed part failure probability. Figure 6a shows that printing completely outperforms expediting, even when the unit expediting premium drops from € 500 to € 100, which is much lower than we can expect in our practical setting, although we note that the double policy features some expediting when c e = c r + 100. Figure 6b shows that the results are also very robust to higher failure probabilities: even printed parts with a 20 times higher failure probability compared with regular parts (rather than 10 times) have a good chance of acting as effective temporary solutions by surviving until the end of an order cycle. This is also why printed parts that fail only five times more often than regular parts yield almost no additional cost savings. As long as the RNLA uses printed parts as temporary replacements, any advances in technology to create stronger printed parts will likely impact the benefits of on‐site AM more by increasing the subset of printable parts than by decreasing operational costs for those that can already be printed. Overall, these results are strong evidence that the RNLA benefits from printing at remote locations, but also at locations closer to home where expediting is cheaper than in Mali.
The Robustness of our Results with Respect to the Expediting Premium and Printed Part Quality
Alternative Scenarios
Future improvements to AM technology will impact the benefits that the RNLA attains by implementing it into its operations. Specifically, we expect printing costs to decrease for future systems, which we investigate in a scenario with 50% reduced printing costs. We also consider a scenario in which the RNLA is involved in a conflict that requires a larger military presence than the current mission in Mali. In this scenario we double the installed base size of the Boxer and the Fennek to 12 and 16 systems, respectively. The MB parts are excluded because calculation times become prohibitively large for more than approximately 50 systems.
Figure 7 reports the annual savings per spare part for the two scenarios and compares these to the annual savings for the double policy that are reported in the previous section. Figure 7a shows that savings increase substantially for some parts when printing costs decrease, while other parts hardly benefit. Overall the relative savings increase from 48% to 61% when the printing costs are halved. Which parts benefit most depends on the share of the printing costs under the optimal policy. Heavier spare parts, such as parts 2 and 4, benefit much from a reduction in printing costs, while others benefit less because they are already very cheap to print. Figure 7b shows that the relative savings tend to decrease when more systems are deployed, which is due to the fact that larger missions enable more effective inventory pooling. In this case, the relative savings decrease from 48% to 43% when the installed base size is doubled.
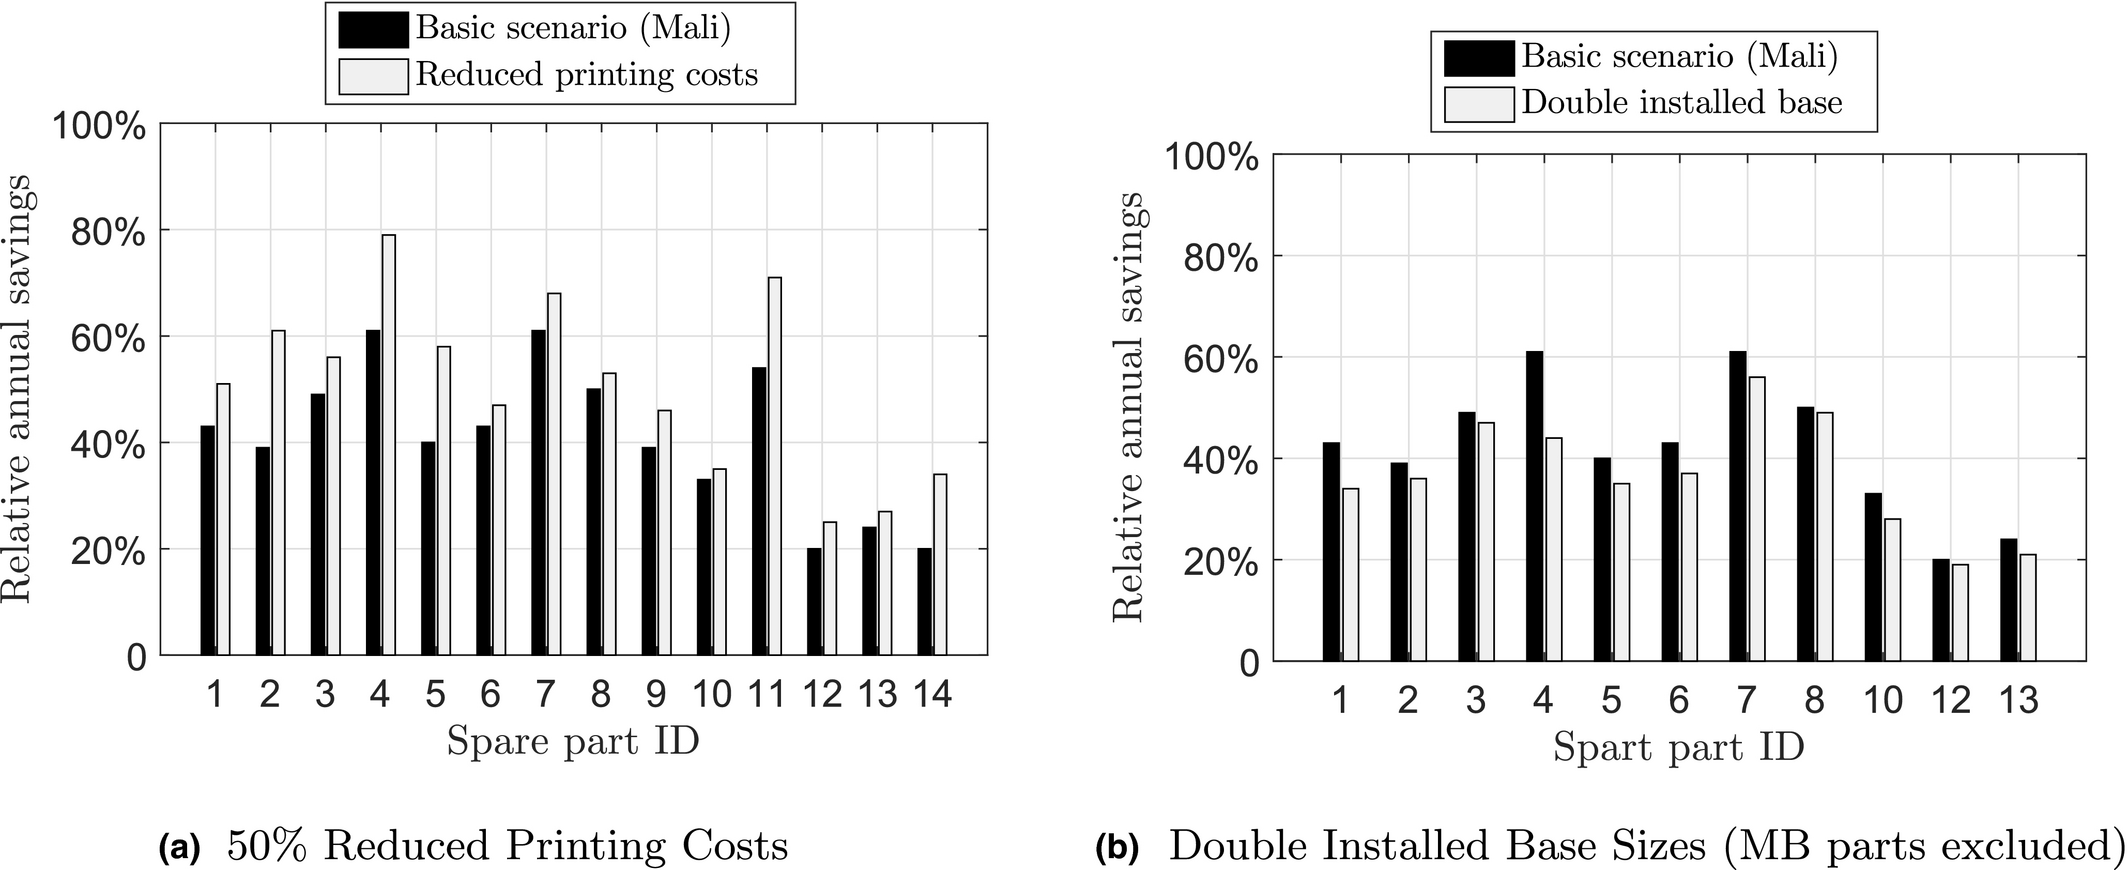
Annual Cost Savings for Two Feasible Future Royal Netherlands Army Scenarios
3D Printing Raw Material Inventory
The results of section 5.3 do not contain the investment in raw material that is used by the on‐site printer and the space that this requires in the MOB. In this section, we therefore show the impact that this has on our results. Incorporating raw material inventory directly into our model is highly impractical, as explained in section 3. We therefore calculate the mean and variance of the printing raw material per order cycle for each of the 14 RNLA components individually, based on the single‐item optimal policy as determined by the MDP. The mean and variance of all components are then combined to establish the mean and the variance of required printing raw material over all 14 parts, thus allowing for inventory pooling of raw material across parts. We refer to Appendix C for the exact calculation method.
The raw material for the Markforged Mark 2 consists of nylon wire that is delivered on 800cc spools. For the sake of convenience we assume that the RNLA follows a base‐stock policy for the raw material and that the raw material replenishment quantity is a continuous variable. Because the raw material is quite robust, no further infrastructure is required to prevent raw material degradation, unlike metal powder for high‐tech metal AM systems. In fact, the spools are simply hung on the wall of the unit that houses the printer.
Storage space at the MOB is assigned based on the inventory's base‐stock levels. We therefore base our comparison on the base‐stock levels of both inventory types, rather than their average on‐hand inventory, although we use the term inventory savings when we discuss our results.
The resulting storage space for combined spare parts and raw material inventory is shown in Figure 8, which illustrates that very high non‐stockout probabilities can be attained, while still drastically reducing the required storage space: in section 5.3, we reported a 72% decrease and Figure 8 shows that with a 99.9% non‐stockout probability, the decrease will still be 66% (only 760cc raw material is required). The effect on the inventory holding costs is even smaller, because the value per cubic centimeter of raw material is much smaller than the value of a spare part. The cost savings therefore only decrease from 58% to 57.5% using a 99.9% non‐stockout probability.
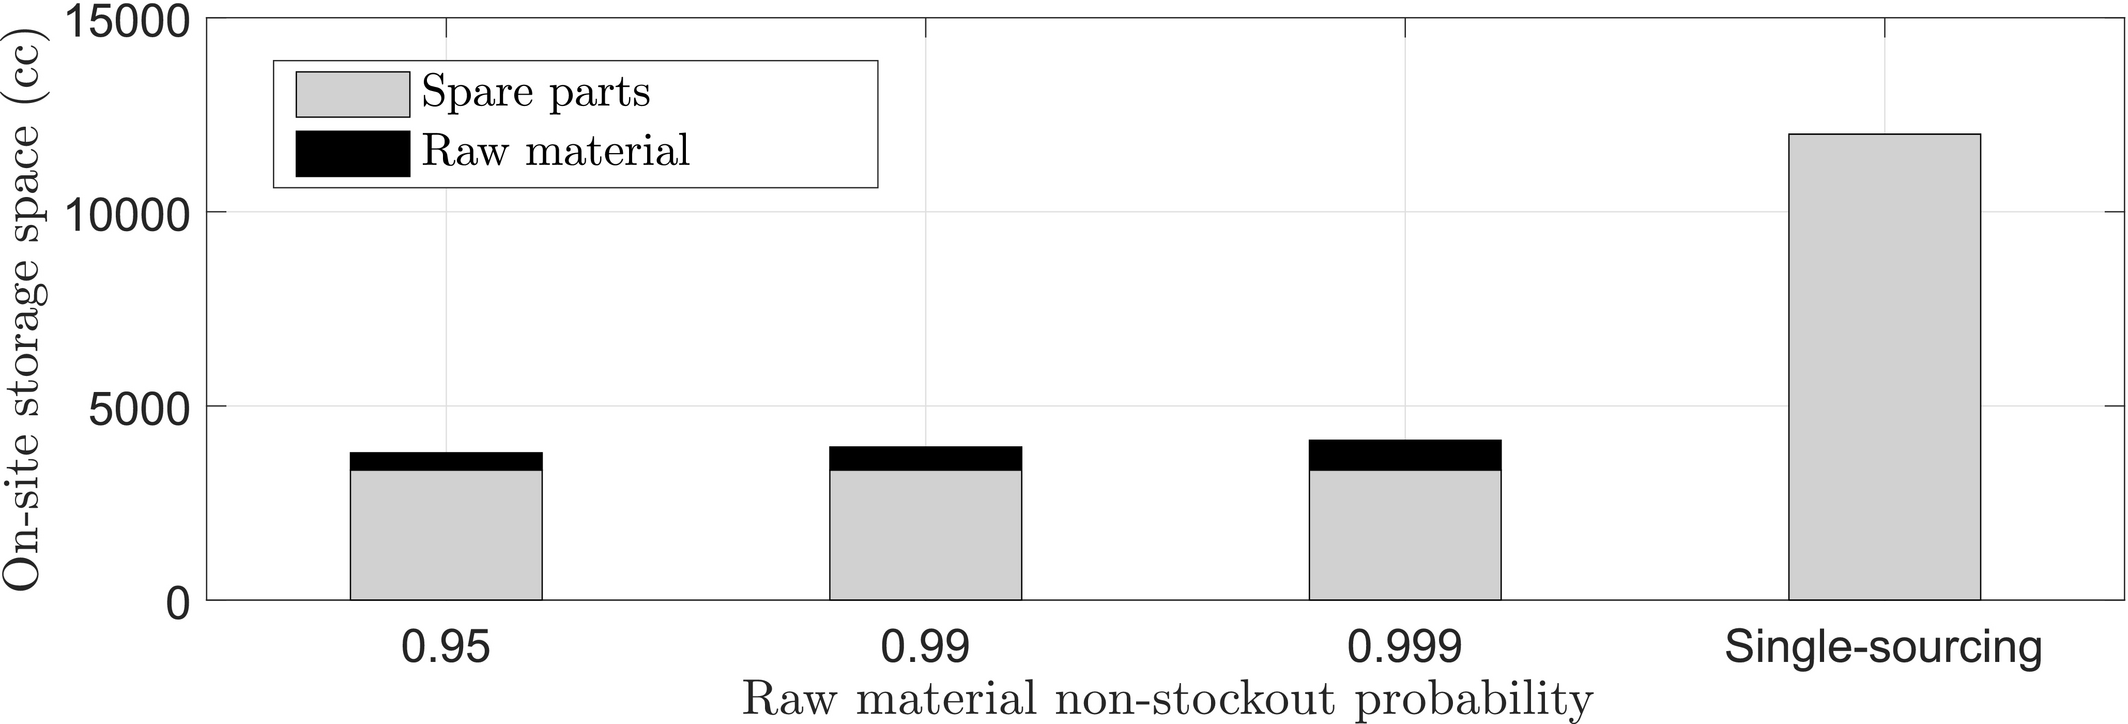
Base‐Stock and Raw Material Storage Space of 14 Royal Netherlands Army Components at the MOB as a Function of Raw Material Non‐Stockout Probability
There are two reasons why the raw material inventory is small relative to the reduction in spare parts inventory: the raw material inventory pooling effect over all printable spare parts and the consolidation effect that results from the difference between the printing volume and the boxed volume of spare parts. To investigate the impact of these two reasons, we negate the consolidation effect by determining the optimal control policy, which is used to calculate the mean and variance of printed parts demand, by running the MDP with the actual printing costs (see Table 2), but subsequently determining the required raw material base‐stock level as if solid parts are printed (i.e., parts for which v p = v r). Under a 99.9% non‐stockout probability, we then find a raw material base‐stock level of 3,188cc. The cumulative base‐stock is then 3,349 + 3,188 = 6,537cc, which amounts to 46% in storage space savings compared to the 12,001cc of regular base‐stock under the single‐sourcing policy. Two‐thirds of the reported 66% of storage space savings is thus attributable to the raw material inventory pooling effect and the remainder to the consolidation effect.
These results show that the impact of requiring on‐site raw material is much smaller than the storage space and cost savings generated by the on‐site printer, thus validating its exclusion from the model of section 3. We finally note that we have not included the space for the printer itself, but this should have little influence on our results because it is a relatively small desktop printer, while the total number of printable components for all systems at the MOB is much larger than the 14 components that we have considered.
Conclusions
Spare parts inventory management is a difficult issue for all firms that own and operate technical assets, and even more so for firms that operate in remote geographic locations. On‐site 3D printing can help alleviate some of the most pressing issues, by quickly providing temporary replacements parts in case of a regular spare part shortage. We present a new model formulation in which the 3D printer, which supplies lower reliability spare parts, can be used in conjunction with a common expediting option to manage spare parts shortages that occur in between scheduled replenishments. We characterize the optimal control policy to show when either expediting or printing should be used to resolve spare parts shortages, and when these should be backordered. Typically, printing is favored over expediting during the later stages of an order cycle, which is when most shortages occur. We demonstrate the benefits of on‐site printing via a large case study based on actual Royal Netherlands Army (RNLA) operations in Mali. Our results show that RNLA operations benefit greatly from the on‐site printer, and much more so than from a conventional expediting option, as on‐site printing leads to a reduction in operational costs of 47% across 14 components of three mission‐critical systems. Specifically, we find that the required inventory storage space for regular spare parts is reduced by 72% and that backordering is never optimal, thus increasing the ability of the RNLA to operate in remote locations. Another encouraging finding is that these benefits are achieved with a relatively simple general‐purpose printer against very small investments in on‐site raw material. We thus conclude that on‐site printing of temporary spare parts is a very attractive option for many organizations in the mining, oil and gas, and intercontinental shipping industry that, like the RNLA, operate critical technical systems in remote geographic locations.
Footnotes
A. Running Printed Parts to Failure
B. Ranking Procedure
C. Calculating the Mean and Variance of Raw Material Demand
Acknowledgments
The research leading to this study has been supported by The Netherlands Organisation for Scientific Research (NWO) under project number 438‐13‐207. For help on the case studies, the authors thank Nina Rooijakkers and Captain Stephan Wildenberg. The authors also thank Herman Blok for helpful discussions on the MDP formulation.