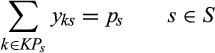
The population of truck drivers plays a key role in the spread of HIV and other infectious diseases in sub‐Saharan Africa. Truck drivers thereby affect the health and lives of many, but also suffer from poor health and significantly reduced life expectancy themselves. Due to professional circumstances, their health service needs are generally not well addressed. Therefore, the non‐governmental organization North Star Alliance builds a network of healthcare facilities along the largest trucking routes in sub‐Saharan Africa. This paper studies the problem where to place additional facilities, and which health service packages to offer at each facility. The objective combines the maximization of the patient volume at these facilities and the maximization of the effectiveness of the health service delivery to the population served. The latter criterion is modeled through three novel access measures which capture the needs for effective service provisioning. The resulting optimization problem is essentially different from previously studied healthcare facility location problems because of the specific mobile nature of health service demand of truck drivers. Applying our model to the network of major transport corridors in South‐East Africa, we investigate several prominent questions managers and decision‐makers face. We show that the present network expansion strategy, which primarily focuses on patient volumes, may need to be reconsidered: substantial gains in effectiveness can be made when allowing a small reduction in patient volumes. We furthermore show that solutions are rather robust to data impreciseness and that long‐term network planning can bring substantial benefits, particularly in greenfield situations.
Sub‐Saharan African truck drivers work under difficult conditions. Their trips last up to several weeks, during which time they are separated from their spouses and social‐cultural norms and in which they are challenged by monotonity, risk of hijacking, loneliness, and long waiting times at border posts. This working environment has been shown to be conducive to their engagement in behaviors that bring about high risks of communicable diseases such as tuberculosis (TB), malaria, HIV, and other sexually transmitted infections (STIs) (Apostolopoulos and Sönmez 2007, Botão et al. 2015, Delany‐Moretlwe et al. 2014, Gomez et al. 2013). For instance, Ramjee and Gouws (2002) report a study on a population of 310 truck drivers in South Africa, 70% of whom had wives or girlfriends in rural areas, 13% used a condom during their last sexual encounter, and 56% was HIV positive. Similar behaviors and high prevalence of communicable diseases in general and STIs in particular are also reported for truck driver populations in India (Pandey et al. 2008, Roa et al. 1997), Brazil (Lacerda et al. 1997, Malta et al. 2006), China (Chen et al. 2006, Wong et al. 2007), the Baltic Region (Kulis et al. 2004), and the USA (Lichtenstein et al. 2008, Solomon et al. 2004, Stratford et al. 2000).
The high prevalence of communicable diseases among sub‐Saharan truck drivers and their sex partners has a dramatic impact on their health and life expectancy (Apostolopoulos and Sönmez 2007, Delany‐Moretlwe et al. 2014, Matovu and Ssebadduka 2012). For example, Wilson (2005) mentions a firm that “lost 39 out of 144 drivers in the last three years.” Moreover, because of their mobility and behaviors, truck drivers have substantially contributed to the spread of HIV and other communicable diseases among the sub‐Saharan population at large (Apostolopoulos and Sönmez 2007, Caldwell et al. 1999, Gomez et al. 2013, Hudson 1996, Laukamm‐Josten et al. 2000, Morris and Ferguson 2006,2007 Ramjee and Gouws 2002). In addition, the disease burden has impoverishing effects on patients, decreases labor productivity of firms, and slows down economic growth (Ahlburg 2000, Sachs and Malaney 2002, Stover and Bollinger 1999).
Delivering prevention, diagnosis, and treatment services to sub‐Saharan truck drivers is considered highly effective to reduce their burden of disease (ILO 2005, Matovu and Ssebadduka 2012, Ramjee and Gouws 2002). Unfortunately, traditional healthcare facilities struggle to provide these services as they are often not easily accessible by trucks, have insufficient parking space, require detours, have long waiting times, and are only open during the day whereas drivers usually stop during the evening (Delany‐Moretlwe et al. 2014, Ferguson and Morris 2007, Ferguson and Morris 2007, Gatignon and Van Wassenhove 2008, ILO 2005, IOM 2003, Ramjee and Gouws 2002).
The non‐governmental organization (NGO) North Star Alliance (North Star) aims to improve the health of the sub‐Saharan truck driver population and roadside communities. It operates 55 Roadside Wellness Centers (RWCs) or “Blue Boxes,” which are easily accessible by truck and located at major truck stops and border crossings along sub‐Saharan Africa’s main transport corridors. The RWCs provide primary care services, behavior change communication, condom distribution, HIV and STI voluntary counseling and testing, screening for TB and malaria, and treatment for HIV, malaria, TB, and STI. Part of these services are provided during outreach sessions at “hotspots” (e.g., parking lots, bars, and brothels).
This study focuses on important managerial network design challenges/ questions that were identified during our collaboration and conversations with North Star and were not addressed in earlier work related to our topic (see Ares et al. 2016, and our discussion below). The first relates to the criteria considered when expanding the network—that is, adding new RWCs. The NGO has so far based location decisions mostly on patient volume, positioning new RWCs where the expected number of patient visits is highest. Because of the long travel times and the relative sparsity of the network of roadside clinics, however, the effectiveness of health service provisioning – the degree to which it improves health–is often hampered by access discontinuities. In other words, travel time gaps between RWCs along a truck route are often too large. Hence, maximizing patient volume solely may not bring maximum gains in health effects for the population. To incorporate effectiveness in future network expansions, it is key to precisely define how it relates to access. Doing so is, however, far from trivial, partly since the relationship differs per health service. Accessibility requirements for “effective” HIV care may differ from those for primary care. Our first research objective is to develop models for health service effectiveness that capture this variety.
Second, North Star has been offering virtually identical health services at all of its RWCs. As indicated, accessibility requirements differ per health service and disease prevalence varies across the network. In view of the scarce financial resources, this suggests that differentiation or centralization of certain service packages may be beneficial. Next to a standard primary care service package, North Star considers to introduce optional service packages. For example, North Star has piloted offering a package of HIV treatment services (see Gomez et al. 2013, Lalla‐Edward et al. 2017). Evidently, potential locations of service packages are determined by locations of new facilities (and current facilities), which makes integrated decision‐making beneficial. Our second research objective is to model and solve the problem of optimizing integrated location and service differentiation choices.
Third, we aim to explore trade‐offs between volume and effectiveness for this problem. How does the present network expansion strategy, which primarily focuses on patient volumes, perform in terms of effectiveness? How would an increased focus on effectiveness affect patient numbers? Answers to these questions form important inputs for strategic choices on objectives (cf. Ferdows and De Meyer 1990). They also fuel discussions with donors, which commonly evaluate impact through volume indicators rather than actual health impacts (Bolton et al. 2007).
Our fourth research objective is to assess the importance of long term network planning. The NGO makes expansion decisions sequentially and has not explicitly accounted for future expansions while doing so. The advantage of this method is its simplicity: advanced solution methods may not be required when choosing locations of few new facilities. On the other hand, the present myopic approach may lead to sub‐optimality in the long run. At present, scientific and practical understanding of this matter is lacking.
Finally, North Star operates in a context where data on truck routes and volumes is scarce and imprecise. Quantification of objectives may also be biased. Impreciseness generally impedes trust in data‐driven decision making (De Vries and Van Wassenhove 2019). Our fifth research objective is to inform decision makers on the magnitude of this risk by assessing robustness of “optimal” location decisions.
We pursue these five objectives by modeling and studying the roadside healthcare facility location problem (RHFLP): Given an existing transportation network and set of RWCs, and a limited expansion budget, where to place additional RWCs, and which service packages should each of the RWCs offer, so as to maximize a weighted sum of health service effectiveness and volume of truck drivers served? We present both analytical and numerical results, using the network of major transport corridors in South‐East Africa as a case study.
Our work is the result of the network design project we started in 2011, together with the NGO and ORTEC Consulting Group. The research presented by Ares et al. (2016) forms a first publication that spun off from this project. They analyze the problem of locating a fixed number of clinics based on the objectives to enhance equity of access to healthcare and to maximize patient volume and effectiveness. Our research advances on Ares et al. (2016) in the first place by distinguishing multiple health service packages and analyzing service differentiation, which motivate research objectives 1 and 2. As our aim is to address key managerial challenges posed to us by practitioners, which deal with volume and effectiveness measures, we especially focus our analyses on these two criteria, and present corresponding extensive trade‐off analyses (see research objective 3). In section 5.8, we turn our attention to equity considerations along the lines of Ares et al. (2016). Our comparison between long‐term and incremental planning approaches and sensitivity analyses on data impreciseness (see research objectives 4 and 5) are also novel contributions. To these purposes, we extend the mixed‐integer linear programming (MILP) formation presented by Ares et al. (2016) and use a more elaborate case study: it incorporates more recent demand data and adds two major truck corridor networks that span eight East African countries.
Our results show that standard software solves real life RHFLP instances within reasonable computation times (<2.5 hours). This is an important finding, given that we prove that RHFLP is strongly
‐hard. We also show that the current practice of selecting locations primarily based on patient volumes may need to be reconsidered. Substantial gains in effectiveness can be made when allowing a small reduction in patient volumes (e.g., +13.3% vs. −1.7% for our baseline case). A third key insight is that solutions are rather robust to various types of data impreciseness. We analyze hundreds of instances in which “true” parameter values differ substantially from assumed values (up to 100%), and show that the resulting optimality gap rarely exceeds 4%. Fourth, we show that long‐term network planning can bring substantial benefits in greenfield situations (up to 7.3% in the instances considered). These benefits tend to disappear when the density of the network increases. Our results suggest the existence of a “tipping point” at which one can switch to consecutive decision‐making without risking substantial suboptimality. This suggests that there is no need to invest in expensive decision support software in such cases, which is again an important finding.
The remainder of this study is organized as follows. Section 2 presents a literature review. In section 3, we present measures of access to health services for mobile patients. A MILP formulation of the location problem and some analytical results are presented in section 4. The results of our numerical experiments are described in section 5. Finally, in section 6 we summarize our findings and present conclusions.
Literature Review
Our work extends the growing literature on operations research applications in global health/public health in low and middle income countries (see Yadav (2010) and White et al. (2011) for reviews). Papers from this field typically deal with the use or allocation of resources that improve health in heavily resource‐constrained contexts. Kraiselburd and Yadav (2013) stress the importance of this field by describing the deficiencies in global health supply chains. The World Health Organization (WHO) also acknowledges the added value these disciplines can have for global health (Royston 2011).
Applications that use facility location models in this context have been reviewed by Daskin and Dean (2004), Rahman and Smith (2000). The authors show that existing models are variants of the set covering model, the maximal covering model, and the P‐median model, which optimize or put constraints on some function of the patients’ distance or travel time to nearby health facilities. The applicability of these models in the context at hand is, however, rather limited. Truck drivers are highly mobile, so that their distance or travel time to a facility is constantly changing. In more recent work, Deo and Sohoni (2015) develop a model for allocating a health service to health clinics, Smith et al. (2009) consider the problem of locating primary healthcare workers, Griffin (2012) constructs strategies to allocate treatments to health centers and populations, and McCoy and Lee (2014) consider the allocation of motorcycle capacity to outreach sites. McCoy and Johnson (2014) investigate how to optimally allocate clinic capacity over time, and explicitly model the impact on HIV treatment adherence. None of these articles, however, considers optimizing access to mobile patients.
Our work is also related to mobile healthcare facility planning problems (see e.g., Doerner et al. 2007, Hachicha et al. 2000, Hodgson et al. 1998), as these problems also consider the time intervals between moments of health service provisioning. These papers, however, consider the optimization of routing decisions whereas we consider location decisions.
Our problem seems to most closely resemble a facility location problem which balances the maximization of the total node demand covered by the facilities with the maximization of the total flow demand covered by the facilities. Such flow represents a collection of truck drivers traveling the same route and demanding a given service. Their “degree of coverage” represents the effectiveness of service provisioning, that is, the resulting improvement in health, which we define as a function of the level of access to the service along the route. Our problem is therefore closely related to flow interception facility location problems (FIFLPs), which have the objective of intercepting demand units on their pre‐planned paths (see Boccia et al. (2009) and Hodgson (1998) for reviews of FIFLPs). Most FIFLPs assume that a demand unit is covered if and only if there exists at least one “conveniently located facility,” such as a facility along its path or within a given distance from its path. The fact that it is beneficial to offer a service at multiple locations along a path makes our problem a multi‐coverage FIFLP. Other than the aforementioned work of Ares et al. (2016), an extensive search yielded only two other multi‐coverage FIFLPs: the billboard location problem (Averbakh and Berman 1996) and the flow refueling location problem (De Vries and Duijzer 2017, Kuby and Lim 2005). Though these problems show much similarity to the RHFLP, it is not possible to directly apply models for these problems to solve the RHFLP. As we will explain in the next sections, we measure the benefits of providing access to facilities by means of a continuous variable which depends on the travel time intervals between adjacent facilities along a route. In contrast, the billboard location problem measures these benefits based on the number of billboards along a route. The flow refueling location problem considers the driving times between adjacent facilities but differs from our problem in that it defines that a fixed amount of benefits are obtained if and only if specified travel time interval constraints are met. For a comprehensive literature review on related facility location problems, we refer to De Vries (2011).
Finally, the closely related paper by Ares et al. (2016) considers the problem of locating a fixed number of roadside clinics using a three‐criteria objective function which considers volume, effectiveness and equity. They propose an advanced column generation algorithm to deal with the computational complexities induced by equity considerations. The model considered in their work differs from our model in that (i) it includes an equity criterion, and (ii) it does not consider service differentiation decisions and the corresponding variety of effectiveness models (their work uses one of the access measures elaborated below, following expert opinion). See section 1 for our discussion on how our work builds and advances upon theirs.
Continuous Access
We collected expert opinion by interviewing ten of North Star’s staff members from the headquarters and regional offices on model objectives and requirements. See Appendix A for interviewee characteristics. Interviewees were added till saturation was reached (Saunders et al. 2017). These interviews confirmed the importance of capturing the relationship between access and effectiveness, and revealed how this relationship varied among diseases.
For some health services, a critical time limit (CTL) exists which defines a time limit for access to healthcare. For instance, providing antimalarial drugs within 24 hours of onset of symptoms is essential for treatment effectiveness (Johnson et al. 2013, Khatib et al. 2013). The dichotomous variable of having access to a health service facility within 24 hours is therefore commonly used as performance indicator (see e.g., Chuma et al. 2009, WHO/UNICEF 2003). A critical time‐limit may also apply to health services that need to be accessed at fixed time‐intervals. One example is directly observed therapy for TB patients, in which a health provider frequently monitors a patient swallowing the required drugs (Volmink and Garner 2007).
For many services, however, responsiveness is less dichotomous. Instead, health impacts of postponing access gradually build up over time. In such cases, a recommended time limit may apply, in addition to a critical time‐limit. Such a distance‐decay relationship has been confirmed in a variety of studies (see e.g., Cooke et al. 2010, McLaren et al. 2014, Tanser et al. 2006), and are common for STIs (see e.g., Meyer‐Weitz et al. 2000, Moses et al. 1994), for which a positive relation exists between treatment delay and disease progression and transmission (Hook et al. 1997).
Thirdly, there are services for which specific time limits are lacking, but improved access is associated with higher utilization, less treatment delay, and improved treatment adherence, which in turn lead to lower mortality and morbidity, less drug resistance, and less disease transmission. Examples include HIV testing and treatment services (De Vries et al. 2014, Mills et al. 2006).
Types of Service Packages
On the basis of the three aforementioned relationships between access and effects, we now propose a classification of service packages in three service package types. The mapping of North Star’s service packages to the three service package types is presented in section 5.1.
CTL. Service packages with a critical time‐limit of access.
This package type corresponds to diseases for which access within a time‐limit from the moment of (self) diagnosis is crucial and to health services that need to be accessed at fixed time‐intervals.
RCTL. Service packages with a recommended time‐limit and a critical time‐limit of access.
This service package type refers to health service packages for diseases for which a recommended time‐limit and a critical time‐limit are well defined, and that are also characterized by a continuous relationship between access and effects.
ASAP. Service packages that are to be accessed as soon as possible when needed.
This last package type corresponds to health service packages for diseases for which there exists a distance‐decay relationship without a clear time‐limit of access.
Access Measures
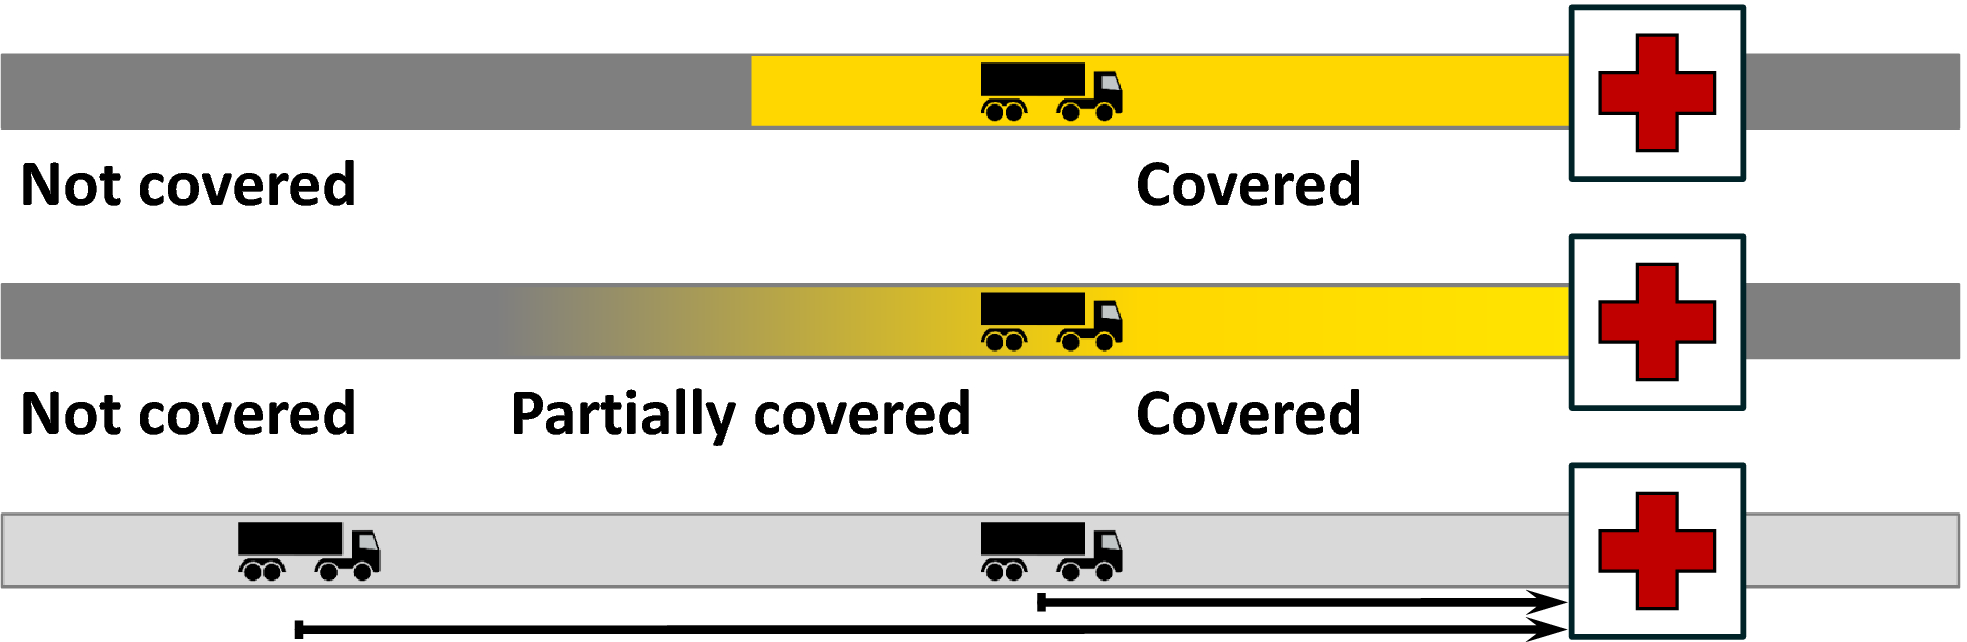
We now propose access measures corresponding to the service package types introduced in the previous section. Following interview results we assume that truck drivers cyclically travel from origin O to destination D and back to origin O (cf. Ferguson and Morris 2007, Orubuloye et al. 1993). Figure illustrates the access measures for part of such a round trip.
Three Ways to Measure Continuity of Access. Upper: time within critical time‐limit (CTL). Middle: time within recommended/critical time‐limit (RCTL). Lower: average value of the access time (ASAP) [Color figure can be viewed at wileyonlinelibrary.com]
The boxes with the cross represent a moment at which some service package s is passed. Let us consider a given moment t during a trip. We define the truck driver’s access time to package s as the travel time to the next facility along his route that offers package s. (Our interviews revealed that returning to a facility the driver already passed is generally not an option.) We refer to a facility that offers package s as a package s location from now on.
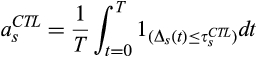
Suppose that service package s is of package type CTL. At a given point in time, we say that a truck driver is “covered” if his access time to package s is at most the critical time‐limit. Obviously, the larger the part of the time‐line the truck driver is covered, the more effective the service provisioning can be. Therefore, we define
, the access measure for a package s that is of package type CTL, as the fraction of time the truck driver is covered (see the upper part of Figure : the truck driver is covered in the light parts of the time‐line). More formally, letting T denote the duration of the round trip,
the critical time‐limit for accessing package s, and
the access time to package s at time t ∈ [0,T], measure
is calculated as:
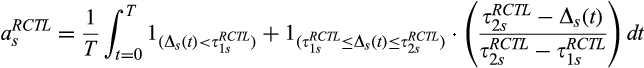
Second, suppose that service package s is of package type RCTL. Now, we say that a truck driver is “covered” if his access time is smaller than the recommended time‐limit, that he is “not covered” if his access time exceeds the critical time‐limit, and that he is “partially covered” otherwise. We assume that the degree of coverage with package s decreases linearly from 1 (covered) to 0 (not covered) as the access time increases from the recommended time‐limit to the critical time‐limit (see the middle part of Figure : the lower the truck driver’s degree of coverage, the darker the shade of grey). Next, we define
, the access measure for a package s that is of package type RCTL, as the average degree of coverage with package s during a trip. Formally, let the recommended time‐limit and the critical time‐limit of access be represented by
and
, respectively. Then
is calculated as:
For later use, we refer to the value of the integral ∫(…)dt in Equation , taken from
to
, as the “effective” time the truck driver is covered during the period
.
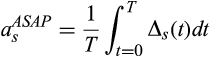
Finally, suppose that the service package is of package type ASAP. Then, for each point of time during the truck driver’s trip, the following holds: the lower the access time, the more effective the health service accessed can be. Based on this observation, we define
, the access measure for a package s of package type ASAP, as the average value of the truck driver’s access time during his trip (i.e., the average length of the arrow in the lower part of Figure ):
One may interpret
as the expected travel time to the next package s location from the moment the truck driver needs this service package.
Model
In this section, we formally model the RHFLP. Some notations are introduced in sections 4.1. and 4.2 models the value of a set of location decisions in terms of volume of truck drivers served and effectiveness of healthcare provision. Next, section 4.3 introduces a MILP formulation of the problem. Finally, section 4.4 provides a worst case analysis with respect to data inaccuracy.
Notation
We model a problem instance by means of a graph G(L,E), where L and E denote a set of vertices and a set of edges connecting these vertices, respectively. Table introduces the notations we use to denote the graph, service packages, demand parameters, decision variables, and auxiliary variables.
Table of Notations
General:
p
Number of roadside health facilities to be newly located
Number of facilities service package s can be newly allocated to
Ω
Set of all feasible solutions
r
Relative importance of the patient volume criterion
1−r
Relative importance of the effectiveness criterion
Network:
KC
Set of current facility locations
KP
Set of potential facility locations
Set of potential locations for package s
K
Set of facility locations: K = KC ∪ KP
O
Set of truck route origins, O ∩ K = ∅
D
Set of truck route destinations, D ∩ K = ∅
L
Set of locations: L = KC ∪ KP ∪ O ∪ D
Q
Set of long distance truck flows
Origin of flow q ∈ Q,
Destination of flow q ∈ Q,
Ordered set of facility locations along the route of flow q ∈ Q,
Parameter indicating whether a current facility at location k offers package s (
)
Or not (
)
Service packages:
S
Set of health service packages
J
Set of service package types j = {CTL,RCTL,ASAP}
Set of service packages that are of service package type j,
Break points of piecewise linear function
Critical time‐limit for accessing package s,
Recommended & critical time‐limit for accessing package s,
Maximal attainable effectiveness per truck driver demanding package s
Demand parameters:
Expected daily patient volume at facility location k
Number of truck drivers in flow q who need service package s
Number of truck drivers in flow q
Fraction of truck drivers in flow q who need service package s
Decision variables:
Auxiliary variables:
Expected daily number of patient visits captured by the facilities in the network
Effectiveness of package s provisioning
Effectiveness score
Effectiveness of health service provisioning per truck driver in flow q demanding service
Package s, given solution ω,
Level of access to package s provided for truck drivers in flow q, given package allocation
Decisions y and the access measure corresponding to the selected service package type j
Here, a truck flow q represents a collection of truck drivers who travel the same long distance route. A route defines a path in the graph, starting from origin
, visiting the ordered set of facility locations
, and ending at destination
. Note that, although
(or
) may physically represent the same location as a facility location
, we regard them as separate locations.
may include potential locations from the set KP as well as locations from the set of locations which are currently already in use, KC. The latter may include facilities operated by other organizations. For instance, if a facility is accessible, and contributes to continuity of access, it can be viewed as being part of the NGO’s network. Finally, we note that allocation of new service packages can be restricted to the newly located facilities only (by setting
) or to any existing or newly located facility (by setting
).
Optimization Criteria
A solution ω = (x,y) ∈ Ω specifies a network of roadside healthcare facilities, including all current and new facilities and their service packages. The network expansion budget allows for placing p new facilities and assigning service package s to
facilities. For a given solution ω, we define the patient volume
as the expected daily number of patient visits captured by the roadside healthcare facilities in this network. Network expansion is commonly preceded by extensive assessments of potential locations in terms of truck volumes, layout of the truck stop, existing healthcare infrastructures, etc. This data can be used to estimate daily patient volumes. This can include visits by truck drivers, as well as sex workers and other roadside communities, which are also target groups for North Star. Hence, letting
denote the daily patient volume at location k, we derive that (cf. Ares et al. 2016):
This definition of
implicitly assumes that the patient volume at a given location is independent of our location decisions.
Let us now quantify for a given solution ω ∈ Ω the effectiveness of health service provisioning. We denote the number of truck drivers in flow q demanding service package s by
. This can be estimated as a package‐specific fraction of the volume of flow q, where the latter can be measured through vehicle tracking data, mobile phone data, and traffic counts. For each of these truck drivers,
represents the effectiveness of service package s provisioning. Then the total effectiveness, that is, the total health improvement – of package s provisioning is defined as (cf. Ares et al. 2016):
We let functions
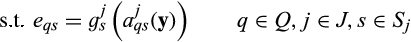
define the relationship between effectiveness and access. More precisely, for package s, we firstly select the most fitting of the three proposed service package types and corresponding access measures. Let j ∈ {CTL,RCTL,ASAP} denote the selected service package type. Furthermore, given package allocation decisions y, let
denote the level of access to package s for flow q, as measured by the access measure corresponding to package type j (see section 3.2). Then, the effectiveness of package s provisioning for truck drivers in flow q is measured as:
These functions
reflect which levels of access are ineffective, partially effective, and effective (cf. Ares et al. 2016). Lacking empirically or theoretically validated alternatives and for ease of modeling, we define
as piecewise linear functions. Figures a and b illustrate these functions. In case that
is to be maximized (i.e., when j ∈ {CTL,RCTL}), we define that
increases linearly from 0 to the maximal attainable effectiveness
when
increases from a given lower bound threshold
(ineffective access) to a given upper bound threshold
(effective access). In case that this variable is to be minimized (i.e., when j = ASAP),
decreases linearly from
to 0 when
increases from the lower bound threshold
(effective access) to the upper bound threshold
(ineffective access). Section 5.1 discusses the calibration of these parameters.
Effectiveness of Package s Provisioning as a Function of
Parameters
can represent the expected health improvement per truck driver demanding service package s due to effective access to this package. This improvement can for instance be expressed in terms of the commonly accepted effectiveness measure of quality‐adjusted life years (QALYs) gained. In practice, obtaining reliable QALY estimates may well be infeasible or too expensive. Reliable QALY estimates are, however, not necessary as long as decision makers can balance the two main optimization criteria. Multiplying
by a given constant does not change optimal location decisions in that case. Consequently, it suffices if
represents relative effectiveness, which is significantly easier to estimate. Moreover,
can also be chosen so as to mimic the strategic objectives of the NGO’s donors, who may have preferences to address certain disease(s). In this case, effectiveness is to be interpreted as the extent to which the service provisioning increases weighted health improvements, where the weights represent donor preferences.
For later use, we represent the total effectiveness of health service provisioning by
, and refer to this variable as the effectiveness score:
MILP Formulation
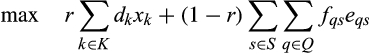
The measures presented in section 4.2 allow us to introduce the following problem formulation, which we refer to as the Roadside Healthcare Facility Location Problem (RHFLP). Here, parameters r ∈ [0,1] and (1−r) ∈ [0,1] capture the relative importance of the patient volume criterion and the effectiveness criterion, respectively:
The objective function (8) maximizes a weighted sum of
and
. Constraints (10) and (11) specify the number of new facilities and the number of service packages s to be allocated to potential facility locations. Note that these constraints could easily be replaced by a more general budget constraint, restricting the costs of network expansions. Constraints (12) define that a service package can only be allocated to facility location k if a health facility is located there. The current network of health facilities is described in constraints (13) and (14). Constraints (15) define our decision variables as binary variables. Effectiveness variables
The nonlinearity of these Equations makes a mixed‐integer nonlinear programming (MINLP) model, which is generally very hard to solve. In Appendix B, we show how this model can be non‐trivially transformed into a mixed integer linear programming (MILP) model. Specifically, it suffices to replace Equations by constraints (20)–(23) and (25)–(39). We also prove that the vast majority of the binary variables needed to perform this transformation can be relaxed to continuous variables, since the corresponding constraint matrix is totally unimodular (TU). This substantially decreases the model complexity.
In Online Appendix D, we prove the following by reduction from the problem CLIQUE:
The RHFLP, as formulated by (8)–(15), is strongly
‐hard, even in case that |S| = 1.
Compared to the model presented by Ares et al. (2016), model (8)–(15) has a simplified objective function (8), as it disregards equity. Section 5.8 discusses how this criterion can be added to model (8)–(15). At the same time, constraint (9) At the same time, constraint (9) now captures three instead of one effectiveness modalities, allowing for the introduction of service package differentiation, as expressed in constraints (11), (12), and (14). Constraints (20)–(39) in Appendix B form the non‐trivial linearization of (9). See section 1 for our discussion on contributions of both papers.
Worst‐case Effect of Imprecise Input Data
Parameters
, the number of truck drivers in flow q who need package s, and
, the expected daily patient volume at location k tend to be imprecise in the data‐scarce environment North Star operates in. Though this does not affect the feasible solution space, it may affect the value of a solution and thereby induce an optimality gap.
Proposition provides an upper bound on this gap (see Online Appendix E for the proof). Here,
denotes the true optimal solution and
the optimal solution based on the presently used parameter values. We denote the value function using the true parameters by
, and the value function using the presently used parameters by
. For instance,
denotes the value of the solution
in case that the true parameter values were used.
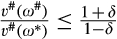
If the true values of
and
deviate at most by a fraction δ from the presently used parameter values, then
. This bound is tight.
To illustrate this bound, let δ be equal to 0.1. Then in the worst case, the true value of
is about 18% lower than the true value of
. As this bound is only attained with equality under three very specific circumstances (see Online Appendix E), section 5.5 investigates realistic levels of sensitivity by means of a real life case study.
Let us now analyze the optimal solution’s sensitivity with respect to the parameters
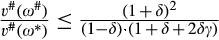
, the maximal attainable effectiveness of package s provisioning, and parameters r and 1−r, the relative values of the patient volume criterion and the effectiveness criterion, respectively. Suppose that there exists an “optimal” value of these parameters. For example, optimal values could be those values yielding the largest health improvement. As it is very difficult to identify these values, it is likely that the chosen parameter values deviate from them. An upper bound on the resulting optimality gap is given in Proposition (see Online Appendix F for the proof). Here,
and γ denotes some instance‐dependent constant between 0 and 1.
If the “optimal” values of
deviate at most a fraction δ from the presently used parameter values, then
. This bound is tight.
For example, if γ = 0.5 and δ = 0.1, then in the worst case, the optimality gap is at most 11%.
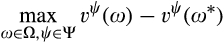
It is easy to see that, in the worst case, the true value of a given parameter is either the fraction δ larger or the fraction δ smaller than the presently used values. Let an extreme realization of the parameters of interest be represented by ψ ∈ Ψ, and let
denote the resulting value function. An instance‐specific bound can be found by solving the following problem, as we do in section 5.5:
Numerical Analysis
This section illustrates how our model can be used for strategic planning and reveals practical insights for decision makers. We use CPLEX 12.6.2 to solve our MILP model, on a PC with a 3.4 AMD A4‐5300 processor and 8 GB RAM.
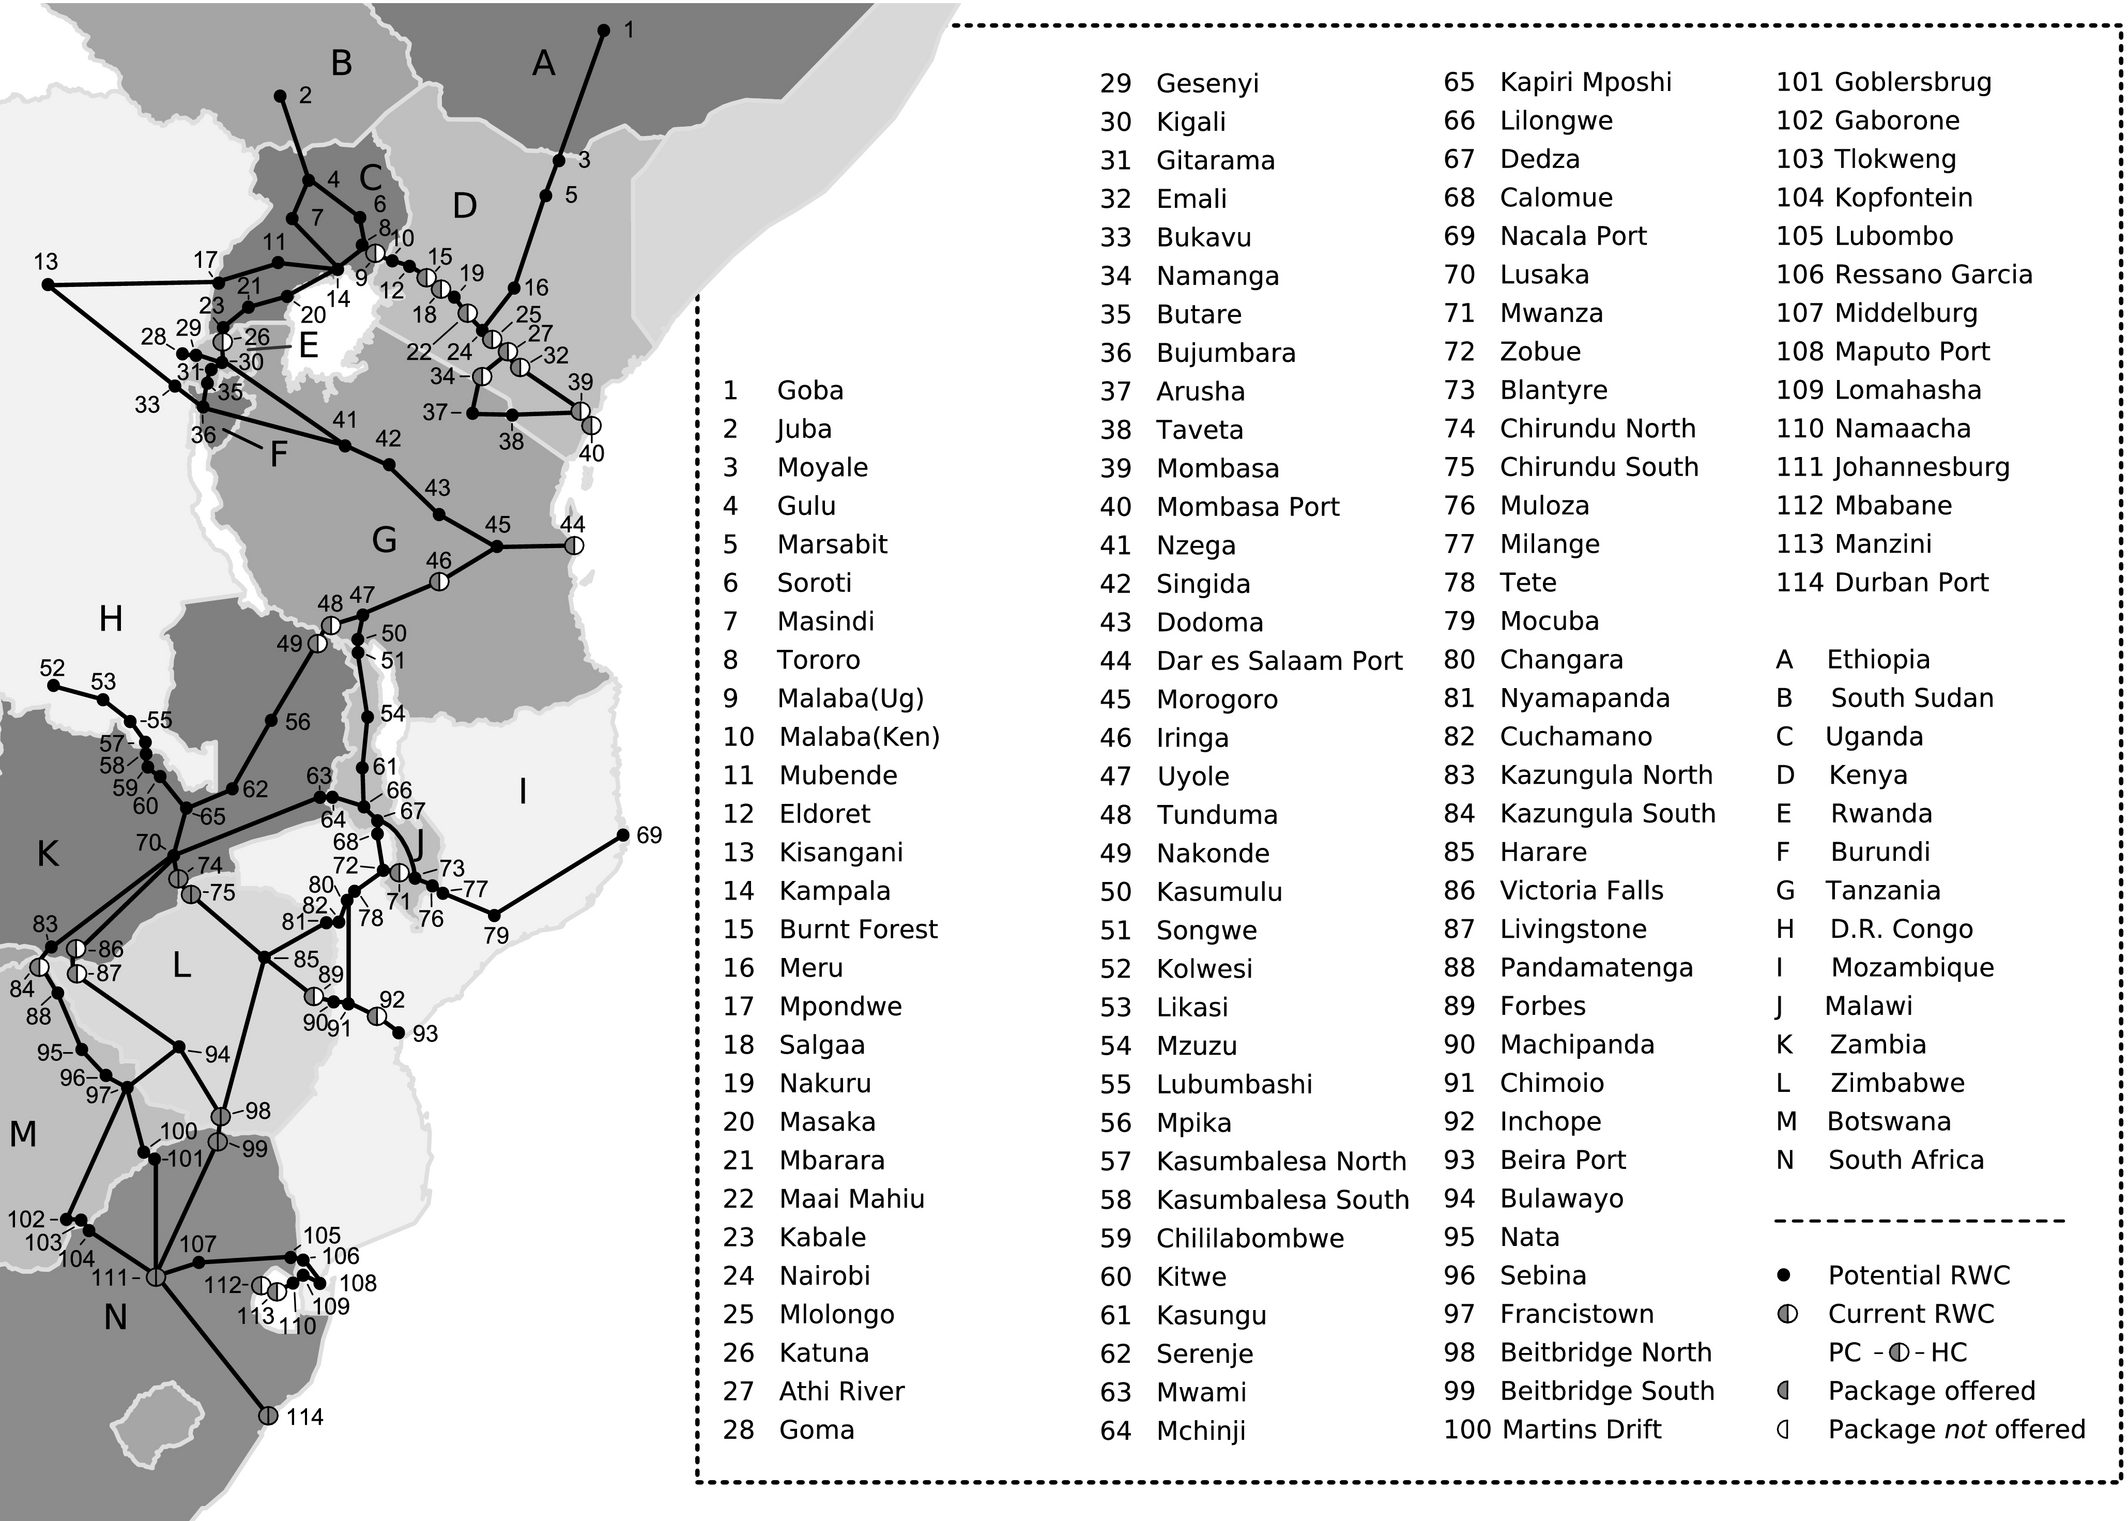
South‐East Africa Case
We base our baseline case on the network of major transport corridors in South‐East Africa. This network of roads spans 14 sub‐Saharan countries and connects the main ports in the region with the main inland cities and other areas of economic importance such as the copper belt in the DRC. It consists of three subsets of corridors: (i) the North‐South Corridor, which spans the region from Tanzania to South Africa, (ii) the Central Corridor, which runs from the port of Dar es Salaam (Tanzania) into Burundi, Rwanda, and the DRC, and (iii) the Northern Corridor, which connects the port of Mombasa (Kenya) with landlocked countries lying east and north of Kenya. Figure depicts the corridor network as a graph consisting of the 29 RWCs North Star operated in this network at the time our case study was finalized (August 2016) and 85 potential RWC locations.
Map of the South‐East African Transport Corridor Network
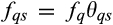
The case study data sources are summarized in Table and a full description of the data is provided in Online Appendix I. In line with package allocation choices currently faced by North Star, we choose the primary care (PC) package to be a standard service package and the HIV care (HC) package to be the only optional service package. Hence, in the baseline case, S = {PC,HC}. The data sources identify 95 major truck flows, and their health service needs are calculated as
. Here,
and
denote the number of truck drivers in flow q and the fraction of truck drivers in flow q who need service package s, respectively. For truck flows making use of the Northern and the Central Corridor, estimates of
were obtained from inter‐country cargo volumes presented by by Nathan Associates Inc (2011) and Berger (2011), respectively. For the North–South Corridor, we use least squares optimization to fit
to annual average daily truck volume (AADT) estimates (
), which Odoki and Anyala (2014) provide for most arcs in the network, and to a “target matrix” describing road‐based inter‐country cargo volumes (
), as presented by the SADC (2012). The use of such a target matrix is a common way to deal with the limitations of OD matrix estimation methods (Peterson 2007). We choose
, reflecting the assumption that every truck driver has a potential need for primary care, and estimate
as 1.41 times the average of the adult HIV prevalence in the flow’s origin country and the prevalence in the flow’s destination country. The multiplier 1.41 reflects the difference between the prevalence levels in the general population and the truck driver population, and is based on data for South Africa and Mozambique (see Online Appendix I). A truck flow is assumed to take the shortest route from origin to destination.
North Star (via partner organizations), TTCA (2015), Odoki and Anyala (2014), JICA (2013, 2010), SADC (2012),Ranganathan and Foster (2011), Nathan Associates Inc. (2011), Berger (2011), Teravaninthorn and Raballand (2009)
WHO (2016), Botão et al. (2015), Delany‐Moretlwe et al. (2014)
Online Appendix I
Finally, we use least squares optimization to fit the relationship between truck volume along current RWC locations
and daily patient volume at these locations
. This yields the following estimation method for patient volume at potential RWC locations:
.
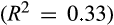
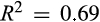
Our calibration of the relationship between access and effectiveness is based on structured expert surveys. Specifically, we asked two experts from North Star to quantify the relative importance w(s) of the two service packages s, to connect to each service package a corresponding package type, yielding
, and to assign scores to 10 configurations of RWCs offering the PC package along an imaginary truck route and to 10 configurations of RWCs offering the HC package along an imaginary truck route. The functions
providing the best fit to these scores are determined by least squares optimization (
for PC,
for HC). The resulting parameter values are given in Table , and the survey we used for the PC package can be found in Online Appendix J.
Parameters Describing the Relationship Between Access and Effectiveness of Package s Provisioning
Package s
Service package type j
Service package type parameters (days)
PC
RCTL
0.09
1.00
1·σ
HC
ASAP
0.40
5.48
2·σ
MC
CTL
0.50
0.90
5·σ
TC
RCTL
0.50
0.90
2·σ
SC
RCTL
0.50
0.90
1·σ
Note
The TC, SC, and MC packages are only used in section 5.7. W.l.o.g. we set scaling factor σ = 1/25
When asked to elaborate on their service type allocation—PC to the RCTL type and HC to the ASAP type—the experts made references to the criticality of corresponding health services, the aforementioned distance decay relationship, and the benefits of repeatedly passing a health facility:
Expert 1 about truck drivers accessing the PC package (translated): Generally, the people do not go to the clinic for nothing. Certainly not the truck drivers. They have a problem that builds up till a certain critical level. Then they decide to come, and if they cannot access a clinic within two days, they have a very big problem.
Expert 2 about the benefits of continuous access to the HC package (translated): One is biomedical, two is psychological—a sense of urgency among the patients—(…) and there is a third (…) the power of repetition is in that, if he thinks “should I do it or not” [go to a clinic] (…) the third time [he passes a clinic] he thinks “oh no, now I’m gonna do it” (…). So when it comes to HIV, you never have too many [clinics].
Expert 1 about the time criticality of the HC package (translated): The problem evolves rather gradually. Problems arise when they run out of medication. Then you got a problem… then you need to come (…). When they get an opportunistic infection (…) it builds up rather slowly.
Experience suggests that decision makers will vary the parameter r in the software package we developed (see North Star Alliance 2011) until one or more satisfactory solutions are obtained. This is essentially a basic way to calibrate parameter r. We initially assume that decision makers can identify the “optimal” value. Sensitivity towards this assumption is analyzed in section 5.6. Under this assumption, it suffices that parameters
represent the relative importance of the different service packages (i.e., the scaling of these parameters does not matter).
The service package type allocation obtained from the expert surveys—PC to the RCTL package type and HC to the ASAP package type—is largely influenced by the time criticality of the corresponding health services, the aforementioned distance decay relationship, and the benefits of repeatedly passing a health facility, as reflected by the quotes in section 3.
We finally note that the parameterization for HC is much more conservative than the requirement of facilitating monthly or bimonthly follow‐up visits for drivers under HIV treatment.
Network Expansion Strategies
Based on the parameter values from the baseline case, we optimize locations of 4 new RWCs and the allocation of the HC package among two established RWCs (i.e.,
,
), which represents a realistic network expansion scenario. We analyze two network expansion strategies, characterized by the parameter r. The first strategy is the “balanced strategy,” which we model by setting r = 0.5. Many Pareto efficient solutions that balance both objectives are found around this value, as we show in section 5.3. The second investment strategy reflects the strategy North Star had been employing before this research was implemented. The main focus of this strategy was put on maximizing the patient volume served, which we mimic by setting r = 1.0. We refer to this strategy as the “patient volume strategy.” Finally, we also consider the case in which we not only locate new RWCs and service packages, but also allow current clinics to be relocated. Here, we again use r = 0.5.
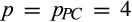
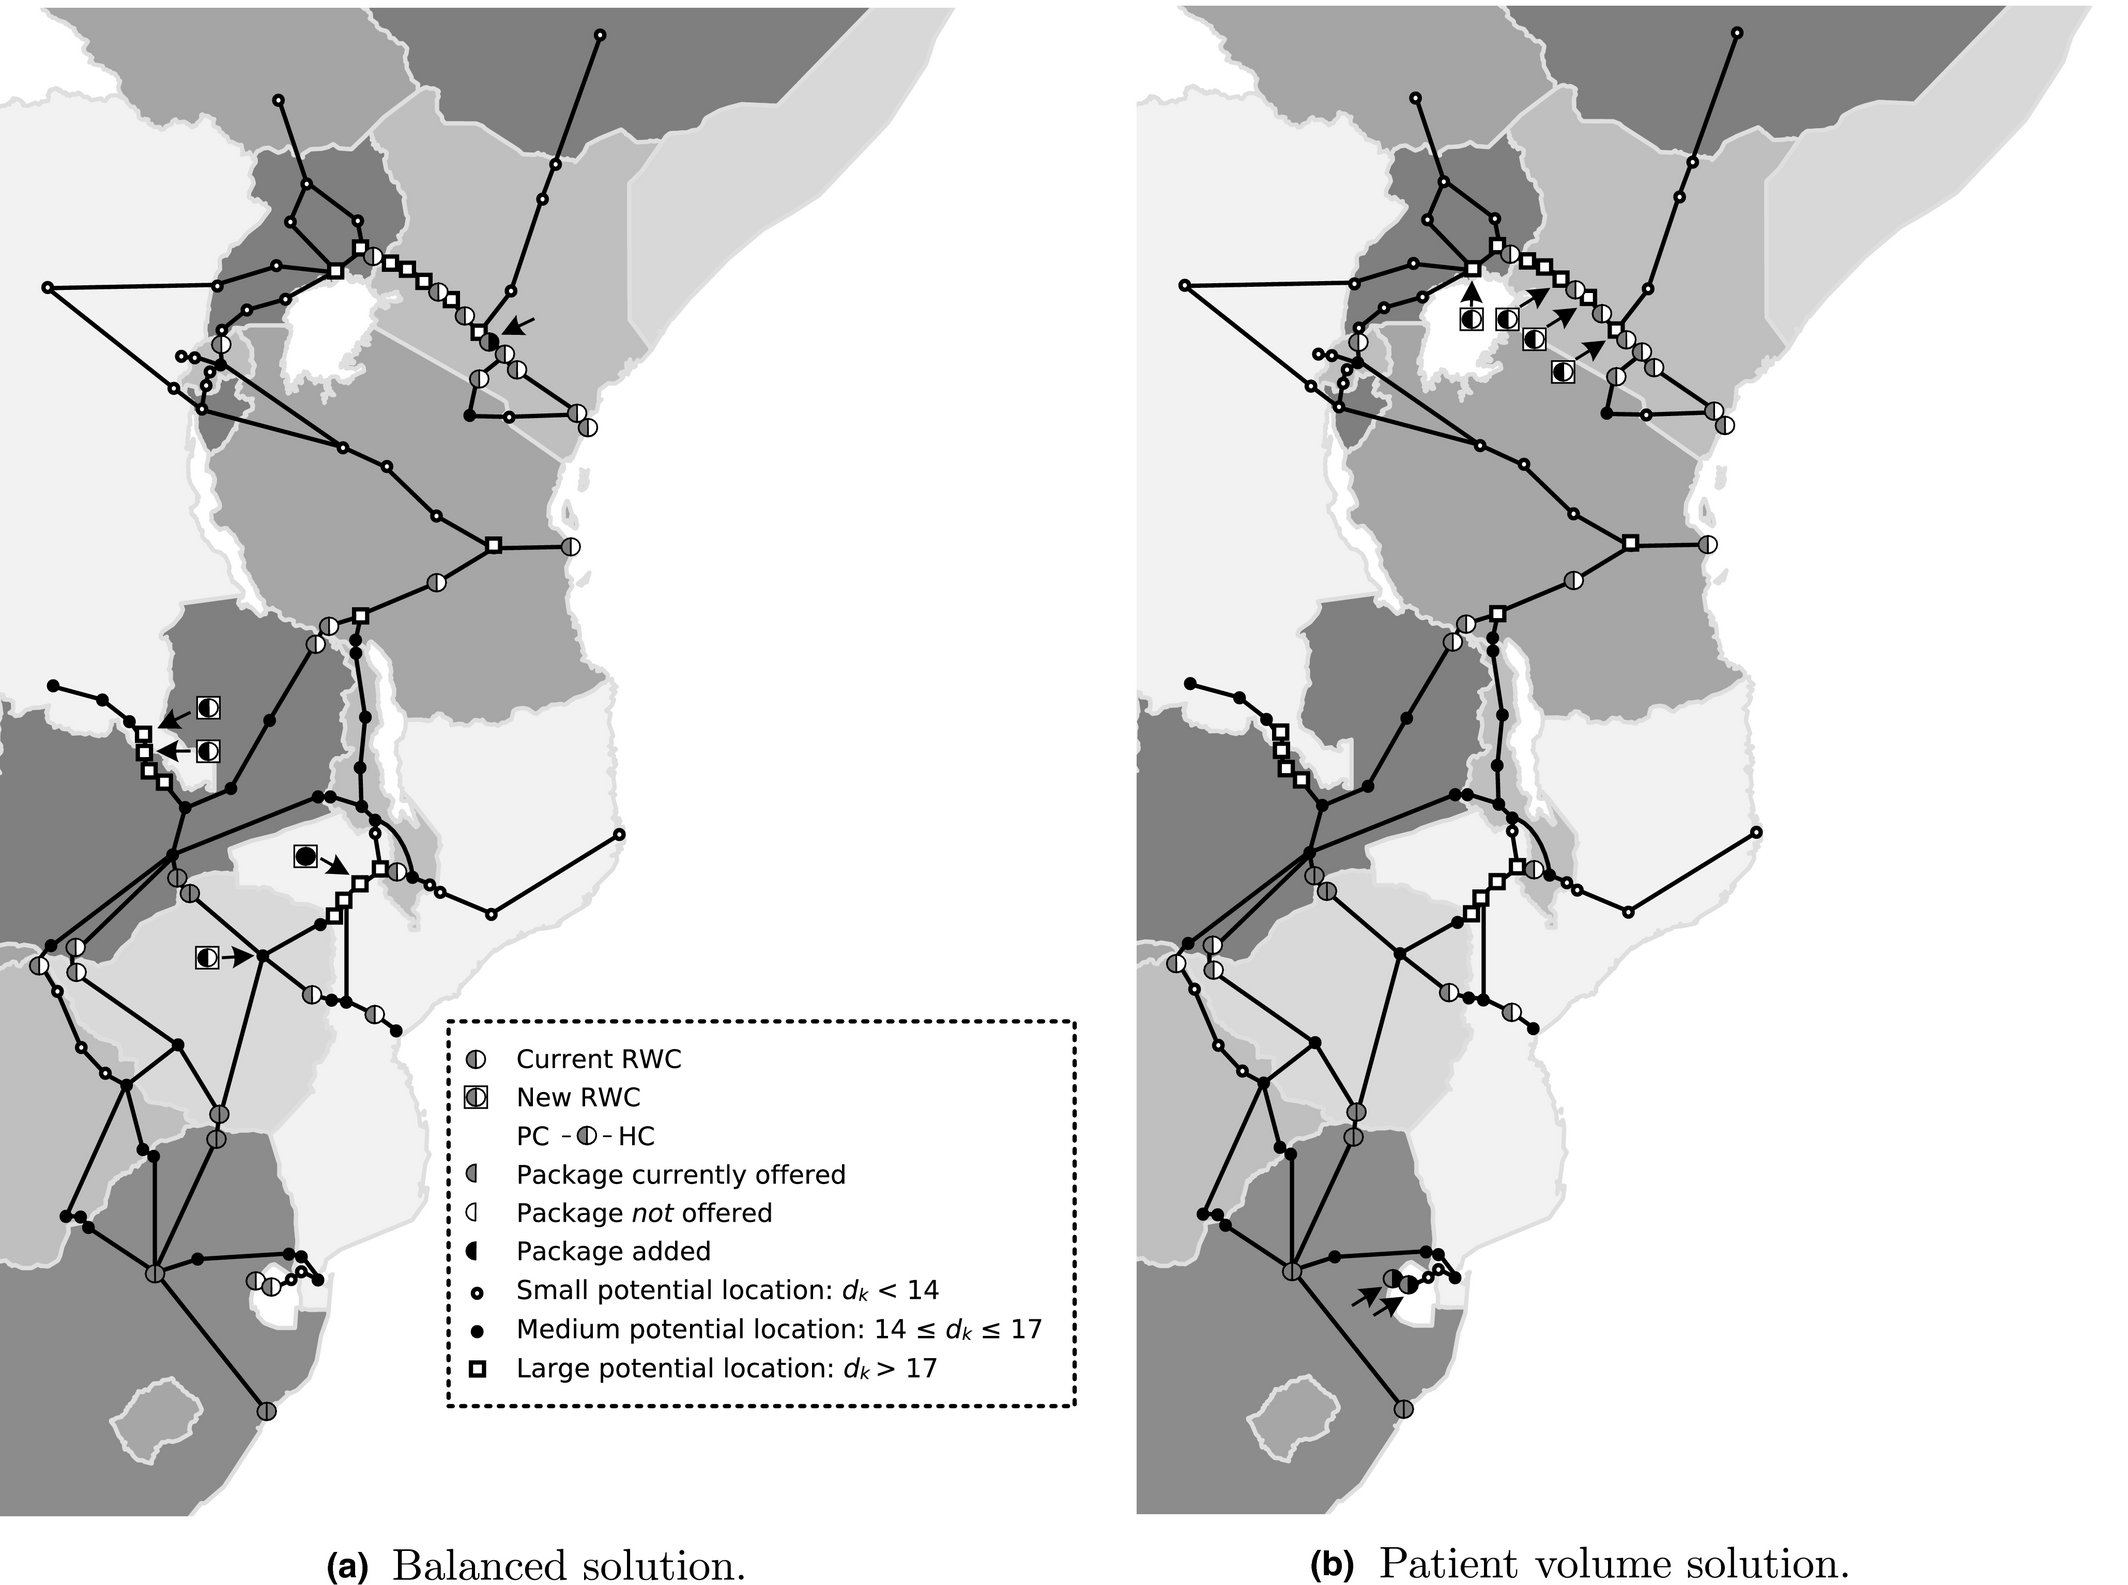
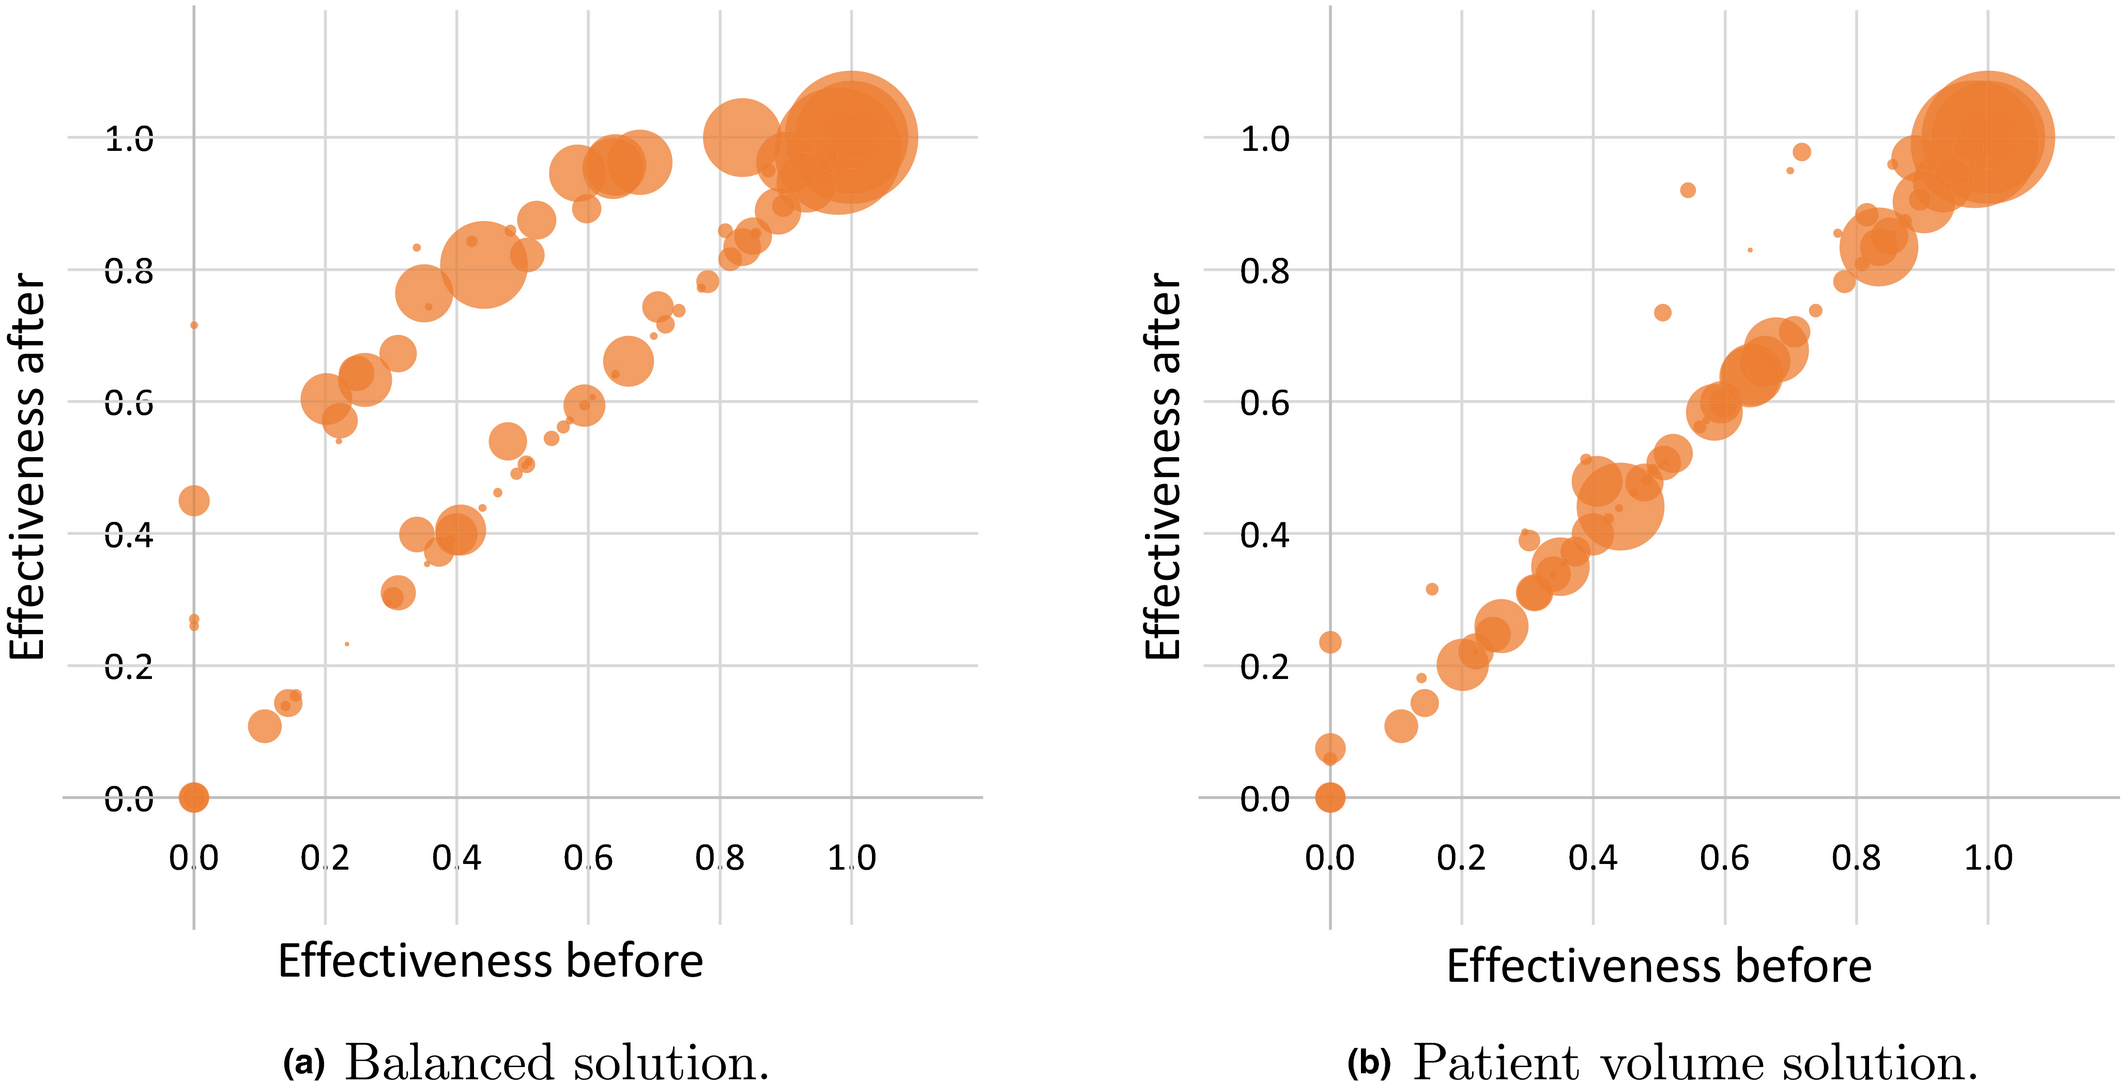
Figures a and b and Table describe the optimal solutions yielded by the balanced strategy and the patient volume strategy. We see that the “balanced solution” results in a relatively lower expected daily patient volume (5.3% points lower) but also in a substantially higher effectiveness (14.5% and 42.6% points higher for PC and HC, respectively). The latter is illustrated by the bubble plots in Figures a and b, which depict the solutions’ impact on the effectiveness of package PC provisioning for the 95 truck flows separately. The reason is that the patient volume solution places RWCs in the busiest parts of the network, which are already well‐served by current RWCs (see Figure b). The balanced strategy, instead, yields locations that fill up gaps in the RWC network. For example, Figure shows how the new RWCs improve the degrees of coverage with the PC package during trips along the routes connecting the ports of Durban, Beira, Nacala, and Dar es Salaam with the copper belt (Kolwesi, DRC).
Optimal Location Decisions for the Baseline Case
Effectiveness of Package PC Provisioning for the 95 Truck Flows before and after Implementing the Balanced Solution and the Patient Volume Solution. A Bubble’s Size Reflects the Number of Truck Drivers in the Corresponding Flow [Color figure can be viewed at wileyonlinelibrary.com]
Degree of Coverage (see section 3.2) with the PC Package before and after Locating the New RWCs at each Point of Time During a Trip from a Major Regional Ports (Durban, Beira, Nacala, and Dar es Salaam) to the Copper Belt (Kolwesi, DRC). The numbers Correspond to the Location Numbers Introduced in Figure 3 [Color figure can be viewed at wileyonlinelibrary.com]
Daily Patient Volume (
), Effectiveness of Primary Care Provisioning (
), and Effectiveness of HIV Care Provisioning (
) in the Initial Network, the Networks Obtained by the Balanced Strategy and the Patient Volume Strategy, and in the Redesigned Network
Solution
Initial
562
19 840
1646
Balanced
632
(12.3%)
22 964
(15.7%)
2353
(43.0%)
Patient volume
662
(17.6%)
20 070
(1.2%)
1652
(0.4%)
Redesigned
682
(21.2%)
24 342
(22.7%)
2673
(62.4%)
Note
The percentage improvement with respect to the initial network is given between brackets.
The optimal network obtained when relocation of clinics is allowed moves 17 of the current 29 clinics and all of the 6 current HC packages to a different location. Compared to the case when relocation is not allowed, this significantly increases patient volume (8.9% point increase) and the effectiveness of PC provisioning (7.0% point increase) and HC provisioning (19.4% point increase). This provides a strong argument for critically assessing the fitness of the current network.
Finally, the optimal solutions illustrate an important property of the RHFLP: adding a given package to multiple locations can bring about synergy effects. For instance, when adding the PC package to Kasumbalesa North or to Kasumbalesa South only, the effectiveness of package PC provisioning to truck flow Nacala Port ‐ Kolwesi increases by 0.09, whereas it increases by 0.27 if this package is added to both locations. This is a direct implication of the assumption that a certain level of access is required before this translates into a strictly positive level of effectiveness. These effects suggest that long‐term network planning instead of making location decisions consecutively can be beneficial, as we further explore in section 5.4.
Importance of Balancing Patient Volume and Effectiveness
Let us analyze the trade‐off between the two main objectives in some more detail now. Figure summarizes the results when solving the RHFLP for the baseline case with the number of facilities (with PC packages) to be placed p ∈ {2,4,8,12,…,44,48,50}, the number of HC packages to be allocated
, and relative importance parameter r ∈ {0.0,0.1,…,1.0}. All other parameters are kept as before.
Pareto Curves for Various Values of p, with
The results show that focusing solely on one criterion—that is, choosing r = 0.0 or r = 1.0—results in significant sub‐optimality in terms of the other criterion. When also assigning some weight to the other criterion, large gains in effectiveness (patient volume) can be made at a marginal loss in patient volume (effectiveness). The “irregular behavior” of the effectiveness score for r = 1.0 (i.e., the lowest point of each curve) is caused by the indifference on where to place the HC package, leading to more or less random package allocation decisions.
Importance of Network Planning
To assess the added value of long term network planning over consecutive decision making, we now calculate for the baseline case the optimality gap when locating clinics one at a time for p ∈ {2,4,…,50} and
. Specifically, we allocate a clinic to the potential location for which the objective value increase is largest till p clinics are added. The first
clinics that are located also offer package HC and parameter r again equals 0.5.
The results show that consecutive decision‐making yields near‐optimal location decisions: the optimality gap does not exceed 0.28%. This seems surprising, given the earlier observation that network planning allows for a better exploitation of synergy effects. We note, however, that such effects are only attainable for a given truck flow when its current level of access is lower than the “access threshold”: the level of access required for a strictly positive level of effectiveness (e.g.,
). In the baseline case, this applies to few truck flows.
We hence argue that network planning is mostly beneficial when the network of clinics is still small and/or when relatively many clinics are required to exceed the access threshold. To assess this, we calculate the optimality gap for consecutive decision making when no clinics are presently in the network and when
and
. Two subcases are considered: one where all parameters are assigned their baseline value and one where access threshold
is increased to 0.50 (baseline value: 0.09). We refer to the corresponding solutions as “greenfield baseline” and “greenfield synergistic.”
Table describes the results, which confirm our hypothesis. Consecutive decision making can substantially underperform in greenfield situations, in particular when the access threshold is large. The effectiveness increase attainable when locating a single clinic is comparatively small in such cases, so that location decisions are mostly determined by patient volumes. As a consequence, the solutions perform well in terms of patient volume, but weakly exploit possible gains in effectiveness.
Optimality Gap (%) for Consecutive Decision Making in a Greenfield Situation; Overall and for Separate Objectives
Solution
Opt. gap (%)
Gap (%)
Gap
(%)
Gap
(%)
Greenfield baseline
1.3
−0.1
1.4
3.2
Greenfield synergistic
7.3
−15.2
17.6
10.0
These observations suggest the existence of a tipping point: a point at which most of the synergy effects have been obtained and from which one can switch to consecutive decision making without risking substantial suboptimality. To further investigate this, we analyze the optimality gap when switching to consecutive decision making, depending on the density of the network. Specifically, we again consider the greenfield synergistic situation and p = 20. We perform network planning in the startup phase, corresponding to
clinics. Next, we switch to consecutive decision making for the remaining
clinics. Figure shows the resulting optimality gaps.
Blue: Optimality Gap when Performing Network Planning for the First
Clinics and Applying Consecutive Decision‐Making for the Remaining
Clinics. Orange: The Percentage of Truck Drivers for which the Access Threshold was not Attained after the First
Clinics were Placed [Color figure can be viewed at wileyonlinelibrary.com]
The results show that the optimality gap drops to almost 0% when
exceeds 16. Switching to consecutive decision making before that can induce a serious optimality gap of up to 7.7%. The percentage of truck drivers for which the access threshold is not met indeed serves as an indicator of this tipping point. For example substantial optimality gaps are attained while this percentage exceeds 20% for the PC package, whereas (near‐)optimality is attained as this percentage approaches zero.
Sensitivity Analysis on Demand Parameters
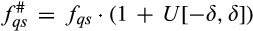
Proposition proves worst‐case bounds for the optimality gap induced by impreciseness in the demand parameters
and
. To gain insight into the actual sensitivity, we randomly generate the “true” values of the parameters in the baseline case, and determine the resulting optimality gap for the balanced solution (see section 5.1) expressed as a percentage of the “true” optimal solution value. Specifically, we draw for each of these parameters from the uniform distribution on the interval [−δ,δ], represented by U[−δ,δ], and determine the true values of
and
as
and
. We test different values of δ, and generate 50 demand scenarios for each of them. Table shows for each value of δ the resulting average optimality gap, the maximum optimality gap, the non‐parametric worst case bound on this gap (which is not tight for our specific instance) and the tight parametric bound. The latter is obtained by solving a MILP formulation of the problem defined in Equation .
Optimality Gap (%) by Imprecise Demand Data
δ
Optimality gap
0.2
0.4
0.6
0.8
1.0
Avg. (%)
0.2
0.5
0.9
1.6
1.7
Max. (%)
0.5
1.2
2.7
2.9
3.8
Worst case par. (%)
2.5
4.2
10.7
26.6
36.9
Worst case nonpar. (%)
33.3
57.1
75.0
88.9
100.0
Note
Worst Case Par.: tight bound found by solving (16). Worst Case Nonpar.: non‐tight bound provided by Proposition .
The results indicate that the optimal solution is highly insensitive to impreciseness. Even when the true values of the demand parameters deviate by up to 100% from the presently used values, the maximum optimality gap attained in the 50 demand scenarios is only 3.8%. This can be explained by the fact that near‐optimal solutions tend to locate facilities along the busiest truck routes and at the busiest truck stops. The location decisions in these solutions therefore tend to overlap considerably. As implied by the proof of Proposition (see Online Appendix E)), the effects of impreciseness are strongly correlated for such overlapping solutions, thus reducing the maximum optimality gap.
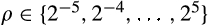
Sensitivity Analysis on Model Parameters
As argued, setting “optimal” values for r and
is challenging, which begs to question the impact of impreciseness. Figure a depicts the optimality gap when using r = 0.5 while the optimal value
differs, expressed as a percentage of the “true” optimal solution value. We consider
. Similarly, Figure b depicts the optimality gap when the optimal ratio
is a factor
times the presently used ratio 2. Specifically, we analyze the impact of using
instead of the optimal value
.
Optimality Gap (%) When Using Baseline Parameter Values for r and the Relative Importance of Service Packages Instead of the “Real” Values
The results show that solution values are very robust with respect to impreciseness in r and
. Up to a substantial level of impreciseness in r, the optimality gap remains below 1.5%. For
, the optimality gap does not exceed 1.0%.
Selecting the “true” package type to a given package s may be subject to errors as well, as understanding of access requirements is still in early stages of development. We therefore assess the potential impact of assigning the “wrong” package type to package PC. For each package type j ∈ J, we determine the parameters of function
providing the best fit to the assigned network scores (see section 5.1). Next, we assess the optimality gap when choosing package type j while the “true” package type is
. To assess the impact of building a substantial network with a “wrong” package type choice, we analyze this for the baseline case with
and
.
Table summarizes results, which show that selecting a wrong package type can induce an optimality gap of up to approximately one percent for the case considered. This on the one hand makes it beneficial to adequately assess the package type, but on the other hand suggests that solution values are rather robust with respect to wrong package type choices. For example, applying the three functions to the 10 configurations of RWCs included in the survey yields rather similar function values (see Online Appendix G).
Optimality Gap (%) When Choosing Package type j While the “true” Package type is j#
Selected package type j
CTL
RCTL
ASAP
CTL
x
0.33
0.43
RCTL
0.25
x
0.40
ASAP
0.98
0.18
x
Model Statistics
Table describes the solution times and model statistics of 12 problem instances. The problem instances are defined by the number of truck flows (55 or 95), the number of different service packages (2 or 5), and the structure of the network (baseline, dense, or sparse). The three additional service packages are: tuberculosis care (TC), STI care (SC), and malaria care (MC). Table shows the definitions of the corresponding effectiveness variables. The fractions of truck drivers who need these packages were again estimated based on data from the global health data repository (WHO 2016) and are provided in Online Appendix I. The sparse network is generated by selecting the minimum spanning tree of our graph G(L,E), and the dense network is generated by adding for each vertex two imaginary edges that connect this vertex with the two closest neighbor vertices it was not connected to in the baseline network. We generate the time needed to traverse such imaginary edge by dividing the Euclidian distance of the edge by the average speed of 40 km/hour. For both alternative network structures, we determine the shortest origin‐destination routes. All other parameters are kept as before.
Model Statistics for 12 Problem Instances
Instance
|Q|
|S|
Structure
Variables (Integer)
Constraints
LP gap (%)
CPU (sec.)
D55
55
2
Dense
5679 (558)
2933
0.5
0.6
D95
95
2
Dense
9123 (798)
4825
0.5
0.7
B55
55
2
Baseline
9769 (558)
3625
2.2
7.8
B95
95
2
Baseline
15871 (798)
5977
1.8
4.2
S55
55
2
Sparse
13725 (558)
4109
3.0
19.5
S95
95
2
Sparse
22 665 (798)
6837
3.3
73.7
D55e
55
5
Dense
14 196 (1395)
7502
4.9
60.4
D95e
95
5
Dense
22 806 (1995)
12 232
5.2
91.3
B55e
55
5
Baseline
24 421 (1395)
9232
8.2
274.4
B95e
95
5
Baseline
39 676 (1995)
15 112
8.6
364.5
S55e
55
5
Sparse
34 311 (1395)
10 442
11.2
3577.9
S95e
95
5
Sparse
56 661 (1995)
17 262
11.7
7868.0
We observe that the CPU time needed to solve an instance tends to grow rapidly when |Q| increases, when |S| increases, and when the network becomes sparser. This is well explained by the observations that, in each of these cases, the number of variables and constraints increase and the LP relaxation of the MILP becomes weaker, which tends to negatively impact the performance of a branch‐and‐bound algorithm. Note that sparser networks bring about many additional variables in Equation and additional constraints in Equations -, because the number of RWC locations along a route,
, tends to increase when the network gets sparser.
Incorporating Equity
The presented MILP model could be extended to include equity of access to healthcare as an additional objective along the lines of Ares et al. (2016). Their paper proposes to take a weighted sum of pairwise absolute differences in effectiveness between different truck flows as a measure of equity. As effectiveness is calculated for each service package in our context, we propose to additionally sum the equity terms over the packages. Specifically, letting
denote our initial objective function, as defined in Equation , and
the importance of the equity term, we propose the following objective function:
where
. Here,
denotes a scaling factor, which we set equal to
in our experiments. Furthermore,
and
, so that
represents the absolute difference between
and
. This relationship is enforced by adding the following constraints to the MILP:
To analyze sensitivity of optimal solutions towards equity, we assess the trade‐off between
and
. Specifically, we repeat the numerical experiments from section 5.3 with r = 0.5 and
. Figure depicts the results. Note that
represents the situation in which no differences in effectiveness between truck routes exist. As a first observation, the equity criterion is quite aligned with the other objectives while p < 16. For the short term, improvements in equity hence seem to be a matter of making the network grow rather than assigning importance to this criterion. For the longer term, substantial gains in equity can be made at a marginal loss in the other criteria, which is in line with the findings of Ares et al. (2016). On average, moving from
to
increases
by 25.3% and decreases
by 0.3% only. This provides a strong argument for incorporating equity in future facility location and package allocation decisions.
Pareto Curves for
vs.
for Various Values of p, with
To assess the impact of incorporating equity on computation times, we repeat the numerical experiments from section 5.7, using
. Results are provided in Online Appendix H. Interestingly, despite the fact that the number of constraints and linear variables approximately doubled and the LP gap in the root node is much larger, solution times remain relatively low (up to 1161 sec.). This is in line with findings by Ares et al. (2016), who show that solving their similar MILP only gets challenging for very large networks.
Discussion and Conclusions
This study considers the design problems arising when developing an integrated network of roadside healthcare facilities to meet health service needs of truck drivers, as operated by NGO North Star Alliance. More specifically we consider the problem of choosing optimal locations for clinics that are added to the existing network, and allocating service packages to clinics. The optimization considers two criteria: the number of truck drivers served and the effectiveness of the service delivery to the population served. We model the latter criterion through three novel access measures.
The resulting optimization problem differs from previously studied healthcare facility location problems, which typically assume patients to be static instead of mobile. This study develops a mixed‐integer linear programming model which captures the three access measures. This model has been implemented in a software package called POLARIS and installed at headquarters (North Star Alliance 2011). We also present computational analyses and address prominent managerial questions and challenges, using the network of major transport corridors in South‐East Africa as a case study.
One such question deals with the suitability of heuristic approaches to make network design decisions. North Star NGO has predominantly made such decisions based on the first objective: maximize patient volumes. While intuitively appealing, our experiments indicate that this approach may need to be reconsidered, as such decisions may be quite different from those maximizing health. We show that solutions that are close to optimal for both patient volume and effectiveness can be obtained by balancing the weights of the criteria in the objective function. In other words, considerable gains in effectiveness of the services are attainable when taking the second criterion into account, without having to reduce the number of truck drivers served much.
We also analyze the heuristic of making decisions consecutively, as is current practice, as opposed to planning ahead future expansion decisions. In a context where many clinics are presently operating, consecutive decision making is shown to yield near‐optimal decisions. This is an important finding, as it suggests that advanced and possibly expensive optimization tools might not be needed in such contexts. Long term network planning, however, substantially outperforms such heuristic in greenfield situations and in cases when synergy effects of placing multiple locations are substantial.
Impact of impreciseness in data and model parameters on solution quality presents another prominent question. Availability and quality of data is essentially limited in sub‐Saharan Africa. Moreover, understanding the relationship between access to services and effectiveness is still in early stages of development and parameter calibration may be weak. We present extensive theoretical and computational analyses on the relationship between data inaccuracy and solution values. These reveal that the solutions found are highly robust to impreciseness, suggesting that difficulties in acquiring precise input data do not necessarily hinder effective location choices.
Although, as we prove, the RHFLP is strongly
‐hard, our numerical experiments show that the real life test instances can be solved within reasonable computation times using standard software. Further research on approximation and exact solution methods will be valuable if future applications consider more complex and larger problem instances.
As access to health services is a human right laid down in the WHO constitution (United Nations 1946), we advocate that, once the high volume needs are addressed, equity considerations are taken into account in future network expansions. Along the lines of Ares et al. (2016), our work proposes how to extend our model to include this criterion and shows that substantial gains in equity can be attained at a marginal loss in the other criteria. Much additional work is yet to be done to better understand adequate models and assess trade‐offs. One specific challenge is to develop methods that identify so‐called equitably efficient solutions (see Ogryczak 2000). Our model also does not capture possible effects of location and service package decisions on patient volumes. These may include competition effects, marketing or repetition effects, and effects of offering a more comprehensive set of health services. For example, Morris and Ferguson (2007) show that demand is partly affected by the availability of public healthcare providers. Follow‐up research could investigate the magnitude of such effects for the truck driver population, propose richer models for
, and analyze the benefits of incorporating them in network design decisions. Likewise, models which include stochastic parameters can be of value to solve practical instances, given the many uncertainties in the data.
The proposed model captures the effectiveness of services provided via three newly proposed measures of access. The validity of these measures and their parametrization should be strengthened. For example, there is much room for improvement in terms of understanding the mechanisms relating access to effectiveness and the role of the composition of a package in these relationships. For instance, integrating HIV and TB care is known to bring about significant synergy effects. One specific area is to investigate possibilities to calibrate model parameters through empirical research relating differences in health outcomes to differences in access. We believe that the models, and subsequently the solutions proposed and health services provided to the truck drivers can greatly benefit from advancing scientific understanding in this area.
Acknowledgment
We thank all the staff from North Star for their support and close cooperation in this research. We also acknowledge Kevin Dalmeijer for contributing to the strongly NP‐completeness proof. Finally, we thank the ORTEC Consulting Group for the close collaboration on this project and the support provided while developing software‐package POLARIS and implementing this at North Star.
Footnotes
Interviewee Characteristics
Linearization of Effectiveness Variables e qs
ORCID
Harwin de Vries
References
1.
AhlburgD.2000. The economic impacts of tuberculosis. Technical report, World Health Organization, Montreal.
2.
ApostolopoulosY.SönmezS.. 2007. Tracing the diffusion of infectious diseases in the transport sector. ApostolopoulosY.SönmezS., eds. Population Mobility and Infectious Disease. Springer, New York, 131–153.
3.
AresJ. N.De VriesH.HuismanD.. 2016. A column generation approach for locating roadside clinics in Africa based on effectiveness and equity. Eur. J. Oper. Res.254(3): 1002–1016.
4.
AverbakhI.BermanO.. 1996. Locating flow‐capturing units on a network with multi‐counting and diminishing returns to scale. Eur. J. Oper. Res.91(3): 495–506.
5.
BergerL.2011. Northern Corridor infrastructure master plan. Volume 1: Analysis and forecast of transport demand. Technical report, Paris.
6.
BocciaM.SforzaA.SterleC.. 2009. Flow intercepting facility location: Problems, models and heuristics. J. Math. Modell. Algor.8(1): 35–79.
7.
BoltonP.BassJ.MurrayL.LeeK.WeissW.McDonnellS. M.. 2007. Expanding the scope of humanitarian program evaluation. Prehosp. Disaster Med.22(5): 390–395.
8.
BotãoC.HorthR. Z.FrankH.CummingsB.InguaneC.SathaneI.McFarlandW.RaymondH. F.YoungP. W.. 2015. Prevalence of HIV and associated risk factors among long distance truck drivers in Inchope, Mozambique, 2012. AIDS Behav.20(4): 811–820.
9.
CaldwellJ.CaldwellP.AnarfiJ.Awusabo‐AsareK.NtoziJ.OrubuloyeI. O.MarckJ.CosfordW.ColomboR.HollingsE.1999. Resistances to behavioural change to reduce HIV/AIDS infection in predominantly heterosexual epidemics in third world countries. Technical report, Health Transition Centre, National Centre for Epidemiology and Population Health, Australian National University, Canberra, ACT, Australia.
10.
ChenX. S.YinY. P.GongX. D.LiangG. J.ZhangW. Y.PoumerolG.ShiM. Q.WuS. Q.ZhangG. C.. 2006. Prevalence of sexually transmitted infections among long‐distance truck drivers in Tongling, China. Int. J. STD AIDS. 17(5): 304–308.
11.
ChumaJ.AbuyaT.MemusiD.JumaE.AkhwaleW.NtwigaJ.NyandigisiA.TettehG.ShrettaR.AminA.. 2009. Reviewing the literature on access to prompt and effective malaria treatment in Kenya: Implications for meeting the Abuja targets. Malar. J.8(1): 243.
12.
CookeG. S.TanserF. C.BärnighausenT. W.NewellM. L.. 2010. Population uptake of antiretroviral treatment through primary care in rural South Africa. BMC Public Health. 10(1): 1.
13.
DaskinM. S.DeanL. K.. 2004. Location of health care facilities. Operations Research and Health Care. Springer, Boston, MA, pp. 43–76.
14.
De VriesH.2011. How to Optimise Investments in the Network of Medical Centres along the African Highways. Master Thesis, Econometric Institute, Erasmus School of Economics. Available at http://hdl.handle.net/2105/10558 (accessed date January 08, 2016).
15.
De VriesH.DuijzerE.. 2017. Incorporating driving range variability in network design for refueling facilities. Omega. 69: 102–114.
16.
De VriesH.Van WassenhoveL. N.. 2019. Do optimization models for humanitarian operations need a paradigm shift? Prod. Oper. Manag.29(1): 55–61.
17.
De VriesH.Van de KlundertJ. J.WagelmansA. P. M.. 2014. Health benefits of roadside healthcare services. Econometric Institute Working paper EI 2014–01.
18.
Delany‐MoretlweA.BelloP.KinrossP.OliffM.ChersichM.KleinschmidtI.ReesH.. 2014. HIV prevalence and risk in long‐distance truck drivers in South Africa: A national cross‐sectional survey. Int. J. STD AIDS. 25(6): 428–438.
19.
DeoS.SohoniM.. 2015. Optimal decentralization of early infant diagnosis of HIV in resourcelimited settings. Manuf. Serv. Oper. Manag.17(2): 191–207.
20.
DoernerK.FockeA.GutjahrW. J.. 2007. Multicriteria tour planning for mobile healthcare facilities in a developing country. Eur. J. Oper. Res.179(3): 1078–1096.
21.
FerdowsK.De MeyerA.. 1990. Lasting improvements in manufacturing performance: In search of a new theory. J. Oper. Manag.9(2): 168–184.
22.
FergusonA.MorrisC. N.. 2007. Mapping transactional sex on the Northern Corridor highway in Kenya. Health Place. 28(3): 504–519.
23.
GatignonA.Van WassenhoveL. N.. 2008. Paving the road to healthy highways: A partnership to scale up HIV & AIDS clinics in Africa.
24.
GomezG.B.VenterW. D. F.LangeJ. M. A.ReesH.HankinsC.. 2013. North‐South Corridor demonstration project: Ethical and logistical challenges in the design of a demonstration study of early antiretroviral treatment for long distance truck drivers along a transport corridor through South Africa, Zimbabwe, and Zambia. Advances in Preventive Medicine.
25.
GriffinJ. A.2012. Improving health care delivery through multi‐objective resource allocation. Ph.D. thesis, Georgia Institute of Technology.
26.
HachichaM.HodgsonJ. M.LaporteG.SemetF.. 2000. Heuristics for the multi‐vehicle covering tour problem. Comput. Oper. Res.27(1): 29–42.
HodgsonM. J.LaporteG.SemetF.. 1998. A covering tour model for planning mobile health care facilities in Suhum district, Ghana. J. Reg. Sci.38(4): 621–638.
29.
HookE. W.IIIRicheyC. M.LeoneP.BolanG.SpaldingC.HenryK.ClarkeP.SmithM.CelumC. L.. 1997. Delayed presentation to clinics for sexually transmitted diseases by symptomatic patients: A potential contributor to continuing STD morbidity. Sex. Transm. Dis.24(8): 443–448.
30.
HudsonC. P.1996. AIDS in rural Africa: A paradigm for HIV‐1 infection. Int. J. STD AIDS. 7(4): 236–243.
31.
ILO. 2005. HIV/AIDS in the transport sector of southern African countries. Technical report, International Labour Organization, Geneva.
32.
IOM. 2003. Mobile populations and HIV/AIDS in the southern African region: Recommendations for action. Technical report, International Organization for Migration, Geneva.
33.
JICA. 2010. Preparatory survey for southern Africa integrated regional transport program. Technical report, Japan International Cooperation Agency.
34.
JICA. 2013. Data collection survey for economic and industrial development along economic corridors in southern Africa. Technical report, Japan International Cooperation Agency.
35.
JohnsonA. D.ThomsonD. R.AtwoodS.AlleyI.BeckermanJ. L.KoneI.DiakiteD.DialloH.TraoreB.TraoreK.FarmerP. E.MurrayM.MukherjeeJ.. 2013. Assessing early access to care and child survival during a health system strengthening intervention in Mali: A repeated cross sectional survey. PLoS ONE. 8(12): e81304.
36.
KhatibR. A.SelemaniM.MrishoG. A.MasanjaI. M.AmuriM.NjoziM. H.KajunguD.KuepferI.AbdullaS. M.de SavignyD.. 2013. Access to artemisinin‐based anti‐malarial treatment and its related factors in rural Tanzania. Malar. J.12(155): 10–1186.
37.
KraiselburdS.YadavP.. 2013. Supply chains and global health: An imperative for bringing operations management scholarship into action. Prod. Oper. Manag.22(2): 377–381.
38.
KubyM.LimS.. 2005. The flow‐refueling location problem for alternative‐fuel vehicles. Socio‐Econ. Plan. Sci.39(2): 125–145.
39.
KulisM.ChawlaM.KozierkiewiczA.SubataE.. 2004. Truck Drivers and Casual Sex: An Inquiry into the Potential Spread of HIV/AIDS in the Baltic Region. World Bank Publications, Washington DC, 37.
40.
LacerdaR.GravatoN.McFarlandW.RutherfordG.IskrantK.StallR.HearstN.. 1997. Truck drivers in Brazil: Prevalence of HIV and other sexually transmitted diseases, risk behavior and potential for spread of infection. AIDS. 11(1): S15–S19.
41.
Lalla‐EdwardS. T.NcubeS.MatthewP.HankinsC. A.VenterW. D. F.GomezG. B.. 2017. Uptake of health services among truck drivers in South Africa: Analysis of routine data from nine roadside wellness centres. BMC Health Serv. Res.17(1): 649.
42.
Laukamm‐JostenU.MwizarubiB. K.OutwaterA.MwaijongaC. L.ValadezJ. J.NyamwayaD.SwaiR.SaidelT.Nyamuryekung’eK.. 2000. Preventing HIV infection through peer education and condom promotion among truck drivers and their sexual partners in Tanzania, 1990–1993. AIDS Care. 12(1): 27–40.
43.
LeeJ.WilsonD.. 2001. Polyhedral methods for piecewise‐linear functions I: The lambda method. Discrete Appl. Math.108(3): 269–285.
44.
LichtensteinB.HookE. W.GrimleyD. M.. 2008. HIV risk among long haul truckers in the USA. Cult. Health Sex.10(1): 43–56.
45.
MaltaM.BastosF. I.Pereira‐KollerE. M.CunhaM. D.MarquesC.StrathdeeS. A.. 2006. A qualitative assessment of long distance truck drivers’ vulnerability to HIV/AIDS in Itajai, southern Brazil. AIDS Care. 18(5): 489–496.
46.
MatovuJ. K.SsebaddukaB. N.. 2012. Sexual risk behaviours, condom use and sexually transmitted infection treatment‐seeking behaviours among female sex workers and truck drivers in Uganda. Int. J. STD AIDS. 23(4): 267–273.
47.
McCoyJ. H.JohnsonE. M.. 2014. Clinic capacity management: Planning treatment programs that incorporate adherence. Prod. Oper. Manag.23(1): 1–18.
48.
McCoyJ. H.LeeH. L.. 2014. Using fairness models to improve equity in health delivery fleet management. Prod. Oper. Manag.23(6): 965–977.
49.
McLarenZ. M.ArdingtonC.LeibbrandtM.. 2014. Distance decay and persistent health care disparities in South Africa. BMC Health Serv. Res.14(1): 1.
50.
Meyer‐WeitzA.ReddyP.Van den BorneH. W.KokG.PietersenJ.. 2000. Health care seeking behaviour of patients with sexually transmitted diseases: Determinants of delay behaviour. Patient Educ. Couns.41(3): 263–274.
51.
MillsE. J.NachegaJ. B.BangsbergD. R.SinghS.RachlisB.WuP.WilsonK.BuchanI.GillC. J.CooperC.. 2006. Adherence to HAART: A systematic review of developed and developing nation patient‐reported barriers and facilitators. PLoS Med.3(11): e438.
52.
MorrisC. N.FergusonA. G.. 2006. Estimation of the sexual transmission of HIV in Kenya and Uganda on the trans‐Africa highway: The continuing role for prevention in high risk groups. Sex. Transm. Infect.82(5): 368–371.
53.
MorrisC. N.FergusonA. G.. 2007. Sexual and treatment‐seeking behaviour for sexually transmitted infection in long‐distance transport workers of East Africa. Sex. Transm. Infect.83(3): 242–245.
54.
MosesS.NgugiE. N.BradleyJ. E.NjeruE. K.EldridgeG.MuiaE.OlenjaJ.PlummerF. A.. 1994. Health care‐seeking behavior related to the transmission of sexually transmitted diseases in Kenya. Am. J. Public Health. 84(12): 1947–1951.
55.
Nathan Associates Inc. 2011. Corridor diagnostic study of the Northern and Central Corridors of East Africa. Technical report, Nathan Associates Inc., Washington, DC.
56.
North Star Alliance. 2011. New ORTEC system helps North Star Alliance “optimize the world”. Available at http://www.northstar-alliance.org/new-ortec-system-helps-northstar-alliance-to-optimize-the-world/ (accessed January 08, 2016).
57.
OdokiJ. B.AnyalaM.. 2014. Economic benefits of an efficient North‐South Corridor. Technical report, Alta Innovations, Birmingham.
58.
OgryczakW.2000. Inequality measures and equitable approaches to location problems. Eur. J. Oper. Res.122(2): 374–391.
59.
OrubuloyeI. O.CaldwellP.CaldwellJ. C.. 1993. The role of high‐risk occupations in the spread of AIDS: Truck drivers and itinerant market women in Nigeria. Int. Fam. Plan. Perspect.19(2): 43–48.
60.
PandeyA.BenaraS. K.RoyN.SahuD.ThomasM.JoshiD. M.SenguptaU.ParanjapeR. S.BhallaA.PrakashA.. 2008. Risk behaviour, sexually transmitted infections and HIV among long‐distance truck drivers A cross‐sectional survey along national highways in India. AIDS. 22: S81–S90.
61.
PetersonA.2007. The origin‐destination matrix estimation problem: Analysis and computations. Ph.D. thesis, Institutionen för teknik och naturvetenskap.
62.
RahmanS. U.SmithD. K.. 2000. Use of location‐allocation models in health service development planning in developing nations. Eur. J. Oper. Res.123(3): 437–452.
63.
RamjeeG.GouwsE.. 2002. Prevalence of HIV among truck drivers visiting sex workers in KwaZulu‐Natal, South Africa. Sex. Transm. Dis.29(1): 44–49.
64.
RanganathanR.FosterV.2011. The SADC's infrastructure: A regional perspective. Technical report, World Bank Policy Research Working Paper Series, Washington DC.
65.
RoaA.MisraK.VermaK.. 1997. A national multicentric study in India to determine STD incidence amongst intercity truck drivers. Program and Abstracts of the XI International AIDS Conference. Vancouver, Brittish Columbia, pp. 161.
66.
RoystonG.2011. Meeting global health challenges through operational research and management science. Bull. World Health Organ.89(9): 683–688.
67.
SachsJ.MalaneyP.. 2002. The economic and social burden of malaria. Nature. 415(6872): 680–685.
68.
SADC. 2012. Regional infrastructure development master plan: Transport sector plan. Technical report, Southern African Development Community.
69.
SaundersB.SimJ.KingstoneT.BakerS.WaterfieldJ.BartlamB.BurroughsH.JinksC.. 2017. Saturation in qualitative research: Exploring its conceptualization and operationalization. Quality & Quantity52: 1–15.
70.
SchrijverA.1998. Theory of Linear and Integer Programming. John Wiley & Sons, Hoboken, NJ.
71.
SmithH.HarperP. R.PottsC. N.ThyleA.. 2009. Planning sustainable community health schemes in rural areas of developing countries. Eur. J. Oper. Res.193(3): 768–777.
72.
SolomonA. J.DoucetteJ. T.GarlandE.McGinnT.. 2004. Healthcare and the long haul: Long distance truck drivers–a medically underserved population. Am. J. Ind. Med.46(5): 463–471.
73.
StoverJ.BollingerL.. 1999. The economic impact of AIDS in South Africa. Technical report, The POLICY Project.
74.
StratfordD.EllerbrockT. V.AkinsJ. KHallH. L.. 2000. Highway cowboys, old hands and Christian truckers: Risk behavior for human immunodeficiency virus infection among longhaul truckers in Florida. Soc. Sci. Med.50(5): 737–749.
75.
TanserF.GijsbertsenB.HerbstK.. 2006. Modelling and understanding primary health care accessibility and utilization in rural South Africa: An exploration using a geographical information system. Soc. Sci. Med.63(3): 691–705.
76.
TeravaninthornS.RaballandG.. 2009. Transport prices and costs in Africa: A review of the main international corridors. Technical report, World Bank Publications.
77.
TTCA. 2015. The Northern Corridor transport observatory report issue No.7. Technical report, Northern Corridor Transit and Transport Coordination Authority, Mombasa.
78.
United Nations. 1946. Constitution of the world health organization. Technical report, United Nations, New York.
WhiteL.SmithH.CurrieC.. 2011. OR in developing countries: A review. Eur. J. Oper. Res.208(1): 1–11.
81.
WHO. 2016. Global health observatory data repository. Available at http://apps.who.int/ghodata (accessed February 02, 2016).
82.
WHO/UNICEF. 2003. Africa malaria report 2003. Technical report, World Health Organization, Geneva.
83.
WilsonD.2005. Corridors of hope in southern Africa: HIV prevention needs and opportunities in four border towns. Technical report, Family Health International.
84.
WongW. C.TamS. M.LeungP. W.. 2007. Cross‐border truck drivers in Hong Kong: Their psychological health, sexual dysfunctions and sexual risk behaviors. J. Travel Med.14(1): 20–30.
85.
YadavP. 2010. Improving public health in developing countries through operations research. Wiley Encyclopedia Oper. Res. Manag. Sci.https://doi.org/10.1002/9780470400531.eorms0401