
Abstract
We study volunteer management at a charity storehouse operated by a large faith‐based organization. The storehouse runs entirely on volunteer efforts. We investigate the role of volunteer experience and storehouse congestion in the preparation of orders using a multi‐method approach. First, we conduct a field study to explore these relationships and collect data at the level of volunteers’ teams. These teams can pair volunteers with either different levels of experience (mixed pairing) or equal levels of experience (no‐mixed pairing). Second, we estimate the effects of volunteer experience and storehouse congestion on the order processing times empirically. Third, we build a simulation model to study how operational decisions—volunteers’ pairing in teams and whether to allow or impede storehouse congestion—affect two performance metrics: on‐time order preparation rate and additional time to prepare the orders, in steady conditions. Then, we simulate disaster conditions at the storehouse, that is, simultaneous surges in supply of volunteers and demand of orders. Contrary to extant literature on team collaboration, we find that no‐mixed pairing outperforms mixed pairing under disaster conditions with storehouse congestion. In fact, no‐mixed pairing improves the on‐time order preparation by 4.32% and the additional time to prepare the orders by 14.42% compared to mixed pairing. Moreover, under disaster conditions, a “controlled congestion” policy at the storehouse delivers the best performance metrics.
Introduction
More than 77 million volunteers donated over 6.9 billion hours of service to charities in the United States during 2017. These donations are valued at approximately 167 billion USD (CNCS 2018). While the contributions of volunteers are critical to charities, managing them is challenging due to the high uncertainty inherent to volunteering. Organizations face high variability in volunteer experience and in volunteer arrivals; for instance, to prepare orders in storehouses. Heterogeneous volunteer experience complicates the allocation of volunteers to tasks because inexperienced volunteers can delay operations and do more harm than good in their attempts to help (Jenkin 2015). Moreover, uncertain volunteer arrivals can create congestion in operations when large numbers of volunteers arrive unexpectedly to help organizations in their relief efforts.
We investigate the effect of volunteer experience and storehouse congestion on operational performance—as it relates to order preparation—using a multi‐method research design. First, we conduct a field study at a charity storehouse to explore the setting, refine our research question and unit of analysis, and collect data at the granularity of volunteers’ work. Second, we use the data collected to estimate the effect of volunteer experience and storehouse congestion on order preparation empirically. Third, we build on the previous methods to create a simulation model of the current operations (henceforth referred to as steady conditions) to simulate the storehouse performance under disaster conditions (unexpected surge of demand for goods and supply of volunteers).
We conduct the field study on a storehouse that belongs to a large faith‐based organization situated in the United States. We focus on how volunteers prepare orders and analyze two operational performance metrics at the storehouse level: (i) on‐time order preparation rate, which refers to the proportion of orders that are completed after 5 hours of storehouse operation—the expected amount of time to prepare all orders and start delivery—and (ii) the additional time to prepare any remaining orders, which refers to the delay to finish all order preparations. These metrics are already used informally at the storehouse. The storehouse has an unlimited supply of items, as it is located next to a large warehouse that belongs to the same organization and the warehouse replenishes the storehouse immediately if required. The storehouse also has highly predictable demand, as it receives information about demand 1 week in advance of order preparation. Thus, the uncertainty in this steady operation comes only from the heterogeneous experience and arrivals of volunteers, who donate their time to prepare the orders. We use this unique setting to explore the relationships among volunteer experience, storehouse congestion and operational performance.
During the field study, we observe that there are two types of volunteers arriving at the store‐house: experienced (Exp) and inexperienced (Inexp), who work in pairs (henceforth referred to as teams). Volunteer pairing can be mixed (Exp–Inexp) or no‐mixed (Exp–Exp, Inexp–Inexp). Naturally, team pairing affects order preparation: Exp–Exp teams are the fastest while Inexp–Inexp are the slowest. Inexperienced volunteers can learn both from interacting with experienced volunteers (Exp‐Inexp) and from preparing orders. We observe that there are only two times a year when the storehouse is congested with volunteers: Thanksgiving and Christmas. The storehouse managers (henceforth referred to as Managers) could impede congestion by limiting the number of teams to the maximum that can prepare orders without slowing down other teams (henceforth referred to as capacity). Nonetheless, Managers prefer to allow congestion. We visited the storehouse during two Thanksgiving seasons and observed that storehouse congestion also impacts order preparation. Furthermore, the impact of congestion varies for the different team pairings. Building on these observations, we define our unit of analysis as team pairing and collect data on order preparation at this level, which are not readily available from the organization. We gather data during steady as well as congested conditions via participant observation and interviews.
We use the empirical data on order preparation to conduct structural estimations of the effects of learning and congestion on the order processing times of different team pairings. In addition, we have access to over 3 year's worth of archival data to characterize the distribution of the weekly demand (orders) and volunteer arrivals at the storehouse. We use the observations during the field study, the structural estimations and the archival data to build an agent‐based simulation (ABS) model, which replicates the operational performance metrics of the storehouse under steady conditions. Next, we use this model to investigate the drivers of the two performance metrics during disaster conditions. We use simulation because we can represent reality without interfering with volunteers’ work. This is especially important during disaster response operations when data collection poses logistics challenges.
We design 32 (4 × 2 × 4) experimental treatments varying volunteer experience (only Exp, only Inexp, mixed pairing, no‐mixed pairing) and storehouse congestion policies (allow and impede congestion) in four conditions (steady and three disaster conditions). We first study the steady conditions, in which the demand for relief items is known in advance and volunteers stay in the storehouse as long as needed to prepare all the orders. We use the steady conditions as a benchmark to compare to the disaster conditions. As volunteer convergence and peaks in demand characterize disaster conditions, we study the following three disaster conditions: high supply of volunteers, high demand of orders, and high supply and high demand, simultaneously.
Results show that under steady conditions, when both experienced and inexperienced volunteers arrive, mixed pairing is better on average than no‐mixed pairing because it facilitates collaboration and learning. However, under disaster conditions (high supply of volunteers and high demand of orders) allowing congestion, results change. We find that a no‐mixed pairing strategy performs better than a mixed pairing strategy—it improves the on‐time order preparation by 4.32% and the additional time to prepare the orders by 14.42%. When congestion is allowed, inexperienced volunteers take longer to learn, slowing down experienced volunteers. As experienced teams already have the required skills and knowledge to prepare orders, they suffer less from congestion. Therefore, building Exp–Exp teams is more efficient than pairing them with inexperienced volunteers.
For the congestion policy, results show that when there is only an increase in the supply of volunteers or an increase in the demand of orders, there are no differences in performance between managerial policies that allow or impede congestion. However, under a disaster condition of high supply and high demand, we find that neither of the extreme policies of completely allowing or impeding congestion delivers the best performance. When congestion is allowed, processes slow down and affect the on‐time order preparation rate. When congestion is impeded, some of the volunteers who cannot enter the storehouse do not wait for the opportunity to help and leave the system. As they leave, the number of volunteers available to complete the orders reduces, increasing the additional time required to complete orders. In this disaster condition, an alternative policy that accepts controlled congestion (i.e., limits the volunteers to a number above the storehouse capacity) works better than any of the extreme policies. Controlled congestion lessens the negative impacts of the two extreme policies: it increases the speed of the fully congested storehouse and reduces the number of volunteers who leave the system.
Volunteer Management, Experience and Congestion
Operations management research on volunteers has focused on volunteer satisfaction and volunteer scheduling. Volunteers are satisfied when working conditions include a flexible schedule, orientation and training, empowerment, rewards, recognition and even economic incentives (Lacetera et al. 2014, Wisner et al. 2005). When volunteers are satisfied, they contribute more of their time and money to the organization and ask family and friends to volunteer as well (Wisner et al. 2005). Furthermore, volunteers usually have a relational motive; assignments that create opportunities to make social connections and friends may satisfy volunteers and increase volunteerism (Prouteau and Wolff 2008, Willems and Walk 2013). Finally, volunteers appreciate performing meaningful tasks. When volunteers feel underutilized, they tend to donate less of their time in the future (Sampson 2006).
Regarding volunteer scheduling, extant research has considered comparisons with traditional labor assignment, optimization models, and queuing systems. Sampson (2006) compares how volunteer labor assignment differs from traditional labor assignment, considering cost structures, objective functions, and constraints. Falasca et al. (2011) and Falasca and Zobel (2012) develop multi‐criteria optimization models to minimize volunteer labor shortages and scheduling costs while maximizing the satisfaction of volunteers’ preferences. Garcia et al. (2018) use mixed integer programming to allocate volunteers to tasks during disaster conditions, considering both volunteers’ preferences and skills. Lodree and Davis (2016) and Mayorga et al. (2017) consider stochastic rates of volunteer arrival and abandonment by using analytical queuing systems to model optimal assignment policies for spontaneous volunteers. Most of these studies assume, however, that volunteers are homogeneous in their skills and have the required experience to perform their labor assignments.
Volunteer Experience
Scholars have started to incorporate the factor of people's experience (i.e., doing tasks that best fit people's skills) in workforce planning, including staffing and scheduling decisions (De Bruecker et al. 2015), but few studies in volunteer management have done so. Research on volunteer experience focuses on disaster settings when the needs of the population, the availability of volunteers and their skills change over time. Lassiter et al. (2014, 2015) develop multi‐criteria optimization models to minimize unmet task demand and maximize volunteer assignment preferences while accounting for the volunteers’ experience, the experience required for the task, volunteer training opportunities and volunteer attrition. They find that optimal strategies for organizations include training inexperienced volunteers at the very beginning of disasters and matching volunteer preferences only up to a certain threshold.
Volunteers, similar to employees, can learn and increase experience during the task assignment through interaction with more experienced volunteers. When employees work together, they can collaborate and share knowledge, and improving organizational performance (Lee et al. 2011, Siemsen et al. 2007). Collaboration is higher when employees work on interdependent—instead of independent—tasks (Siemsen et al. 2007). We advance the study of the heterogeneity in volunteer experience by building on the previous positive findings about collaboration for employees. In particular, we investigate how charity storehouses should manage experienced and inexperienced volunteers in order to have a positive effect on the supply chain's operational performance. We study whether collaboration between experienced and inexperienced volunteers is always more effective in achieving the best performance.
Volunteer Management and Congestion
Congestion in volunteer management is related to convergence, that is, to large numbers of volunteers arriving to a particular zone after a disaster occurs (Fritz and Mathewson 1957). The literature on convergence studies who gathers after a disaster (Fritz and Mathewson 1957, Kendra and Wachtendorf 2001), the distribution of arrivals and duration of the convergence period (Lodree and Davis 2016), and the advantages and disadvantages of convergence (e.g., Barsky et al. 2007, Harris et al. 2017, Paciarotti et al. 2018). The main benefit of convergence is increasing organizations’ capacity to respond to peak demand, but when the number of people convening is large, this convergence also creates congestion. Congestion can obstruct coordination and deviate the allocation of experienced resources to focus on crowd control or training. It can also slow down the processes and the response itself.
To our knowledge, the effects of volunteer convergence on operational performance metrics have not been evaluated. We study how to manage congestion in a storehouse by considering two different congestion policies and evaluating their impact on operational metrics.
Research Design
We follow the multi‐method approach Besiou and Van Wassenhove (2015) suggest. They discuss that research on socially responsible settings, like ours, requires the combination of different methods: literature review to make links with the current research and identify remaining gaps, case study to collect qualitative and quantitative data, and simulation to get a holistic understanding of the system's behavior. The combination of empirical analyses and simulation allows revealing insights into more complex situations, like disaster conditions, which are not available when using only one method (Chandrasekaran et al. 2018). Figure 1 outlines our research design, following Pedraza‐Martinez et al. (2011).
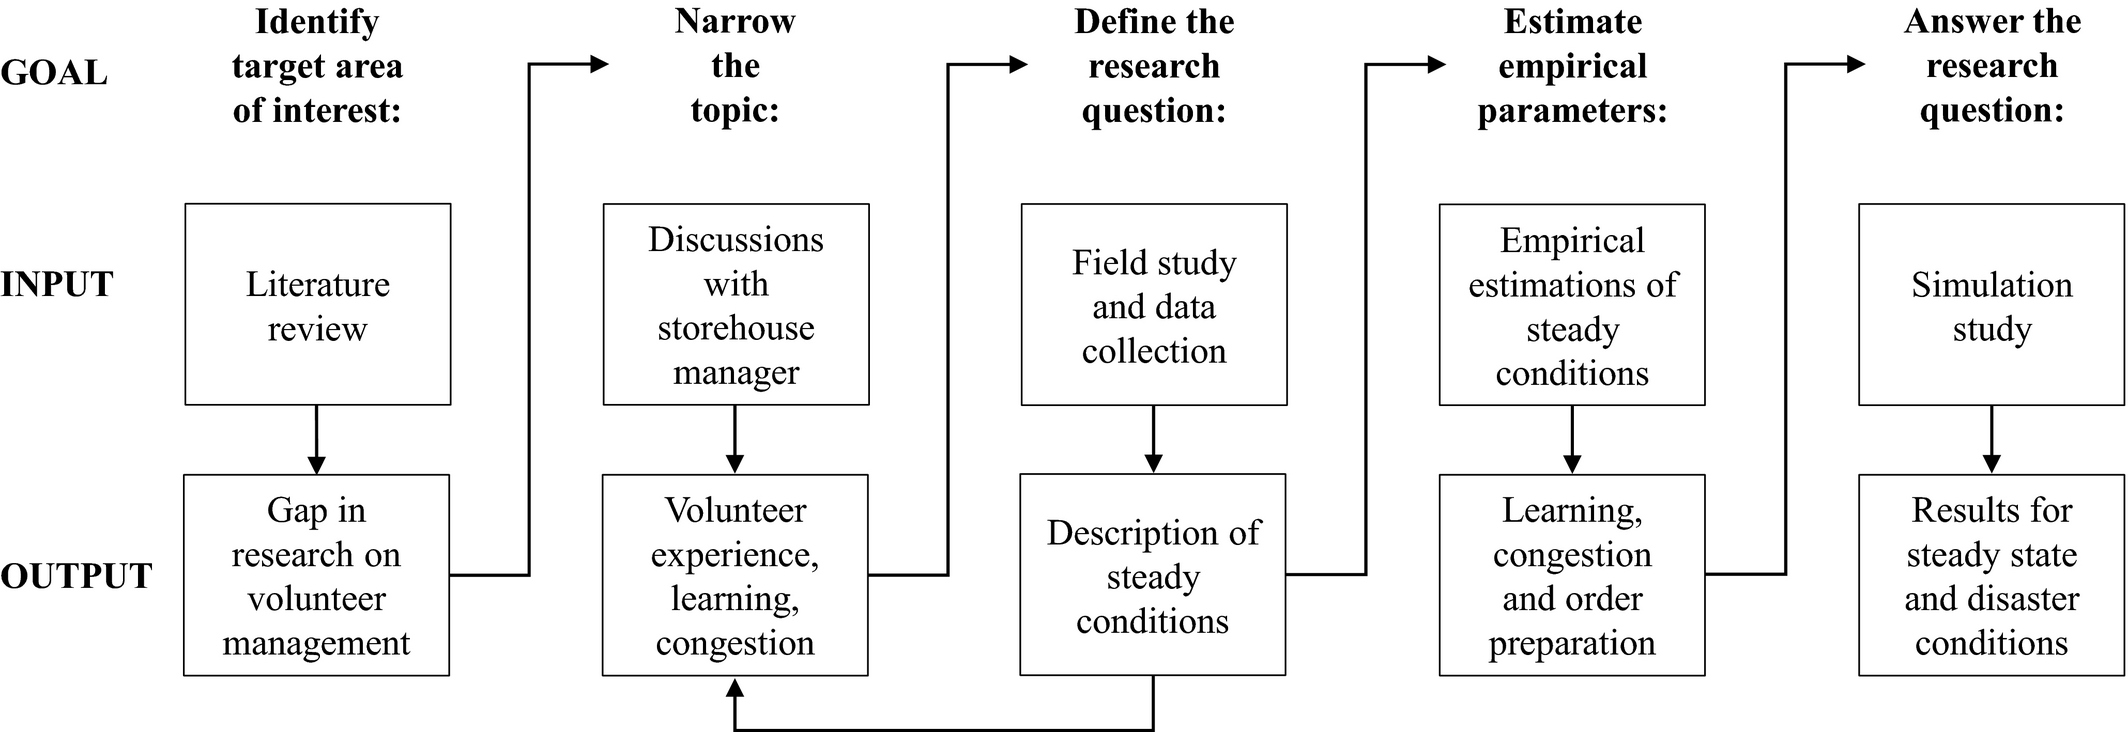
Research Process (based on Pedraza‐Martinez et al. 2011)
We review the literature and find that there is a research gap on volunteer management: there is no clear link between volunteer experience, learning, congestion, and operational performance. These relationships are important because they allow organizations to understand the implications of volunteer management on their own performance metrics, both during steady and disaster conditions. Hence, we study these relationships in a charity storehouse that belongs to a large faith‐based organization. Faith‐based organizations, like the one under study, are a good setting for our research because they provide services to relieve people's most pressing needs (Fulton 2016).
First, we conduct a field study to explore the relationship between volunteer management and operational performance in the storehouse qualitatively. We observe that there is uncertainty in volunteers’ arrivals and heterogeneity in volunteers’ experience. Volunteers range from those that have been volunteering at the storehouse for more than 15 years to those that go only once. In the storehouse, volunteers work in pairs to prepare the orders. There are three types of team pairing: Exp–Exp, Exp–Inexp, and Inexp–Inexp. We observe that team pairing has a role in how volunteers learn and how congestion affects their order preparation. Thus, we define team pairing as our unit of analysis and use it to refine our research question:
After refining the research question, we start the collection of data at the level of team pairing, which are not readily available from the organization. For each pair of volunteers, we record their level of experience, the time to prepare each order, the order size, the number of teams working simultaneously in the storehouse, and the number of orders completed before volunteers leave the storehouse. We collect these data manually both during steady and congested conditions for over 220 orders.
Second, we use empirical estimations to describe the relationship between volunteer management and operational performance. We propose an empirical model that represents the effect of learning and congestion on order processing times for different team pairings. Next, we use the empirical data on teams’ order preparation to estimate structurally the parameters of the empirical model and characterize the relationship among these three factors.
Third, we build a simulation model that captures the storehouse's current operations. We use the qualitative observations, the empirical estimations and additional archival data from the storehouse to feed the simulation model. We validate the simulation model by replicating the collected data and test it with sensitivity analyses. Finally, we follow Besiou et al. (2014) to simulate disaster conditions and analyze the performance of the storehouse under different policies.
Field Study
We collected data from June 2014 to November 2018. During this time, we visited the storehouse eleven times. Table 1 presents the list of visits, time spent, and tasks performed during each visit. Two researchers were present at ten of the visits. Visit number 3 had only one researcher. Between visit 7 and 8, the Managers changed and we had to rebuild our relationship with them. We collected data both on usual days and before Thanksgiving, when the demand peaks. We gathered data via participant observation, interviews and archival data. We used overt participant observation to study volunteers’ learning, the processing time of the orders and the effect of congestion. The interviews helped us understand the process and the criteria for volunteer pairing. The archival data captured the historical patterns for both order demand and volunteer arrivals.
Dates, Time Spent and Tasks Performed during Each Visit
Note
Only one researcher assisted the truck driver in this visit due to safety constraints.
We conducted semi‐structured interviews with experienced volunteers. As suggested in the literature (Luker 1984), we sent transcriptions to the interviewees to check for accuracy and no one had major edits. In addition to the interviews, we had informal discussions with less experienced volunteers, which were kept confidential and anonymous. During conversations, we wrote down important pieces of dialogue. Following Pedraza‐Martinez et al. (2011), after each visit, we expanded these records into detailed field notes, leading to extensive summaries about our visits.
Hence, the project's written records contain literature, notes from the organization and archival materials. Examining these documents enabled us to crosscheck some of the assertions made in interviews with documentary evidence (as we did, for example, regarding the number of volunteers arriving to prepare orders). To avoid potential bias, we did not share results with the experienced volunteers during the data collection (Calarco 2011); we did that only at the end of the project. During data collection, we were primarily observers and participated only when that facilitated the data collection process, for example, in order to understand the volunteers’ learning curve better.
Storehouse Setting
The storehouse is owned by a large faith‐based organization, which we keep confidential. The organization is in the top five of the largest in religious terms of membership in the United States. The organization has one central warehouse in the Midwest region of the United States. This central warehouse serves 11 storehouses, including the one under study. The storehouse under study covers approximately 60 congregations in the states of Indiana and Kentucky. Each congregation has between 400 and 600 members and a leader called a Bishop.
The storehouse, which relies on volunteers, provides a suitable setting to study volunteer management and its impact on operational performance because its main source of uncertainty is related to volunteer arrivals and experience. Due to the nature of their labor, volunteers work in teams of two. Hence, it is important for the organization to select the right team pairing for the job and to decide whether to allow or avoid congestion in the storehouse.
Demand and Supply
The storehouse provides commodities such as vegetables, meat, and dairy products to people in need (henceforth referred to as beneficiaries). The beneficiaries are usually members of the organization and their families, who have lost their jobs or are unable to work. On Sunday, the beneficiary meets the Relief Society President (RSP) of the organization, and together they plan a 2‐week menu day by day. Then, the RSP maps the menu into an order of commodities. For example, on Monday the family has cereal for breakfast, hamburgers for lunch, and fruit and cheese for dinner. This translates into cereal, milk, bread, meat, fruit, cheese, etc. The RSP enters the order into the IT system, making it anonymous to avoid any social stigma. Afterwards, the Bishop approves the order and only then will the order appear in the storehouse system for preparation. The orders that the storehouse receives before Sunday at midnight are prepared during the coming week with the help of volunteers. Orders are prepared weekly; however, beneficiaries only order every 2 weeks. The organization owns a truck that drives six fixed distribution routes, three per week, which cover 18 communities. Demand may vary from 20 to 60 orders per day per route.
The standard operation of the storehouse holds inventory for 3 months. The inventories of cans and non‐perishable items are ordered once per month and may last up to 6 months. Fresh products, such as fruit, vegetables, bread, and different meats, are ordered weekly. The warehouse immediately replenishes any items out of stock.
Volunteers
The organization appoints a senior organization member and his/her spouse as Managers every 2 years; they also serve as experienced volunteers. We interacted with three Managers during the duration of the field study. All Managers had undergraduate or graduate degrees. The Managers plan volunteer supply on a yearly basis. Based on demand records from the previous year and the number of volunteering congregations, the Managers assign congregations to different weeks. Each congregation is assigned to volunteer once a month. The Managers communicate the plan to the Bishop of each congregation, and the Bishop asks for volunteers from the members of the congregation. The members of a particular congregation go to the storehouse and donate their time during their assigned week. This is the largest source of volunteers, who can be experienced or inexperienced. Experienced volunteers can go directly to the storehouse, independently from the congregation.
On Tuesday, for around 5 hours, a group of volunteers prepares the orders for the week. The volunteers go through the following processes in the storehouse when preparing the orders.
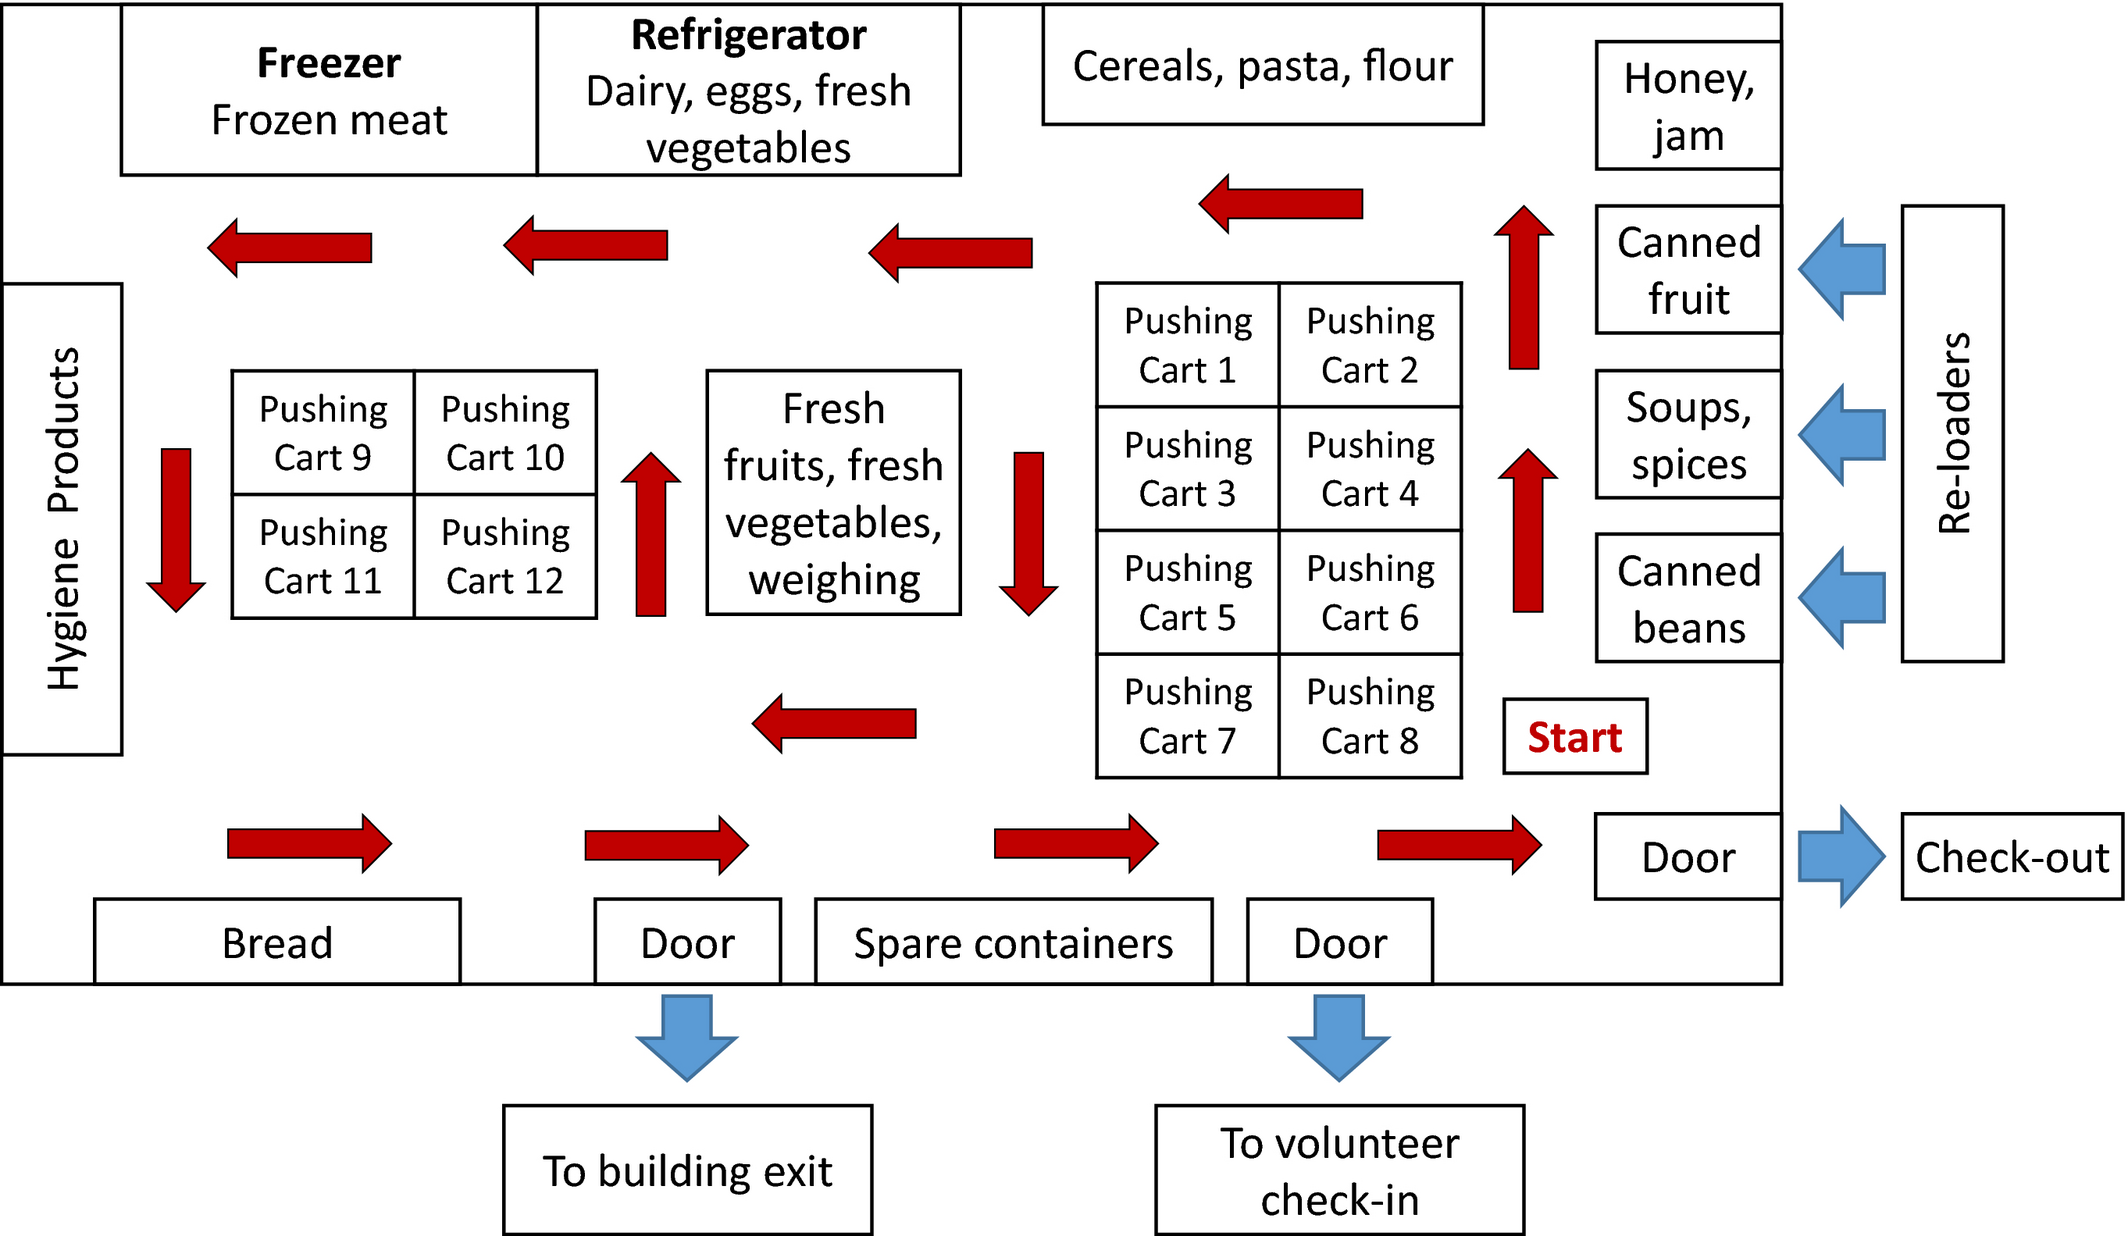
Picking Line [Color figure can be viewed at
The team collects a “pushing” cart that has plastic containers and a little bag with post‐its, a red pen, and a black marker. Orders can have different sizes, varying from only one to 10 plastic containers. The post‐its are used to mark the name of the order and stick it into the containers. The red pen is used to write the number of units of product collected next to the number of units required in the order form. Each team puts three paper bags in each plastic container. The marker is used to mark the paper bags with the name of the order. After leaving the check‐in area, one of the team members takes a small paper box and begins picking the items while the second member checks them off the order. Once an order is filled, the team pushes the cart to the check‐out area. The pallet supervisor checks that all the items in the order are there. Another team puts the plastic containers on a pallet. Pallets are taken either to a refrigerator (if the order will be delivered the same day) or to a freezer if the order will be delivered later that week.
Order Delivery
After the 5 hours of order preparation, orders are delivered to beneficiaries. A different group of volunteers is responsible for distributing the orders via truck. If a beneficiary does not pick up an order, the order returns to the storehouse. Afterwards, either someone from the Bishop's office drives it to the beneficiary another day or the beneficiary's local Bishop goes with him/her to the supermarket to buy food.
Empirical Estimations
We collect data for different variables, as summarized in Table 2. We use archival data for the demand and volunteer arrivals. The demand follows a lognormal distribution with mean 69.33 weekly orders and standard deviation 11.27 (Kolmogorov–Smirnov test,
Data and Relevant Parameters Collected during Field Visits
We collect data manually on the order preparation for each team pairing. We find that for a team of experienced volunteers in an uncongested storehouse, preparing an order takes 18 minutes on average (standard deviation 6.53). For a team of inexperienced volunteers, the preparation time increases by 27.8% on average (mean 23 minutes, standard deviation 9.50). If the storehouse is congested, these times increase for all team pairings. The number of orders volunteers prepare before leaving the storehouse follows a Poisson distribution with mean 4.72 orders (Chi‐Square test,
Structural Estimation
From our observations and data analysis, we propose that the time required to prepare an order depends on the experience of the volunteers making up the team, on the learning process and on the total number of teams working simultaneously in the storehouse. To test this proposition rigorously, we investigate the relationship among order processing time, volunteer experience, learning and congestion empirically. We follow two steps. First, we build on the literature to propose an empirical model representing the relationships between these factors. Second, we structurally estimate the parameter values of the empirical model using data from the processing times of over 220 orders (Becker‐Peth et al. 2013, Ho et al. 2010).
We propose an empirical model for the processing times that depends on learning, congestion and the different team pairings. Reasonably, we assume that volunteers learn from the process of preparing orders. Building on extant literature, we model learning using an exponential function that depends on a constant learning rate (Anzanello and Fogliatto 2011, Leibowitz et al. 2010). Consequently, as volunteers learn from preparing orders, the teams’ order processing times reduce.
We operationalize congestion as the total number of teams in the storehouse. We model the relationship between an additional team in the storehouse and the increase in the order processing time with a quadratic function (Czerny 2010, Gong et al. 2017). The quadratic term indicates that the marginal effect of congestion on processing times increases as the total number of teams grows (Teams). When there is no congestion, the value of Teams is 12. Equation 1 summarizes the relationship between processing times, learning and total number of teams.
We have data for processing times,
We structurally estimate the value of the parameters
Structural Estimation Using Maximum Likelihood
Note
Standard errors in parentheses.
Results show that the expected value of
Simulation Study
We use our previous results to build an agent‐based simulation (ABS) model. We use ABS to study the effects of team pairing and congestion on operational performance in disaster conditions for three main reasons. First, ABS allows us to represent the reality of volunteer management without actually interfering with their task. We start with a scenario under steady conditions, which we model considering field observations, archival data and empirical estimations, but we then simulate disaster conditions for which data are difficult to collect in real life. Moreover, ABS allows us to run different simulation scenarios to study the effects of different factors on order preparation systematically, both individually and in combination.
Second, we chose ABS instead of other simulation techniques, such as system dynamics and discrete‐event simulation, due to the level of detail and evolution of the agents over time that our analysis requires. System dynamics is a useful technique to simulate scenarios with a high level of abstraction using aggregate constructs (Borshchev and Filippov 2004), but our aim is to model the individual processes of the volunteers instead of aggregating them as a construct in the system. On the other hand, discrete‐event simulation is useful to focus on entities. However, these entities are considered passive objects usually (Borshchev and Filippov 2004), and our goal is to model the volunteers as active agents who are able to learn over time. ABS allows us to have both: the detailed focus on volunteer pairing as our active unit of analysis as well as showing the ability to learn by following specified rules.
Third, most volunteer models do not account for heterogeneity in the experience or skills of the volunteers (for exceptions, see Garcia et al. 2018, Lassiter et al. 2014, 2015). Instead, we are interested in studying the setting in which agents are heterogeneous in their experience and their arrivals can lead to congestion in the storehouse, which is typical during disaster response. ABS not only allows us to account for this heterogeneity, but also to model the higher‐level behavior of the system that emerges due to individual‐level interactions, providing a bottom‐up approach (Altay and Pal 2014, Xiang et al. 2005).
We describe the ABS model in detail in the Appendix. Here, we explain the submodels, which match the volunteers’ processes detailed in section 4.3.


Experimental Design
The experimental study consists of a 4 × 2 × 4 design (32 treatments). This design captures the two factors we study—volunteer experience and congestion. It also models four conditions. We model the factor of volunteer experience in pairing by considering four cases. We model the cases where all volunteers arriving at the storehouse are either experienced (Exp) or inexperienced (Inexp). Then, we model the cases where some volunteers are experienced and others are inexperienced, and we analyze two kinds of pairing: mixed pairing (Exp–Inexp) and no‐mixed pairing (Exp–Exp, Inexp–Inexp). We model the factor of congestion by considering two extreme policies: allowing and impeding congestion. The first policy accepts all the volunteers arriving at the storehouse, while the second policy accepts a maximum 12 teams (24 volunteers)—the storehouse capacity.
We contrast the results of the two factors systematically in four conditions, divided in two scenarios. The first scenario corresponds to the steady conditions, which reflect the current operation in the storehouse. In this benchmark scenario, demand is known, volunteer arrivals are controlled and all the orders are always completed. The second scenario includes three disaster conditions: (i) high supply of volunteers and steady demand, (ii) high demand of orders and steady supply of volunteers and (iii) high supply of volunteers and high demand of orders, simultaneously. These conditions apply to disasters that involve a sudden surge in demand and need a fast response (e.g., tornadoes, earthquakes), not slow‐onset disasters (e.g., famines, refugee crises, wars).
The first disaster condition (High Supply) reflects disasters with high visibility in which the convergence of volunteers is very high compared to the real need. One example to illustrate this condition is the convergence of volunteers after the Oklahoma tornadoes in 2013, when “too many volunteers” were interfering with the distribution of relief items (Davis 2013). The second disaster condition (High Demand) reflects disasters in which either the needs of the population surpasses the organization's ability to respond by sending adequate numbers of volunteers or in which there is so little visibility that only few volunteers arrive. Examples of this condition can be seen in the response in Puerto Rico after Hurricane Maria in 2017 (Weir and Clarke 2017) and peaks in demand for food banks (Butcher 2019). The third disaster condition (High Supply and Demand) reflects disasters with high need for volunteers and visibility, making volunteer convergence possible and necessary. For instance, after Superstorm Sandy in 2012, many people were able to help the most affected in different ways, including distributing food and water (Rampell 2012).
Simulation Results
We use NetLogo 6.0 (Wilensky 1999) to simulate all treatments and sensitivity analyses. Each run simulates a day of preparing orders in the storehouse. Each result we report in this section is the outcome of 2000 runs. We simulate 32 treatments and 144 sensitivity analyses, completing over 350,000 runs for all the results.
Scenario 1: Steady Conditions
Table 4 displays the results for the eight treatments in the steady conditions. We include the two performance metrics, order preparation rate at minute 300 and additional time needed to prepare the orders. These results serve as an initial test for the model's structural validity: the system achieves the best operational performance when all the volunteers arriving at the storehouse are experienced, while the worst performance corresponds to the arrival of only inexperienced volunteers. When both types of volunteers arrive, mixed pairing is better than no‐mixed pairing.
Model Results for On‐time Order Preparation and Additional Time to Complete Orders
Note
Standard errors in parentheses.
In steady conditions—our benchmark for comparison—the storehouse only suffers a few minutes of congestion per day, so congestion does not cause big differences in the performance metrics. For instance, we do not find statistically significant differences between allowing and impeding congestion when comparing the additional time to complete orders (Table 4). Therefore, results show no difference between managerial policies that allow or impede congestion. This is consistent with our field observations and the Managers’ perceptions.
We also find that there are small differences in the effects of volunteer experience on the system's performance under steady conditions. We compare first the case when only experienced volunteers arrive to the case when only inexperienced volunteers arrive and congestion is allowed. We find that the on‐time order preparation rate increases only from 97% to 98% (1.03% improvement) and the additional time to complete the orders falls from 45.36 to 32.28 minutes (28.84% improvement). Results also show that a mixed pairing strategy improves the order preparation rate from 97% to 98% when congestion is impeded. This improvement is due to inexperienced volunteers learning from experienced ones. However, when congestion is allowed, the performance of the no‐mixed pairing is as good as the mixed pairing. Allowing congestion increases the number of Exp–Exp teams at the storehouse, which improves the performance of the no‐mixed pairing case.
Model Validation
We verify whether the inputs and outputs of the model capture the original data we collected well. First, we compare the original data on the demand of orders and volunteer arrivals (Table 2) with the simulated data from the ABS model. Table 5 shows that for the inputs, the simulated data are not statistically different from the original data (
Model Validation with Original Data
Note
Standard errors in parentheses.
Second, we compare the performance metrics of the model with those we have collected in our field visits during steady conditions. We focus on the outcomes for mixed pairing allowing congestion because these are the policies that the Managers follow. We compare the original data with the simulated data for the on‐time order preparation rate and the additional time to complete orders. Table 5 shows that for these outputs, the simulated data are not statistically different from the original data (
Sensitivity Analysis
We first conduct a sensitivity analysis on the ratio Exp:Inexp. In the original simulation, the ratio is 1:2 (one experienced for every two inexperienced volunteers in the storehouse). We change the ratio from 1:3 to 3:1. Then, we test the probabilities that determine when a volunteer leaves the storehouse. We change the probabilities by 5 and 10 percentage points. We find that the results are, on average, robust to these changes. The best performance metrics are obtained with only experienced volunteers and the worst ones with only inexperienced. That is, the results for the two pairing strategies lie between 97% and 98% for the on‐time order preparation and between 32.28 and 45.36 minutes for the additional time (allowing congestion). On average, the results for the mixed pairing are better than no‐mixed pairing. However, the differences between the two pairing strategies are not statistically significant.
The analysis of the steady conditions illustrates that our simulation model captures the most relevant dynamics of volunteers in the storehouse and replicates the performance metrics of the current system. Next, we move forward with the study of the disaster conditions.
Scenario 2: Disaster Conditions
In the second scenario, we study how the performance metrics change as a function of increases in demand of orders and supply of volunteers. We model the surges by a factor of four to simulate disaster conditions that can be challenging for the organization but would still be manageable. For the demand, we quadrupled the mean and the variance of the lognormal distribution of the orders used in the steady conditions. For the supply of volunteers, we quadrupled the mean and the variance of the normal distribution of the volunteer arrivals. In this set of simulations, we assume that the organization has enough inventory to complete the orders volunteers process, but the storehouse's capacity of volunteers does not change. Keeping the same capacity means that there is congestion in the storehouse when there are more than 12 teams preparing orders.
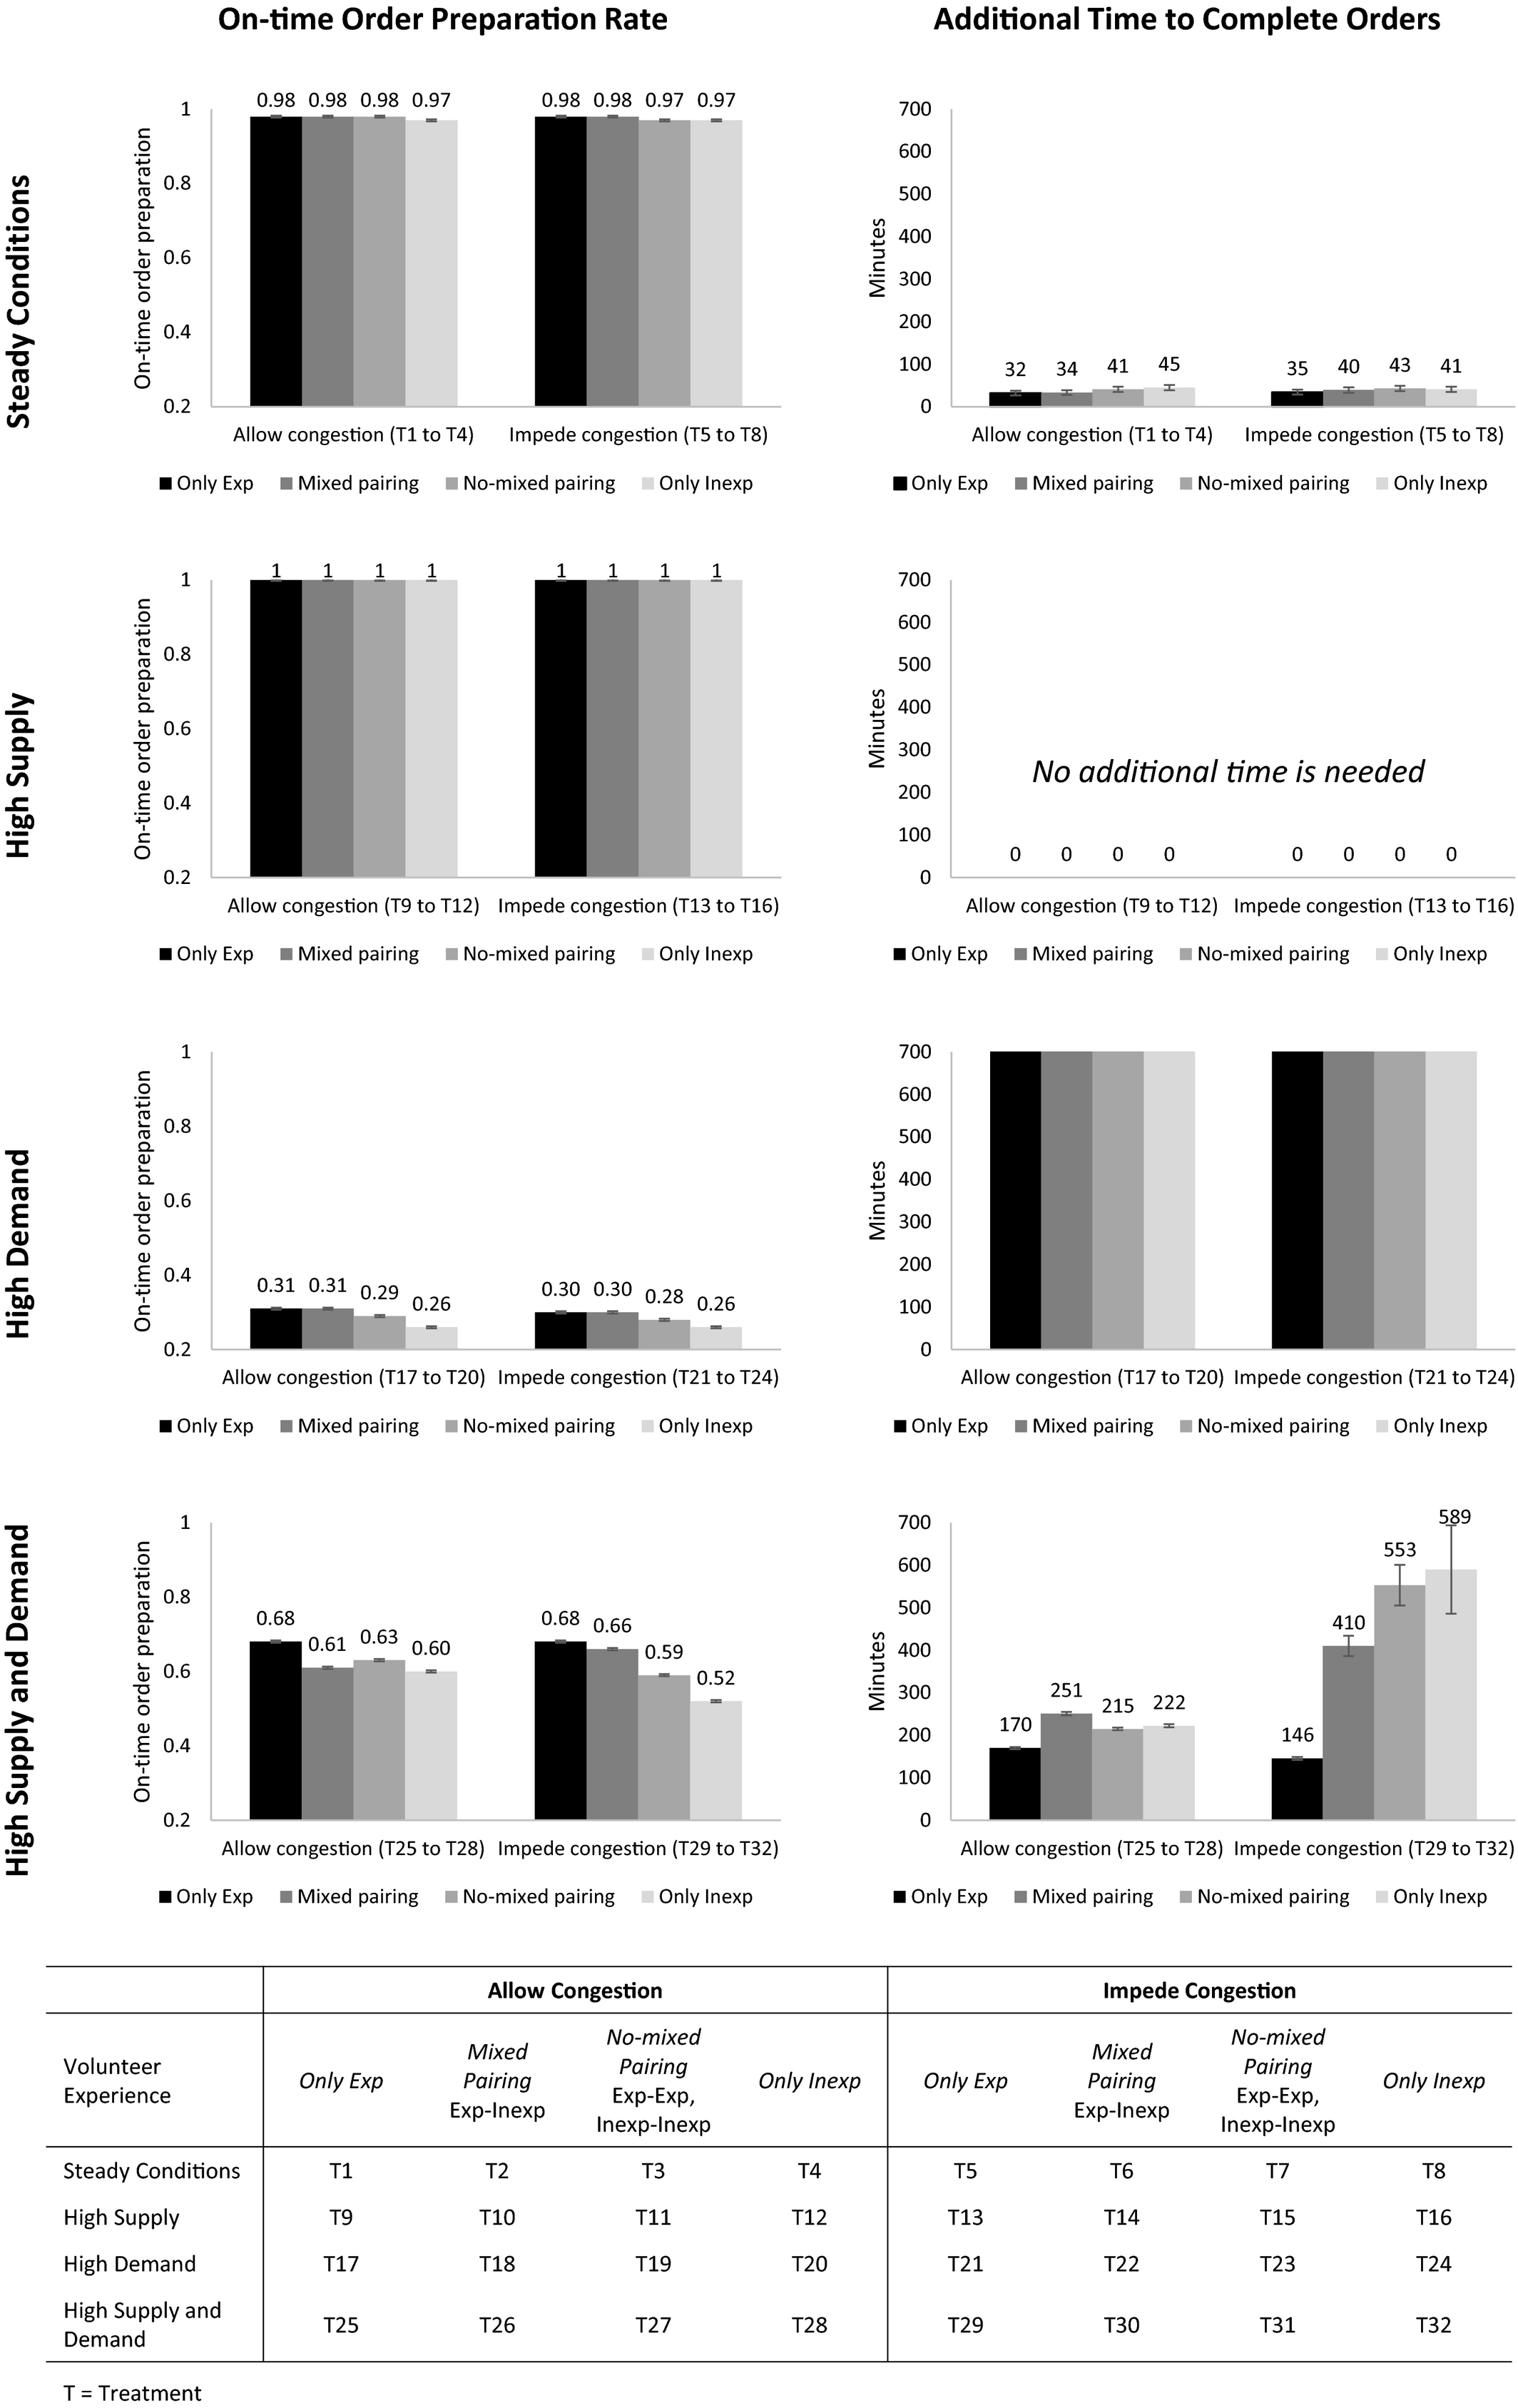
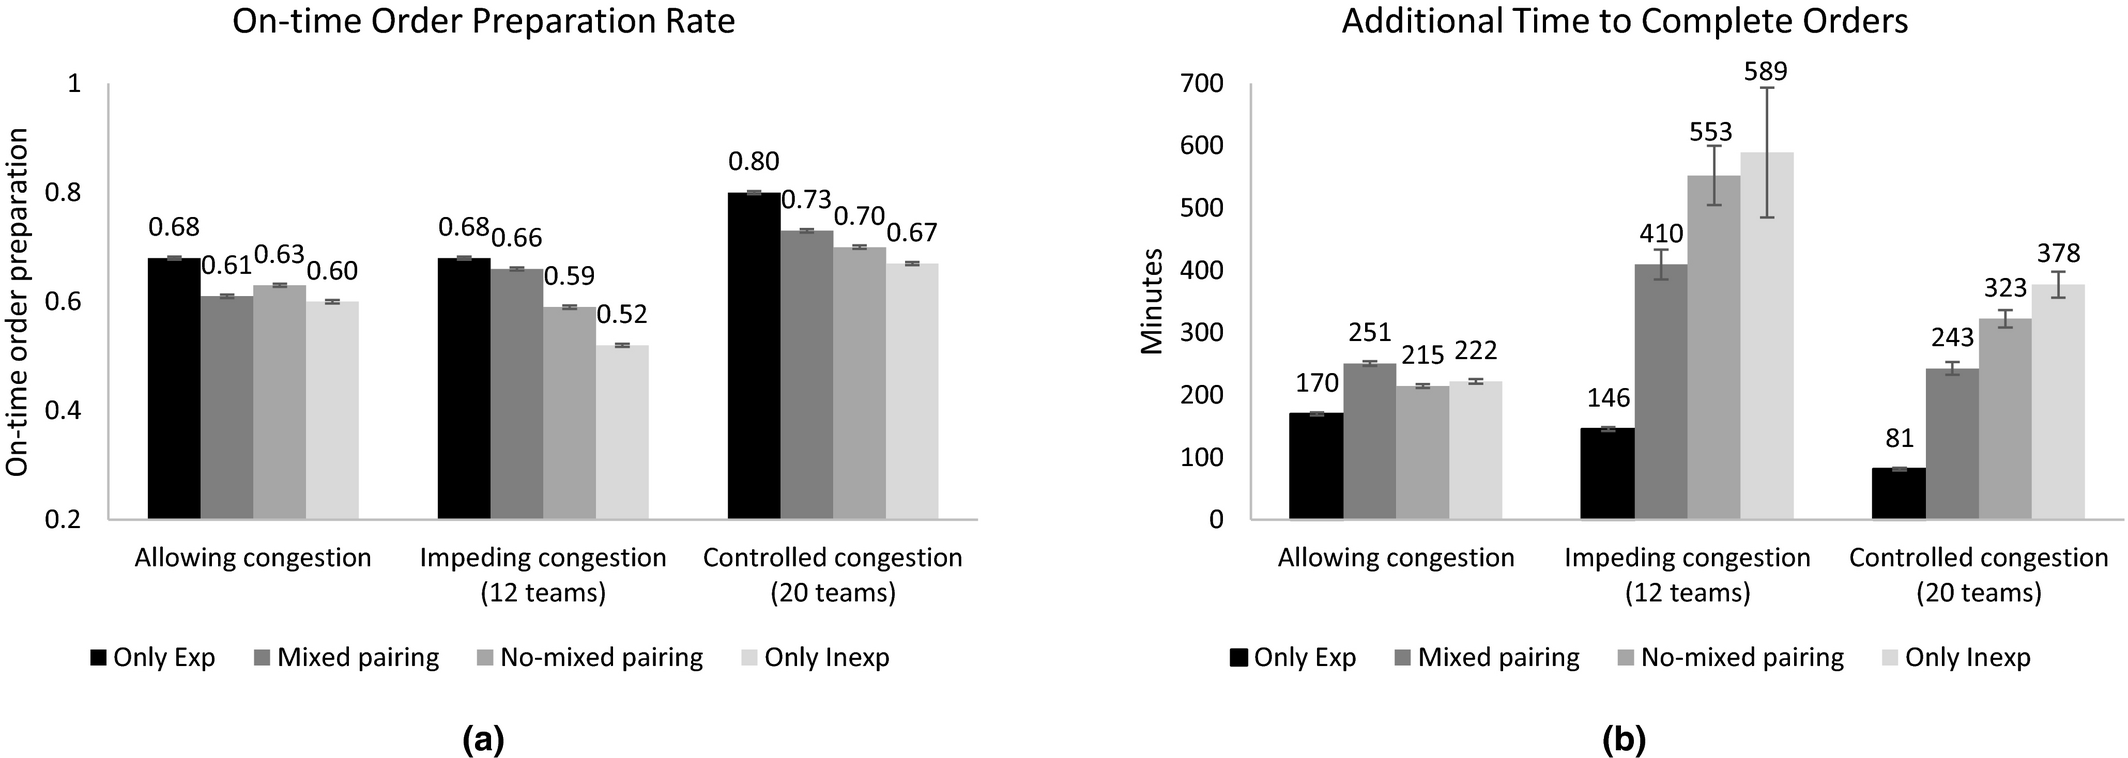
We model these changes systematically by comparing the three types of disaster conditions (High Supply, High Demand, and High Supply, and High Demand) with the steady conditions. Figure 3 displays comparative results for the 32 treatments in the four conditions, including confidence intervals. The first row shows the results for the steady conditions. The following rows display the results for the three disaster conditions. The first column displays the on‐time order preparation rate, while the second column corresponds to the additional time to complete the orders. Each set of bars indicates the results for one of the two congestion policies: allow or impede congestion. The shading of the bars signals the different volunteer experience and pairings.
Model Results for the Three Types of Disaster Conditions in Comparison with the Steady Conditions
High Supply
This condition increases performance at the storehouse: 100% on‐time order preparation and no additional time to complete orders. There are no differences between pairing strategies or congestion policies. We explain this result by building on the current efficient performance of the storehouse under steady conditions. Under steady conditions, volunteers prepare almost all the orders on time (i.e., within the expected 5 hours). If more volunteers arrive at the storehouse, the availability of teams increase and all the orders are completed on time. Therefore, we find that a high supply of volunteers is good for the on‐time preparation of orders. This condition, however, has a potentially negative impact on volunteers. As orders are completed more quickly, there are volunteers that cannot help because they may arrive to the storehouse when there are no orders left to prepare.
High Demand
This condition deteriorates the performance metrics: the on‐time order preparation rate decreases and the additional time to complete the orders becomes so high (in the simulation, over 24 hours) that volunteers are not able to finish all the orders in 1 day realistically. This result means that some beneficiaries will not receive their relief items. When volunteers with heterogeneous experience arrive, we find that the best pairing strategy is mixed pairing, which allows inexperienced volunteers to learn from experienced ones. For all the experience levels, we find small differences (statistically significant for the on‐time order preparation) between policies that allow or impede congestion. When there is high demand of orders, it is best to allow congestion and complete as many orders as possible on time.
High Supply and High Demand
This condition results in worse performance than the steady conditions and the disaster condition of High Supply but has better performance than the disaster condition of High Demand. Similar to the steady conditions, we find that when there is a policy of impeding congestion, mixed pairing is better than no‐mixed pairing. However, impeding congestion increases the additional time to complete the orders for both pairing strategies. When congestion is not allowed, many volunteers leave the storehouse, which eventually reduces the number of people available and increases the additional time required to complete the orders.
Strikingly, when congestion is allowed in the storehouse, the no‐mixed pairing strategy is better than the mixed pairing strategy. No‐mixed pairing improves the on‐time order preparation rate by 4.32% and the additional time to complete the orders by 14.42% compared to mixed pairing. These improvements are statistically significant. The shift in the performance of the pairing strategies is due to the higher availability of experienced volunteers in the storehouse when congestion is allowed. As experienced teams already have the required skills to prepare orders, they suffer less from congestion. Instead, inexperienced volunteers take longer to learn, slowing down experienced volunteers in the mixed pairing. This condition makes the work of Exp–Exp teams more operationally efficient than pairing them with inexperienced volunteers to facilitate collaboration and learning. Therefore, under disaster conditions with high supply and high demand with a policy of allowing congestion, the organization should follow a no‐mixed pairing strategy.
In this disaster condition, neither of the two congestion policies dominates (Figure 4). For mixed pairing, it is best to impede congestion. However, for no‐mixed pairing, the best policy is to allow congestion. Therefore, our results show that when there is a disaster condition combining high supply of volunteers and high demand of orders, it is not clear what congestion policy should be applied. We analyze this finding further in Section 7.3.
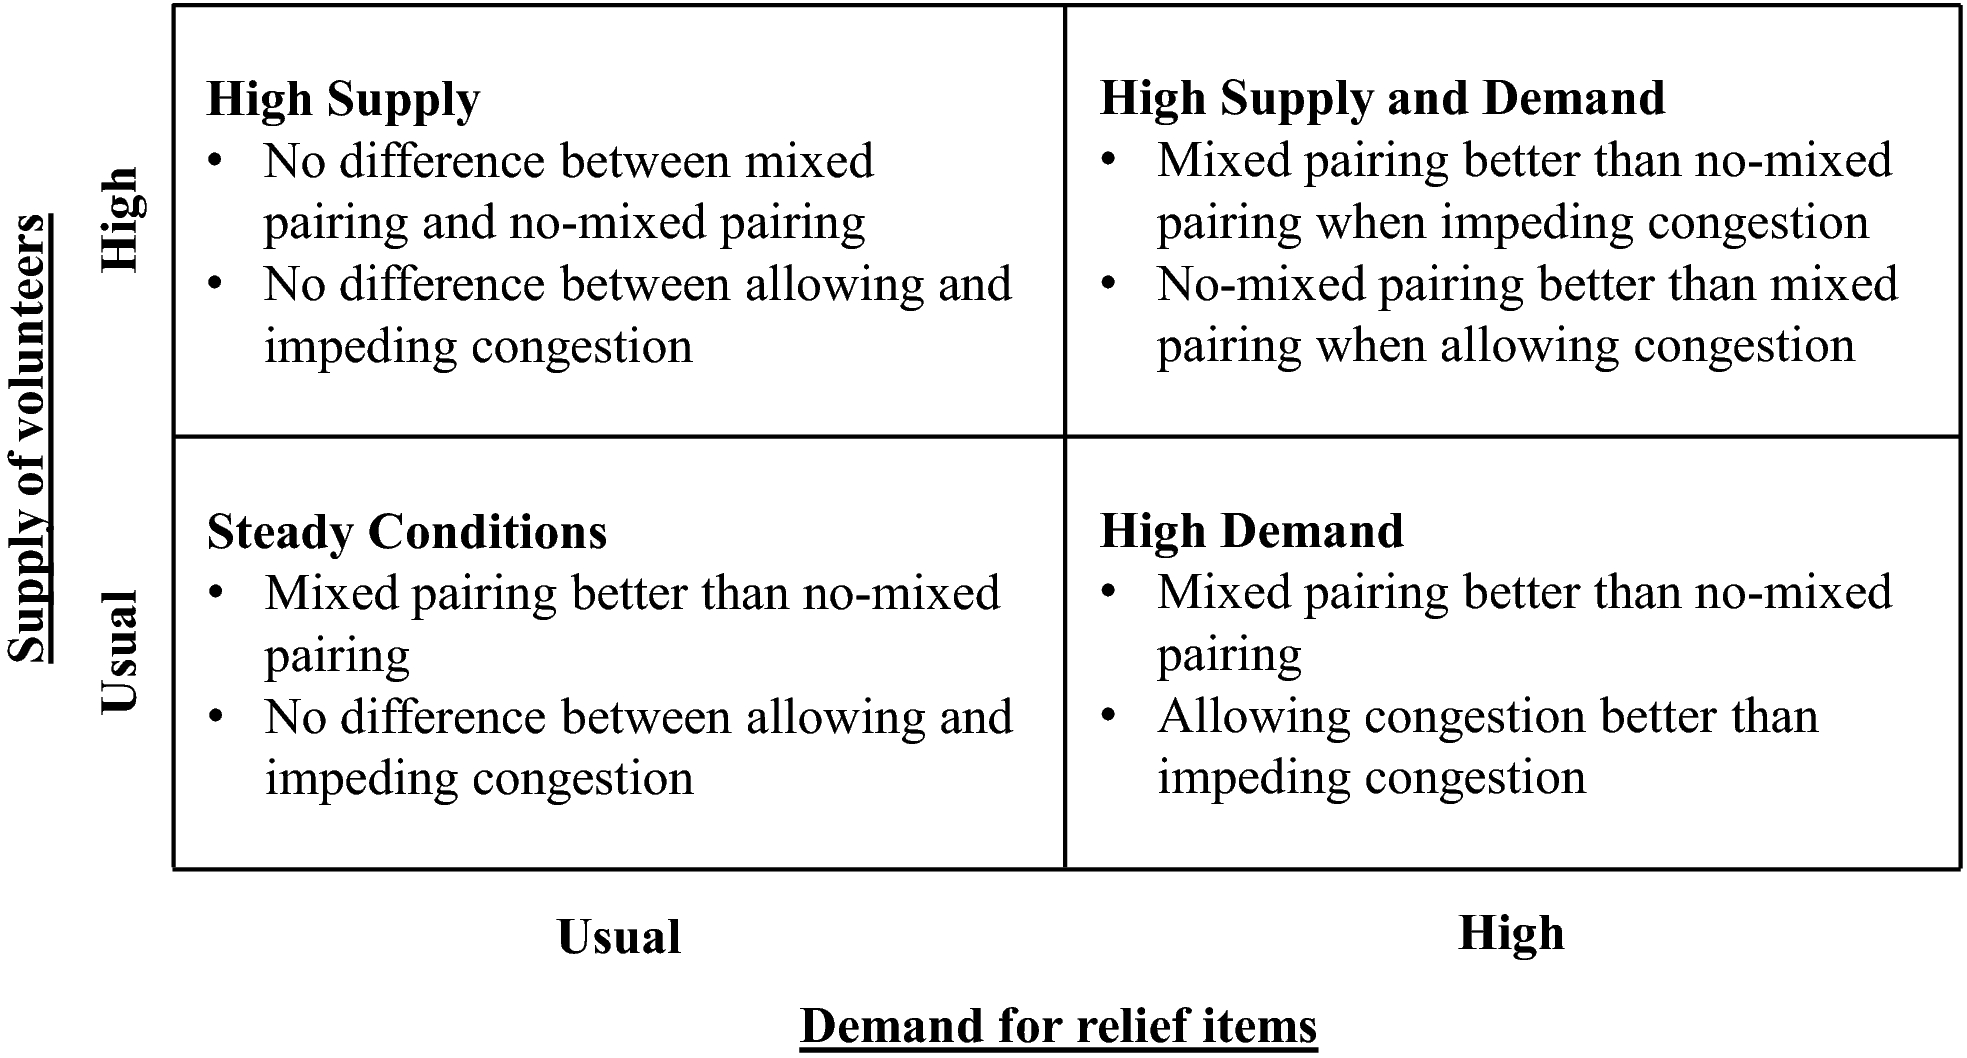
Summary of Findings for All Conditions
In summary, under steady conditions, collaboration between experienced and inexperienced volunteers improves performance because experienced volunteers boost the learning process of inexperienced volunteers. During disaster response allowing congestion, however, this collaboration hurts operational performance because inexperienced volunteers learn less quickly—due to system congestion—and slow down the experienced volunteers.
Sensitivity Analysis
We run four sets of sensitivity analyses for the disaster conditions. We consider (i) changes in the increase of supply of volunteers and demand of orders, (ii) unlimited supply of goods, and variations in the values of (iii) the learning rate
In (i), we change the increase of supply of volunteers and demand of orders with factors 2 to 5. For all the factors, we find the same behavior for the high supply condition and high demand condition. For the high supply and high demand condition, we find that the reverse effect between mixed and no‐mixed pairing increases when we use greater factors.
In (ii), we test the assumption of unlimited supply of goods at the storehouse. When we limit the supply of goods, there are two cases. First, if there is only one item out of stock, the preparation and distribution of orders may still take place without the specific item. Our model works well for this case. Second, if all the items are out of stock, then order preparation and distribution is infeasible. Hence, we cannot get an insight on volunteer management as it relates with order preparation.
In (iii) and (iv), we test the findings for the high supply and high demand condition to variations in the values of the learning rate
Figure 5 illustrates the results for the on‐time order preparation rate with a policy of allowing congestion for (a) changes in
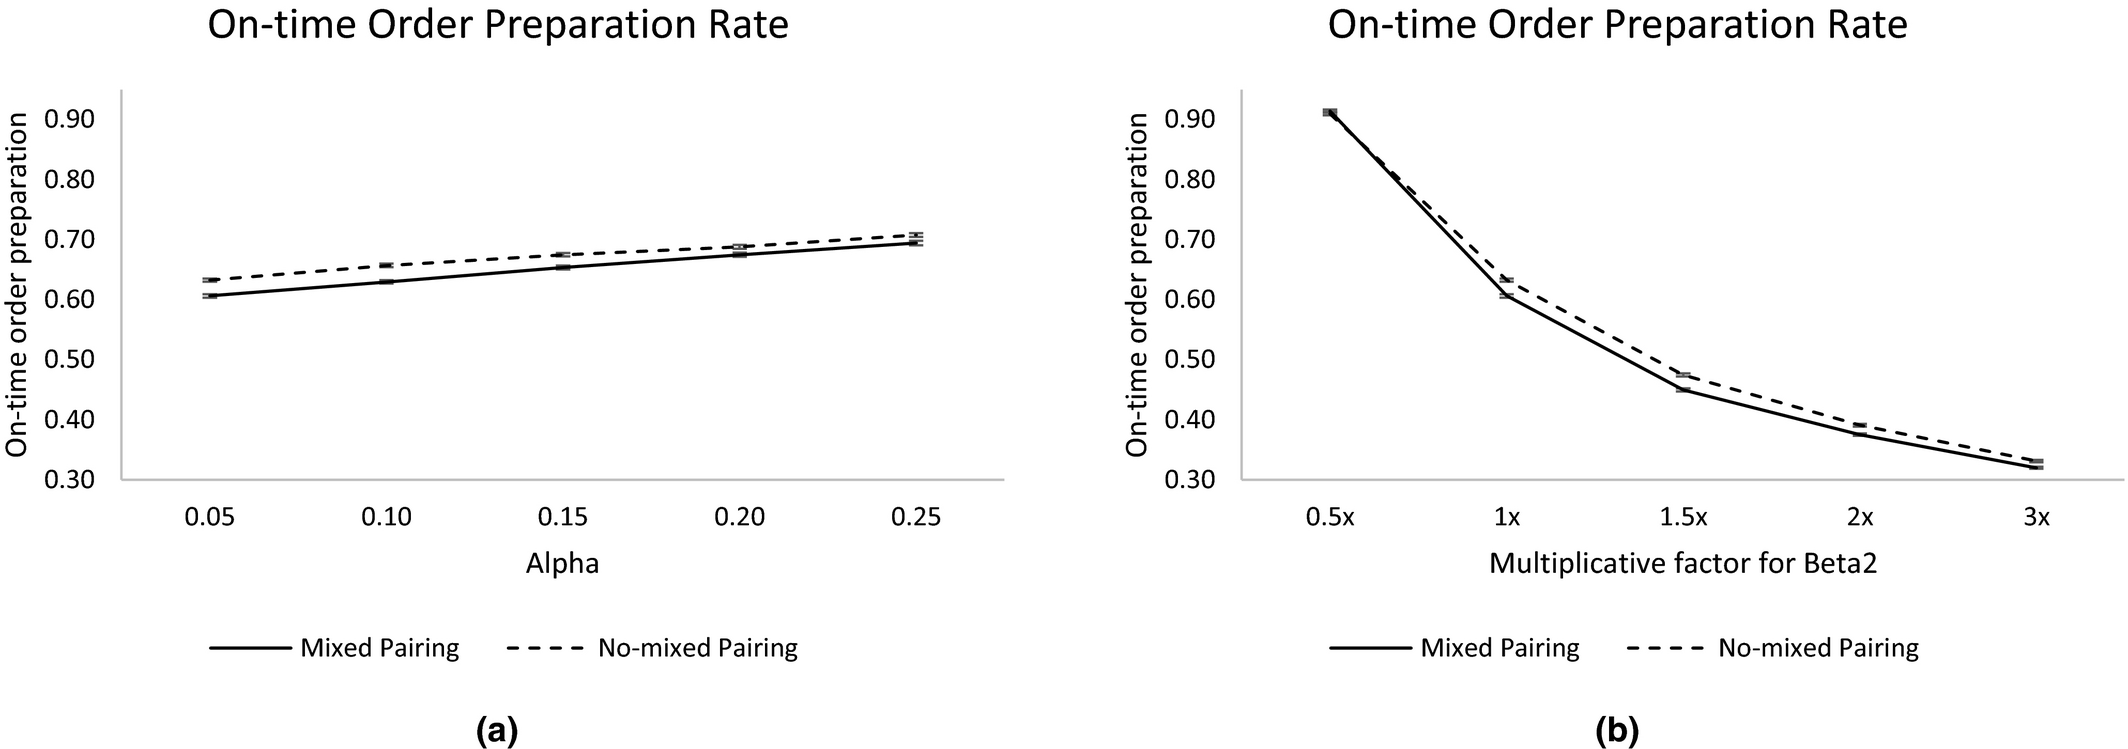
Sensitivity Analysis for Changes in
Proposing an Alternative Policy
As discussed in section 7.2.3., it is unclear whether the organization should follow a policy of allowing or impeding congestion during disaster conditions that involve high supply and high demand. We argue that in these disaster conditions, implementing an alternative policy that accepts controlled congestion in the storehouse may balance the trade‐offs between the two extreme policies of completely allowing or impeding congestion. Controlled congestion reduces the number of volunteers who cannot enter the storehouse and increases the speed of the fully congested system. The controlled congestion we propose is to accept up to 8 additional teams over the 12 team capacity.
Figure 6 presents the results of the three policies for the high supply and high demand condition: allowing congestion, impeding congestion (maximum 12 teams in the storehouse) and accepting controlled congestion (maximum 20 teams in the storehouse). Results show that controlled congestion increases the on‐time order preparation rates compared to the other two extreme policies. As more volunteers enter the storehouse, the additional time to complete the orders reduces in respect to the policy of completely impeding congestion and results are similar to the policy of completely allowing congestion. Therefore, the alternative policy has the potential to improve the performance metrics of the organization's operations and satisfy the beneficiaries’ needs on time.
Results of the Three Congestion Policies for the Disaster Condition of High Supply and High Demand
In summary, during disaster response, a policy that accepts controlled congestion balances the negative effects of completely allowing or impeding congestion, hence enhancing the operational performance.
Sensitivity Analysis
To understand the benefits of controlled congestion better, we vary the maximum number of teams allowed in the storehouse from 12 (impeding congestion) to 32. We focus on the effects of the two pairing strategies. Figure 7 displays the results for the two performance metrics using different policies of controlled congestion.
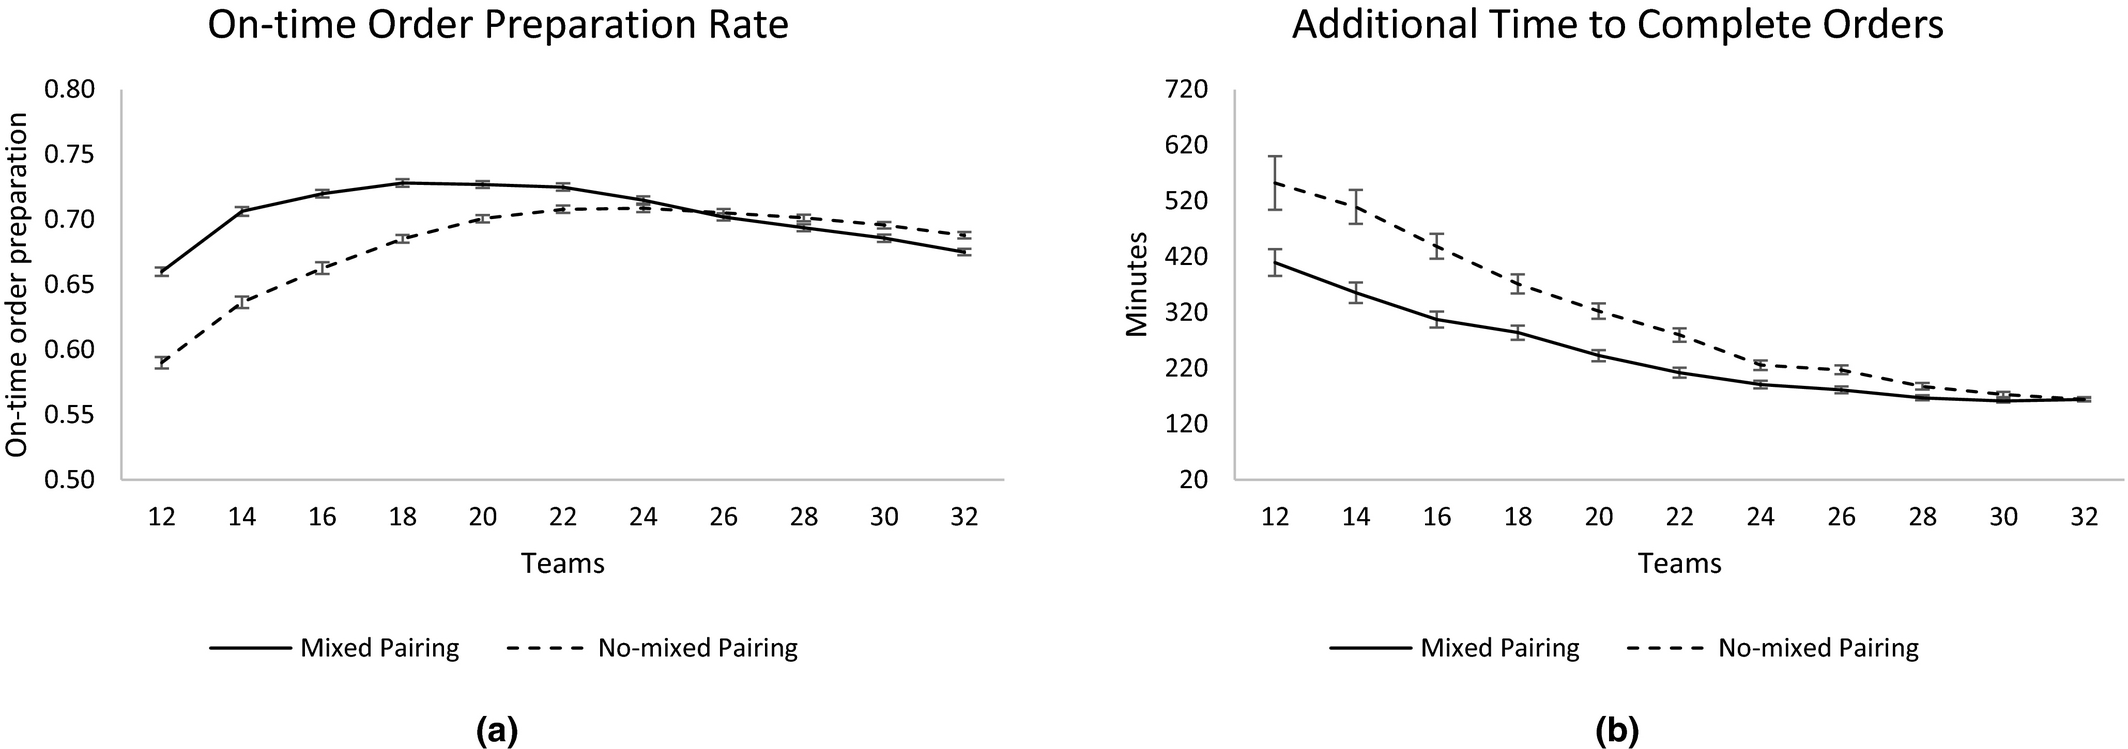
Results for Different Policies of Controlled Congestion
We find that the on‐time order preparation rate follows an inverted U‐shape for the two pairing strategies. That is, this performance metric increases with the number of teams in the storehouse only up to a point, after which performance declines. More teams in the storehouse increase the on‐time order preparation rate—despite the reduction of speed—because more orders get prepared simultaneously. The amount of congestion that gives the maximum positive benefits is 18 teams for the mixed pairing and 24 teams for the no‐mixed pairing. Furthermore, Figure 7a shows when the performance of the no‐mixed pairing prevails over the mixed pairing. If more than 25 teams are allowed in the storehouse, no‐mixed pairing works better than mixed pairing. Figure 7b shows the benefits of allowing congestion. Allowing more teams in the storehouse reduces the additional time to complete the orders because there are fewer volunteers leaving the system.
Conclusions
We use a multi‐method approach by combining a field study with empirical estimations and agent‐based simulation to investigate volunteer management in a charity storehouse. We replicate the steady operations of a storehouse and simulate disaster conditions in order to investigate the effect of volunteer management on performance. We study three types of disaster conditions: high supply of volunteers, high demand of orders and both high supply of volunteers and high demand of orders. We analyze two operational performance metrics for the organization's storehouse: on‐time order preparation rate and additional time to complete the orders.
We find that when the charity storehouse manages volunteers with heterogeneous experience levels, the best pairing strategy depends on the system conditions, so collaboration between experienced and inexperienced volunteers is not always the best choice. Disaster conditions (high supply of volunteers and high demand of orders) limit the effectiveness of collaboration in storehouses. When congestion is allowed, the no‐mixed pairing strategy (pairing volunteers with similar experience levels) has better performance in the on‐time order preparation rate than the mixed pairing strategy (pairing experienced with inexperienced volunteers). This is because inexperienced volunteers learn less quickly, slowing down the experienced volunteers. That is, contrary to extant literature—which emphasizes the benefits of training, collaboration and information sharing (Lassiter et al. 2014, 2015, Lee et al. 2011, Siemsen et al. 2007, Urrea et al. 2016)—we find that disaster response establishes boundary conditions for the effectiveness of collaboration. This finding is consistent with different sensitivity analyses, including changing the volunteers’ learning rate and the congestion effect on performance.
Under the high supply and high demand condition, we also find that an alternative policy that accepts controlled congestion in the storehouse outperforms the extreme policies of completely allowing or impeding congestion. Controlled congestion works better because it balances the negative consequences of the extreme policies. It increases the speed of the fully congested system and reduces the number of volunteers who cannot enter the storehouse. This finding is consistent with changes in the number of teams working simultaneously in the storehouse.
Under steady conditions—the benchmark scenario—our results match the literature. We find that charities should follow a strategy of mixed pairing because this strategy facilitates coaching, boosting the learning of inexperienced volunteers. Our findings show no differences on performance between managerial policies that allow or impede congestion under the steady conditions. This result remains consistent when there is only an increase in the supply of volunteers or an increase in the demand of orders.
Our results not only enrich the literature on humanitarian operations and volunteer management, but also have managerial implications for organizations that rely on heterogeneous volunteers—experienced and inexperienced—to run their operations (e.g., food banks and humanitarian organizations). We find that under steady conditions inexperienced volunteers benefit from the interaction with experienced ones. Hence, charities should teach experienced volunteers how to deliver hands‐on training to inexperienced volunteers to accelerate their learning process. However, volunteers may converge during disaster conditions and congestion may negatively affect the organization's operations. As the managerial insights for the congestion policies are not straightforward, charities need to evaluate the consequences of congestion policies that completely allow or impede congestion. Under steady conditions, charities can allow congestion to let all volunteers participate and gain satisfaction from helping. Under disaster conditions that involve high supply of volunteers and high demand for goods, charities should consider allowing controlled congestion in their operations.
We limit the scope of our research to study the consequences of policies that allow or impede congestion in the storehouse only for a day of order preparation. We exclude the consideration of future behavioral consequences of the congestion policies. For instance, when congestion is allowed, volunteers may dislike the experience and decide either to leave early or not come back in the future. On the contrary, when congestion is impeded, volunteers that are not allowed to help may be discouraged and decide not to contribute more to the organization in financial or time donations. Our current model is not intended to draw conclusions or recommend policies to minimize these kinds of behavioral‐related issues of congestion policies.
Future research on policies for adequate volunteer management can explore the impact of the behavioral aspects of congestion and training programs on the operational performance of charities. Moreover, future work can model the birth and death processes of volunteers with the organization endogenously by considering how current pairing strategies or congestion policies may influence the future supply of volunteers.
Footnotes
Agent‐Based Simulation Model
Acknowledgments
The Swiss National Science Foundation supported this research through grants P1TIP1_171887 and P1TIP1_178664. We thank the faith‐based organization and their volunteers for their support to our research. We gratefully acknowledge the insightful recommendations from the editorial team.