
Abstract
The diffusion of technological innovations in developing economies has been facilitated by the use of rent‐to‐own business models, which give flexibility to customers by allowing them to make incremental payments over time. Understanding the implications of this flexibility is a fundamental problem for an increasing number of firms operating in these markets. In this study, we empirically analyze how consumer usage and payment behaviors interact in an application of rent‐to‐own to the distribution of solar lamps in developing countries. By exploiting the longitudinal variation in the data—and hence accounting for intrinsic differences between customers—the analysis led to three main insights. First, higher usage rates lowered the probability of late payments by customers. Our characterization of this engagement effect enhances existing knowledge of the drivers of payment behavior in these environments. Second, customers often “bundled” payments, making advance payments for future product access. We showed that bundling the initial payment led to lower usage rates (bundling effect), suggesting that firms may not benefit from advance payments upfront, and that they should closely track usage patterns from these customers. Finally, we showed that first‐period usage information can improve the accuracy of predictive models of default and that observing usage rates in subsequent periods does not lead to further improvements. Overall, the analysis highlights the importance for firms of jointly tracking and analyzing payment and usage behavior by customers, particularly in initial stages of the adoption process.
Introduction
The diffusion of technological innovations in developing economies represents an opportunity for firms to address important societal problems, with the potential to have an impact on a large number of people. At the same time, participating firms are introducing products of non‐trivial value in markets where target customers are low‐income households, for which income can be not only low, but also irregular. The high level of uncertainty and limited knowledge about consumer behavior can make it inherently challenging for firms to successfully operate in these markets.
Rent‐to‐own (RTO) business models are being increasingly used in the developing world by firms in sectors such as off‐grid energy, household improvement, and agriculture (e.g., see
One sector in which RTO has gained considerable momentum is off‐grid energy. Worldwide, more than 1 billion people do not have access to electricity; by 2030, 675 million people are expected to continue in that condition, 90% of them in sub‐Saharan Africa (IEA 2017).
Moreover, in countries such as Kenya, Tanzania, and Uganda, electrification rates in rural areas are often below 10%. Recent studies have shown that electrification rates can remain low even in territories with significant investments in nearby grid infrastructure (Lee et al. 2016). In that context, many companies recently started commercializing off‐grid energy products not only in Africa, but also in parts of Asia, Central America, and Latin America (Alstone et al. 2015). These companies—which are introducing products that range from basic solar lamps to complete solar home systems—usually have very limited information about their customers beforehand, facing significant uncertainty. Indeed, access to these products might constitute the first “credit history” in customers’ lives.
Industry publications have noted the importance of this problem. For example, Moreno and Bareisaite (2015) highlighted that “…it is not clear whether fully flexible options for pay‐as‐you‐go off‐grid electricity can be offered successfully. What is now required is clear evidence of regular payments on a larger scale… Data that provides an understanding of customers’ behavior builds confidence in the financial sector.” Similarly in the academic front, Plambeck (2013) noted the importance for cleantech firms to fully understand the implications of consumer behavior, e.g., to adapt their operations to mitigate or deal with variability in customer behavior. How customers actually behave in these flexible environments is, of course, an empirical question, but one that has very important consequences for the viability of an increasing number of firms operating in these markets.
This study takes a step in that direction, by empirically analyzing the interaction between usage and payment behavior of RTO customers in developing countries. More specifically, we focus on three main aspects of this interaction. First, we examine whether higher usage rates lead to better payment behavior. Second, we study whether the flexibility given to customers in terms of the payment schedule has implications for how customers use the device. Third, we analyze the value of usage data in predicting payment behavior. Studying these three aspects of the link between payment and usage behavior advance our understanding of rent‐to‐own business models by establishing, for the first time in the literature, how payment and usage behavior interact in these environments. Moreover, the analysis of this question leads to several managerial implications for firms implementing rent‐to‐own business models in practice.
The analysis is based on a transactional dataset from a company that commercializes off‐grid energy products in the developing world. Customers in our sample purchased an entry‐level solar lamp in different parts of Africa and Asia under RTO, with expected repayment terms ranging from 5 to 10 weeks. The dataset includes a granular characterization of usage rates and payment behavior during the adoption period. We exploit the longitudinal variation in the data to account for intrinsic differences between customers, establishing three main insights. First, usage patterns played a role in explaining lateness in payments. Indeed, we documented an engagement effect, indicating that higher usage rates led to lower probability of late payments by customers. Although it is well known that liquidity constraints and transaction costs are important drivers of payment behavior in the developing world, our findings imply that not only these factors but also user engagement affect payment behavior in RTO. Firms operating in these environments should thus closely monitor usage behavior and identify ways that keep consumers engaged, as this can contribute to lowering their default rates and the associated operational costs. This speaks to the relevance of establishing—to our knowledge, for the first time in this context—the existence of an engagement effect specifically in developing economies.
Second, customers often “bundled” weekly payments, making advance payments for product access in future weeks. We established that bundling payments upfront (i.e., paying more than just the down payment) led to lower usage rates, illustrating another way in which usage and payment behavior interact. The fact that this bundling effect only occurs in the upfront payment but not in subsequent weeks, may be related to the customer's missed opportunity of an early interaction with a collecting agent to rapidly address any questions about product usage that may initially emerge. Hence—and perhaps counterintuitively—although bundled payments generally seem appealing, firms may not want to encourage this behavior in the upfront payment, as it can lead to reduced consumer engagement. Alternatively, firms would benefit by tracking very closely the usage patterns of customers who bundled payments upfront, proactively monitoring their engagement. Moreover, firms will want to pay special attention to train such customers at the time of adoption and ensure they are well familiar with all features of the product upfront. Our analysis thus identified whether the upfront payment was bundled as a useful segmentation variable in the context of firms targeting training, recovery and customer support efforts.
Finally, building on the insights derived from our econometric models, we developed predictive models of default. They revealed that initial‐period usage information can improve predictive accuracy and that observing usage rates in subsequent periods does not lead to further improvements. This highlights that firms can benefit by using first‐period information to promptly identify riskier customers as well as potential upselling opportunities. RTO firms introducing assets of non‐trivial value in developing economies operate in an inherently risky environment, and the operational costs associated with the recovery of a defaulted device can be quite high. Our results show that tracking usage rates can help these firms in the design and targeting of more effective pre‐emptive efforts, e.g., by proactively reaching out to consumers to troubleshoot usage issues in early stages.
To our knowledge, this is the first paper to characterize how usage and payment behaviors interact in RTO. Studying this interaction is important as new business models are testing in low‐income markets. More generally, firms providing access to new technologies in the developing world are increasingly collecting detailed usage data. Our analysis should be a useful illustration of how business analytics tools can be used in combination with granular consumer behavior data to generate insights relevant for firms operating in these markets.
Related Literature
This study belongs to the growing business literature on developing economies. In operations management (OM), Lee and Tang (2018) and Sodhi and Tang (2014) provided an overview of problems relevant for the operations of firms in emerging markets. Recent examples in this literature include Chen and Tang (2015), Acimovic et al. (2018) and Kalkanci et al. (2018). Marketing issues in developing economies have been similarly highlighted (Narasimhan et al. 2015), with recent applications including Miller and Mobarak's (2015) and Economides and Jeziorski's (2017).
Within that context, the topic of off‐grid energy products in the developing world has certainly attracted attention in the academic community. Although most existing research is in the form of conceptual discussions and case studies (Reichert and Trivella 2015, Urpelainen and Yoon 2015) or theoretical models (Uppari et al. 2019), there are some related empirical applications. For example, a stream of empirical research has focused on understanding the adoption process for clean energy products in developing economies, such as lighting fuels in Kenya (Lay et al. 2013), solar lanterns in India (Yoon et al. 2016), and cookstoves in Uganda (Levine et al. 2018).
More generally, there is a long‐standing literature on development economics and microfinance (Banerjee 2013), in which risk management and default have been the subjects of considerable attention (Banerjee and Duflo 2010). For example, authors have investigated the trade‐off between discipline and flexibility (Jain and Mansuri 2003, Labie et al. 2017), and consumer behavior in microcredits (e.g., Bauer et al. 2012, Dupas and Robinson 2013).
The literature on contract theory provides another relevant stream. In the OM context, Lariviere (2015) provided an overview on supply chain contracting. As noted there, as well as by Cachon (2003), empirical work on the topic has been scarce until very recently; one exception is Guajardo et al. (2012) and their analysis of contracting for after‐sales services in the aerospace industry. A related research stream in OM has focused on the design and implementation of innovative business models (Girotra and Netessine 2014). For example, Guajardo (2018) analyzes the adoption of solar energy systems in the US non‐residential market under different business models. More recently, Plambeck and Ramdas (2019) examine business model innovation with a focus on poverty alleviation and women empowerment.
More related to the type of contracts analyzed in this study, consumer behavior in RTO has been a topic of interest in the context of western economies. For example, authors have conceptually analyzed the flexibility of RTO (Anderson and Jackson 2001), and formulated analytical models with some data calibration to examine implicit interest rates (Walden 1990) and pricing (Jaggia et al. 2019) in RTO contracts. There also are descriptive empirical analyses of RTO in the US retail sector, e.g., examining customer characteristics and contract outcomes in RTO (Anderson and Jaggia 2009), comparing payment behavior under different contract terms (Anderson and Jaggia 2012), and describing associations between customer characteristics and preference for RTO based on survey data (McKernan et al. 2003).
Although existing studies have shed light on important aspects of consumer behavior in RTO environments, our study contributes an important new dimension. Indeed, the availability of detailed usage data allows us to analyze, to our knowledge for a first time in the context of RTO models, several aspects of the interaction between usage patterns and payment behavior in these settings. The empirical study of this interaction based on transactional data from multiple countries allows us to establish three important insights, contributing to a more complete understanding of consumer behavior and the respective implications for firms operating in the developing world.
Research Setting and Data
In recent years, there has been a proliferation of companies introducing a wide range of pay‐as‐you‐go (PAYG) products. Recent reports have identified nearly 30 PAYG companies offering off‐grid energy products in at least 32 markets (Alstone et al. 2015). These companies are commercializing products that range from solar lamps that could sell for USD $10–$60, to solar home systems that could sell starting at USD $200 and reach much higher prices (Winiecki and Kumar 2014). Geographically, these initiatives have focused primarily on Africa (e.g., Kenya, Tanzania) and Asia (e.g., India, Pakistan) but also span parts of South America (e.g., Colombia, Peru), Central America (e.g., Guatemala), and the Caribbean (e.g., Haiti). According to recent industry estimates, in 2017, the off‐grid solar sector improved electricity access for 73 million households (Lighting Global/GOGLA 2018 report). The same report offers anecdotal evidence on the societal impact of such technologies, e.g., suggesting they can have a positive impact on health and education (pp. 171–172).
The main idea behind PAYG is that consumers—as opposed to paying the full price of the products upfront—can make incremental payments that enable product access for a certain period of time. Most PAYG implementations belong to one of two broad categories: service models, where product access is sold as a service without transferring ownership and RTO models, where customers make incremental payments to eventually own the product. The majority of existing PAYG companies use RTO (Winiecki and Kumar 2014), which is also the context relevant to this study.
In the RTO setting, we analyze, a customer gains access to a device after making a down payment (e.g., 20% of the product price, which is also known as an unlock price), which enables product use for a week. In order to keep the product enabled, the customer needs to make incremental payments in subsequent weeks over the repayment term (i.e., the nominal time in which customers who follow a schedule of regular weekly payments become owners of the product). Eventually, once payments equivalent to the full unlock price have been made, the customer becomes the owner of the product, and the device is continuously enabled without the need for additional payments.
Although these “contract terms” are communicated to the customer upfront, they serve merely as a reference given the inherent levels of flexibility in RTO. To illustrate, consider a product with an unlock price of USD $15, a down payment of 20%, and a repayment term of 4 weeks. Hence, one schedule of payments that would keep the product enabled at all times consists of a down payment of USD $3, followed by 4 weekly payments of USD $3 each, as shown in the left panel of Figure 1 (Letters E and D in parentheses denote whether the product is enabled or disabled). We will refer to this case of regular payments of equal size over the repayment term as the “expected” stream of payments. Although the expected stream of payments is a useful reference, customers can behave more flexibly and many other realizations are possible. For example, consider the case of a customer making the 20% down payment, then making the expected payment in week 1, subsequently missing the third payment in week 2, and finally making a payment of USD $9 in week 3 (right panel in Figure 1). In the latter case, the customer would have the product disabled for a week and would become the owner of the product in 3 weeks, departing from the “expected” stream of payments.
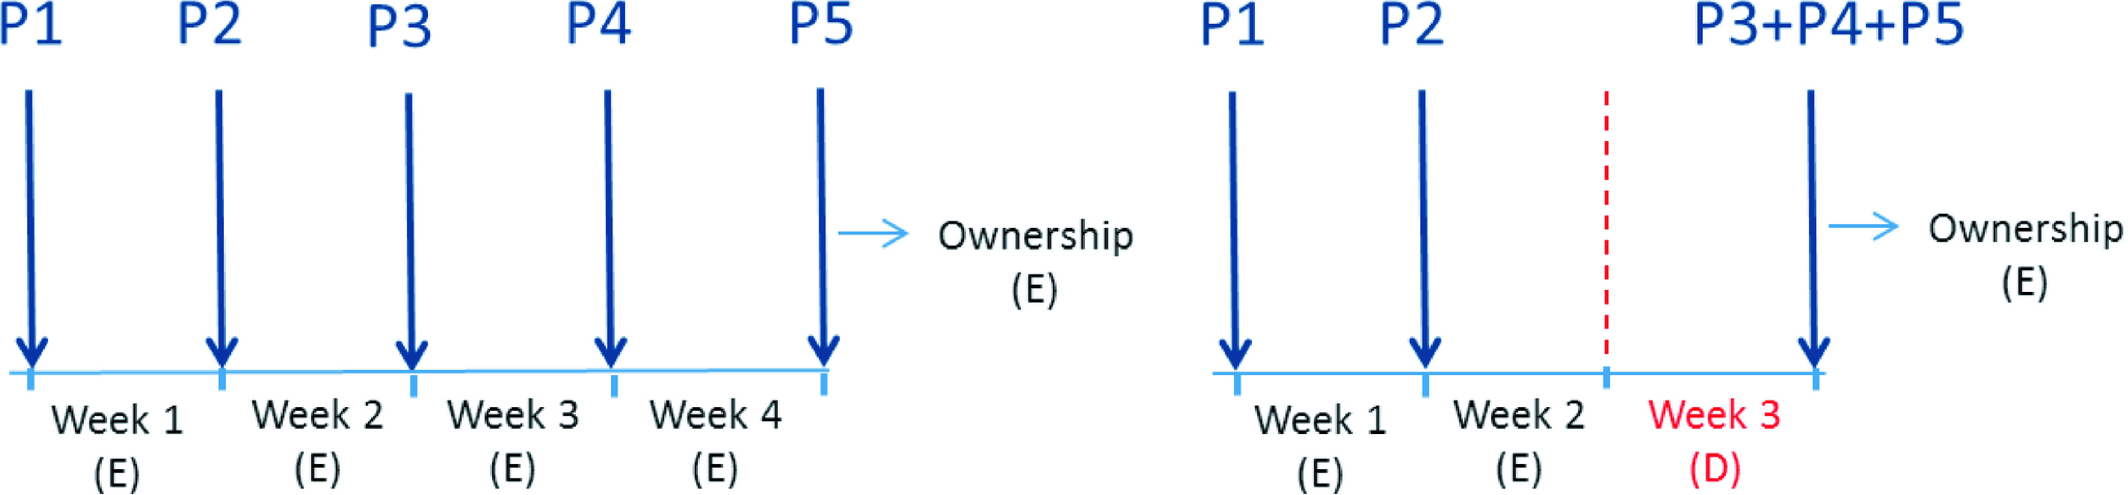
Illustration of Rent‐to‐Own: Two Potential Instances [Color figure can be viewed at
The author partnered with a PAYG technology company, which made available an anonymized version of its transactional data for this research. This company works with manufacturers and distributors to sell different products in the developing world. The analysis will focus on the company's entry‐level solar lamp—a small basic solar lamp—, which is one of the most common products sold by PAYG companies.
Table 1 describes the accounts in the sample of analysis. The sample covers four countries (Kenya, Tanzania, Uganda, India), and there is only one distributor per country. Due to the low cost of the product (unlock price around USD $15), the repayment terms used by these distributors are relatively short—customers are expected to make weekly payments over 5–10 weeks, depending on the distributor. The down payment is fairly uniform across distributors, ranging from 20% to 26% of the unlock price (only one distributor had a longitudinal change for this variable, from 20% to 23%). All distributors use time‐based pricing, that is, a regular payment provides a week of product access, regardless of how much a product is used during that week. The analysis focuses on 882 accounts—opened between September 2014 and October 2015—for which we observe both payment and usage behavior, 2 as detailed in Table 1.
Summary of Accounts
Most customers are farmers of some sort. The market includes lower‐income households, which may spend a comparable amount on kerosene in a relatively short time frame. Customers make incremental payments to keep their products enabled. When pre‐bought time is about to expire, customers receive messages on their mobile phones alerting them that a payment will be due. Product access is controlled and monitored remotely. When customers miss a given payment, product usage is automatically locked and the customer cannot use the device until a new payment is made. This key feature of the technology provides the firm with an important mechanism for monitoring and control. Indeed, this implementation of RTO is a good example of a product that combines some level of flexibility (e.g., allowing advance payments, not charging interests for late payments) and discipline (e.g., regular schedule of expected payments, lock‐out technology); this is in line with some good practices examined in Labie et al. (2017).
Each distributor operates its own distribution network of “agents,” which can include local retail shops, shopkeepers, and micro entrepreneurs. Customers make payments directly to the agents that are part of the distributor's network; mobile payments by consumers are not allowed in our setting. The collecting agents process payments from customers using app‐enabled mobile devices, which allow the automatic recording of each transaction in the company's system. When a payment is recorded, information about product usage for the period is automatically transmitted to the database.
An interesting feature of PAYG models is the inherent flexibility in the payment process. One illustration of this is that customers can “bundle” payments at a given time, paying in advance for more than just a regular payment. For example, customers can bundle payments upfront, paying not just the down payment (which provides product access for 1 week), but more than that (e.g., paying for 3 weeks upfront). In our sample, 19% of customers bundled the upfront payment. More generally, a great majority of customers (92%) bundled payments at some point, reflecting that consumers make use of the flexibility in our RTO setting. Hence, it is very important for firms to fully understand the implications of this behavior.
Another distinctive feature of RTO models is that a device may alternate between enabled and disabled periods, depending on the stream of payments (Figure 1 may serve as a useful reference). In order to explore this feature, we can analyze the fraction of time a device was enabled between its first and last observed payment. In our sample, the fraction of time an account was enabled averaged 84% of that time interval. Table 2 provides descriptive statistics for variables of interest in the analysis, by distributor‐country.
Descriptive Statistics by Distributor‐Country
Engagement and Bundling Effects: Basis and Descriptive Evidence
This section provides the basis for the effects of interest, as well as some related descriptive evidence. Section 5 will focus instead on the formulation of econometric models to measure the effects.
The engagement effect refers to the impact of usage rates on repayment behavior. In particular, the motivating question of interest is whether higher usage rates lead to reduced probability of late payments. Of course, the notion of user engagement is a central concept in marketing research and its importance has been in studied in diverse domains (e.g., Ascarza and Hardie 2013, Blattberg et al. 2008, Bolton and Lemon 1999). Examining the existence of an engagement effect specifically in the context of RTO models for off‐grid energy is of interest for several reasons. First, although repayment performance in RTO has been a topic of interest to academics, the potential role of usage rates has not been analyzed, possibly due to the lack of available data; our detailed data on usage patterns allows us to study this effect for first time in RTO models. Second, our application domain of off‐grid energy products in developing economies, adds to the novelty and relevance of studying an engagement effect. In particular, although liquidity constraints (Cole et al. 2013, Levine et al. 2018) and transaction costs (Economides and Jeziorski 2017, Jack and Suri 2014) are well‐known drivers of payment behavior in this type of environments, less is known about the relationship between usage and payment patterns; establishing an engagement effect would contribute to a fuller understanding of the drivers of payment behavior in these settings. More generally, evidence of an engagement effect would have important implications for firms introducing new technologies in developing countries, where upselling plays a fundamental role. Indeed, these firms are commercializing assets of non‐trivial value, which consumers possess and use before paying for them in full. Bad payment behavior by customers results in significant recovery efforts and operational costs by these firms; moreover, only a fraction of the defaulted devices are eventually repossessed by distributors. Evidence of an engagement effect would highlight the importance for firms to encourage and monitor consumer engagement as part of the definition of an effective operation strategy in these markets.
One way to examine descriptive evidence for an engagement effect is by partitioning the space of payments according to whether they were paid late or not, examining the usage rates during the period that led to these payments. To illustrate with Figure 1, one can examine the usage rate in week 1 and whether the following payment (P2) was late or not, similarly for each subsequent period. We defined late payments by allowing a grace period of 1 week in the calculation, to focus on payments that were most significantly delayed. Recall that a payment enables the device for a given period of time, independently of how intensively the device is used in that period. We compute the usage rates by dividing the total amount of hours the device was used by the amount of time the device remained enabled, in a given spell. Figure 2 displays the usage rate distributions, separated by distributor‐country, depending on whether the subsequent payment was late or not.
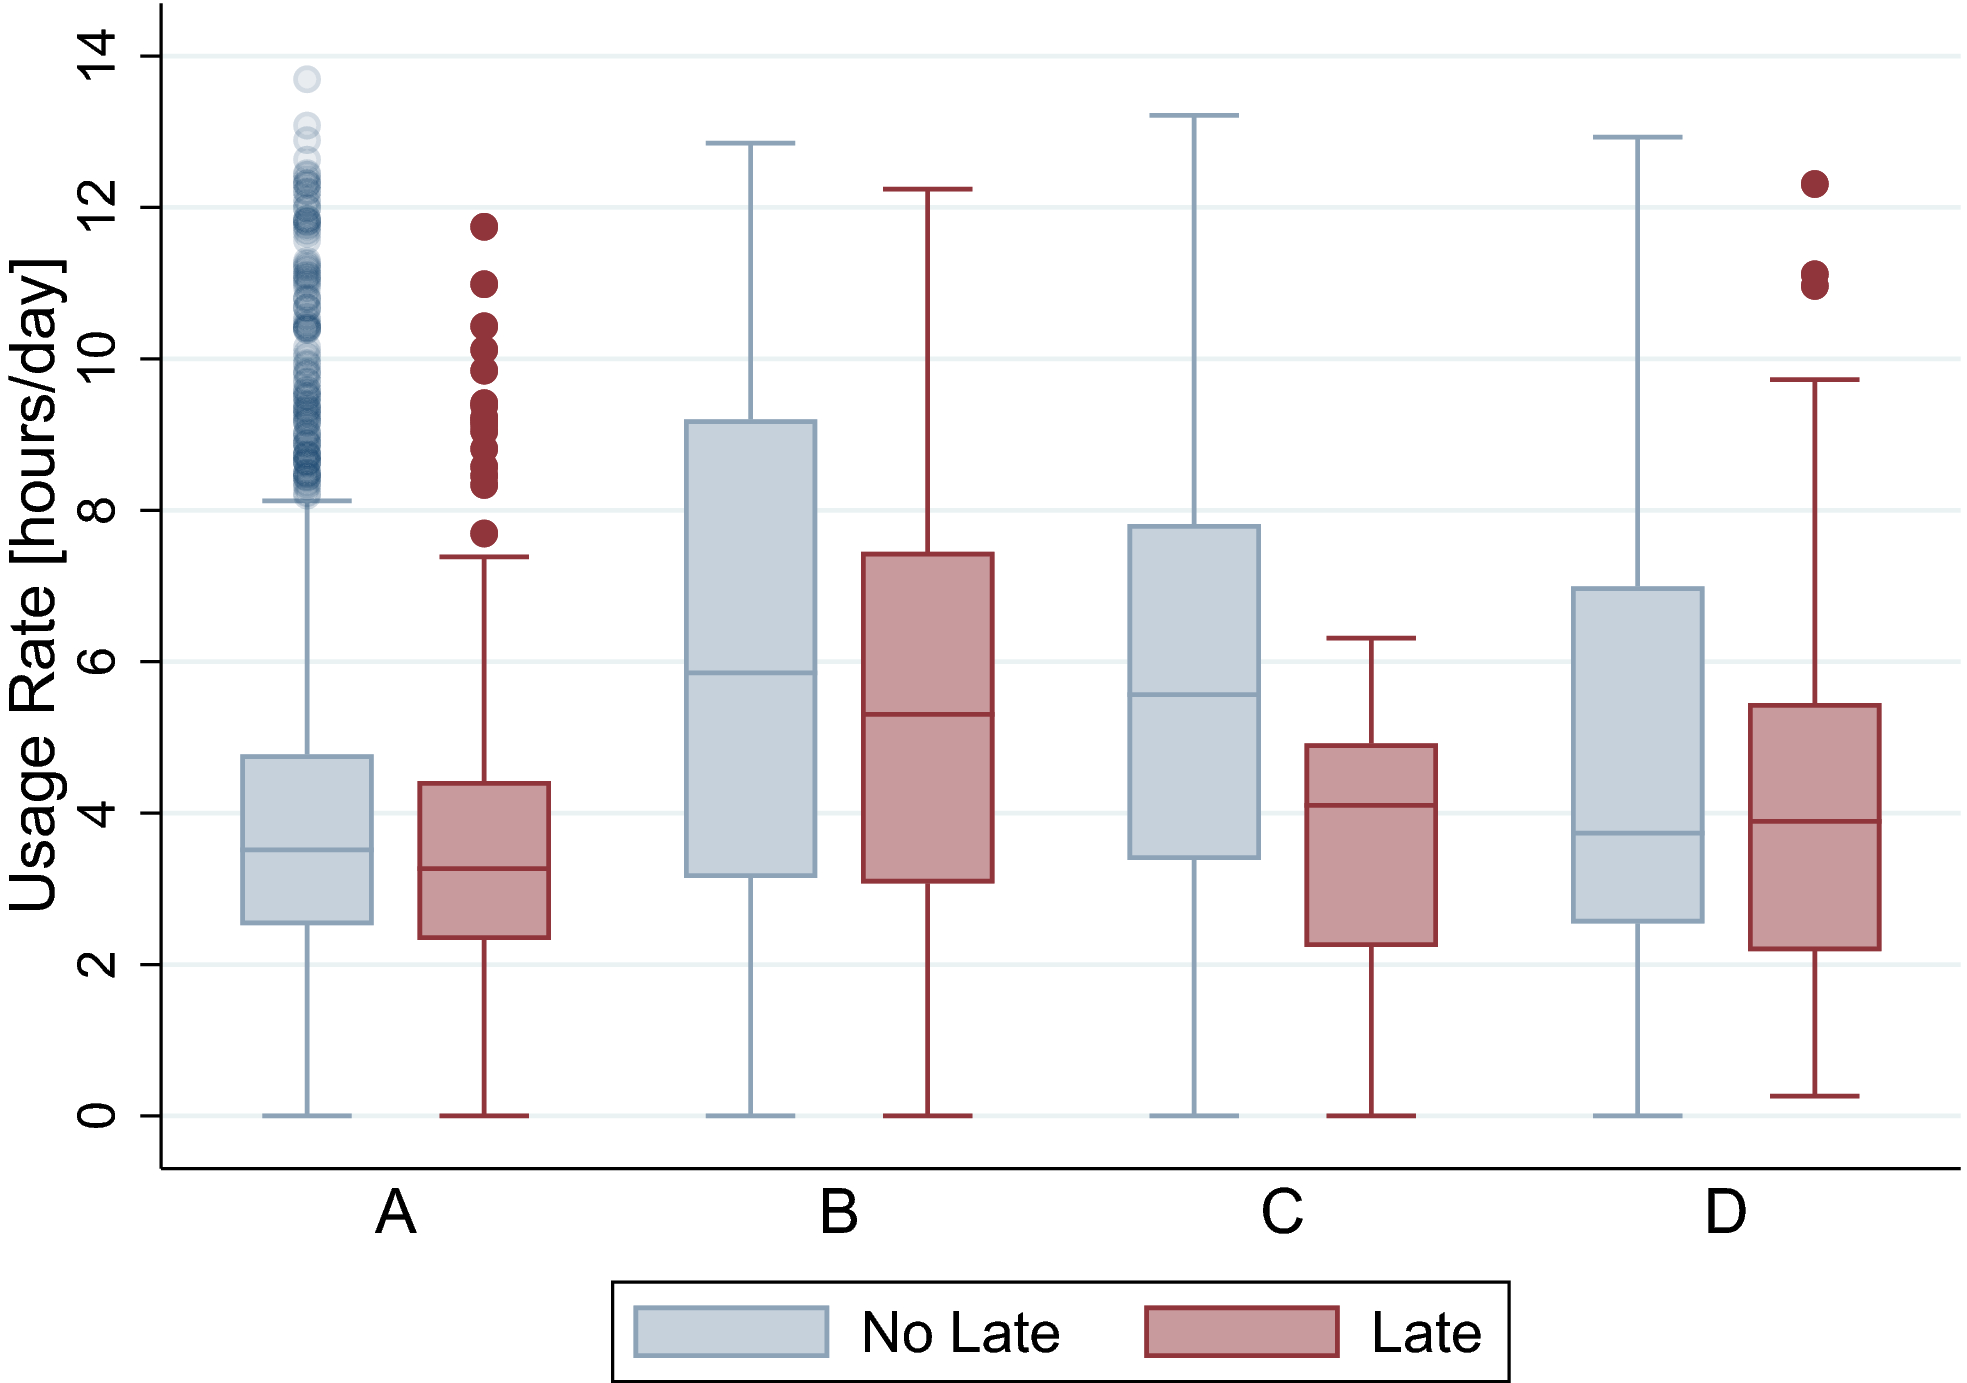
Usage Rates Preceding Late/No Late Payments (by Distributor‐Country) [Color figure can be viewed at
The graph reflects that the usage rates that resulted in “good payments” are higher than the usage rates that led to late payments. Indeed, the average usage rate preceding a late payment was 10% lower than the average usage rate preceding a good payment. This provides some descriptive evidence consistent with an engagement effect.
Regarding the bundling effect, recall from section 3 that most customers “bundled” payments at some point, paying for more than 1 week of access in a given payment. We note that even in settings without interests like ours, there may be reasons for consumers to do so. Perhaps the most obvious one is transaction costs. Also, consumers may choose to prepay due to debt aversion emanating from uncertainty about future income and self‐control problems (Prelec and Loewenstein 1998). Finally, from a hedonistic standpoint, consumers may prefer to minimize thoughts of payment, which can be seen as a psychological component of transaction costs (Prelec and Loewenstein 1998).
One question of interest is whether bundled payments have implications for usage patterns; we refer to this as the bundling effect. Prelec and Loewenstein (1998) postulate that one way in which payments and consumption interact is through “coupling,”that is, a tight connection between consumption and usage. For example, in flat rate environments, consumption is largely decoupled from payments, as opposed to a pay‐per‐use setting. In our case, since bundled payments extend the period that consumers pre‐pay for, it could be argued that it allows “decoupling” consumption to a greater extent than non‐bundled payments. Decoupling may result in less “thoughts of payments,” contributing to the consumption experience, which can affect usage rates. On the other hand, and related to the literature on habit formation, DellaVigna and Malmendier (2006) analyzed consumer behavior and contract choice in gym services. They showed that customers generally used the service less than they anticipated, and that monthly subscribers were more likely to stay enrolled after a year than yearly subscribers. Their preferred explanation for these findings relates to overconfidence, e.g., consumers overestimate their future self‐control, attendance and efficiency. Although our setting is quite different (e.g., consumers do not choose from a menu of contracts), recall that bundling in our context changes the length of the period covered in a spell. Thus, DellaVigna and Malmendier's findings linking usage and subscription length provide some basis to expect differences in usage patterns in our setting, depending on whether payments were bundled or not. Finally, bundling payments in a RTO environment may lead to lost opportunities to interact with an agent, e.g., to solve product misuse issues. For example, bundling can lead to lower usage rates if it delays learning about product usage features. This motive can be particularly relevant to the initial period, when customers are familiarizing with the product.
We can examine descriptive evidence for the bundling effect by analyzing the connection between usage rates and bundling behavior in each spell in our data. In particular, we are interested in whether bundled payments led to lower usage rates. We can again consider a partition of the space of payments, depending on whether they were bundled or not. To illustrate with Figure 1, one can examine whether the upfront payment (P1) was bundled or not, and connect that to the usage rate that followed in week 1, similarly for each subsequent period. We analyzed the distribution of the spell‐level usage rates using these partitions. Figure 3 displays the results, separately for first period (left panel) and non‐first periods (right panel).
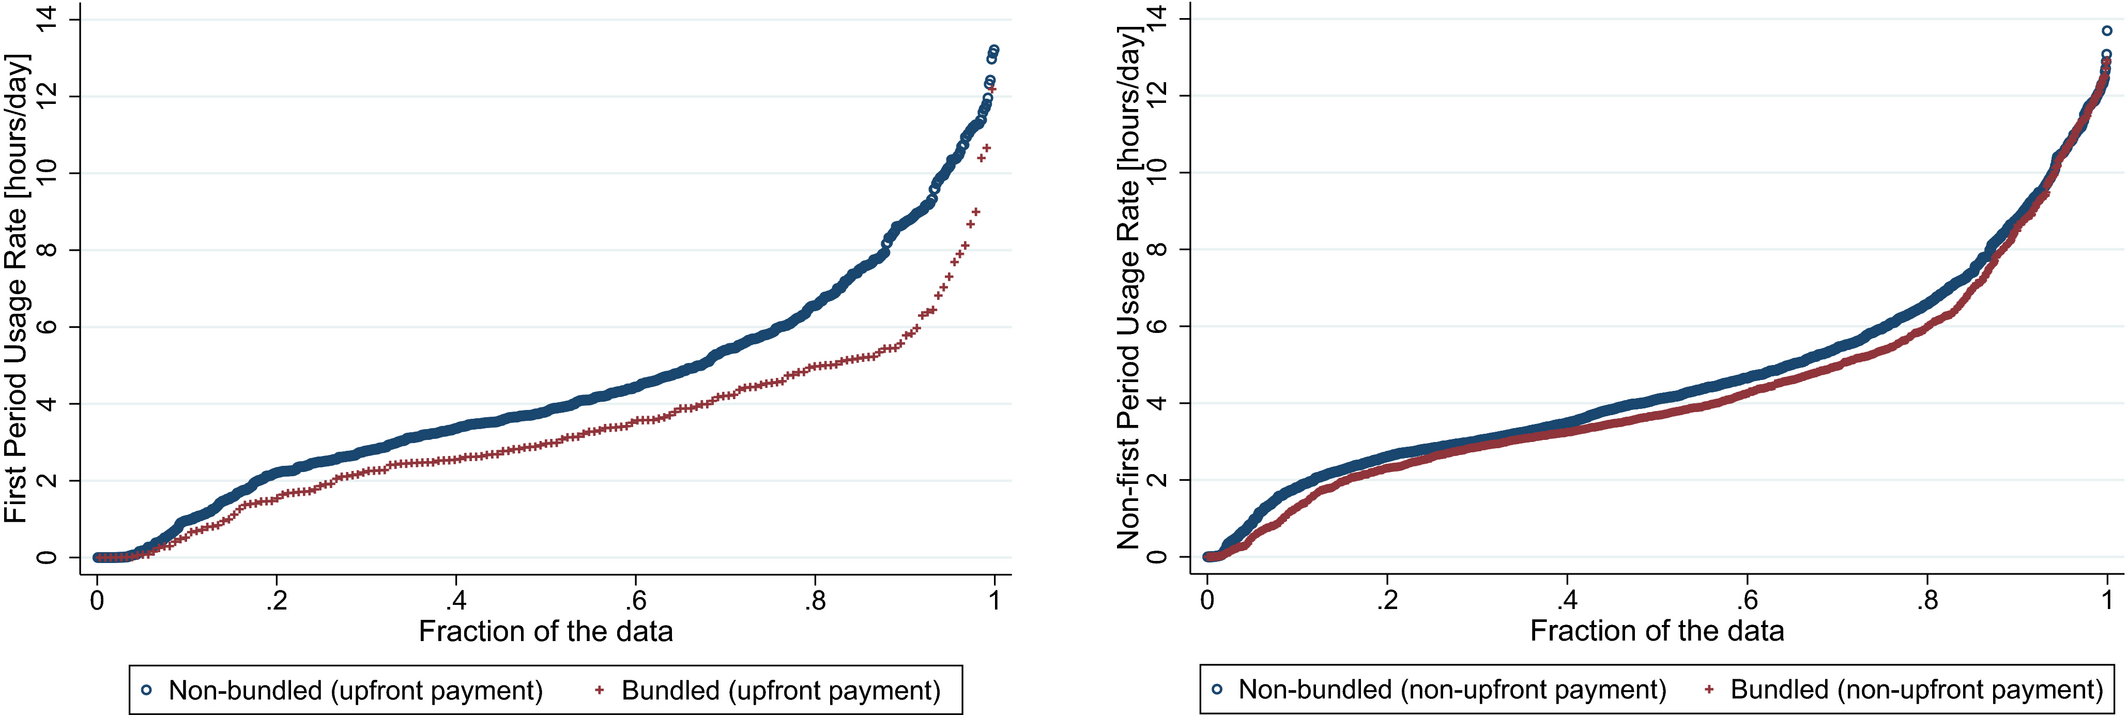
Usage Rates Vs. Bundling Behavior [Color figure can be viewed at
The left panel reflects an evident difference in the distributions of the first‐period usage rates, depending on whether the upfront payment was bundled or not. Also, the average first‐period usage rate after a bundled upfront payment was about 25% lower than the average first‐period usage rate after a non‐bundled upfront payment. The right panel shows a more nuanced picture. Although the average usage rate for non‐first periods after a bundled payment was still about 8% lower than the average usage rate after a non‐bundled payment (a t‐test supports significant differences in usage rates in both cases; p < 0.001), the distributions are clearly less distinguishable than in the case of first period (a Kolmogorov–Smirnov test leads to significant differences in both cases, with p < 0.001; however, the test statistic is twice as large for first payments than for non‐first payments). This suggests that a bundling effect may be more relevant in the first period.
Overall, the descriptive evidence examined in this section provides some model‐free support for the plausibility of the engagement and bundling effects in our setting. Naturally, in order to formally analyze the effects of interest, we need to formulate econometric models attempting to isolate these effects, which is the subject of the following section.
Econometric Models
Engagement Effect
Econometrically, one difficulty to studying this relationship is the unobserved heterogeneity across customers. Indeed, there could be intrinsic differences between them, affecting the metrics of interest. In order to account for such differences, we exploit the panel structure of the data to formulate a model based on differences measured at the individual‐level. Consider the panel‐level model in Equation 1, which characterizes consumer behavior for each spell.
Here, y
it
is a binary variable indicating whether the payment by customer i due at time t was late,
3
U
it
denotes the usage rate of customer i in the period between the previous payment and the payment at time t, X
it
captures observable characteristics of customer i's account and spell t, μ
i
captures unobserved customer heterogeneity, and 


Random‐Effects Logit Models
Notes
Entries represent the coefficients of the random‐effects logit models. Clustered (customer level) standard errors in parentheses. *, **, *** are significant at the 0.1, 0.05, 0.01 confidence levels, respectively. Distributor‐country FE and Quarter FE are subsumed in the (Distributor‐country × Quarter) FE. In models (3)–(4), usage rates are log‐transformed.
In our preferred specifications, X it contains distributor‐country fixed effects to directly control for heterogeneity across the different distributors and populations, and quarter fixed effects to control for time factors (quarter refers to the quarter a given payment is made); section 5.3 discusses alternative specifications. Models (2) and (4) add the interaction between distributor‐country fixed effects and quarter fixed effects. In models (1)–(2), usage rates are in their original scale; in models (3)–(4), a logarithmic transformation is utilized to reduce the skewness. 4 In all cases, the results show a significant engagement effect, that is, higher usage rates decrease the probability of late payments. Recall that this model controls for individual‐level differences, also including controls for any differences across distributor‐country through fixed effects. In that sense, the engagement effect reflected in these results is established already accounting for customer heterogeneity. The magnitude of the effect is such that increasing usage rates by one hour leads to a reduction in the probability of a late payment by approximately 8%.
Bundling Effect
Now we formulate a model to examine whether bundled payments have an incidence on customer's usage rates. This section discusses two complementary sources of evidence to evaluate this bundling effect. First, it presents separate regression models for first versus overall usage rates as initial evidence (cross‐sectional analysis); then, it provides models under a panel data framework.
Table 4 displays results of a regression of the first‐period usage rates (models a–b) as a function of observable characteristics. Models (c)–(d) do the same employing the overall usage rate—which measures the usage rate in the period between the first and last observed payments—as a dependent variable instead. The covariates include a dummy variable for whether the first payment was bundled or not (bundled upfront payment), and for whether an account had bundled non‐upfront payments or not (bundled non‐upfront payment).
Usage Rate Regressions
Entries represent the estimates of regression models. Robust standard errors in parentheses. *, **, *** are significant at the 0.1, 0.05, 0.01 confidence levels, respectively.
These results provide support for an association between the bundled upfront payment variable and usage rates. Indeed, in all specifications, customers who bundled the upfront payment ended up having lower usage rates in the first period, even after controlling by distributor‐country fixed‐effects. Moreover, based on the regressions for the overall usage rate, bundling behavior in the upfront payment is explanatory of the overall usage rates, whereas bundling behavior in non‐first periods does not have a significant association with overall usage patterns. These findings are consistent across different specifications.
This cross‐sectional approach provides initial evidence, but is sensitive to the presence of unobserved heterogeneity across customers, as the analysis relies on two separate snapshots of the data. Alternatively, one can exploit the panel nature of the data to formulate an integrated model that connects the observed usage rate U
it
for customer i in spell t, to whether the customer bundled the payment at the beginning of that spell B
it
. We consider the model in Equation 2.
Besides the two variables just described, the specification also includes relevant features of the account by customer i and spell t (X
it
), as well as a term denoting unobservable customer heterogeneity 

Random‐Effects Usage Rate Regressions
Entries represent the estimates of random effects models. Clustered (customer level) standard errors in parentheses. *, **, *** are significant at the 0.1, 0.05, 0.01 confidence levels, respectively. Distributor‐country FE and Quarter FE are subsumed in the (Distributor‐country × Quarter) FE. In models (3)–(4), usage rates are log‐transformed.
The results show a bundling effect that is relevant only in the first period. Indeed, bundled payments generally do not have an effect on usage patterns (B it is non‐significant in all specifications). However, bundling payments upfront leads to lower usage rates in the first period. The magnitude of the effect is equivalent to a decrease of approximately 20 minutes in the daily usage rate following a bundled upfront payment. Although the estimates decrease in size (by more than 50%) with respect to the previous modeling approach that did not account for unobserved customer heterogeneity, the effect is significant across different specifications. In particular—and similarly to the engagement effect analysis—we considered alternative definitions for X it and U it , e.g., models (1)–(2) consider usage rates in their original scale, whereas models (3)–(4) employ the aforementioned logarithmic transformation. In all cases, we consistently found evidence of a bundling effect in the first period, even after controlling for differences across individuals by exploiting the longitudinal variation in the data.
Overall, our results show a strong bundling effect—that is, bundling payments leading to lower usage rates—, but only in the case of the initial period. In other words, if customers pay upfront for more than just the down payment, this leads to lower usage rates; however, bundling subsequent payments does not have an effect on usage rates in later periods. One plausible explanation for these results is that bundling the upfront payment leads to a delay in the first encounter with an agent, which may result in a missed opportunity to correct early any product misuse by a customer. For example, if a user pays upfront for three installments in a 10‐week contract, the second payment—which would otherwise be due in a week, giving users an opportunity to correct any misuse issues more rapidly—is due 3 weeks after the account is opened. This missed opportunity of an early interaction would delay the first encounter, which may explain the lower usage rates found in accounts that bundled the upfront payment. In subsequent periods, when customers are already familiar with using the device, the need to interact with an agent to inquire about product usage issues should be less common. We can consider some model free evidence consistent with this explanation. Indeed, we note that usage rates in the second period increase—in relation to usage rates in first period—proportionally more for customers who bundled the upfront payment (average usage rate increased by 8%), than for customers who paid the regular down payment (average usage rate increased by 3%). This offers some indication of the plausibility of the proposed mechanism.
Robustness
We further examine the robustness of the engagement effect and bundling effects. First, we discuss some variations in the model specifications that apply to both cases. For example, we estimated alternative models using monthly fixed effects instead of quarter fixed effects, and the results remained robust. In terms of methodology, our main specifications rely on random‐effects models. This allows for estimation of the effects of interest using the full sample of observations, controlling for individual‐level differences through random‐effects, and, at the same time, fully controlling for differences across distributors and countries through distributor‐country fixed effects. The main identification assumption is the uncorrelation between the random effects and the rest of the covariates in the model. An alternative approach is to estimate the model using a fixed‐effects framework, in which individual unobserved heterogeneity is modeled as a fixed‐effect. This allows for correlation between individual fixed effects and the rest of the covariates, providing more flexibility in the identification strategy. However, estimation in our case would dismiss a significant number of observations (e.g., individuals that did not have late payments would be disregarded in the estimation of the engagement effect). In addition, given that the time dimension of the panel is relatively small, fixed‐effects models may introduce the incidental parameters problem (Greene 2004). That said, fixed‐effects models can provide a useful robustness check to the identification assumption needed in random‐effects models. We estimated fixed‐effects models in the subsample that allows for fixed‐effects estimation and continued to find support for both effects; hence, our main insights hold independently of the random‐effects modeling assumptions. Also, our preferred specifications use distributor‐country fixed effects; we estimated all models using instead observable characteristics of each distributor's contract (down payment percentage, repayment term) along with a dummy variable for the distributor's geographical region (Africa indicator; Asia is used as reference category). Both the engagement effect and the bundling effect are robust to this variation. Finally, our main models use clustered standard errors at the individual level to allow for cross‐correlation in the error terms of an individual; we estimated models clustering standard errors at the “customer group” level instead 5 to evaluate robustness to correlation in factors that can affect groups of consumers, and the results remained robust.
For the engagement effect, we tested alternative definitions of our dependent variable. For example, we estimated models using different time windows to label payments as “late” (e.g., 1 day, 2 weeks) instead of 1 week. We also tested random‐effects models that instead of using a binary dependent variable (whether or not a payment was late), used the number of days a payment was late instead. In addition, we estimated cross‐sectional models to analyze the association between usage rates and the “average lateness” of a given account. In the case of the bundling effect, we tested models that instead of using a binary indicator for bundling behavior, used the size of the payment instead (i.e., the ratio of actual payment over expected payment). Our results remained robust to these variations.
Moreover, to check that the engagement effect was not confounded by bundling behavior, we also estimated engagement effect models that control for bundling behavior in two ways. First, we added the bundled payment variable as independent variable in the engagement effect models. Second, we estimated the engagement effects models using only the subsample of accounts that did not bundle the upfront payment (because the bundling effect only occurs following bundled upfront payments). The engagement effect is robust to both variations.
Overall, the main results and robustness checks performed provide strong evidence supporting the engagement and bundling effects. The Appendix A displays results for some of the robustness checks discussed in this section.
Predictive Models
The econometric models in the previous section reveal interesting insights regarding the relationship between payments and usage patterns. One implication of the engagement effect is that usage data might be useful to anticipate payment behavior. In this section, we build upon this insight from a predictive models perspective, and study how the incorporation of usage patterns affects the accuracy of predictive models of default. Through this predictive exercise, we aimed to investigate whether usage rates in the first period can be useful in the prediction of overall repayment patterns and whether one would lose important information when utilizing usage rates covering only the first period, as opposed to observing usage rates across the overall adoption period.
Indeed, one difficulty in the predictive exercise is that usage behavior is only known after the consumer actually uses the product. For this reason, observing usage during the first period versus the overall usage behavior is a decomposition with implications for predictive models, given the different time horizons involved in the collection of usage data in either case. In this section, we will evaluate the predictive accuracy of classifiers that use different sets of predictors (i.e., no usage data; usage data from the first period; usage data across the overall adoption period).
We built classifiers to forecast whether an account will end up in default, which is measured here allowing a tolerance equal to the repayment term. In other words, this variable measures whether an account with a repayment term of 10(5) weeks was not yet paid after 20(10) weeks (consistent also with the analysis in previous sections). Methods included were probit regression, logistic regression, support vector machines (Cortes and Vapnik 1995; we used a polynomial kernel of second degree), random forests (Breiman 2001), and boosted trees (MART algorithm, see Ch. 10 in Hastie et al. 2009).
For performance evaluation, we used the area under the ROC curve (AUROC). This is a metric between 0 and 1, assessing the trade‐off between the true positive rate (or sensitivity) and the false positive rate (or 1‐specificity), and it is one of the most commonly used performance metrics in classification problems. The larger the AUROC, the better the discriminant ability of a classifier. We use leave‐one‐out cross‐validation for performance measurement, that is, models are estimated leaving one datapoint at a time as part of a holdout data set for performance measurement (Hastie et al. 2009, p. 242). Table 6 displays the AUROC obtained in the leave‐one‐out holdout data set with different classifiers and sets of predictors.
Prediction Accuracy (AUROC in leave‐one‐out test sample)
Model 1 is a base case with only contract variables as predictors (down payment, repayment term, and a dummy variable for geographical region). Model 2 adds first period usage rate (i.e., usage rate between first and second payment), and fraction of time the device was enabled during its first period; model 3 does the same but uses the overall usage rate (between first and last observed payment) instead of the first period usage rate.
The results indicate that first‐period data can provide useful information to predict default behavior. Indeed, depending on the method, models in column (2) are 9% to 27% more accurate than models that do not use this information (column 1). In contrast, the predictive accuracy does not improve through observation of overall usage rates (column 3) rather than just first‐period usage rates. These findings are pretty consistent across the different classifiers. In short, first‐period data lead to a useful update of the model's predictions, 6 but there is no value added in observing the overall usage rates beyond the first‐period in terms of predicting probabilities of default.
Limitations and Future Research
The analysis in this study is subject to several limitations, which we now discuss to properly contextualize the findings and to pave the way for future research. First, the analysis is based on observational data and is subject to the usual limitations of such approach; ideally, future research could provide experimental evidence. Second, the data are limited in terms of customer demographics (e.g., income, location). Future research with more detailed data can allow exploration of the role of these factors. As a side—positive—note at this regard, we highlight that the models in this study characterized repayment behavior even without detailed data about customers. As noted earlier, the lack of detailed customer data is an important challenge that companies operating in this domain actually face in practice. Our analysis can thus be seen as an illustration of factors that can be accounted for in credit models for unbanked people in the absence of detailed demographic information.
Third, more research is needed to further characterize the mechanisms behind the engagement and bundling effects. For example, ideally one would observe detailed data on customer‐agent interactions to fully validate the explanation we proposed for the bundling effect. Similarly, testing in the field how agent and customer training can moderate the impact of bundled payments is a clear avenue for future research. Fourth, the analysis is based on an entry‐level solar lamp. The short repayment terms (between 5 and 10 weeks) are in line with the low cost of the product. For more expensive products, e.g., home systems, longer repayment terms (e.g., 1–2 years) are common. If data covering longer panels becomes available, future research can examine lagged and cumulative effects in short versus long term horizons for bundled payments and user engagement. Also, distributors can employ a range of strategies for money collection using approaches and technologies different than the one analyzed in this study (e.g., mobile payments to decrease transaction costs for users). Future research should continue to study consumer behavior in alternative settings.
Finally, the predictive models analyzed in this study were formulated with the specific purpose of illustrating how the use of different sets of predictors can have an influence on model performance. It is worth noting that this differs from a prediction exercise attempting to find a model with optimal performance; if the purpose was to optimize predictive accuracy, there is little question that predictive models could be optimized further (e.g., considering additional classifiers, evaluating different algorithms for feature selection and model selection, etc.), which can well be a topic of interest for future research.
Concluding Remarks
This study analyzed usage and payment behaviors in RTO environments. By exploiting the longitudinal variation in the data—and hence accounting for intrinsic differences between customers—the analysis led to three main insights. First, we documented an engagement effect, that is, higher usage rates led to lower probability of late payments by customers. Although it is well known that liquidity constraints (Cole et al. 2013, Levine et al. 2018) and transaction costs (Economides and Jeziorski 2017, Jack and Suri 2014) play an important role in the developing world, our findings that usage patterns influence late payments enhance existing knowledge about the drivers of payment behavior in these environments. This speaks to the relevance of establishing—to our knowledge, for first time in this context—the existence of an engagement effect specifically in RTO applications in developing economies. It also highlights the importance of incorporating this effect in the study of repayment performance in these settings.
Second, and reflecting the inherent flexibility given to users in RTO settings, customers often “bundled” payments, making advance payments for future product access. This bundling behavior has implications to further characterize how payment and usage behaviors interact. Indeed, we established that bundling payments upfront (i.e., paying more than just the down payment) led to lower usage rates. Hence—and perhaps counterintuitively—although bundling behavior may be generally seen as advantageous, it also may lead to reduced consumer usage if done upfront. This is clearly undesirable, particularly in a context in which upselling is a common practice by RTO firms that often promote the use of a suite of products and for which consumer's engagement is very important. At a high‐level, this result can be seen as an illustration of a negative consequence of an otherwise well‐intended policy, a broader area with numerous examples in the business and economics literature (e.g., Goes et al. 2018, Huang et al. 2019, Loewenstein et al. 2011). In our case, as a corollary, firms may not want to encourage advance payments upfront; alternatively, they should track very closely the usage patterns of customers who bundled payments upfront, to proactively identify and offer troubleshooting support to customers who are not using the device much. Moreover, firms will want to pay special attention to train such customers at the time of adoption and ensure they are well familiar with all features of the product upfront. Our analysis identified whether the upfront payment was bundled as a useful segmentation variable in the context of firms targeting recovery and customer support efforts.
Third, building on the insights derived from our econometric models, we developed predictive models of default. One aspect to note here is that, in comparison to a traditional sales model, RTO is by definition a more relational environment with the customer. Predictive data analytics can be indeed a game changer for distributors continuously interacting with their customers and learning how to optimize and grow their businesses in developing countries. Our analysis showed that first‐period usage rates already contain relevant usage information that can be incorporated in predictive models of default, and that observing usage rates in subsequent periods does not lead to further improvements. Hence, our results suggest that firms should closely track consumer behavior in early stages, considering a variety of concrete actions. Indeed, firms can incorporate this information to promptly identify potentially problematic customers and intervene when a user's probability of default is high when examining early usage patterns. For example, firms can use this input to target pre‐emptive recovery efforts more effectively. This is especially important in developing economies, where little is known ex ante about a consumer's credit worthiness, which highlights the relevance of our finding that observing behavior in the initial period provides already very useful information from a predictive analytics point of view. Firms can also use this information to identify good users who can be offered upgrades or upselling opportunities. Indeed, given the lack of information about customers and the significant costs of new customer acquisition, PAYG firms can significantly benefit from converting upselling opportunities with the installed customer base; identifying these customers early can boost conversion rates. Although in our application we only observe data for a single product, upselling is a common practice among PAYG firms and our results suggest that this can be an attractive direction for future research.
The analysis highlights the importance of tracking payment and usage behavior jointly. Indeed, firms introducing assets of non‐trivial value in developing economies operate in an inherently risky environment, where the costs of attempting to repossess a defaulted device can be very high (e.g., in sparsely populated rural locations) and the outcome of such efforts is quite uncertain. Tracking usage rates can help these firms in the design and targeting of more effective pre‐emptive efforts, e.g., by proactively reaching out to consumers to troubleshoot usage issues in early stages.
On a related note, Guay (2015) noted that “…data is something this industry is particularly well‐suited to provide. Many of the leading companies providing solar to off‐grid households and businesses rely on sophisticated pay‐as‐you‐go technologies.” Although this type of pay‐as‐you‐technology is broadly available and is being used in many applications in the off‐grid energy sector and beyond, the decision of which technology to use is not trivial for firms introducing innovations in the developing world. Indeed, options can vary significantly, e.g., in their levels of sophistication and the type of data collected. In that sense, our analysis also provides an illustration of the value that can be derived by these firms from the collection and analysis of detailed behavioral data.
More generally, this study showed that usage and payment behavior by customers can interact in non‐trivial ways, illustrating also how business analytics tools can be useful in the study of these interactions using granular consumer behavior data. The rapid adoption of new technologies, and the digital transformation of traditional business (Boute and Van Mieghem 2019), are making granular data on consumer usage patterns available quite broadly. Hopefully, this study illustrates how firms can benefit by jointly analyzing payment and usage behavior in related settings.
Footnotes
Selected Robustness Checks
Acknowledgments
The author thanks the Fisher Center for Business Analytics at the Haas School of Business for providing partial financial support for this project.
1
2
Given the question analyzed in this study that is, how do usage and payment behavior interact, the analysis does not include accounts for which there are no usage data available (e.g., accounts that were paid in full upfront or for which the only payment recorded in the database was the upfront payment).
3
As noted earlier, we allow a tolerance of 1 week in each payment, that is, this variable measures whether a payment was late by at least 7 days. This is to focus on payments that were most significantly delayed; it is also consistent with an overall grace period equal to the repayment term, which is a standard industry metric (also consistent with our analysis in section 6).
4
Note that whether and by how much a logarithmic transformation would reduce the skewness depends on the constant k used in the log(x−k) transformation. In order to ensure that indeed the transformation achieves its purpose, we used the Stata function lnskew0, that finds a k that leads to a “near zero” skewness (in our implementation: k = −3.35 and the achieved skewness = −0.00001).
5
This is a segmentation used by the company to denote groups of consumers of a given distributor that adopted the product in the same distribution campaign, representing an intermediate level of aggregation between individual and country.