
Abstract
COVID-19 is a highly infectious respiratory disease whose progression has been associated with multiple factors. From SARS-CoV-2 infection to death, biomarkers capable of predicting different disease processes are needed to help us further understand the molecular progression of COVID-19 disease. The aim is to find differentially expressed proteins that are associated with the progression of COVID-19 disease or can be potential biomarkers, and to provide a reference for further understanding of the molecular mechanisms of COVID-19 occurrence, progression, and treatment. Data-independent Acquisition (DIA) proteomics to obtain sample protein expression data, using R language screening differentially expressed proteins. Gene Ontology and Kyoto Encyclopedia for Genes and Genomes analysis was performed on differential proteins and protein–protein interaction (PPI) network was constructed to screen key proteins. A total of 47 differentially expressed proteins were obtained from COVID-19 incubation patients and healthy population (L/H), mainly enriched in platelet-related functions, and complement and coagulation cascade reaction pathways, such as platelet degranulation and platelet aggregation. A total of 42 differential proteins were obtained in clinical and latent phase patients (C/L), also mainly enriched in platelet-related functions and in complement and coagulation cascade reactions, platelet activation pathways. A total of 10 differential proteins were screened in recovery and clinical phase patients (R/C), mostly immune-related proteins. The differentially expressed proteins in different stages of COVID-19 are mostly closely associated with coagulation, and key differential proteins, such as FGA, FGB, FGG, ACTB, PFN1, VCL, SERPZNCL, APOC3, LTF, and DEFA1, have the potential to be used as early diagnostic markers.
Introduction
Coronavirus disease 2019 (COVID-19) is caused by a highly infectious and pathogenic coronavirus, severe acute respiratory syndrome coronavirus 2 (SARS-CoV-2), which is now spreading rapidly around the world (Hu et al., 2021; Shen et al., 2020). According to the World Health Organization (WHO), the COVID-19 pandemic has caused millions of confirmed cases and hundreds of thousands of deaths worldwide and continues to rise, with a huge impact on global health and economies (Mittal et al., 2020; Shu et al., 2020).
The clinical course of SARS-CoV-2 infection consists of an incubation period of 4–6 days, followed by fever and clinical manifestations with a respiratory focus (Meydan et al., 2020). Most patients have mild symptoms and can recover within 7–10 days, and some patients also have repeated infections and multiple organ failure (Jacobs et al., 2020; Meydan et al., 2020). Therefore, the disease progression of COVID-19 is related to multiple factors. A deep understanding of the biomarkers of different disease processes in COVID-19 patients is particularly important for the prevention and treatment of disease progression.
Proteins are essential molecules in almost all biological processes (BPs), and they can provide insight into BPs at the functional level. The application of proteomics provides an important opportunity to elucidate disease mechanisms and identify new diagnostic markers and therapeutic targets (Chambers et al., 2000; Chen et al., 2020; Li et al., 2017). Data-independent acquisition (DIA) for liquid chromatography–tandem mass spectrometry improves the depth and reproducibility of the obtained proteomics dataset (Martinez-Val et al., 2021).
Therefore, in this study, DIA was used to compare the serum protein expression profiles of healthy people and patients with different disease stages of COVID-19. The differentially expressed proteins between the sera of patients with different disease stages of COVID-19 were screened and bioinformatically analyzed to find differential proteins that are associated with disease progression or can be biomarkers for understanding the pathogenesis and diagnosis and treatment of COVID-19.
Materials and Methods
Subjects
Sample source
The serum samples were all obtained from an outbreak of SARS-CoV-2 (Strain B.1.1.330) infection.
Sample collection: The sample was left to stand at room temperature for 30 min and the supernatant was collected after centrifugation at 2,000 rpm for 10 min.
Sample grouping
The samples were divided into confirmed cases (Con) and healthy population groups (H) according to the study objectives and the period of sample collection. The confirmed cases were all in accordance with the Novel Coronavirus Pneumonia Treatment Protocol (Trial Version 8)(National Health Commission of the PRC, 2021), and the healthy population was defined as those with negative pathogen test results and negative specific IgG and IgM antibodies with chemiluminescence test during the same period and in the same region as the confirmed cases. Confirmed cases are divided into incubation period (L): the period when the test results of novel coronavirus pathogens are positive, but clinical symptoms and signs have not yet appeared; clinical period (C): the period when the corresponding clinical symptoms and signs appear in confirmed cases; and recovery period (R): the period after the confirmed case meets the discharge criteria.
Sample selection
Considering the feasibility of the study, the study population was segmented by age and 5–10 study subjects were randomly selected in the age group with the highest number of confirmed cases. In the healthy population group, 5–10 subjects were also randomly selected in the same age group.
Methods
Protein extraction
All serum samples were individually added to two times the volume of 1% SDS and sonicated pyrolysis, and centrifuged at 4°C for 10 min at 12,000 RCF to obtain the supernatant. The supernatant was transferred to a new centrifuge tube, and the protein concentration was determined by the Pierce BCA Protein Assay Kit according to the manufacturer's instructions.
Trypsin digestion
Before digestion, the protein solution was reduced with 5 mM dithiothreitol for 30 min at 56°C and alkylated with 11 mM iodoacetamide for 15 min at room temperature in darkness. The protein sample was then diluted by adding 100 mM TEAB to urea concentration less than 2 M. Finally, trypsin was added at 1:50 trypsin-to-protein mass ratio for the first digestion overnight and 1:100 trypsin-to-protein mass ratio for a second 4-h digestion.
Mass spectrometry library construction
The sample was then fractionated into fractions by high pH reverse-phase HPLC using Agilent 300Extend C18 column (5 μm particles, 4.6 mm ID, 250 mm length). Briefly, peptides were first separated with a gradient of 8% to 32% acetonitrile in 10 mM ammonium bicarbonate pH 9 over 60 min into 60 fractions, then, the peptides were combined into nine fractions. The iRT was added to all the fractions and dried by vacuum centrifuging. The peptides were dissolved in liquid chromatography mobile phase A and separated using an EASY-nLC 1200 UHPLC system. Mobile phase A was an aqueous solution containing 0.1% formic acid and 2% acetonitrile and mobile phase B was an aqueous solution containing 0.1% formic acid and 90% acetonitrile. The liquid phase gradient was set at 120 min and the flow rates maintained at 500 nL/min. The peptides were separated by the UHPLC system and injected into the NSI ion source for ionization, followed by data acquisition using a Q Exactive HF-X mass spectrometer and subsequent retrieval of mass spectrometry data.
DIA data acquisition
The liquid phase parameters were kept the same as in the library construction. Peptides were separated by an ultra-high-performance liquid phase system and then analyzed by data acquisition using a Q Exactive HF-X mass spectrometer. The peptide parent ions and their secondary fragments were detected and analyzed using a high-resolution Orbitrap. The primary mass spectrometry scan range is set at 385–1,200 m/z with a resolution of 120,000. The secondary scan resolution is 15,000.
DIA data processing
The data were imported into the corresponding library of plots and the retention times of the peptides were predicted by nonlinear correction. Relative quantification of the protein was obtained using the MSstats R language package.
Data analysis
Statistical analysis of basic information of the sample
Fisher's exact probability method and t-test were used to statistically test the information related to age and gender.
Selection of differential proteins
All proteins obtained from the database search were analyzed. The Fold Change (FC) of the protein between two samples in the comparison group was first calculated, and then the two-sample two-tailed t-test was used to analyze the differential expression significance of the protein in the two samples p. When p < 0.05, proteins with an expression change of 1.5 or more (FC greater than 1.5 or less than 0.67) were screened as differential expression proteins.
GO and KEGG enrichment analysis of differential expression proteins
The Gene Ontology (GO) biological function enrichment analysis and the Kyoto Encyclopedia for Genes and Genomes (KEGG) signaling pathway enrichment analysis were performed through the DAVID (
Protein interaction network analysis
The screened differential proteins were submitted to the STRING (
Results
Basic information of research subjects
A total of seven confirmed cases and seven healthy individuals were included in this study. The differences in age and gender were not statistically significant (p > 0.05) (Table 1). Since confirmed cases require serum samples from incubation period, clinical period, and recovery period, a total of 28 specimens were collected.
Basic Information of Research Object
Quantitative analysis of protein between comparison groups
Volcano maps (Fig. 1) were drawn according to the screening criteria of p < 0.05, FC >1.5 or <0.67. A total of 47 differentially expressed proteins were screened in latent phase patients versus healthy population (L/H) (Fig. 1A), of which 45 were upregulated and 2 were downregulated. A total of 42 differentially expressed proteins were identified in patients in clinical phase versus latent phase (C/L) (Fig. 1B), of which 11 were upregulated and 31 were downregulated. A total of 10 differentially expressed proteins were identified in patients in the recovery phase versus those in the clinical symptomatic phase (Fig. 1C) (R/C), of which 6 were upregulated and 4 were downregulated. We show the top 10 differential proteins in each group (Tables 2 –4).
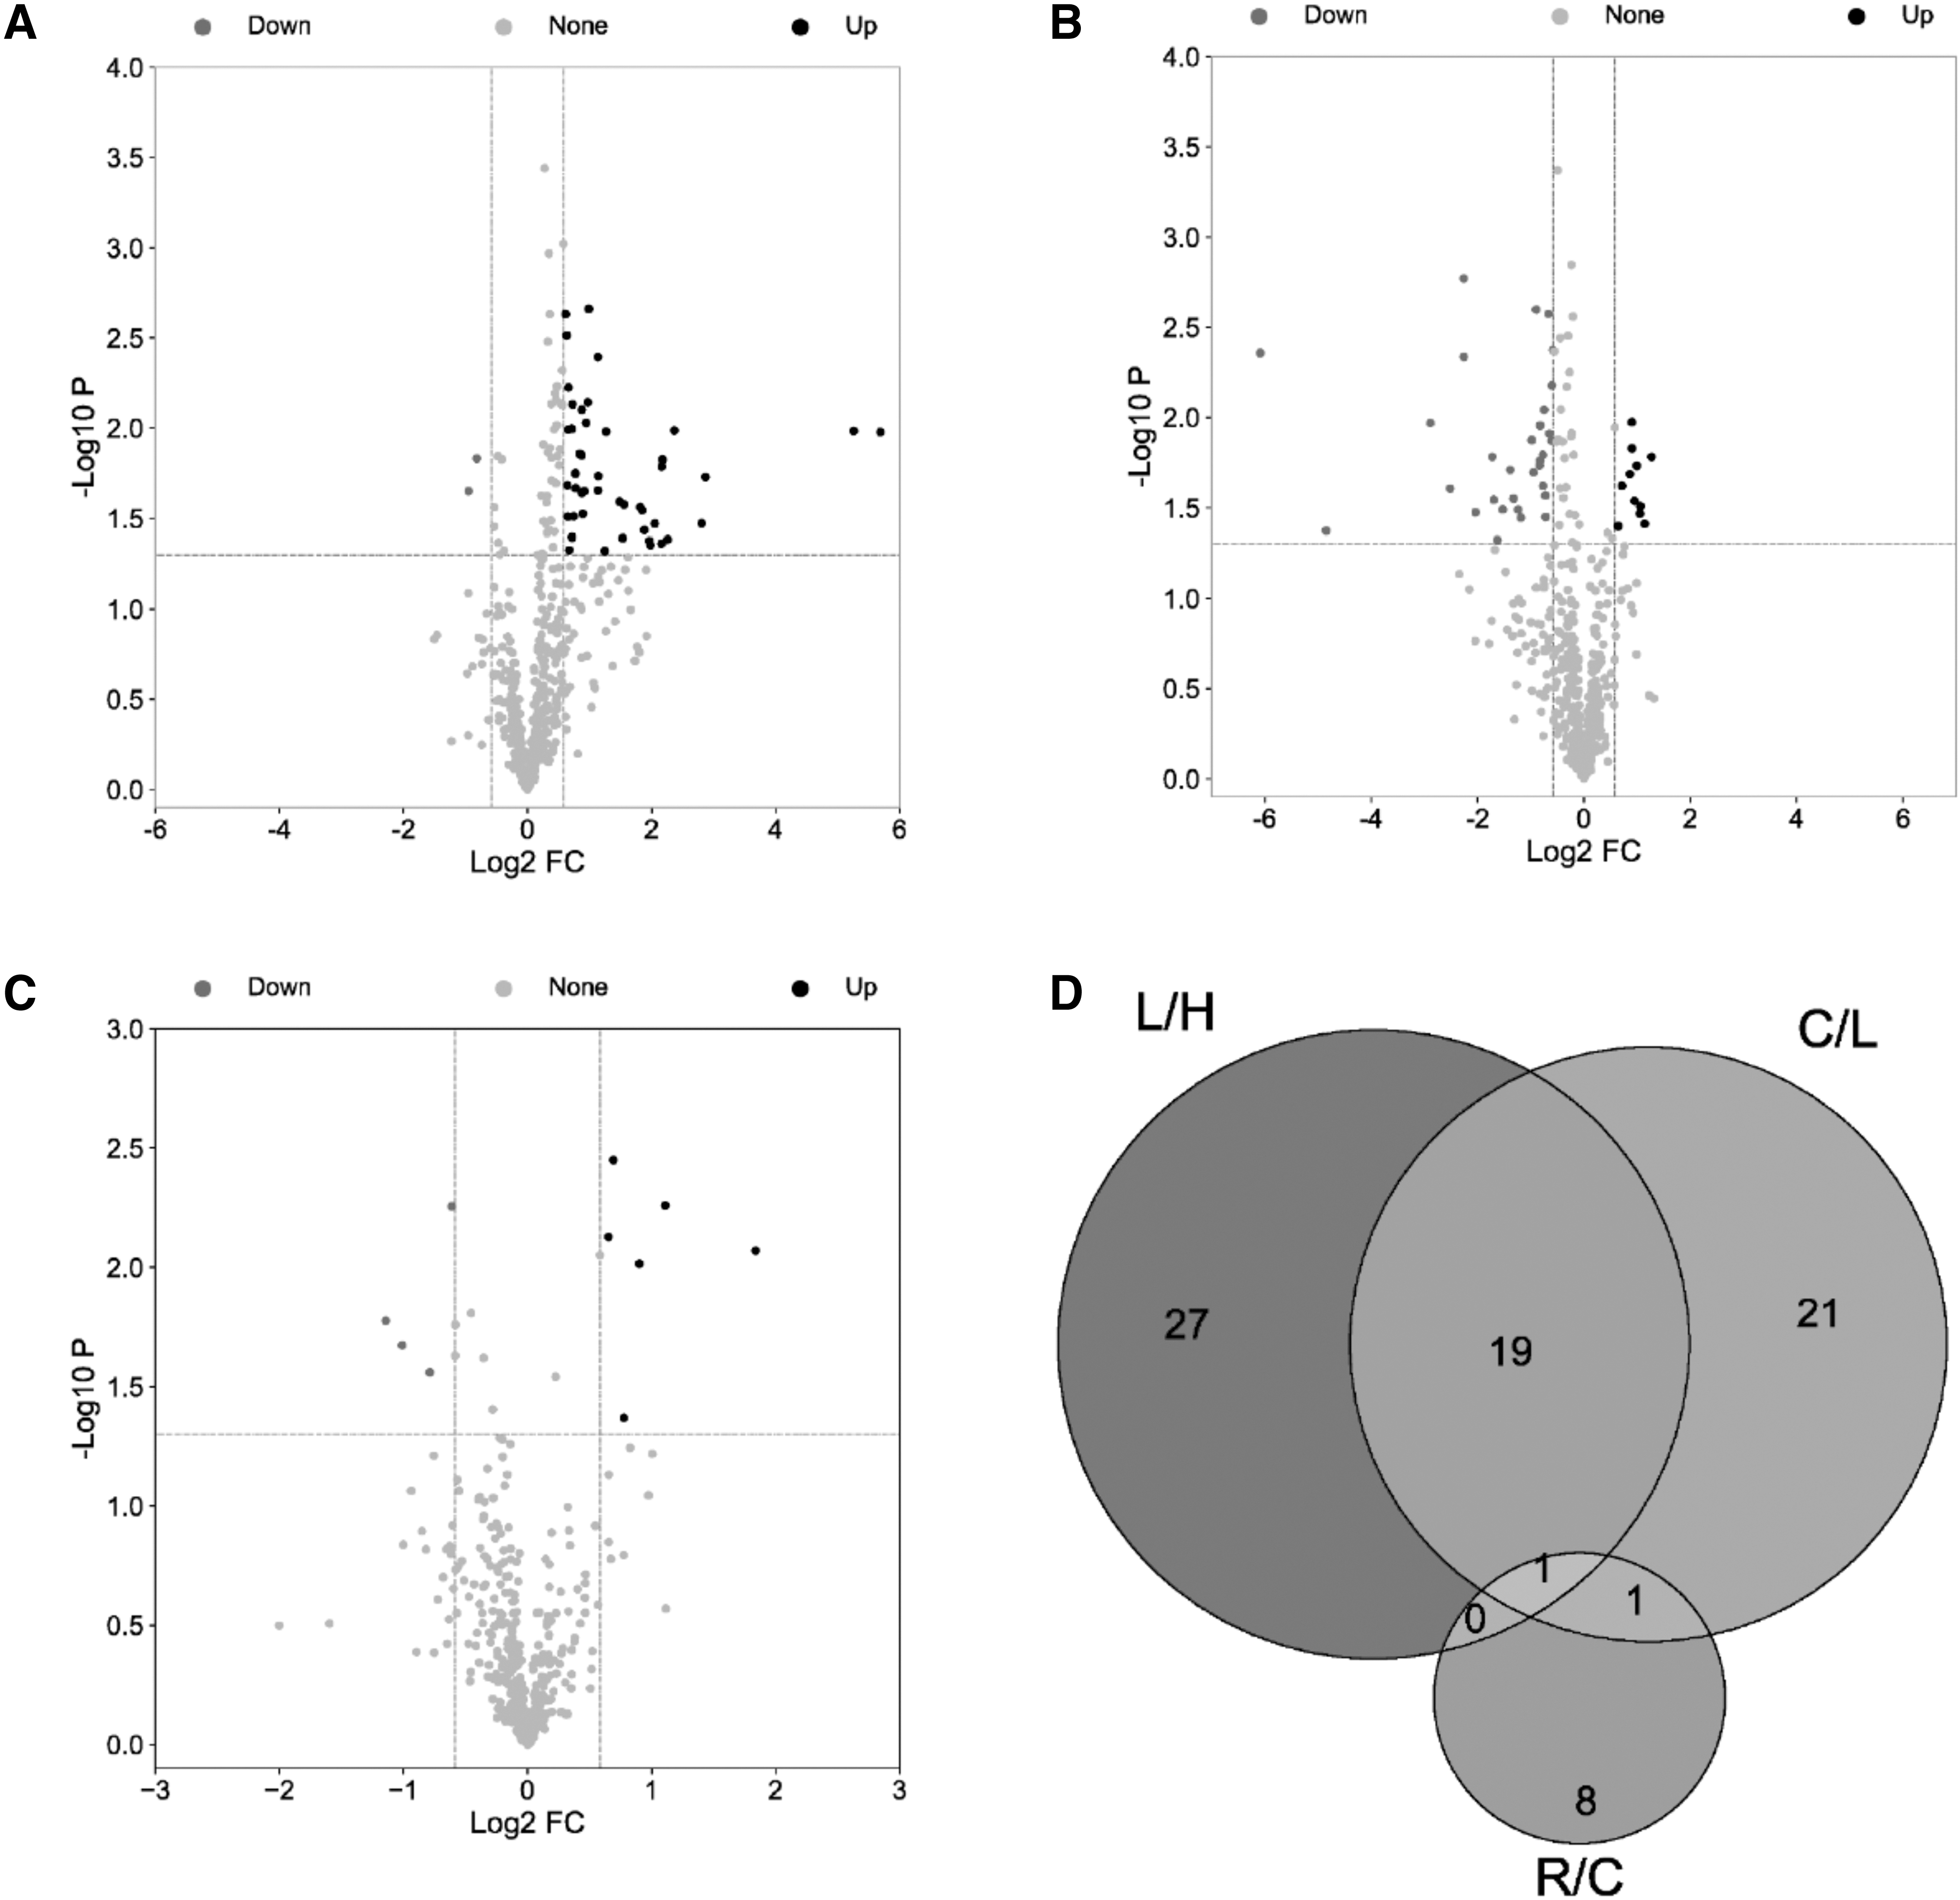
Volcano map and Venn diagram. Each dot in the volcano plot represents a protein tested, the horizontal coordinate represents the fold change (Take log2 conversion) of the group comparing each protein, and the vertical coordinate represents the P(Take -log10 conversion). The dot colors represent the final screening results, with red dots representing upregulated proteins, blue dots representing downregulated proteins, and gray dots representing proteins with no difference.
Top 10 Differential Proteins in L/H
Top 10 Differential Proteins in C/L
Top 10 Differential Proteins in R/C
The Venn diagram shows 1 common differentially expressed protein in the three groups (Fig. 1D), FGA, which was upregulated in L/H and downregulated in the other two comparison groups. In addition to FGA, there were 19 other common difference proteins in the L/H and C/L groups, COCH was downregulated in both comparison groups, and the rest of the common difference proteins changed in opposite ways in the two groups. There was also 1 common differential protein in both C/L and R/C groups, F11, which was downregulated in C/L and upregulated in R/C.
Differential protein GO function and KEGG pathway enrichment analysis
The GO enrichment results showed that in patients with COVID-19 latent phase compared with the healthy population (Fig. 2A), differential proteins were biologically enriched mainly in platelet-related functions, including platelet degranulation, platelet aggregation, and platelet activation, and differential proteins were mostly enriched extracellularly. The differential proteins of patients in the clinical symptomatic phase and those in the latent phase (Fig. 2B) were also predominantly enriched in platelet-related functions in terms of biological processes. In terms of cellular localization, it is mostly enriched in extracellular, platelet alpha granule lumen and blood microparticle, and in terms of MF, it is mainly enriched in homologous protein binding. There were fewer differential proteins between recovering patients and the clinically symptomatic phase (Fig. 2C), fewer entries were functionally enriched to, and the biological processes were primarily enriched to antimicrobial humoral responses.
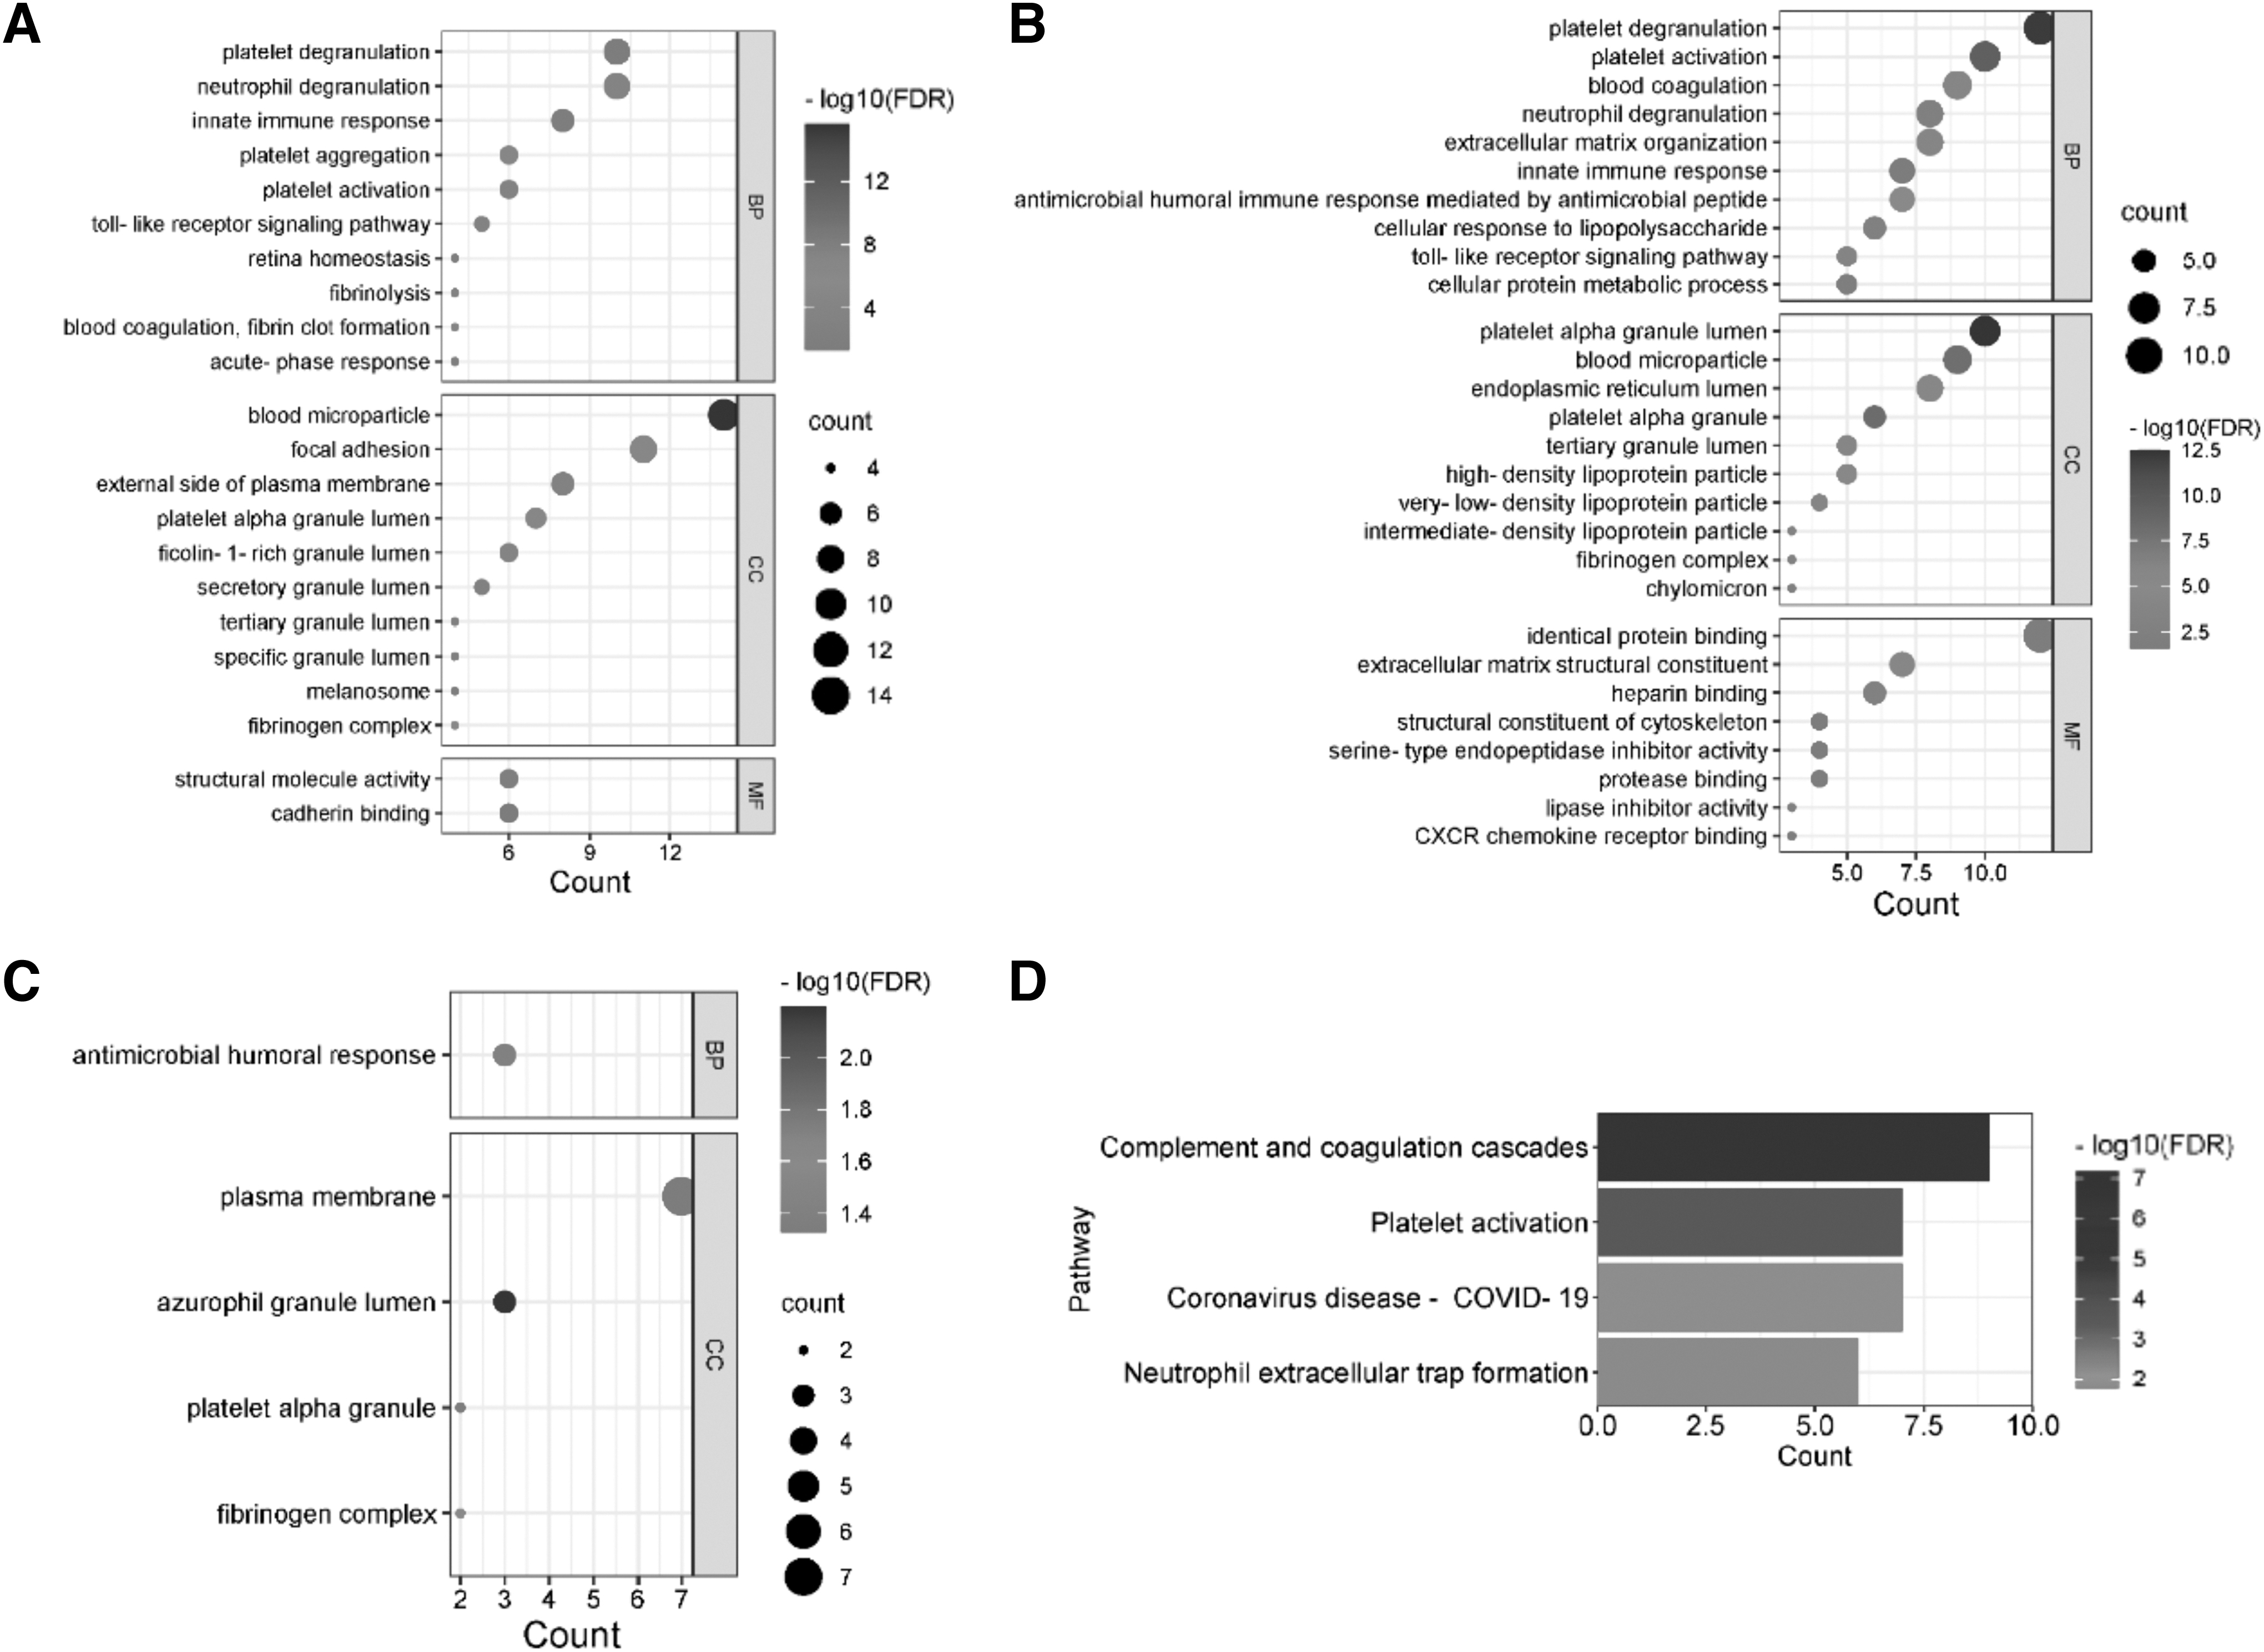
The GO enrichment results of the differential proteins are presented in bubble plots, and the KEGG enrichment results are presented in horizontal bar graphs. The horizontal axis of the bubble plot represents the number of enriched proteins, the vertical axis represents the enriched biological functions, the larger the circle means more proteins are enriched for a biological function, and the redder the color means the smaller the FDR value. The horizontal axis of the horizontal bar graph represents the number of enriched proteins, and the vertical axis represents the pathways enriched to. The longer the bar represents the more proteins enriched to a pathway, and the redder the color represents the smaller the FDR value and the more significant the enrichment.
The KEGG enrichment results showed that the differential proteins of latent patients and healthy subjects were significantly enriched only in the complement and coagulation cascade pathway. Differential proteins in patients with clinical symptoms and in latent patients (Fig. 2D) were significantly enriched in the pathways of complement and coagulation cascade and platelet activation. Differential proteins were less in patients in the recovery phase versus the clinical symptomatic phase and therefore could not be analyzed for KEGG enrichment.
Protein interaction network and key protein analysis
The PPI network (Fig. 3) diagram of differential proteins was established to screen the key differential proteins in protein interactions, and plot the PPI network diagram of key differential proteins (Fig. 3), whose darker color represents the higher ranking. The PPI network showed that the top 10 Hub differential proteins between latent patients and healthy population (Fig. 3A, D) were FGA, FGG, FGB, ACTB, CFL1, PFN1, F13A1, SERP INF2, C9, and PPIA. The top 10 Hub differential proteins in clinical phase patients versus latent phase patients (Fig. 3B, E) were SERP INC1, FGA, FGG, FGB, APOC3, APOC2, APOC1, APP, C9, and APOC4. There were fewer differential proteins between patients in recovery and clinical phase (Fig. 3C, F), and there were less than 10 differential proteins in the whole reciprocal network, so all proteins in the network were analyzed, and the top Hub proteins were FGA, FN1, CRP, F11, and PRTN3.
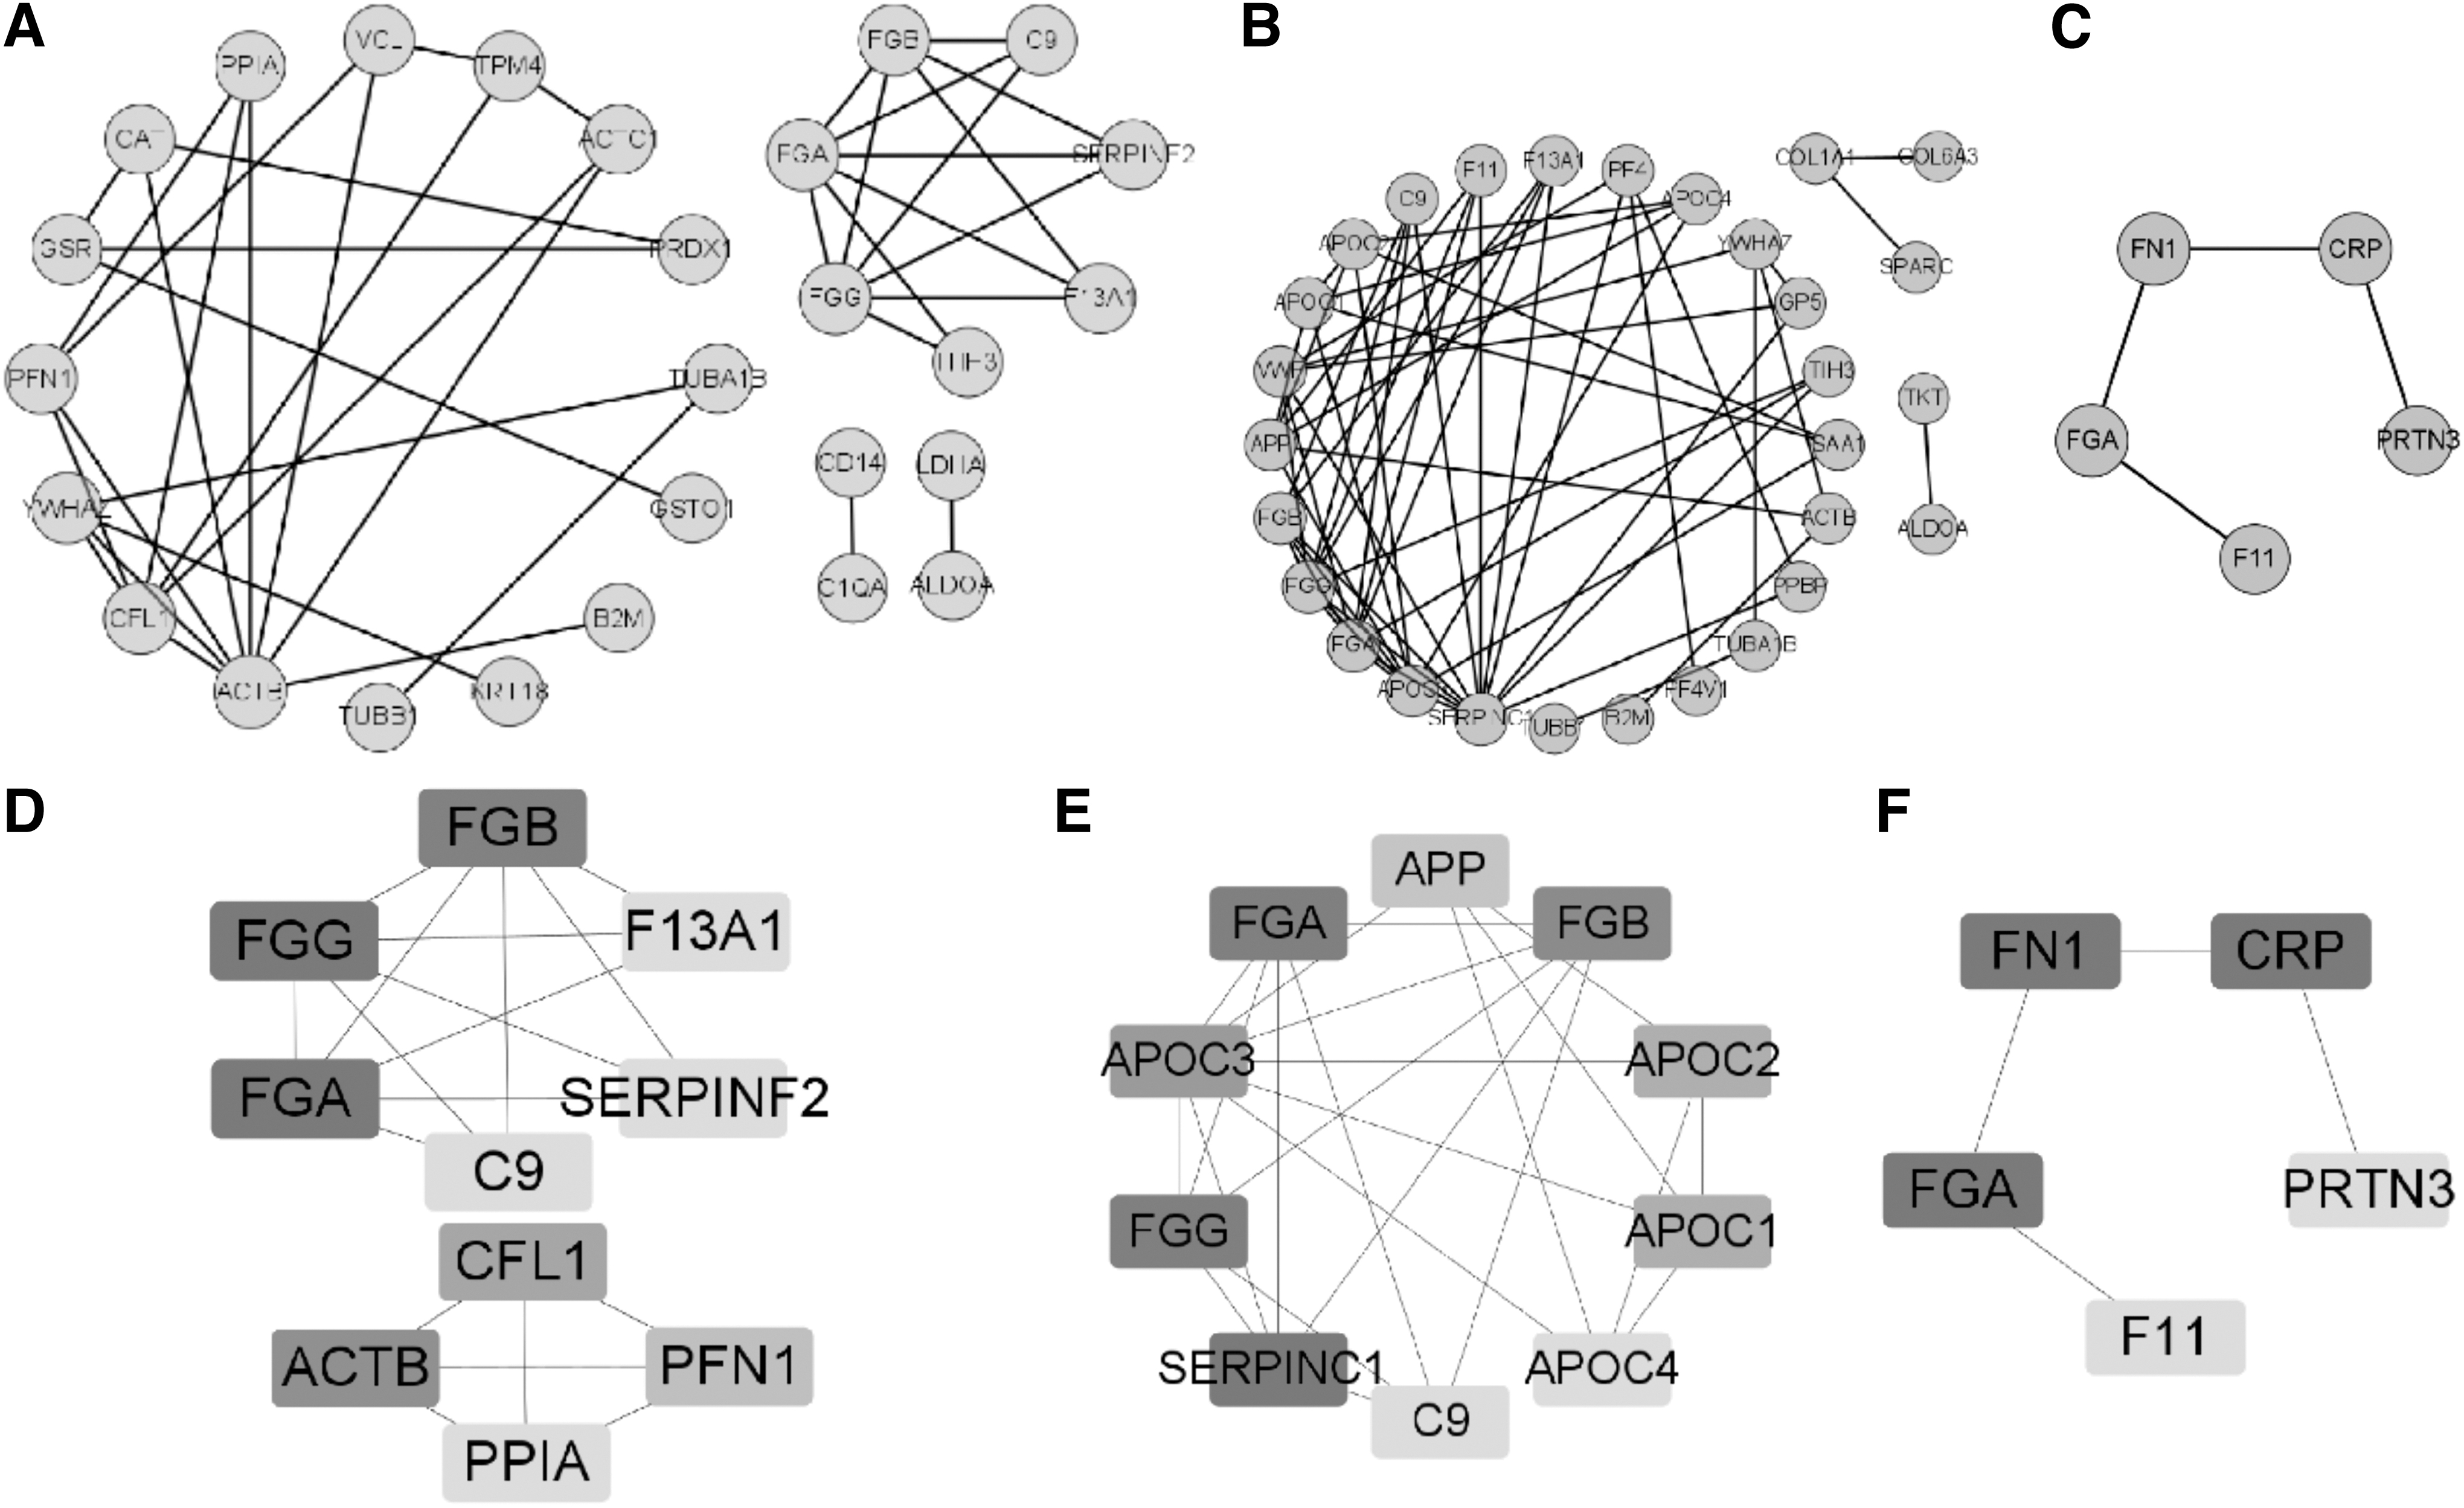
PPI network diagram of differential proteins and key differential proteins. The darker color in the PPI network diagram of key differential proteins indicates more proteins interacting with them.
Discussion
The entry of SARS-CoV-2 into humans triggers a coagulation cascade, cytokine storm, and inflammatory cascade, and can lead to serious or even fatal complications (Ponti et al., 2020). To further understand the effect of SARS-CoV-2 in humans, this study screened differentially expressed proteins from patients during different stages of the disease and performed bioinformatics analysis to better understand the pathophysiology of the disease.
The differential proteins of patients with latent period and healthy people are mostly enriched in platelet-related functions. The differential proteins that are enriched in platelet-related functions are mainly some coagulation proteins and cytoskeletal proteins. Fibrinogen alpha chain (FGA), Fibrinogen beta chain (FGB), and Fibrinogen gamma chain (FGG) are the three polypeptide chains that constitute fibrinogen (Yu et al., 2021), which can form insoluble clots when converted to fibrin by thrombin (Weisel and Litvinov, 2017). An increase in FGA, FGB, and FGG indicates that the body enters a hypercoagulable state (Yu et al., 2021). Coagulation factor XIII A chain (F13A1), Alpha-2-antiplasmin (SERPINF2), is activated to stabilize fibrin clots to avoid their premature breakdown (Law et al., 2008; Nie et al., 2021). Actin, cytoplasmic 1 (ACTB) organizes and maintains the shape of cells and its abnormal expression leads to cytoskeletal changes (Guo et al., 2013; Su et al., 2007).
Vinculin (VCL), Cofilin-1 (CFL1), Tubulin alpha-1B chain (TUBA1B), and Tubulin beta-1 chain (TUBB1) also play important functions in the platelet cytoskeleton (Cai et al., 2007; Cuenca-Zamora et al., 2019; Li et al., 2021). Profilin-1 (PFN1) not only produces important roles in cytoskeletal changes, it is also important for transcriptional activation of viruses (Leng et al., 2021).
Coagulation proteins and cytoskeletal proteins were significantly upregulated during the latency period, suggesting that the platelet coagulation process starts during the latency period. This shows that the coagulation response is an early response to COVID-19. These proteins are among the top differential proteins or key proteins ranked high in the PPI network and have the potential to be early biomarkers of SARS-CoV-2 infection.
Differential proteins in the clinical and latent phases are also predominantly enriched in platelet-related functions and in the complement and coagulation cascade reaction pathways. Antithrombin-III (SERPINC1) encodes an antithrombin and deficiency of antithrombin further increases the risk of thrombosis (Yue et al., 2019). SERPINC1 was significantly downregulated in the clinical phase compared with the latent phase, while most of the coagulation proteins and cytoskeletal proteins associated with platelet function were also downregulated in the clinical phase. The changes in these proteins suggest that the coagulation response in the clinical phase is still present but has improved. We also identified proteins associated with lipid homeostasis in their PPI key protein interaction network, including Apolipoprotein C-I (APOC1), Apolipoprotein C-II (APOC2), Apolipoprotein C-III (APOC3), and Apolipoprotein C-IV (APOC4). A study by Shen et al., (2020) revealed downregulation of multiple apolipoproteins in COVID-19 patients.
The present study, on the other hand, found upregulated expression of all apolipoproteins in the clinical phase compared with the latent phase, which we speculate may also be due to the treatment the patients received after admission.
There are relatively few differential proteins in the recovery and clinical phases, mainly some involved in immune function. Lactotransferrin (LTF) is a key component of innate immune defense and has been shown to act as a tumor suppressor in a variety of cancers (Deng et al., 2013; Liu et al., 2022). Neutrophil defensin 1 (DEFA1) supports the innate immune response by disrupting viral membranes, and its upregulation is a protective antiviral host response (Park et al., 2018; Sell et al., 2021). Our study also found significant upregulation of C-reactive protein (CRP), a nonspecific reactant elevated in infection or inflammation, during the recovery period (Stringer et al., 2021), and its elevation during the recovery period suggests that inflammatory pathways may remain disturbed even after SARS-CoV-2 infection subsides. Elevated CRP is detrimental to the prognosis of patients with COVID-19 (Stringer et al., 2021), and therefore close attention should be paid to indicators and signs of patients in the recovery period to prevent adverse prognosis.
FGA is the common differentially expressed protein in the three groups (Fig. 1D), which is upregulated during the latent phase and gradually downregulated during the clinical and recovery phases. Its changes suggest that the coagulation response due to SARS-CoV-2 infection is likely to recover gradually with effective treatment. The hypercoagulable state of blood increases the tendency of thrombosis, which further leads to rapid deterioration and may eventually progress to multiorgan failure leading to death (Asakura and Ogawa, 2021; Senst et al., 2023). Therefore, early anticoagulation in patients with COVID-19 can effectively prevent thrombosis and contribute to the better prognosis.
Conclusion
In this study, differentially expressed proteins from COVID-19 patients with different disease stages were further analyzed using bioinformatics analysis, and FGA, FGB, FGG, ACTB, PFN1, VCL, SERPZNCL, APOC3, LTF, and DEFA1 were screened as possible markers for early diagnosis.
Ethics Approval and Consent to Participate
The study protocol was approved by the Ethics Committee of the Hebei Provincial Center for Disease Control and Prevention (No. IRBS2021-032), which confirmed that the study complied with the national and international guidelines for human research. There was no personal or identifiable information in the study, and the results obtained were only used for the analysis of the data in this study, not as a basis for clinical diagnosis. Therefore, waived informed consent was requested during the ethics review process and was granted.
Human and Animal Rights
All research studies on humans (individuals, samples, or data) have been performed in accordance with the principles stated in the Declaration of Helsinki.
Footnotes
Acknowledgment
The authors thank AiMi Academic Services (
Authors' Contributions
N.G. participated in the experimental design, data collection and analysis, and thesis writing. Z.H. and X.H. provided research guidance for this study. M.D. and G.H. performed the data compilation. Q.L. performed the design guidance and thesis guidance.
Author Disclosure Statement
The authors declare no conflicts of interest.
Funding Information
This work was supported by the Key Research and Development Program of Hebei Province (Grant number 20277703D).