
Abstract
The plague bacterium Yersinia pestis is lethal to endangered black-footed ferrets (Mustela nigripes, BFF) and the prairie dogs (Cynomys spp., PD) on which they depend for habitat and prey. We assessed the effectiveness of an oral sylvatic plague vaccine delivered in baits to black-tailed PD (Cynomys ludovicianus, BTPD) from 2013 to 2017 on the Charles M. Russell National Wildlife Refuge (CMR) in northcentral Montana. We permanently marked BTPD on four paired vaccine (N = 1,349 individuals) and placebo plots (N = 926; 7,027 total captures). We analyzed capture–recapture data under a Cormack–Jolly–Seber model to estimate annual apparent survival. Overall, survival averaged 0.05 lower on vaccine plots than on paired placebo plots. Immediately before noticeable die-offs and detecting plague on pairs CMR1 and CMR2, 89% of BTPD sampled on vaccine plots had consumed at least one bait and the immune systems (pleural) of 40% were likely boosted by consuming baits over multiple years. Survival to the following year was 0.16 and 0.05 on the vaccine plots and 0.19 and 0.06 on the placebo plots for pairs CMR1 and CMR2, respectively. These rates were markedly lower than 0.63, the overall average estimate on those same plots during the previous 3 years. PD populations subjected to such large die-offs would not be expected to sustain a BFF population. An overriding limitation to achieving sufficient protection rests with vaccine delivery constraints. Late summer/fall bait distribution results in the highest bait uptake rates. However, the PD birth pulse each spring can double the size of populations in most years, greatly reducing the proportion of vaccinates in populations and diminishing potential herd immunity benefits. In addition to nonvaccinated juveniles and PD that do not consume bait, incomplete vaccine protection and time required for immunity to develop leaves a large majority of PD populations vulnerable to plague for 6–7 months or more each year.
Introduction
Plague is a zoonotic disease caused by the primarily flea-borne bacterium Yersinia pestis (Poland and Barnes 1979). In North America, where Y. pestis was introduced ca 1900, the bacterium is the primary biological challenge limiting recovery of endangered black-footed ferrets (Mustela nigripes, BFF) and conservation of prairie dogs (Cynomys spp., PD) on which these specialized predators depend for habitat and prey (Barnes 1993, U.S. Fish and Wildlife Service 2013). Successful vaccination of PD against plague could protect BFF habitat and prey. In laboratory studies, many PD that ate sylvatic plague vaccine (SPV) baits containing recombinant raccoon poxvirus expressing plague antigens were protected from subcutaneous Y. pestis challenge (Rocke et al. 2010, 2014, 2015). If sufficiently protective in the field, this vaccine could help mitigate the impacts of plague for the conservation of threatened and endangered species (Abbott et al. 2012). The primary driver behind SPV development has been to mitigate the effects of plague that are limiting BFF recovery (U.S. Fish and Wildlife Service 2013). If effective, SPV could also have conservation benefits for threatened Utah PD (C. parvidens, UPD) and Gunnison's PD (C. gunnisoni, GPD), a species of concern.
Our assessments of SPV focus on its ability to maintain, and perhaps increase, PD survival and abundance for functional BFF conservation. There are numerous examples of BFF population extirpation when plague, or other stressors (e.g., drought), eliminate substantial portions of PD colony complexes (U.S. Fish and Wildlife Service 2019). Ideally, SPV treatment would protect PD populations from plague and result in PD survival rates sufficient to sustain relatively stable PD populations that could sustain BFF populations. Lacking that success, if SPV reduced mortality and prevented colony extirpation, PD populations might recover more quickly and support BFF populations in the future. However, such apparent partial successes must be interpreted with caution because fragments of PD colonies sometimes persist and undergo postepizootic rebound without plague mitigation treatments (Cully and Williams 2001, Pauli et al. 2006, Augustine et al. 2008, Cully et al. 2010, U.S. Department of Agriculture, U.S. Forest Service 2015).
If effective, SPV might increase PD survival during nonepizootic (enzootic) periods, and perhaps increase abundance during epizootic periods as well, as shown by Biggins et al. (2010) and Biggins et al. (2021b) using flea control. Enzootic plague, as defined by Biggins and Eads (2019), likely circulates frequently in plague endemic areas, including our study area in Montana (Hanson et al. 2007, Matchett et al. 2010). Hanson et al. (2007), Griffin et al. (2010), Matchett et al. (2010), St. Romain et al. (2013), Bron et al. (2019), and Liccioli et al. (2020), all reported detecting Y. pestis in fleas or carcasses from PD colonies that were not currently experiencing an epizootic. Near our study area, BFF that were vaccinated against plague and residing on areas without flea control had 266% higher annual reencounter rates compared with nonvaccinates during a time when black-tailed PD (C. ludovicianus, BTPD) populations appeared healthy and stable (Matchett et al. 2010). BFF rarely leave PD colonies (Biggins et al. 2006) suggesting exposure to plague occurred on colonies despite the absence of noticeable BTPD population declines characteristic of plague epizootics.
Carnivores have often been used for plague surveillance (Barnes 1982, Salkeld and Stapp 2006, Brown et al. 2011, Elbroch et al. 2020, Bevins et al. 2021). Coyotes (Canis latrans, N = 512) in southern Phillips County, Montana (where this study occurred) had positive plague antibody titers every year from 1993 to 2007 except one, 2003, with a sample of only six animals that year (Matchett et al. 2010). Positive antibody titers were detected in juvenile coyotes in all but 3 years (2002–2004), suggesting nearly continuous plague circulation. Many of those samples were collected on BTPD colonies occupied by BFF. Nearly 45,000 blood samples collected from a wide variety of wildlife from 2005 to 2018 found Y. pestis antibodies in 18 wildlife species in 17 Western states (Bevins et al. 2021). These observations are broadly supported by other studies demonstrating that Y. pestis can be maintained in varied ecosystems with low transmission and variable host mortality rates, with occasional epizootics (Lowell et al. 2015, Kosoy et al. 2017, Ramakrishnan 2017, Vogler et al. 2017, Biggins et al. 2021c, Goldberg et al. 2021).
The observation and expectation that Y. pestis frequently circulates at some level in our study system is important for two primary reasons. First, SPV efficacy cannot be evaluated if PD are not challenged with Y. pestis. Second, BFF are highly susceptible to plague and even low exposure to Y. pestis can have substantial impacts on BFF survival (Godbey et al. 2006, Rocke et al. 2006, Matchett et al. 2010).
Field trials to evaluate SPV began in 2009 in Colorado (Tripp et al. 2014, 2015) and continued there through 2015 (Tripp et al. 2017). Rocke et al. (2017) reported results from a collaborative study evaluating the effectiveness of SPV using 29 paired vaccine and placebo plots. That study included data from Colorado (Tripp et al. 2017), Wyoming (Boulerice 2017), and this study in Montana from 2013 to 2015. Data presented herein include a portion of the 2013–2015 Montana data that were included in Rocke et al. (2017), plus continued data collection on four pairs of plots in 2016 and 2017. The 2 years of additional data doubled the number of survival intervals available to evaluate, enhanced our ability to estimate capture probabilities and encompassed a time when Y. pestis was detected and observed declines in BTPD abundance were striking.
Materials and Methods
This study began in May 2013 and ended in August 2017. The U.S. Geological Survey (USGS) National Wildlife Health Center (NWHC) completed an Environmental Assessment to satisfy National Environmental Protection Act requirements (
Study area, plot establishment, and study design
Our study took place on the Charles M. Russell National Wildlife Refuge (CMR) located in southern Phillips County, Montana, USA (47° 38′ N, 107° 57′ W, Fig. 1). Data were collected on four experimental pairs of study plots (CMR1–CMR4) from 2013 through 2017. One plot from each pair was randomly chosen by the NWHC for SPV treatment and the other member of the pair received placebo baits without vaccine (Rocke et al. 2017). As much as possible, we established plots where 100% of the BTPD-occupied area in distinct polygons could be treated and sampled. Short of that, we established plots on easily defined portions of larger areas occupied by BTPD that were of similar sizes within a pair. The outer extent of active BTPD burrows defined distinct polygons describing the areas occupied by BTPD. Each was mapped annually using Trimble Juno 3B GPS equipment (Sunnyvale, CA, 94085) and ArcPad software (ESRI, Redlands, CA).
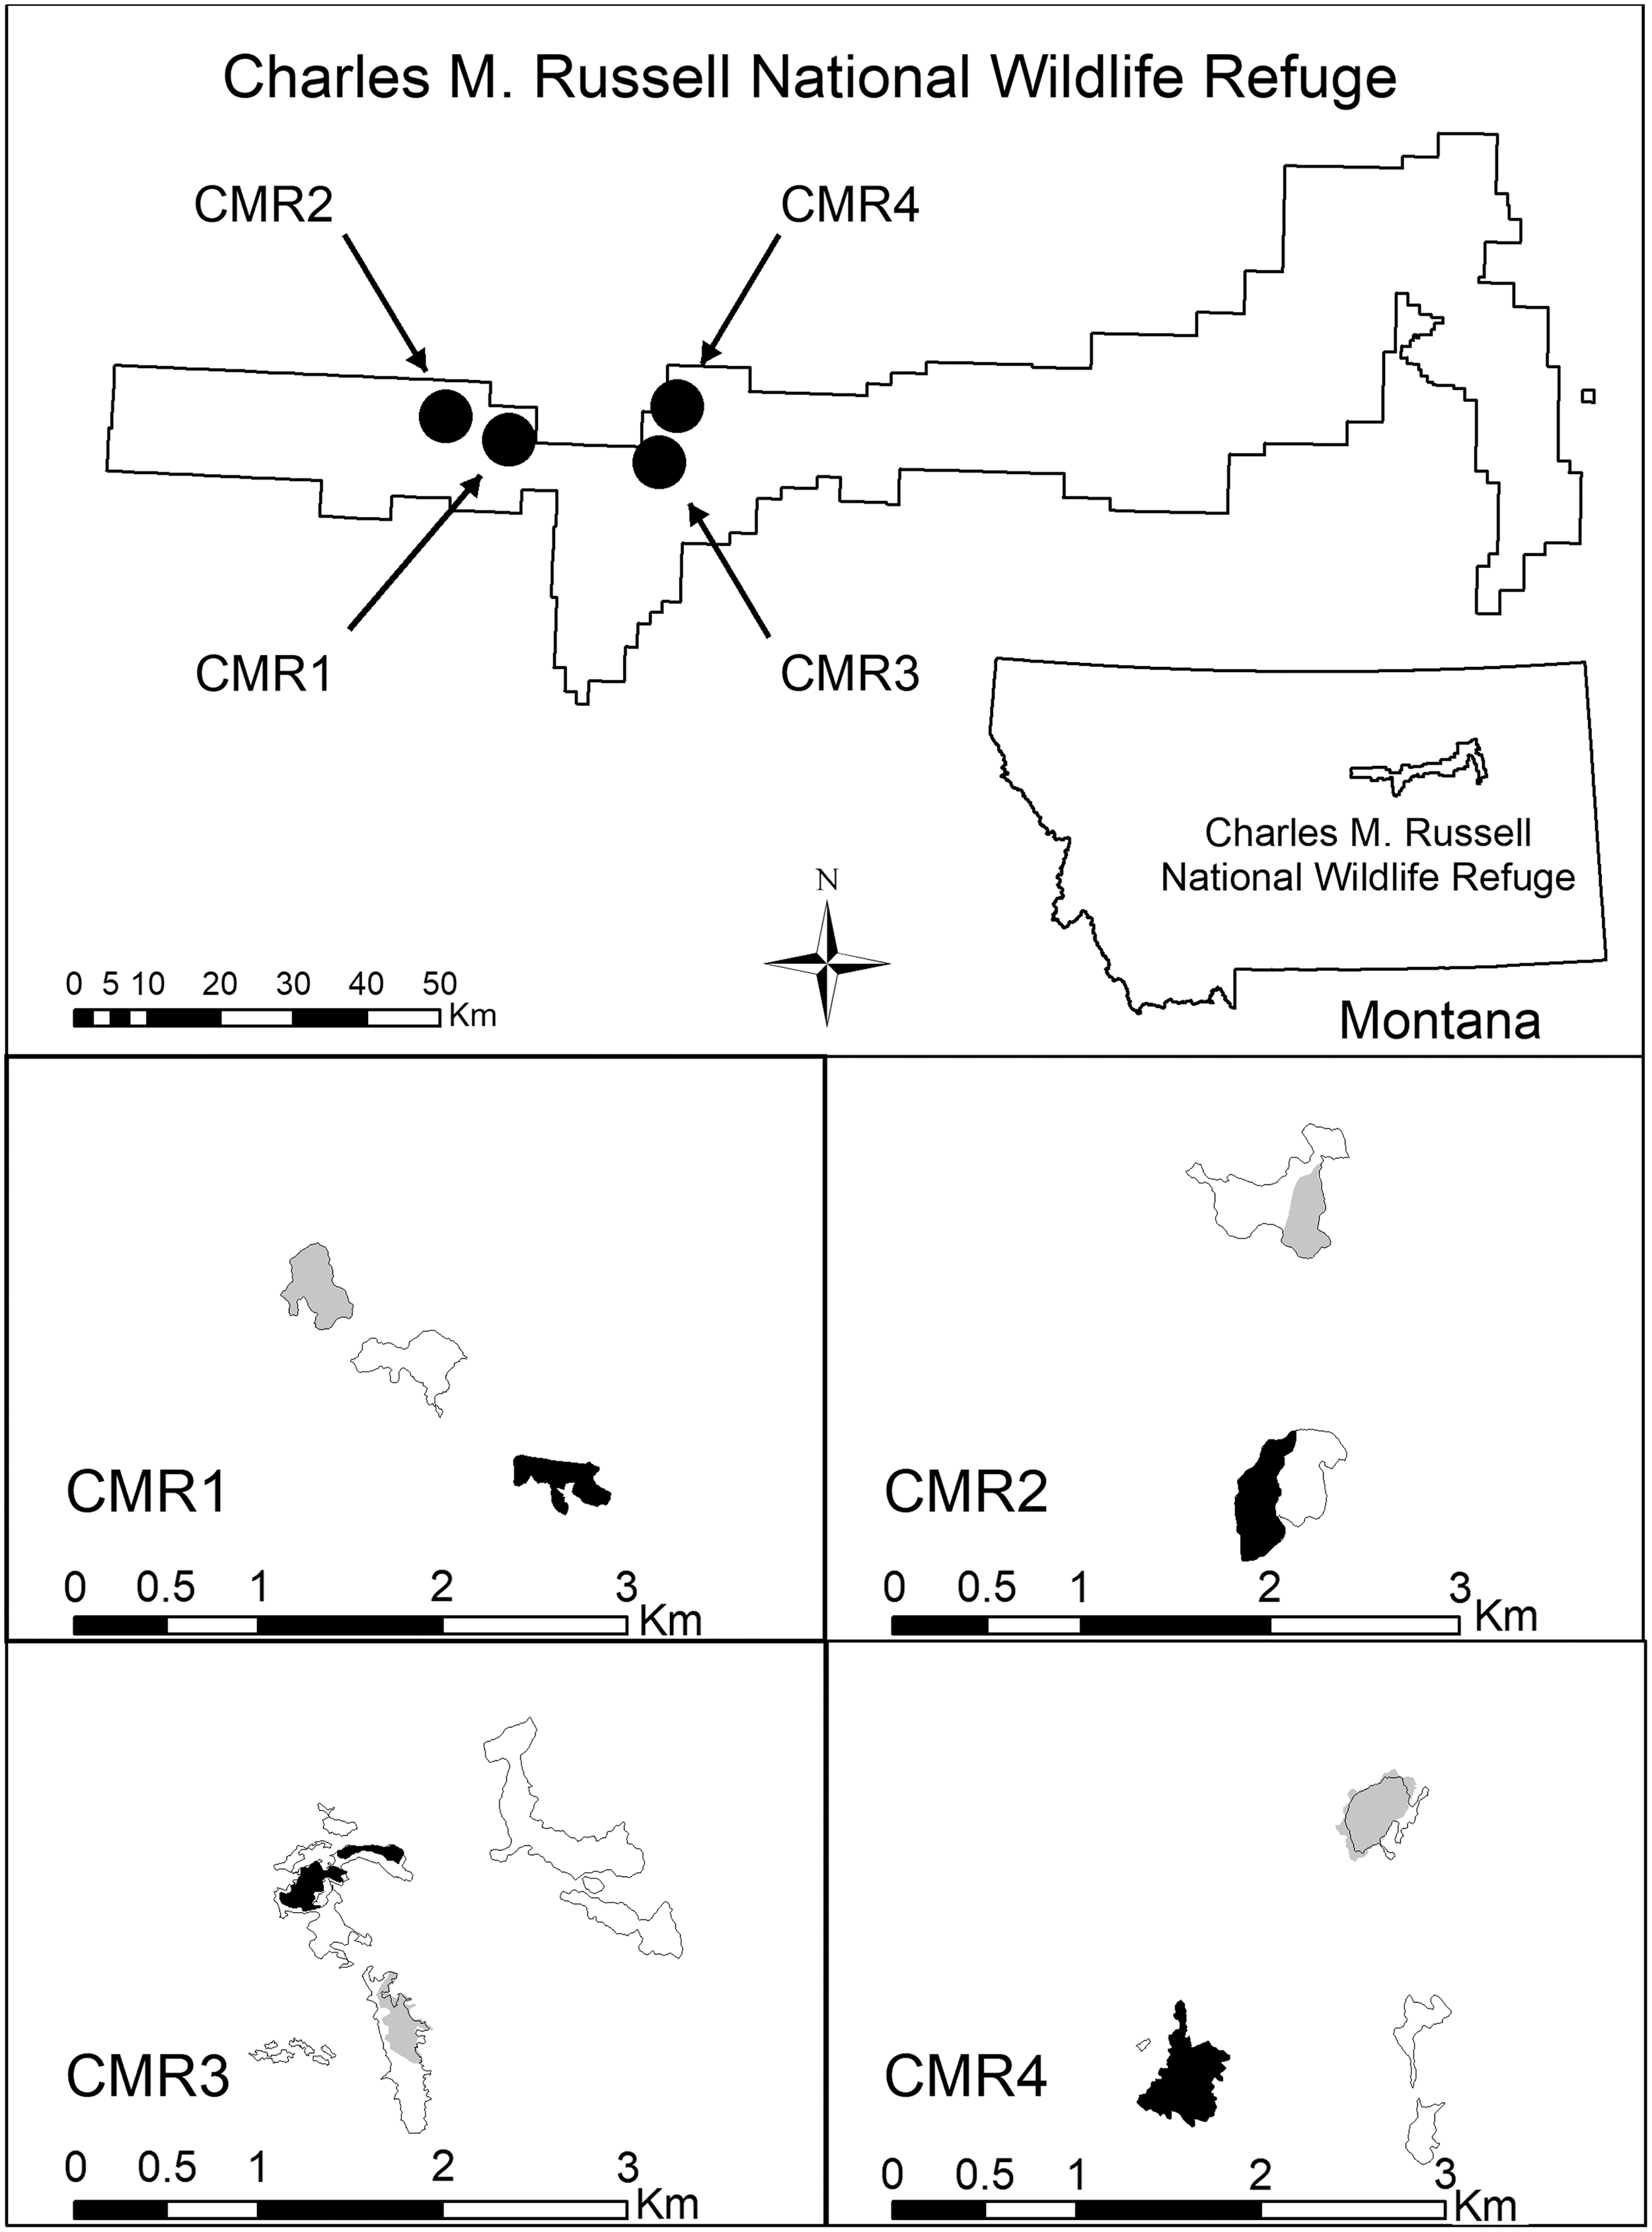
Study area map of experimental pair locations and extent of areas occupied by BTPD as mapped on the Charles M. Russell National Wildlife Refuge located in southern Phillips County, Montana, USA (47° 38′ N, 107° 57′ W) at the beginning of the study in 2013. Black shaded plots received sylvatic plague vaccine baits and gray shaded plots received placebo baits once annually between June 17 and July 31 each year from 2013 to 2016. Polygons without shading are nearby, nonstudy areas occupied by BTPD. BTPD, black-tailed prairie dogs.
Monitoring since 1979 indicates plague was the likely cause of multiple, sudden, and large BTPD declines on our study plots in the past. The CMR1 plots were located on opposite ends of what sometimes has been a near-single, contiguous colony situated along a narrow ridge and surrounded by virtually all non-BTPD habitat (Fig. 1 and Table 1) (Reading and Matchett 1997). There were only six BTPD colonies (totaling 98.8 ha; 0.5% of the surrounding habitat) within an 8 km radius of CMR1, two of which comprised the CMR2 pair (47.9 ha). Such isolation is an advantage for evaluating SPV effectiveness. Plague presumably caused the decline of BTPD-occupied area on CMR1 from 33 ha in 2004 to 9 ha in 2007. The separate colonies used for the CMR2 pair were similarly situated on a narrow ridge surrounded by extensive areas of non-BTPD habitat. Similar-sized plots were established on portions of each colony. Like the CMR1 pair, plague presumably caused a substantial decline in occupied area during 2007 from 47 to 1 ha and from 29 to 4 ha on the placebo and vaccine areas, respectively. The plots on the CMR3 pair were placed on portions of remaining BTPD-occupied fragments (33 ha) after a probable plague die-off of what was once a single contiguous colony that totaled 91 ha in 2010. Similarly, plots for the CMR4 pair were located on isolated remnants of what was once a single, contiguous colony that totaled 354 ha in 2006 before an apparent plague die-off from 2007 to 2008 that reduced its size to 33 ha. Plague interacts with many factors that cause PD colony declines (e.g., drought and winter length/severity; Biggins and Eads 2019), but we (and others; Barnes 1993) have not observed factors other than plague to cause BTPD declines like those described in this paragraph.
Plot Sizes as Defined by the Area (ha) Within 30-meter Buffers Surrounding Trap Locations, the Percentage (Maximum 100%) of the Area Occupied by Black-Tailed Prairie Dogs (Area30 meter trap buffer/Areaoccupied × 100), and the Difference Between the Percentage of Black-Tailed Prairie Dogs Occupied-Area Trapped Within a Pair Calculated as Averagevaccine − Averageplacebo
Positive values indicate a higher percentage of the vaccine plot was trapped compared with the placebo plot.
BTPD, black-tailed prairie dogs; CMR, Charles M. Russell National Wildlife Refuge, Montana, USA.
The NWHC produced and supplied all the vaccine and baits used in this study. Vaccine baits were periodically checked to confirm sufficient vaccine virus titers (Rocke et al. 2017). The cold chain in shipping and transporting baits was never broken during shipment from the NWHC until the morning of bait distribution. Frozen baits were distributed at a rate of 125/ha using a 9 × 9 meters grid pattern. Members of each pair were treated within 3 h of sunrise on the same morning, once annually, from 2013 to 2016 between June 17 and July 31 (Table 2). Field staff were blind to which member of a pair received SPV or placebo baits until 2016.
Sylvatic Plague Vaccine Baiting and Black-Tailed Prairie Dog Trapping Dates, Days Postbaiting That Trapping Occurred, Annual Bait Uptake Rates as Indicated by Rhodamine B Fluorescence in Hair or Whiskers (RB+ %), and Difference Between Vaccine and Placebo Plot Bait Uptake Rates Calculated as RB+vaccine − RB+placebo
Positive values indicate a higher bait uptake rate on the vaccine plot compared with the placebo plot. Pair comparisons in bold were significantly different (χ 2, p < 0.05), otherwise there were no other significant differences detected. No baits were distributed in 2017.
This study was originally scheduled to end in 2015. Results from the first 3 years indicated lower annual apparent survival (hereafter survival) on vaccine plots compared with placebo plots when accounting for imperfect capture probabilities. However, multiple metrics indicated greater BTPD abundance on vaccine plots compared with placebo plots at the beginning of, and during our study, which we postulated, might lead to underestimation of survival on vaccine plots due to trap competition (i.e., recaptures of previously marked BTPD on vaccine plots might be lower, causing underestimation of survival compared with placebo plots, where the ratio of BTPD to traps was lower because of the differences in BTPD density resulting in potentially not enough trap effort on vaccine plots to adequately recapture previously marked BTPD in comparison to the BTPD to trap ratio on placebo plots). Therefore, a fourth year of SPV treatment and BTPD mark-recapture data were collected during 2016 implementing 4.5 times the trapping effort compared with the previous 3 years. We conducted two trapping sessions in 2016, pre- and post-SPV treatments, and doubled the number of traps and trapping days during the post-treatment trapping session. We included all animals caught during 2016 in our survival analyses regardless of when they were caught during 2016.
BTPD die-offs were obvious and plague was detected during 2016 on three of the eight plots (two placebo, one vaccine). Hence, a fifth year of data collection was completed in 2017 to further evaluate SPV effectiveness, BTPD survival, and remaining population levels 1 year later. All previously marked animals caught in 2017 were recorded, but no additional animals were marked. This constraint precluded using a robust design analysis approach.
We calculated three indices of BTPD abundance. The first was catch per unit effort (CPUE), which was defined as the number of unique animals caught per plot each year divided by the actual number of trap days (atd; Rocke et al. 2017). The variable atd was defined as the product of the number of traps set and the number of days trapped, minus the number of closed traps found empty or with a nontarget species when checked. For the second index we used the “Huggins' p and c” selection in MARK (White and Burnham 1999) to obtain point and error estimates for population abundance on each plot during 3-day trapping efforts while accounting for imperfect capture (p) and recapture (c) probabilities. The area bounded by a 30-meter buffer around each trap location each year defined area trapped and was used to calculate BTPD density. The third index was trap success computed as the total number of captures divided by total trap days (Tripp et al. 2017).
BTPD are herbivorous, acquiring water and nutrients from plants. Normalized Difference Vegetation Index (NDVI), a measure of the absorbance of visible and near-infrared light by plants, was used to estimate the relative density and greenness of vegetation at each plot at the time of trapping with potential effects of NDVI on BTPD capture probabilities and survival. NDVI values from 16-day Moderate Resolution Imaging Spectroradiometer composites that included the days of trapping for the center point of each plot were extracted for each plot (data available from NASA Earthdata;
Capture and handling of BTPD *
Procedures to catch, mark, and collect samples from BTPD generally followed Biggins et al. (2010), Rocke et al. (2017), and Tripp et al. (2017). Eighty to 160 single-door cage traps (Tru-Catch Traps, Belle Fourche, SD) were placed at active burrows distributed across each plot. Open, nonset traps were prebaited for 3–7 days with rolled corn, oat, barley, and molasses livestock feed. Trap locations were recorded with Garmin GPSMAP 64 Global Positioning Systems (Garmin International, Inc., Olathe, KS). Trapping procedures were simultaneous and identical within each trapping session within a pair. Traps were not moved during a trapping session.
Traps were generally set and baited near dusk, the night before each day, in a trapping session. Traps were checked once each day by mid-morning, closing open traps and transporting captured BTPD to a central processing site located off the plots. BTPD were anesthetized with isoflurane (Clipper Distributing Company, LLC, St. Joseph, MO) using a vaporizer (Anesthesia Equipment Service and Supply, Inc., Sanford, FL) and induction chamber. BTPD were then placed on an isoflurane mask, combed with a fine-toothed comb to remove fleas over a plastic tub (fleas were placed in cryovials filled with saline and frozen), had whiskers and hair samples plucked and were weighed, sexed, and aged (based primarily on mass). Each animal was marked with a unique passive radiofrequency tag (GPT-12; Biomark, Inc., Boise, ID) implanted subcutaneously between the shoulder blades, marked with an ear tag in each ear (Monel tag 1005-1; National Band and Tag Co., Newport, KY), had blood drawn through medial saphenous venipuncture (dried and stored on Nobuto strips; Advantec, Cole Parmer, Vernon Hills, IL) and batch marked with a livestock marking crayon (LA-CO Industries, Inc., Elk Grove Village, IL) to facilitate immediate release if caught again later during a trapping session. BTPD were released at their capture location once fully recovered from anesthesia.
Bait uptake
Baits contained the biomarker rhodamine B that can be detected in hair and whiskers for animals that ate bait (Rb+) up to 60 days later, versus those that did not (Rb−), by examining them under a fluorescence microscope (Fernandez and Rocke 2011, Abbott et al. 2018). We collectively sequenced the capture histories, age, and bait uptake data from 2013 to 2016 (N = 1,937) and eliminated the records for all BTPD whose lifetime bait uptake history was not absolutely certain (e.g., an Rb− BTPD first caught as an adult, but not caught in any previous year, could have previously eaten a bait). We censored 85 records (4%) with uncertain bait uptake history leaving a confirmed, known bait uptake history for 1,360 individuals sampled on 1,852 occasions.
BTPD movements
To evaluate if there might have been unequal movement rates for vaccine versus placebo plots, which could affect comparisons of survival estimates on paired plots because our methods cannot distinguish between emigration and mortality, we calculated the linear distance between all capture locations for each BTPD with two or more captures (N = 1,416 BTPD, N = 11,409 distance measurements). Greater movement rates could indicate greater emigration rates that might influence survival estimates, greater predation risk, and suggest greater potential for mixing of vaccinated and nonvaccinated BTPD that could affect herd immunity benefits.
Disease surveillance
From 2013 to 2017, opportunistically finding dead animals in our overall study area, or euthanasia of obviously sick animals, produced 21 BTPD that were submitted to the NWHC for necropsy and Y. pestis and Francisella tularensis (the causative agent for tularemia) testing using PCR (Rocke et al. 2017). Carcasses from desert cottontails (Sylvilagus audubonii, N = 10), deer mice (Peromyscus maniculatus, N = 9), and a northern grasshopper mouse (Onychomys leucogaster, N = 1) were also submitted and tested. Fleas collected from anesthetized BTPD were counted and identified to species at the NWHC and pooled by species and individual host, up to 10 fleas per pool, for Y. pestis testing (Russell et al. 2018).
Statistical analyses
Heavier PD have greater survival and reproductive output than lighter PD (Hoogland 2001, Facka et al. 2010, Stephens et al. 2018). To evaluate if mass indices might be different on vaccine or placebo plots, and potentially influence survival, we evaluated mass indices with two-tailed t-tests assuming unequal variances. To help evaluate if bait uptake indices might be biased high due to more frequent captures of Rb+ than Rb− animals (as found by Abbott et al. 2018), we compared single versus multiple captures within a trapping session between Rb+ and Rb− BTPD with chi-squared tests of independence. The odds ratio was calculated as Rb− single × Rb+multiple/Rb+single × Rb− multiple . We also tallied how frequently individual BTPD were assumed to be present, but not caught within a trapping session, and compared Rb+ and Rb− BTPD with chi-squared tests of independence. The assumption of presence was based on captures of an individual on any day before, and any day subsequent to, the day(s) without an intervening capture of that individual.
Y. pestis is primarily flea borne, and flea parasitism is a potential predictor of plague risk and mortality (Lorange et al. 2005, Eads et al. 2020). We evaluated differences in flea prevalence [hosts observed with flea(s)/hosts sampled] on vaccine and placebo plots for all years combined, and each year separately, with two-tailed Fisher's exact tests (Reiczigel et al. 2019). Similarly, we evaluated differences in mean flea abundance (total fleas/hosts sampled) and mean flea intensity (total fleas/hosts with fleas) on vaccine and placebo plots with t-tests with 1,000 bootstrap samples (Reiczigel et al. 2019).
Our primary objective was to estimate BTPD survival. We analyzed BTPD capture–recapture data under a Cormack–Jolly–Seber (CJS) model (Cormack 1964, Jolly 1965, Seber 1965) to estimate annual apparent survival (Φ), where apparent survival is the product of the probabilities of true survival and study area fidelity (Schaub and Royle 2014). Specifically, we used the “Live Captures (CJS)” selection in MARK (White and Burnham 1999) to construct candidate models and obtain point and error estimates while accounting for imperfect capture probabilities (p).
Because the set of models that can be constructed with the covariates we considered was large (Table 3), our approach was to start with the general group × time interaction model (where group = plot pair) for both Φ and p. We then constructed all subsets of this general model and identified the most parsimonious model from this set using Akaike's Information Criterion adjusted for small sample size (AIC c ) (Burnham and Anderson 2002). We used that model as a starting point to identify a parsimonious model for p using covariates. Covariates were integrated into models using a logit link and were used to model Φ and p associated with the sampling occasions under the CJS model (Lebreton et al. 1992). Finally, conditioning on our most parsimonious model for p, we constructed a set of models for Φ using covariates, then ranked them using model weights (w). These model weights are equivalent to Bayesian posterior model probabilities (Burnham and Anderson 2002). Our inferences with respect to Φ are based on the top-ranked model for plot pairs. We show models with ΔAIC c < 5. We exponentiated the treatment coefficient estimated in our CJS model to calculate the treatment odds ratio.
Definitions of Covariates Used to Model Annual Apparent Black-Tailed Prairie Dog Survival (Φ) and/or Capture Probability (p) from 2013 Through 2017
No fleas were collected in 2017, so to enable use of the fleaprev covariate for modeling, we averaged the plot-specific values over the previous 4 years and set the 2017 values to those averages. When the covariates fleaprev, NDVI, appt, and gppt were used in models to estimate Φ, the values were taken from the year marking the beginning of the interval, but when they were used to estimate p, they were taken from the year marking the end of the interval. We coded models this way because we expected flea prevalence and current vegetation conditions (quantity and greenness) to influence Φ over the course of the interval, whereas we expected them to influence p during captures at the end of the interval.
Another method of assessing SPV efficacy is to compare data for Rb+ and Rb− BTPD within plots. We compared annual reencounter rates (the proportion of marked BTPD that were recaptured the following year) (Tripp et al. 2017) for BTPD relative to annual bait uptake (Rb+/Rb−) within vaccine and placebo plots. If SPV was protective and plague was circulating, BTPD reencounter rates should be higher for Rb+ than Rb− animals, on vaccine plots in particular. In a CJS modeling environment, uptake status cannot change between intervals. Therefore, we used logistic regression where reencounter was the response variable and uptake, mass, pair, and treatment were predictor variables. Abbott et al. (2018) reported that heavier PD had higher bait uptake rates. Generally, heavier PD also have higher survival rates (Facka et al. 2010, Stephens et al. 2018) so we were concerned about multicollinearity issues with uptake and mass evaluations. Indeed, in logistic regression models, uptake and mass were positively correlated in all cases (p < 0.001) while accounting for sex and age. We started by analyzing all annual intervals together and considered all possible combinations of uptake, treatment, pair, and two-way and three-way interactions. We did not consider mass in those models because mass and uptake were positively correlated. Instead, we expanded the model set, replacing uptake with mass, to include all possible combinations of mass, treatment, pair, and interactions. This allowed us to compare the relative importance of uptake versus mass while avoiding issues with multicollinearity. We ranked the models by AIC and compared model weights. We also analyzed the data by interval because plague activity increased toward the end of the study.
One of our goals was to compare our results with companion studies of SPV. Such comparisons have been difficult because analyses were done and reported differently. We found annual reencounter rates to be a simple, available, and easily understood common index to survival on which results could be compared in multiple ways.
Results
Plot attributes
Cumulative area occupied by BTPD on all plots generally increased during 2013–2016. We responded by increasing areas treated and trapped (Table 1). Plot size was capped at 24 ha in 2016 to keep logistics manageable.
Several indices indicated BTPD were more abundant on vaccine plots compared with placebo plots at the beginning of this study in 2013 even though treatments were assigned randomly. Huggins' density estimates (N̂/ha) averaged 63% higher on vaccine plots (10.4) compared with placebo plots (6.4). Even though trap effort was the same, 49% more BTPD were initially marked on vaccine plots (281) than on placebo plots (189). CPUE averaged 54% more on vaccine plots (0.284) than on placebo plots (0.185). Trap success averaged 43% greater on vaccine plots (40) compared with placebo plots (28).
The average mass of juvenile BTPD on vaccine plots (
Flea burdens and plague surveillance
Flea prevalence and abundance were both significantly lower on vaccine plots than on placebo plots at the beginning of our study in 2013 (Table 4). There were no other significant differences in flea prevalence, abundance or intensity from 2014 to 2016, or overall. However, prevalence trended toward lower rates on vaccine plots during 2016 and overall.
Number of Black-Tailed Prairie Dogs Sampled, Flea Prevalence [Hosts Observed with Flea(s)/Hosts Sampled], Total Number of Fleas Collected (Fleas), Mean Flea Abundance (Total Fleas/Hosts Sampled), and Mean Flea Intensity (Total Fleas/Hosts with >0 Fleas) from 2013 to 2016 (Fleas Were Not Collected in 2017)
Flea prevalence for vaccine and placebo plots was compared using Fisher's exact test (p values shown for two-tailed tests). Flea intensity and abundance for vaccine and placebo plots was compared using t-test with 1,000 bootstrap samples.
Twenty-one BTPD carcasses were submitted for testing, 10 of which were from our study plots. Four of those 10 tested positive for Y. pestis. The first was found on the CMR2 placebo plot on October 22, 2015. The colony appeared normal and healthy at the time. The other three were found on June 9, 2016 on the CMR1 placebo plot. Two carcasses were found on the CMR1 vaccine plot in 2016 and one tested presumptively positive for tularemia (liver and spleen were PCR positive, but culture negative). One of 10 desert cottontails (not found on study plots; 7 in 2015 and 3 in 2016) tested positive for tularemia in 2015. Tests were all Y. pestis-negative for all other mammals tested.
We found Y. pestis-positive fleas in 2016 on 12 (0.5%) of the 2,282 total BTPD sampled from 2013 to 2016. In total, 4,618 fleas (48% Oropsylla hirsuta, 32% Pulex spp., 20% P. simulans, and 1% other, including Aetheca wagneri, O. bruneri, O. tuberculata, and O. tuberculata cynomuris) were tested in 2,384 pools. Twenty-three pools (0.96%) containing 81 fleas (60 O. hirsuta, 12 P. simulans, and 9 P. spp.) were Y. pestis positive.
During 2016, Y. pestis-positive fleas were collected from 3 of 108 BTPD sampled on the CMR1 placebo plot (6 pools with 18 fleas) and none of 159 BTPD sampled on the CMR1 vaccine plot. The same year, Y. pestis-positive fleas were collected from 1 of 38 BTPD sampled on the CMR2 placebo plot (2 pools with 3 fleas) and 8 of 76 BTPD sampled on the CMR2 vaccine plot (15 pools with 60 fleas). Seven of those eight BTPD were first caught during the 2016 prebait trapping session (mid-June). Six of those seven animals were caught again, ∼25 days later during the postbait trapping session and none of them observably carried any Y. pestis-positive fleas at that time.
Bait uptake
Annual bait uptake rates averaged nearly 80% and were remarkably similar between vaccine and placebo plots, except for the CMR3 pair in 2013, 2014, and 2016, and on the CMR4 pair during 2016 (Table 2). Bait uptake on the CMR3 vaccine plot was significantly less than on the placebo plot, but was higher on the CMR4 vaccine plot compared with the placebo plot. We found no correlation between bait uptake and any of our BTPD abundance measures.
On average in 2015, after 3 consecutive years of SPV treatments, 99% of adult BTPD sampled on vaccine plots had consumed at least one bait during their lifetime and 43% had consumed baits over multiple years (Table 5). Such apparent boosting should further improve protection from plague (Rocke et al. 2014). On the CMR1 and CMR2 vaccine plots in 2015, 100% of sampled adults had consumed at least one bait and 50% had consumed baits in at least 2 years. Including juveniles that had not yet had an opportunity to consume multiple baits on those same plots, 89% of all sampled BTPD had consumed at least one bait and 40% had consumed baits over multiple years (Table 5). These results suggest near-complete treatment of the population and substantial boosting, presuming bait consumption equates to a protective immune response. This high level of bait consumption and boosting was documented just before detecting Y. pestis and observing substantial BTPD die-offs beginning in 2016.
Number of Black-Tailed Prairie Dogs Sampled and Lifetime Sylvatic Plague Vaccine Bait Uptake Rates as Indicated by Rhodamine B Fluorescence in Hair or Whiskers (Rb+ %) from Black-Tailed Prairie Dogs with Known Lifetime Bait Uptake History
It is possible multiple baits could be consumed within a year (unknown), but were counted as if they consumed a single bait in that year. Consumption of >1 bait indicates consumption of baits over multiple years (vaccine boosting).
Pcb, placebo; Vx, vaccine.
BTPD that were captured multiple times within a trapping session were more likely to be Rb+ than those captured only once (χ2 = 25.8, df = 1, p < 0.001, odds ratio 1.75, 95% confidence interval [CI] 1.406 to 2.167, N = 1,938). Of the 427 Rb− BTPD, 46% were caught multiple times compared with 60% of 1,511 Rb+ BTPD.
Excluding single captures within a trapping session, 22% of Rb− BTPD (N = 192) were missed during a trapping session and 24% of Rb+ (N = 770) were missed (χ2 = 0.192, df = 1, p = 0.661) for 3-day sessions. For 5-day sessions, 54% of Rb− (N = 148) were missed and 56% of Rb+ (N = 318) were missed (χ2 = 0.076, df = 1, p = 0.782). For 6-day capture sessions, 53% of Rb− (N = 43) were missed and 67% of Rb+ (N = 232) were missed (χ2 = 2.820, df = 1, p = 0.093).
Annual survival
Our top CJS model included plot × t, treatment, sex, and NDVI × t for estimates of Φ and age, atd × t, and percr for estimates of p while constraining p to be equal over the first, second, and fourth time intervals, but not the third (Table 6). Parameter estimates, standard errors and CIs are listed in Table 7. Trap effort was the lowest, and similar, for the first 3 years of our study (Table 8), but was increased 4.5 times in 2016 to address a postulated concern that trap competition may have been contributing to underestimated survival rates on vaccine plots because of greater BTPD abundance on vaccine plots compared to placebo plots. Trap effort was somewhat higher (33%) in 2017 than it was during the first 3 years.
Model Selection Results
Only models within 5 AIC c units of the lowest AIC c model are shown. ΔAIC c is the difference between the AIC c of the lowest AIC c model and the AIC c of the model referenced. AIC c weight (w) is the relative weight (equivalent to Bayesian posterior model probabilities) assigned to each model, and K is the number of estimated parameters in the model. The notation p1 = p2 = p4 indicates that capture probabilities were constrained to be equal during occasions 1 (2014), 2 (2015), and 4 (2017), and p3 (2016) was estimated separately. Trap effort was most similar during occasions 1, 2, and 4.
AIC c , Akaike Information Criteria, corrected.
Parameter Estimates, Standard Errors, and 95% Confidence Intervals from the Top Model for Estimates of Annual Apparent Survival (Φ) and Capture Probability (p) of Black-Tailed Prairie Dogs Monitored from 2013 to 2017
For categorical covariates we coded the design matrix for the linear predictor using dummy variables, which compare each level of the covariate with an omitted reference level that we specify in the Notes column.
CI, confidence interval.
Number of Trap Days (the Product of the Number of Traps and Number of Days Trapped) in Each Trapping Session Relative to Distributing Sylvatic Plague Vaccine and Placebo Baits from 2013 to 2017 (No Baits Were Distributed in 2017)
No baits were distributed in 2017. 2017-Post simply indicates trapping was completed in July and August, similar to the Post time periods in previous years.
The top three CJS models included the treatment variable for estimates of Φ (Table 6). The coefficient for this variable based on the most parsimonious model was negative (−0.231) indicating survival was lower on vaccine plots. The 95% CI did not cover zero (−0.447 to −0.015) suggesting treatment has explanatory value. Indeed, when we dropped the treatment variable from the top model and reanalyzed the data, we got a ΔAIC c value of 2.35 and a model weight of 0.118 (Table 6). Because the model weights are equivalent to Bayesian posterior model probabilities (Burnham and Anderson 2002), and because the weight for the top model was 0.381, we interpret this to mean the top model that included the treatment variable is at least three times more likely to be the better model. The odds ratio for treatment was <1 (0.794) and its 95% CI did not cover one (0.640 to 0.985), which can be interpreted as evidence suggesting the vaccine treatment reduced survival.
Plague was not detected on the CMR1 pair from 2013 to 2015 and survival averaged 0.59 and 0.64 on the vaccine and placebo plots, respectively (Table 9 and Fig. 2). In 2016 on the CMR1 pair, when substantial BTPD losses were visually quite noticeable on both plots and Y. pestis-positive fleas and BTPD carcasses were found on the placebo plot, the survival estimates dropped to 0.16 and 0.19 on the vaccine and placebo plots, respectively. This drop followed 3 consecutive years of SPV treatment where in 2015, 88% of the sampled BTPD had consumed at least one bait and 42% had consumed baits over multiple years. * The noticeable BTPD die-off that began in 2016 on CMR1 was the reason a fifth year of data was collected in 2017. Even with a fourth consecutive year of SPV treatment in 2016, survival estimates on CMR1 declined further in 2017 to 0.07 and 0.09 on vaccine and placebo plots, respectively.

Annual apparent survival rates and 95% confidence intervals based on the top-ranked model for BTPD residing on paired plots treated annually with sylvatic plague vaccine baits (gray bars) and plots receiving placebo baits (white hollow bars) from 2013 to 2017.
Comparative Annual Apparent Survival Rate Estimates and Reencounter Rates for Prairie Dogs on Plots Receiving Sylvatic Plague Vaccine Baits and Those on Paired Plots Receiving Placebo Baits from This Study (Montana), Boulerice (2017) (Wyoming), Tripp et al. (2017) (Colorado), and Rocke et al. (2017)
Reencounter rate is defined as the proportion of marked prairie dogs that were recaptured the next year (Tripp et al. 2017). One pair of plots from Tripp et al. (2017) was omitted because plague was active there when that study began. “Net difference” is the net difference in average rate on the vaccine plot subtracted from the paired average placebo plot rate. Bold font indicates plague was detected as defined by Rocke et al. (2017).
nr, not reported.
Plague was not detected on the CMR2 pair from 2013 to 2015 and survival averaged 0.62 and 0.67 on the vaccine and placebo plots, respectively. In 2016 on the CMR2 pair, when substantial BTPD losses were also visually quite noticeable and Y. pestis positive fleas were found on both plots, the survival estimates plummeted to 0.05 and 0.06 on the vaccine and placebo plots, respectively. This crash followed 3 consecutive years of SPV treatment where in 2015, 89% of the sampled BTPD had consumed at least one bait and 38% consumed baits over multiple years, likely boosting their protection.
Reencounter rates of Rb+ and Rb− BTPD within plots
If SPV provides protection and plague was circulating, we would have expected our logistic regression analysis to detect a significant interaction between treatment and bait uptake, with a positive effect of uptake on vaccine plots (because SPV is providing protection from plague) and no effect of uptake on placebo plots (where there should be no protection from plague). When considering uptake and mass in separate, but comparable models, we failed to detect any substantial interaction between uptake and treatment; that is, any effect of uptake was similar for vaccine and placebo plots. Instead, mass gained considerably more support in models than uptake. The first model that included bait uptake had no AIC weight and was 45 AIC units away from the related mass model.
When analyzed by year interval, we found little consistent support for an uptake × treatment interaction, and when we did detect the interaction in the final two intervals, the effect of uptake could not be separated from mass. We do note that in the final interval, there appeared to be a positive effect of uptake on reencounter rates on vaccine plots, yet almost all of the treatment effects (by pair due to a treatment × pair interaction) suggested a negative effect of SPV on annual reencounters, consistent with the CJS analysis of survival.
BTPD movements
BTPD movements were significantly less on vaccine plots than on placebo plots (Table 10). Except for six individual long-range movements (417–7,600 meters) detected between plots over the course of the study, three emigrating from vaccine plots and three from placebo plots, no BTPD were caught at distances greater than 400 meters apart among 2,275 marked BTPD and 6,351 capture events from 2013 to 2017. These distance measures include all between-year movements and all capture locations for BTPD first caught as a juvenile and later caught as an adult. Average distance between captures was <100 meters for 96% and 93% of all distance measures on vaccine and placebo plots, respectively.
Average Distances Among All Capture Locations of Individual Black-Tailed Prairie Dogs from 2013 to 2017
N = number of distance measures. Difference in means evaluated with two-tailed t-test assuming unequal variances (p). Difference was calculated as Averagevaccine − Averageplacebo with negative values representing smaller average movement distances on vaccine plots.
Discussion
Pathogen detection
The maxim: “absence of evidence is not evidence of absence” applies to all pathogens. We debated inclusion of a variable for Y. pestis detection in our models and ultimately excluded it. To include such a binary categorization, we felt its meaning and weight needed to be equal in both directions. Detection indicates presence, and presumably challenge to animals, but absence of detection does not mean absence of the pathogen or absence of challenge. The rarity of Y. pestis detections given our nontrivial sampling efforts, along with the rarity of Y. pestis detections from Holmes et al. (2006), Biggins et al. (2010), Matchett et al. (2010), Russell et al. (2018), and Bron et al. (2019), are among the reasons we did not include a plague detection variable in our evaluations (for additional discussion, see Eads and Biggins 2021, Eads et al. 2021).
Our plague detection probability from flea combing was likely low given our modest level of sampling; just ∼50 BTPD on each plot annually during a few days in summer only. We found just 10 BTPD carcasses on our study plots over 5 years. Y. pestis was detected in 4 of them, but none of the other 37 carcasses found in the vicinity of our study plots. Many PD succumbing to disease likely die underground and scavengers quickly consume those animals that die on the surface (Boone et al. 2009, McTee et al. 2019), resulting in few carcasses being found by humans, even during plague epizootics with high researcher presence and opportunities to encounter carcasses.
Tularemia is a native, widespread disease in North America and has rarely been detected in BTPD outside of highly unnatural captive settings (Avashia et al. 2004, Petersen et al. 2004). The single BTPD carcass found on the CMR1 vaccine plot that was positive for tularemia was the only detection of tularemia among all of the SPV studies (Boulerice 2017, Rocke et al. 2017, Tripp et al. 2017). “Tularemia is rarely found in prairie dogs. In more than 20 years, CDC personnel have not found tularemia in prairie dogs even though tissues tested for plague were also tested for tularemia” (Barnes 1993:35–36). We know of no examples of tularemia causing large-scale PD losses, even when specifically searched for in association with an epizootic in voles (Microtus spp., Cherry et al. 2019). Serum samples from 42 adult BFF collected from 2004 to 2008 near our study sites tested positive for F. tularensis antibodies during four of those 5 years, suggesting common exposure and during a time when BTPD populations remained at healthy, normal levels. Nonetheless, diagnostic methods are poorly standardized and tularemia may be underdiagnosed (Maurin 2020). A strength of our paired plot study design, and that the paired plots were reasonably close together, is that plague, tularemia, predation, and a host of other mortality factors can be assumed to affect our paired plots similarly, regardless of documenting specific causes of mortality.
The BFF Recovery Plan (U.S. Fish and Wildlife Service 2013) states that plague in PD has been documented at, or within 40 km, of all but a few reintroduction sites. From a management perspective, assumption of Y. pestis presence is essential to effective BFF conservation. Any plague mitigation measure(s) need to maintain healthy and abundant PD populations regardless of plague detection. Numerous BFF reintroduction sites have failed with the collapse of PD colony complexes attributed to plague, most of which did not confirm Y. pestis as the agent that caused the die-offs (U.S. Fish and Wildlife Service 2019). We know varied and challenging weather conditions affect PD populations (Grassel et al. 2016, Stephens et al. 2018), but plague is the only disease known to cause near, or total colony collapses, and the disease poses persistent risks between epizootics.
Plague challenge
Y. pestis was detected on three plots on two of our four pairs where we are confident there was sufficient plague challenge to evaluate SPV effectiveness. It is likely there was some level of plague challenge on the other plots given our premise that plague routinely circulates, often undetected, in an enzootic state. Indeed, there is a long history of multiple, large-scale BTPD die-offs throughout Phillips County, Montana, and specifically on our study plots, consistent with recurring plague epizootics beginning in 1992 (Matchett 2002, Collinge et al. 2005a, 2005b, Augustine et al. 2008).
Widespread BTPD die-offs on many colonies in Phillips County were observed in 2007 (Matchett et al. 2010). Blood samples were collected that year from remaining BTPD on all of the colonies involved in this study. We detected 30 (N = 73, 41%) with Y. pestis-positive antibody titers suggesting there were plague survivors residing on pairs CMR1, CMR2, and CMR4 (passive hemagglutination/inhibition testing at the Center for Disease Control and Prevention, Fort Collins, CO). Twelve BTPD on those same three pairs also had Y. pestis-positive antibody titers in 2008. Samples from 108 BTPD residing on 6 nearby colonies that did not experience die-offs were also tested and none were positive for Y. pestis antibodies. This prior knowledge influenced our selection of study sites to maximize the expectation that our study animals would be challenged with Y. pestis and we would be able to realistically evaluate SPV effectiveness.
Survival and capture probabilities
Throughout our study, we consistently observed survival rates on vaccine plots that averaged 5% lower than on placebo plots (Fig. 2). The low BTPD survival rates on vaccine plots (0.16 and 0.05) in this study when plague was detected in the vicinity would likely result in a BTPD population insufficient to sustain a BFF population. Such low survival rates on vaccine plots are especially troubling given 3 consecutive years of SPV treatment before plague detection and where confirmed SPV bait consumption histories indicated 89% of sampled BTPD had consumed at least one bait, and 40% had likely been boosted having consumed bait in multiple years. BFF population persistence would also be unlikely with the low PD survival rates on vaccine plots (Table 9) reported by Tripp et al. (2017) and Boulerice (2017).
Survival rate estimates during 2016–2017 on the CMR2 pair were among the highest observed on all pairs during that interval and occurred immediately following the lowest survival estimates on any plots during the entire study (Table 9). We interpret that result as reflecting high survival of the very few plague survivors from the previous year, consistent with the numerous BTPD we found with Y. pestis-positive antibody titers post-die-offs in 2007. We suspect a similar scenario on the MSR-Vx (vaccine) plot in Colorado with 37% estimated survival during the 2014–2015 interval following a 6% survival estimate during the prior interval (Table 9) (Tripp et al. 2017).
The lack of SPV-induced improvement in BTPD survival is particularly troubling when, by multiple indicators, BTPD survival on our vaccine plots may have been higher to begin with compared with placebo plots. Greater BTPD abundance (advantageous in a social colonial system and an indicator of habitat quality), greater mass (better body condition is associated with higher survival) (Facka et al. 2010, Stephens et al. 2018) and lower flea burdens (lower flea-borne plague transmission) (Eads et al. 2016, Biggins and Eads 2019) at the beginning of our study on vaccine plots may have favored higher survival at the outset compared with placebo plots. Any beneficial SPV effects on survival should be additive to those potentially beneficial starting conditions.
Greater movement distances between capture locations on placebo plots, potentially contributing to higher predation risk (Lima and Dill 1990, Caro 2005), could also indicate greater emigration rates and potentially cause survival to have been underestimated on placebo plots. Despite these stacked potentials for higher comparative survival rates on vaccine plots compared with placebo plots, in addition to very high bait consumption and substantial boosting rates, our top model included a treatment effect that was negative with a 95% CI that did not overlap zero and we consistently observed lower survival on vaccine plots than on placebo plots.
The notion of insufficient trap effort contributing to underestimation of survival on vaccine plots was the reason for a fourth year of data collection and increasing our trap effort 4.5 times in 2016 compared with 2013–2015. That extra effort resulted in an increase of estimates of p (for all plots combined) from 0.67 and 0.61 in 2014 and 2015, respectively, to 0.91 in 2016. Severe drought in 2017, combined with somewhat increased trap effort (33%) compared with the first 3 years, contributed to an estimate of p = 0.97 in 2017. Because of the 2017 drought, forage was extremely limited and BTPD were highly attracted to the trap bait, resulting in very high BTPD “catchability.” In 2017, captures on the CMR3 vaccine plot averaged an amazingly high 97 BTPD/100 trap days and 91 BTPD/100 trap days on the CMR4 placebo plot. The extra trap effort in 2016 and trapping circumstances (drought) in 2017 resulted in estimates of p that approached 1.0, producing robust and reliable survival estimates.
While SPV experiments to date have not directly assessed BFF survival, the history of BFF recovery is replete with examples of BFF population extirpation when PD survival is low, for any reason. The small test plots herein, and in Rocke et al. (2017), Tripp et al. (2017), and Boulerice (2017), would not provide sufficient habitat for BFF populations, but we believe PD survival estimates resulting from those trials are translatable to what would be expected for BFF population persistence in the face of high PD mortality. Viable BFF populations are dependent on abundant, and generally stable PD populations; thus, PD survival rates are a sensitive attribute for assessing efficacy of plague management tools (see also Biggins et al. 2021b).
Annual reencounter rates within plots
Comparison of annual reencounter rates between Rb+ and Rb− BTPD within treatments is an additional and potentially powerful way to evaluate the data, comparing presumably protected (Rb+) with nonprotected, nonvaccinated (Rb−) BTPD living together on the same plots, complementing our paired plot treatment design. We failed to find any consistent support for an uptake × treatment interaction, which should have been strong if SPV was providing protection from plague, especially during the latter years of the study. The relatively few Rb− BTPD on both vaccine (17%) and placebo (16%) plots overall, but especially during the last half of the study (Table 5), may have interfered with detection of an interaction due to sparse or unbalanced data. The last two intervals were the only times plague appeared to become more active however, no fleas were collected in 2017 to allow for much of an opportunity to detect plague.
Abbott et al. (2018) reported PD that were recaptured during a trapping session were more likely to be Rb+ than animals caught only once. This could bias bait uptake estimates high with Rb+, “trap happy” PD, being caught at higher rates than Rb− animals. Although statistically significant (likely because of our large sample size), we do not think 46% of all Rb− animals being caught multiple times is meaningfully different than 60% of all Rb+ animals being caught multiple times. Yes, those differences may bias our bait consumption indices somewhat higher than actual, but we maintain the vast majority of BTPD consumed at least one bait, and a substantial number were likely boosted by consuming baits over multiple years (Table 5).
We also looked at capture frequency within a trapping session, relative to Rb+/Rb−, for a “trap happy” effect that might bias bait uptake rate estimates high. The idea here is similar to the way capture histories are used to estimate p in capture–recapture survival analyses, looking at the number of occasions an animal was not caught (missed), for example, a capture history of “101” for a 3-day trapping session. The more days an animal was not caught during a single trapping session, the more “trap shy” that animal might be. None of those comparisons were significantly different, suggesting there was no bias in “trapability” between Rb+ and Rb− BTPD that might bias interpretation of bait uptake rates.
Annual reencounter rate meta-analysis
Annual reencounter rates on our vaccine plots averaged 7% lower than on placebo plots (Table 9). Rocke et al. (2017) reported overall annual reencounter rates during 2013–2015 on vaccine plots that were 1% higher than on placebo plots (Table 9). To us, these effect sizes seem small, as do the 6% and 13% differences in annual reencounter rates observed on paired plots in Tripp et al. (2017) and Boulerice (2017), respectively (Table 9), although we note the differences were positive for a vaccine effect.
In a broader assessment, we combined the published data from Abbott et al. (2017) and Russell et al. (2019a) into a single data file, excluded data from pairs HEUT1, HEUT2, and HEUT4 for consistency with Rocke et al. (2017), and generated annual reencounter rates based on recurring animal ID numbers between years. These data (N = 9,271) are from PD sampled to assess bait uptake and/or flea burdens from 2013 to 2016. We found very small differences in annual reencounter rates between vaccine and placebo plots while accounting for plague detection in various ways (Table 11). With a focus on comparing Rb+ PD during a year when Y. pestis was not detected, but was then detected the following year fostering the scenario where vaccine effectiveness should shine if protective, there were virtually no differences in reencounter rates between vaccine and placebo plots. All of these effect sizes are small, especially in comparison to the positive effects of flea control on PD populations during plague epizootics (Biggins et al. 2021b). Similar to results herein, Rb+ PD were reencountered at a 5% higher rate on both vaccine and placebo plots compared with Rb− PD. It is interesting the overall reencounter rates were higher on both vaccine and placebo plots, and the rate was 0.018 lower on vaccine plots than on placebo plots when including the CMR data (that accounts for 24% of the total data set), but overall reencounter rates were lower, and there was no difference in reencounter rates between treatments, when the CMR data were excluded (Table 11).
Sample Sizes and Annual Reencounter Rates for Prairie Dogs on Vaccine and Placebo Plots When Yersinia pestis Was, and Was Not Detected; When Yersinia pestis Was Not Detected in the Current Year, but Was Detected the Following Year; and Any Yersinia pestis Detection Status Followed by Yersinia pestis Detection the Next Year Based on Data from Abbott et al. (2017) and Russell et al. (2019a) from 2013 to 2016 (Excluding Data from Pairs HEUT1, HEUT2, and HEUT4 for Consistency with Rocke et al. 2017)
Differences calculated as reencounter rate vaccine − reencounter rate placebo and reencounter rate Rb+ − reencounter rate Rb−.
Yp, Yersinia pestis.
Possible reasons SPV did not improve PD survival or maintain BFF habitat
Insufficient SPV bait uptake by PD, and/or insufficient immune response after consuming bait, could result in low survival rates with plague exposure. It would seem difficult to increase bait uptake much more than described in Table 5. If SPV was protective, the small percentage of BTPD that did not consume vaccine should not have resulted in those very low survival rates, especially with the presumed level of boosting we documented with consumption of baits over multiple years.
Vaccines rarely provide perfect immunity (Barnett and Civitello 2020). In the Rocke et al. (2014) study, 57% of BTPD died when challenged 30 days postvaccination after consumption of two SPV baits eaten 1 day apart, a result not statistically different from the placebo group. Forty percent died when challenged 270 days after consumption of two SPV baits eaten 1 day apart, probably the most similar comparison to operational field conditions. The effectiveness of a single SPV dose in laboratory challenges of GPD ranged from 80% in juveniles to 60% of young adults and 0% of adults surviving Y. pestis challenge 6 months postvaccination (Rocke et al. 2015). The substantial PD declines observed during epizootics on SPV-treated plots during this study, along with four others summarized by Biggins et al. (2021b: Table 2) are not unlike the results from laboratory studies, especially when typical wild PD population age structure and age-specific protection levels, along with bait consumption rates, are considered. * While PD population indices on vaccine plots in those four studies Biggins et al. (2021b) declined 14% less than on placebo plots, the average declines were still substantial (69%). On the two CMR pairs where we detected plague, survival declined from preplague detection an average of 82% on vaccine plots and 80% on placebo plots.
Unequal BTPD dispersal from vaccine plots, perhaps resulting from intraspecific competition at greater BTPD densities on vaccine plots compared with placebo plots, could contribute to underestimating survival on vaccine plots because our methods cannot distinguish between emigration and mortality. Using average distance between all capture locations for each BTPD as an index to movement rates, and potentially unequal emigration rates, we found greater movements on placebo plots compared with vaccine plots. We could not find any evidence that greater BTPD movements on vaccine plots contributed to survival underestimation there; perhaps the opposite, survival underestimation on placebo plots.
An inherent limitation to achieving high protection levels with this vaccine approach is the PD birth pulse each spring that typically doubles the size of the population (Crosby and Graham 1986, Hoogland 1995). This is a vaccine delivery problem; late summer and fall SPV treatments result in better uptake rates and have been encouraged (Tripp et al. 2014, Abbott et al. 2018). Even if SPV was distributed along transects in early summer after PD pup emergence with typically green vegetation, it is likely few juveniles would find baits as it takes maturation time for them to venture very far from natal burrows (Loughry 1992). It probably takes at least 2 months for protective titers to develop after bait consumption, additional time animals are left vulnerable to plague.
When assessed in combination, (1) nonvaccinated juveniles, (2) some percentage of the PD population that does not consume bait, (3) some level of less-than-sufficient immune response, (4) incomplete vaccine protection, and (5) time for immunity to develop, a large percentage of the population remains vulnerable to plague for at least 6–7 months each year from April to October. This is a time period in which the most common BTPD flea (O. hirsuta) typically increases in abundance (Wilder et al. 2008), thus increasing plague risk (Lorange et al. 2005, Tripp et al. 2009, Bosio et al. 2020, Eads et al. 2020, Biggins et al. 2021b; although see Brinkerhoff et al. 2010). The low survival rates observed on vaccine plots during active plague in this study, in Boulerice (2017) and in Tripp et al. (2017) should not be surprising given these constraints.
Exposure and plague infection severity in the wild involve a variety of interacting factors that may not be comparable to laboratory challenges. It is doubtful whether plague exposure in the wild would be less challenging than subcutaneous laboratory challenges, and the former may be more intense (Russell et al. 2019b). In addition to flea bites, consumption of tissues from animals that died of plague, inhalation, and multiple exposures over time are additional means of potential infection and disease transmission dynamics in a wild setting (Richgels et al. 2016, Russell et al. 2019b). A single subcutaneous injection in the laboratory, while adequate to cause mortality, may not be comparable to transmission by fleas in the wild. Hinnebusch et al. (2017:216) described: “Life stages in the arthropod [flea] are quite distinct, and it is the transmission stage of Y. pestis that is first encountered by the mammalian immune system in an intradermal microenvironment that cannot be duplicated by injecting cultured bacteria.”
The term “edge effects” has been used to describe two possible contributors to reduced SPV efficacy. On small colonies compared with larger colonies, a larger proportion of animals are living on the “edge” of the occupied area. Animals on small colonies, like our study plots, could possibly be exposed more frequently to external elements like plague. Second, when only a portion of a continuously PD-occupied area is treated, as was the case with two of our vaccine plots, edge effect may refer to nonvaccinated animals living adjacent to vaccine plots. Mixing of treated and nontreated PD along that edge could reduce our measures of treatment effect.
We are confident the potential influence of nontreated animals reducing treatment effects, be they nearby or immigrants from more distant areas, was minimal given the following: (1) the basic coterie social structure and behavioral ecology of colonial BTPD results in little movement, (2) the low rates of successful BTPD immigration reported in the literature, (3) 96% of the movement distances between individual BTPD capture locations on vaccine plots were <100 meters, and (4) our general lack of detecting interplot movements, even with plots fairly close together and with large sample sizes monitored over 5 years (see also Biggins et al. 2021b). This is especially true on the CMR1 and CMR4 pairs given their isolated locations in a large landscape of non-BTPD habitat. The CMR2 pair was also situated in a large landscape of non-BTPD habitat where influence of non-treated BTPD would be minimal, but there could have been some edge effect on the vaccine plot from treating the western portion of the BTPD-occupied area (average 67% treated) (Fig. 1 and Table 1).
Plague manipulation experiments with various treatments have improved survival for eight species of mammals in highly variable ecosystems (Biggins et al. 2010, 2021c, Matchett et al. 2010, Ramakrishnan 2017, Goldberg et al. 2021). Split area, paired plot study designs in such studies, where edge effects were likely substantial, still demonstrated improved survival from plague treatments. Thus, it seems unlikely that edge effects or study design flaws were responsible for our results demonstrating poor SPV performance.
Conclusions
For SPV to be considered a useful BFF conservation tool, treatment should result in substantially greater PD survival than no treatment, especially when considering annual SPV treatment cost about $67/ha ($0.54/bait) (U.S. Department of Agriculture Animal and Plant Health Inspection Service, Wildlife Services 2017). Labor and equipment to distribute the baits are additional costs. When plague was detected on our study plots, BTPD survival was low, often <10%, on paired vaccine and placebo plots alike. Such high BTPD mortality would jeopardize BFF population persistence. Similarly, low PD survival on vaccine plots was observed in Colorado (Tripp et al. 2017) and Wyoming (Boulerice 2017), indicating this result was not unique to our Montana study site. Plague may continue circulating as fleas are not controlled with SPV treatments, leaving BFF susceptible to plague. An overriding limitation to achieving high levels of protection with this vaccination approach rests with vaccine delivery constraints. Late summer/fall vaccine distribution results in the best bait uptake rates (Abbott et al. 2018), but with the PD birth pulse each spring, plus the time required for immunity to develop (and a variety of other factors), a large portion of a PD population is not vaccinated and remains vulnerable to plague for 6–7 months or more each year, including months in which plague flea vectors are typically most abundant on PD.
Footnotes
Acknowledgments
This study was a highly collaborative effort with the U.S. Fish and Wildlife Service (FWS), NWHC, the USGS Fort Collins Science Center (FORT), and the Western Association of Fish and Wildlife Agencies (WAFWA) with support from MFWP and World Wildlife Fund (WWF). This study would not have been possible without the many, many dedicated volunteers and seasonal field technicians over a 5-year period that persevered through intense heat, horrendous mosquitos, terrifying thunderstorms, and show-stopping Montana gumbo mud. Staff and logistical support from the CMR were essential ingredients to completing this study. Staff at the NWHC were instrumental in providing supplies, vaccine, baits, and completing all of the laboratory work. Staff at FORT helped with vehicle support, technician application review, and selection and logistics. The authors thank K. Gage (retired Center for Disease Control and Prevention); T. Rocke, D. Walsh, and K. Richgels (NWHC); D. Tripp (Colorado Parks and Wildlife); and two anonymous reviewers for helpful comments that improved the manuscript. While the authors greatly appreciate the valuable contributions from reviewers, by acknowledging them, the authors do not imply they agree with the authors' interpretation of results. All capture and handling methods used in this study were in accordance with protocols approved by the NWHC Animal Care and Use Committee (Protocol No. EP130214). Data are available in two USGS data releases (Matchett et al. 2021a, ![]() ).
).
Disclaimer
The findings and conclusions in this article are those of the authors and do not necessarily represent the views of the U.S. FWS. Any use of trade, product, or firm names is for descriptive purposes only and does not imply endorsement by the U.S. Government.
Author Disclosure Statement
No competing financial or conflicts of interest exist for any of the authors.
Funding Information
Funding was provided through the FWS, multiple USGS sources, grants from WAFWA, and support from MFWP and WWF.