
Abstract
Background:
Despite the growing popularity of mobile app interventions, specific engagement components of mobile apps have not been well studied.
Methods:
The objectives of this scoping review are to determine which components of mobile health intervention apps encouraged or hindered engagement, and examine how studies measured engagement.
Results:
A PubMed search on March 5, 2020 yielded 239 articles that featured the terms engagement, mobile app/mobile health, and adult. After applying exclusion criteria, only 54 studies were included in the final analysis.
Discussion:
Common app components associated with increased engagement included: personalized content/feedback, data visualization, reminders/push notifications, educational information/material, logging/self-monitoring functions, and goal-setting features. On the other hand, social media integration, social forums, poor app navigation, and technical difficulties appeared to contribute to lower engagement rates or decreased usage. Notably, the review revealed a great variability in how engagement with mobile health apps is measured due to lack of established processes.
Conclusion:
There is a critical need for controlled studies to provide guidelines and standards to help facilitate engagement and its measurement in research and clinical trial work using mobile health intervention apps.
Introduction
Enhancing participant engagement is considered a key priority for wellness and health care, especially as health care undergoes a shift toward the integration of digital technologies (e.g., mobile apps, health care monitors, and online portals with their consumer interfaces). 1,2 Technological systems play a critical role in enhancing participant engagement. 1,2 Among urban and low-income mothers, the use of smart-device technology for communication was a particularly important contributor to higher retention in longitudinal studies. 3 Providing digital health tools has not only led to an increase in study participation adherence rates, 4 but it has also contributed to measurable improvements in health care outcomes across several conditions. For instance, greater patient activation in their health care improved patient adherence to treatment prescriptions. 5 Participants' use of web portals to augment treatment of diabetes demonstrated improved glycemic control across multiple studies. 6 –8 Other studies have seen improvements in participants with HIV, 9 with coronary artery disease, 10 and with depression, 11 –13 highlighting how impactful the implementation of these tools can be across different clinical populations.
Schoeppe et al. 14 emphasized common strategies that successful mobile interventions often use, such as goal setting, self-monitoring, and performance feedback in their app design. To our knowledge, however, there has not been a scoping review of the specific components of mobile intervention apps that increase engagement. Common across all digital health tools are the focus on increased patient engagement and “empowerment,” which is a result of several qualities inherent in these tools. Most of these technological systems improve patients' communication with and access to health care providers, 1,2,15 and provide patients with more comprehensive information about their health on demand. 2,15 While these qualities are common across successful tools and play a large part in improving patient self-management and decreasing stress, 2 improved engagement is no guarantee.
Furthermore, measuring engagement is a challenge that has likely contributed to our lack of knowledge on app components that effectively increase this important metric. There are now several measures that quantify the amount of engagement that patients feel toward the digital tools and apps that are being developed, 2,15 but these are not widely used and engagement measurements are not standardized across studies. Some examples of such measures are the Patient Activation Measure (PAM 16 ), Mobile App Rating Scale (MARS 17 ), and the Patient Health Engagement scale (PHE-s 18 ). These measures create a quantifiable standardized method by which researchers can measure the phenomenon of user engagement during program development, and are important considerations when creating new digital tools for patients and clinical research participants.
In an effort to support the shift toward mobile interventions and the benefits of using mobile apps, this review article aims to address the following questions: What are the components or elements of mobile interventions that successfully increase participant engagement, and those that may hinder engagement? How do studies measure engagement?
By addressing these questions, we can inform how future work may be able to standardize this effort with apps or app features.
Methods
A PubMed search with the following criteria was conducted on March 5, 2020: (engagement[Title/Abstract]) AND (mobile app) OR (mobile health) AND (adult). To be included in the analysis, articles must have recruited participants who used a mobile intervention, and articles must have examined the usage of specific aspect(s) or component(s) of the mobile app, whether through measurable app metrics, through participant feedback, or through author conjecture. The participant population must have also consisted of patients or of individuals seeking treatment for a condition; articles examining health care providers, administrators, or employees as the participant population were not included in the analysis. Ineligible articles included articles that did not have participants use a mobile app intervention (i.e., design/protocol/methods-only articles were not included), did not provide insight into which particular feature(s) were engaging for participants, were not written in English, and/or were duplicates. This review article followed PRISMA guidelines for scoping review articles. There is no review protocol for this article. See Figure 1 for the PRISMA-based flow chart.
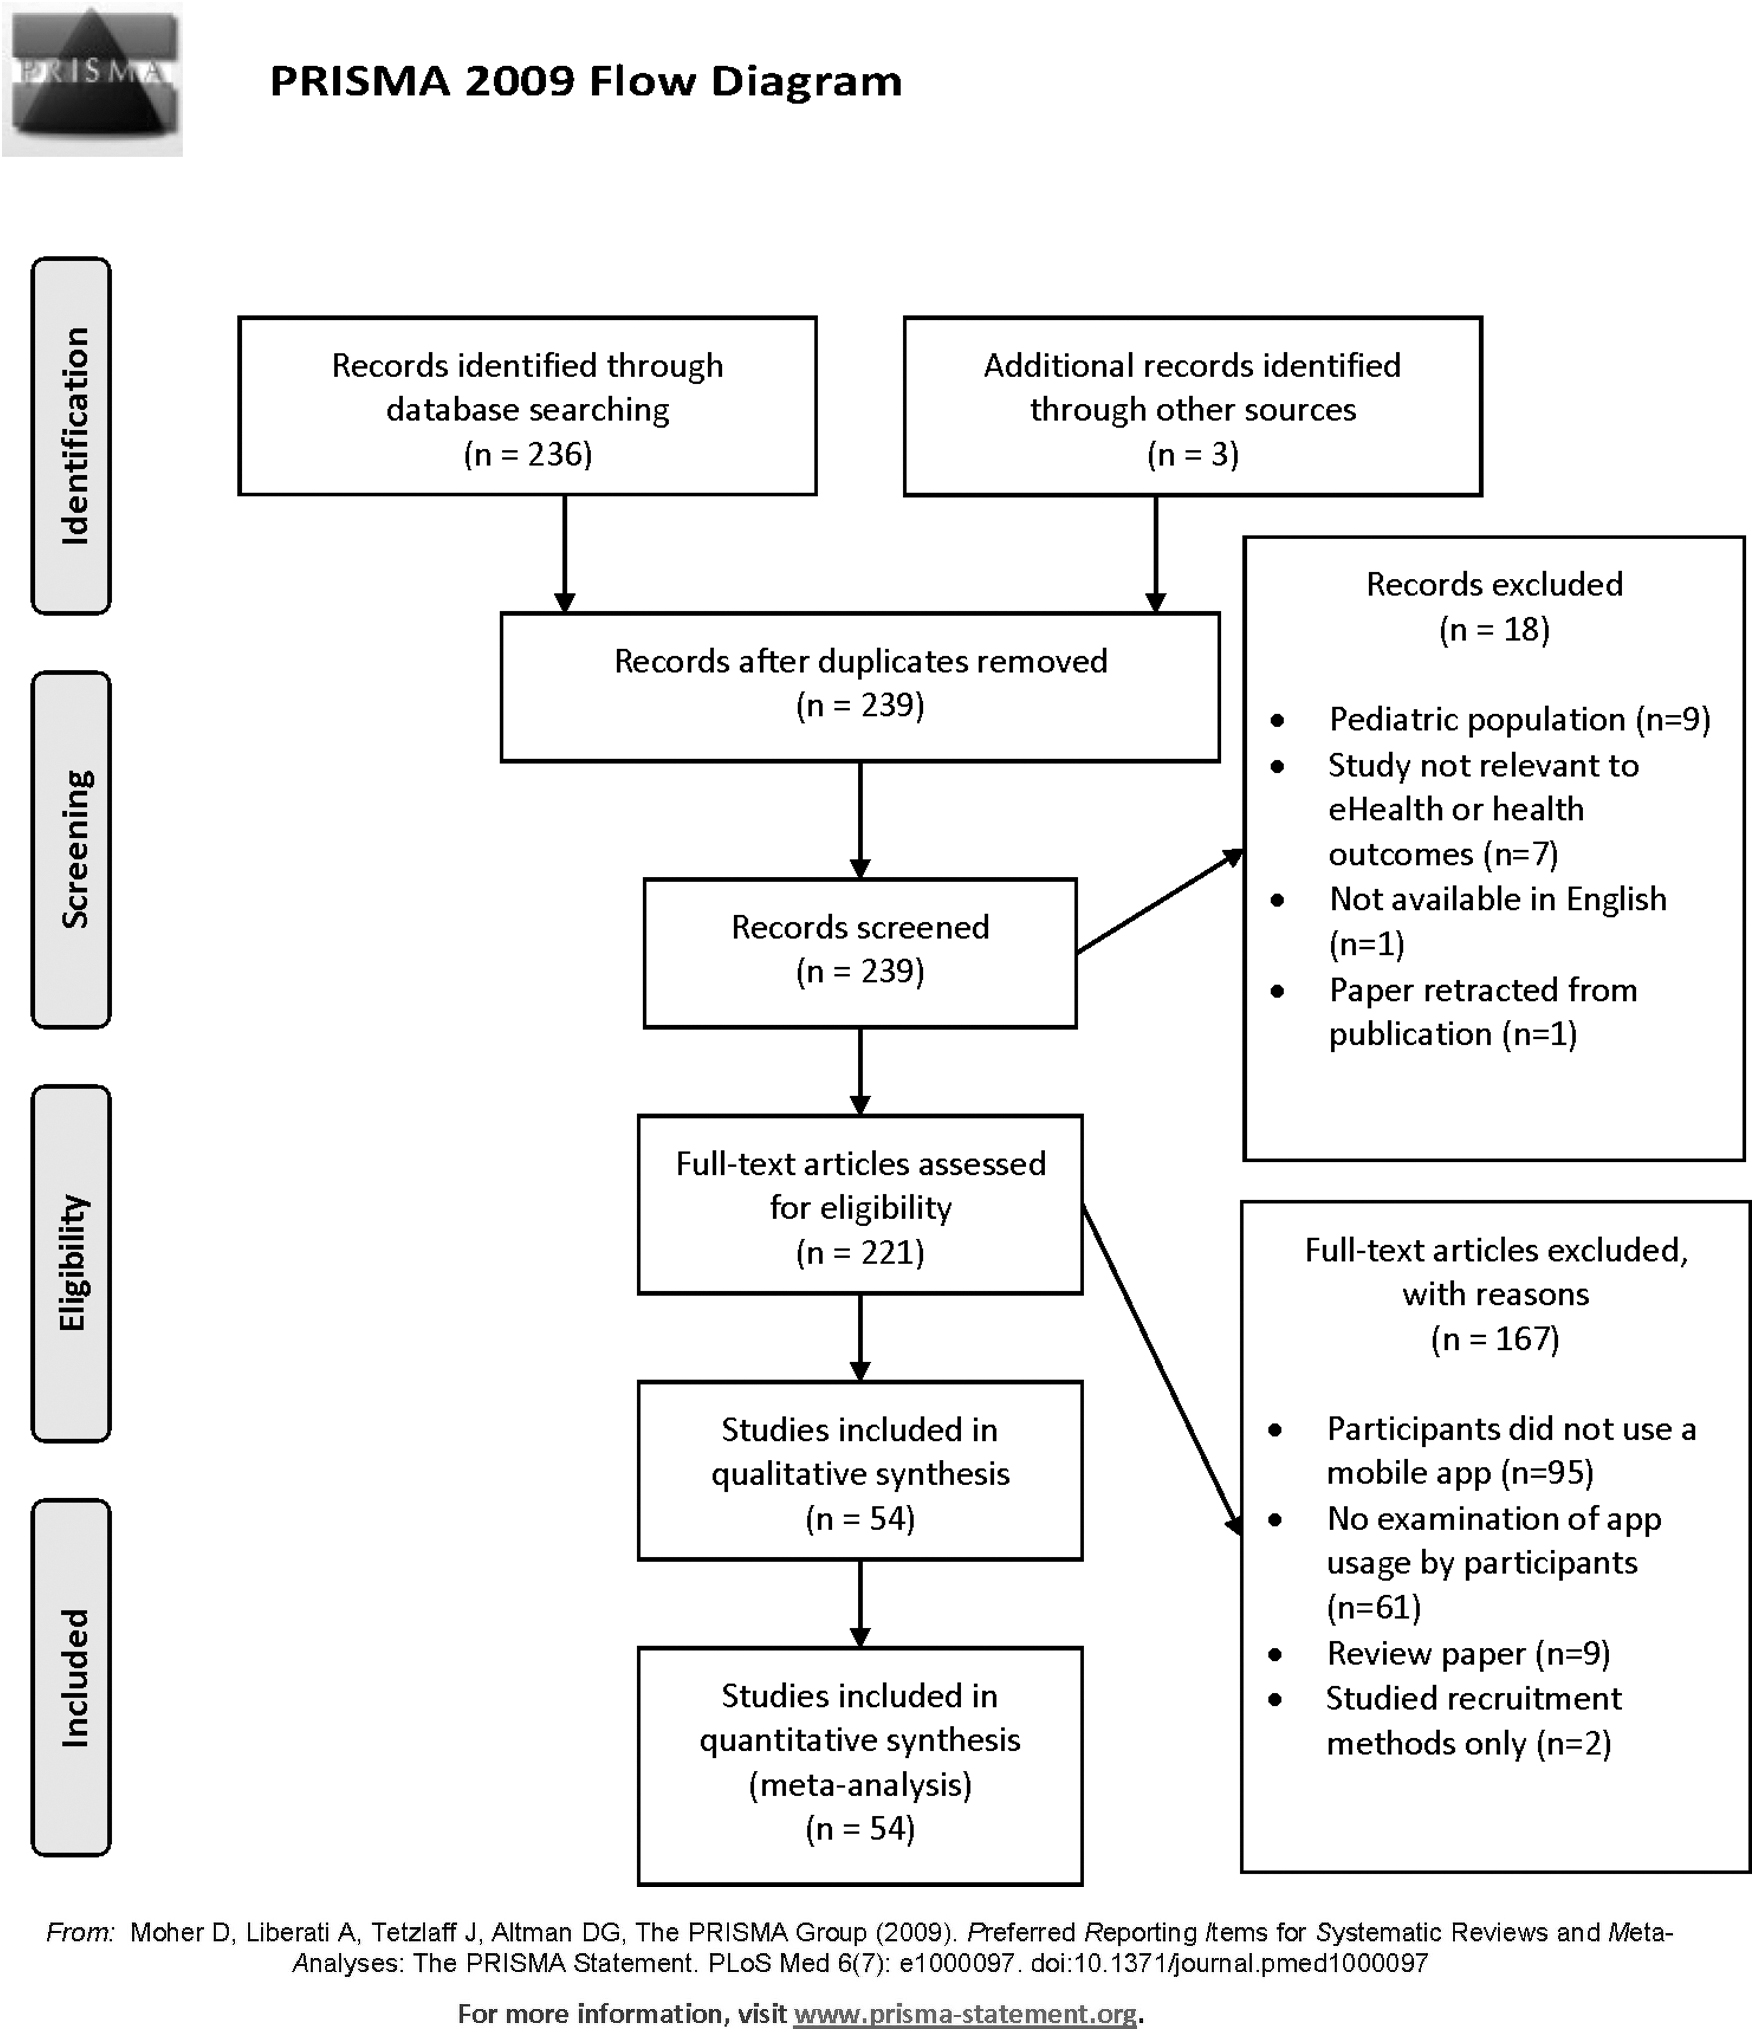
PRISMA flow chart of articles included in this review. From: Moher et al. 80
Before the original PubMed search, the process for data collection and analysis was agreed upon by the study team so that each article was screened for the same information and that data were collected the same way. Inclusion and exclusion criteria were also standardized as described above, and all reasons for exclusion were recorded specific to each article that was excluded from analysis. Data were extracted from reading each of the published articles' manuscripts. Information on the article's country of origin was collected based on the countries listed for each author. We also classified whether the article's outcome measure(s) for engagement were test based or opinion based: test-based outcome measures were measures that examined app usage in a measurable way (i.e., had outcomes that were quantifiable and based on measurements rather than on participant feedback) and opinion-based outcome measures were measures that did not have a quantifiable outcome (i.e., had outcomes that were based on subjectivity, participants' opinions, or qualitative measures). Additional information collected on each article included whether the study was randomized or not (as a binary yes/no), the study's participant sample size, and the length of app usage in the study. Length of app usage was converted into weeks of usage to standardize reporting. For instance, we converted articles that had reported usage time in months into usage time in weeks by dividing the number of months by 12 and then multiplying that number by 52 (the number of weeks in a year). We converted articles that reported usage time in days into usage time in weeks by dividing the number of days by 7.
To examine the features that were determined as “engaging” for participants and the methods by which each article examined engagement, we collected details on engagement measurements, retention rates, clinical changes, and the specific components identified as “engaging” or “not engaging.” We categorized the article's methods for measuring engagement into one of the following categories: did not measure, based on participant self-report (meaning no measurements were taken by the study team), app usage logs, log-in frequency, survey/lesson completion rate, number/length of app sessions, use of MARS 17 , use of Systems Usability Scale (SUS 19 ), or “Other.” The study's retention rates were reported (as a percent) based on the article's reported retention/attrition rate. If it was presented in another format or missing, we used the enrollment numbers to calculate the overall retention rate as a percentage, with the number of participants who were reportedly enrolled to use the mobile app treated as the total number enrolled, or the denominator, and the number of participants who were still enrolled at the last time point in the study was treated as the numerator. We also recorded whether the study reported or found any clinical changes by classifying it into one of the following categories: not reported, no differences, N/A, majority of participants self-reported the app as helpful/useful, trend, or yes, if differences were found. And lastly, we listed out the important app components that were most used by participants in the study and/or were associated with an increase in app engagement.
There was inconsistent reporting on studies' potential biases as not all articles assessed were randomized trials; however, as described above, the outcome measures used, whether or not the studies were randomized, and the methods of measuring engagement were all collected to inform the quality of each article's results.
Results
In total, 236 articles resulted from the search criteria. After removing articles based on exclusion criteria (Fig. 1), 54 articles were assessed for this review. Table 1 provides details regarding each study and its characteristics.
Summary List of Articles Included in the Review and Their Characteristics
M, measurable usage metrics; MARS, Mobile App Rating Scale; OB, opinion-based usage metrics; SUS, System Usability Scale.
More than half, 56% (n = 29) of articles, were from the USA, 7.8% (n = 4) were from the United Kingdom, 15.7% (n = 8) were from Australia, 3.9% (n = 2) from Canada, 7.8% (n = 4) from South Korea, 2% (n = 1) from Scotland, 2% (n = 1) from Singapore, and 3.9% (n = 3) involved more than one country (Australia/USA, U.K./Italy, and U.K./Saudi Arabia). There was a wide variety of health realms targeted by the mobile interventions (Table 1), including: Asthma, Rheumatoid Arthritis, Breast Cancer prevention, Heart disease, Pain management, Neurological diseases (one multiple sclerosis and one dementia), Diabetes management, Diet, Electronic health records access, General health monitoring, HIV, Hypertension, Mental health, Physical Activity, Pregnancy, Smoking cessation, Rehabilitation, Alcohol/Substance abuse, and Weight loss (involving both diet and physical activity). There was a near-even split between studies that examined the use of the app based on quantifiable measures or “test-based” (33.3%, n = 18), qualitative measures or “opinion-based” (31.5%, n = 17), and studies that used both test-based and opinion-based outcomes (35.1%, n = 19). However, only 25.9% (14/54) articles were randomized studies. The median participant sample size was 77, with a wide range from 10 participants up to 12,427,196.
Comparison Of Suggested Design Element/App Components
Table 2 outlines the app components that were associated with more participant engagement. Across health conditions, three major areas emerged that were associated with greater engagement: (1) Diaries (logging) and feedback: meal, blood pressure, medications, and weight loggings, visualization of participant's health data over time, personalized feedback based on questionnaires or from health care providers; (2) Coaching and education: goal-setting tools, health coach/provider messaging, personalized content, educational modules or lessons; and (3) Reminders: reminder tests and/or app notifications at a limited frequency. App components that hindered participation included: reminders that were too frequent, social forums or integration with social media, daily surveys (or redundant surveys), and technical problems (such as problems with Wi-Fi connection, app navigation, or problems logging in).
Important Elements of Applications That May Increase and Decrease Usage by Disease Indication or Health Realm
Clinical Outcomes Of Assessed Apps
Only 55% (30 out of 54) articles included in the analysis examined differences in clinical outcomes due to the mobile intervention, of which 53% (n = 16) found significant differences, 10% (n = 3) showed a positive trend due to the intervention, 20% (n = 6) had a majority of participants report the app as helpful and/or useful, and 17% (n = 5) found no impact.
Measuring Engagement
About a fifth of articles (20%; n = 11) did not use any measurement method and drew conclusions about engaging features based on conjecture or opinions from the study team (rather than from collected study data), whereas 11% (n = 6) of articles used participant self-report of usage to measure engagement with the app. Of the remaining 37 articles that did measure engagement in a quantifiable way, 41% (n = 15) looked at app usage logs, 14% (n = 5) relied on survey/lesson completion rates, 11% (n = 4) relied on log-in frequency, 11% (n = 4) examined the number and/or length of app sessions, and only 8% (n = 3) used an established scale to measure engagement (n = 1 used the MARS and n = 2 used the SUS). Nineteen percent (n = 7) of these 37 articles used another way to measure engagement, which included: participant updates per week, the length of time participants wore wearable devices, interactions with daily self-reports, weight/blood pressure loggings, whether or not participants “charted” in the app within 24 h of a push notification, and an “adapted usability scale.” 24
Length Of App Usage
The review analysis showed that one article did not report the length of app usage, three were completed in one-time sessions, and six had not set a specific period of time for the intervention (participants used it a variable amount of time and were neither told to start or stop using the app). Of the remaining 44 articles, the usage duration ranged from 2 to 104 weeks, and the average length of usage was 21 weeks (SD = 22.7 weeks, median = 12.8 weeks, mode = 26 weeks). Many articles also reported a drop-off in usage after the first week of the study, 29,41,62,73 and/or reported an initially high level of participation that slowly diminished over the course of the study. 29,32,40 –42,56,62,73
Study Retention Rates
Retention rates were not applicable or not reported in 31% (n = 17) of the evaluated studies. In the remaining studies, the retention rate ranged from 14% to 100%, with an average 68% (SD 25%) and a median of 79%.
Discussion
The use of mobile apps in health care is gaining ground, however, research geared toward understanding patient/app interactions (engagement) is still nascent. This is evident by the small number (236) of articles matching the broad keywords used in the initial literature search. The PRISMA process then reduced this number to only 54 articles (∼23%) eligible for engagement analysis.
There was little commonality in how studies measured participant engagement, and a wide range in the length of app usage in these studies. Most studies, depending on the app utility objectives, used longitudinal or cohort-testing approaches. Several studies explored ways to improve engagement within their own app prototype; of note was Bidargaddi et al. 46 who implemented a “micro-randomized” clinical trial of push notifications to determine the effects they had on engagement with a mobile health app. This study approach was one of very few that used an experimental approach to address design choices and their effects on engagement directly. They found that sending a tailored health message at 12:30 pm on any day, or at 7:30 pm on weekends, made participants almost 9% more likely to use the app.
Mobile app developers utilize measure scales such as SUS and MARS to gain insight on the usability, functionality, and satisfaction from users. It was surprising to find that only three articles followed the MARS 17 and SUS 19 to evaluate engagement outcome measures, and none used the PAM 16 or PHE-s. 5 For the rest of the studies, excluding the ones that did not directly measure engagement (n = 11), and those that relied on participant's report for engagement results (n = 6), the most common quantitative approach to measure engagement was through app usage logs (n = 15) from which the study teams were able to quantify minutes of app usage, the frequency of log-ins, and the frequency of app components that were used.
A host of app components affected engagement level, but the most engaging mobile interventions provided participants with the ability to view and/or interact with their health data. This aligned with other findings that the return of information to participants is an especially important aspect of creating engaging and impactful digital tools, 74,75 as doing so increases participant self-efficacy by involving individuals in making their own well-informed health care decisions. 76 Moreover, providing results and information tailored to an individual's gender, needs, characteristics, and interests has been shown to both produce more online activity and increase retention on follow-up surveys. 77 The findings from this review support these statements.
It appears that the first week marks an important time point in continuing usage of the app, as many studies reported the largest drop-off in usage after the first week of the study, regardless of study duration (ranged from 3 to 26 weeks). Through app usage logs, researchers were able to track app engagement and assess drop-off in participation (Table 1). This pattern was not reported in studies that only relied on subjective measures of engagement, demonstrating that measurable methods to track app engagement provide a fuller picture of app usage. The analysis suggests that app engagement plays an important role in study retention. Once past the first week, retention rate was very high averaging around 68% among participants who stayed on the study. Study duration, disease indication, study duration, and participant incentives affected retention rate that ranged widely from 46% 78 to 86%. 79 The retention rates of most of the examined mobile interventions fall well within the expected range of longitudinal studies, with only n = 12 studies (22.2%) examined reporting retention rates lower than 60%. Of the n = 11 studies (20.4%) that reported retention rates of 85% or greater, the apps featured the following components that were popular among participants: reminders/push notifications (especially personally tailored messages), ability to communicate with doctors and/or care teams through messaging features, self-reporting or “logging” of symptoms, and easy access to health information.
Incorporating digital tools and mobile apps in the management plan of patients' health is rather a new approach in health care. Research to generate evidence for the utility and efficacy of these tools in health care intervention and management is still nascent. We recognize that this analysis bears several limitations due to (1) the small number of published studies (articles) addressing engagement to be included in analysis, (2) many studies' lack of processes around measurement of engagement, and (3) hence, great variability in results. This review may not be able to accurately capture the true app components necessary to increase engagement with apps due to articles' lack of robust methods for measuring engagement, and due to the limited number of studies that can be properly compared by underlying health conditions.
Conclusion
In conclusion, despite the growing popularity of mobile app interventions, the specific engaging components have not been well defined. This article provides insight into existing methods and tools that may encourage participant engagement with future mobile app interventions in various disease indications. The information provided in this study is intended to help clinical teams, researchers, and clinical trialists design better mobile applications that will provide participants and patients with greater satisfaction and ultimately better outcomes. Future work is needed to develop common guidelines to support specific components or activities that lead to increased engagement with mobile health applications. There is also a tremendous need for cross-disciplinary agreement on standards for engagement measurement to provide greater generalizability. These two elements could help minimize app design and user testing periods and lead to greater success with mobile health interventions in the future.
Footnotes
Authors' Contributions
This article was written and edited by J.S.O., I.O.G., R.Y., and M.L. J.S.O. and I.O.G. wrote the initial draft of the article. R.Y. and M.L. provided substantial edits to the article and approved of the final version to be published. I.O.G. determined the scope of the review article and methods. J.S.O. performed the initial search and article screening.
Disclosure Statement
No competing financial interests exist.
Funding Information
While not directly supported with funding, the idea for this article arose from work funded by the National Cancer Institute of the National Institutes of Health under contract numbers HHSN261201700030C and HHSN261201800010C. Ingrid Oakley-Girvan, Reem Yunis, and Michelle Longmire serve as coinvestigators for the former and Ingrid Oakley-Girvan is the PI for the latter. The content is solely the responsibility of the authors and does not necessarily represent the official views of the National Institutes of Health.