
Abstract
Background:
Although patients with anaplastic thyroid cancer (ATC) generally have a poor prognosis and there are currently no effective treatment options, survival and response to therapy vary between patients. Genomic and transcriptomic profiles of ATC have been reported; however, a comprehensive study of the tumor microenvironment (TME) of ATC is still lacking. This study aimed to elucidate the TME characteristics associated with ATC and their prognostic implications.
Methods:
We analyzed bulk RNA transcriptomic data from 1,634 samples—including 476 normal thyroid tissues, 25 benign thyroid adenomas, 340 RAS-like and 719 BRAF V600E-like differentiated thyroid cancers (DTC-R and DTC-B, respectively), and 74 ATCs. We assessed the TME and molecular characteristics of these thyroid cancer subtypes using deconvolution analysis.
Results:
The TME of ATC was characterized by a high abundance of immune cells and fibroblasts and a low abundance of epithelial cells compared to other thyroid histologies. During its malignant evolution, ATC exhibited an ecotype more closely related to DTC-B than RAS-like DTC (DTC-R). Furthermore, we identified two distinct molecular subtypes within ATC with significant differences in their TMEs. We termed the subtype with increased immune cells and fibroblasts as ATC-immune-fibroblast (ATC-IF) and the subtype with elevated epithelial and endothelial cells as ATC-epithelial-endothelial (ATC-E). The ATC-IF group had worse disease-specific survival (log-rank p = 0.035), higher ERK scores, and lower thyroid differentiation scores than the ATC-E group. While both ATC subtypes had elevated immune cells and fibroblasts compared to DTC-R and DTC-B, this increase was more pronounced in ATC-IF, with a marked rise in myeloid lineage cells and promigratory fibroblasts. Immune checkpoint gene expression and epithelial–mesenchymal transition scores were significantly higher in the ATC-IF group than in the ATC-E group.
Conclusion:
ATC shows a TME distinct from that of DTC and can be further divided into two molecular subtypes—each with its own unique TME. The ATC-IF group, with a poorer prognosis and higher ERK score, is enriched in immune cells and fibroblasts, which may represent potential therapeutic targets.
Introduction
Anaplastic thyroid cancer (ATC) is one of the most fatal cancers, 1 with a median survival time of only 4–6 months. 1 –3 Recently, mutation-informed targeted therapies have been applied for advanced thyroid cancer, including ATC, although none are considered curative at this time. V-Raf Murine Sarcoma Viral Oncogene Homolog B (BRAF)/mitogen-activated extracellular signal-regulated kinase (MEK), rearranged during transfection (RET), and neurotrophic tyrosine receptor kinase (NTRK) inhibitors are Food and Drug Administration approved in the United States for treating advanced thyroid cancer with the BRAF V600E mutation, RET fusions, and NTRK fusions, respectively. In the most recent clinical trial of the combination of dabrafenib and trametinib (i.e., BRAF/MEK inhibitors), which included patients with 36 BRAF V600E -mutant ATC, promising efficacy was observed, with an overall response rate of 56%. However, some of the patients did not respond to the treatment, with 31% showing stable disease and 11% showing progressive disease. 4 In the larotrectinib (an NTRK inhibitor) study, which enrolled 21 patients with differentiated thyroid cancer (DTC) and seven with ATC, the overall response rate was 86% for DTC and 29% for ATC. 5 These results suggest that survival and responses to therapy vary, even among patients with ATC. In addition to identifying the driver mutations of thyroid cancer cells, comprehending the surrounding tumor microenvironment (TME) and targeting it in tandem may represent a groundbreaking strategy for improving patient outcomes. Recent studies have indicated that adding immune checkpoint inhibitors to conventional therapies significantly improves the survival rate and resectability of ATC. 6 –9
To date, numerous bulk next-generation sequencing studies have advanced our understanding of the genomic and transcriptomic characteristics of ATC 10,11 and recognized the impact of the TME on ATC’s transcriptome. However, detailed analyses of TME composition and cancer ecotypes remain limited, and the exploration of TME heterogeneity within ATC is still insufficient. The advent of single-cell RNA sequencing (scRNA-seq) has offered new insights into the TME. While four scRNA-seq studies have examined thyroid cancer cells and the surrounding TME during progression to ATC, 12 –15 these studies have analyzed only a small number of samples—typically 1–6 normal thyroids (NTs) or papillary thyroid cancers (PTCs), and 3–10 ATCs. As a result, their findings may vary depending on the unique characteristics of individual samples, limiting their generalizability to the broader TME landscape of ATC. In this study, we performed deconvolution analysis on a large-scale bulk RNA sequencing (RNA-seq) dataset of thyroid cancers, examined the TME changes associated with progression to ATC, and characterized distinct TME features specific to ATCs.
Materials and Methods
Patients and data processing
To investigate the TME characteristics of ATC across different thyroid histologies, we analyzed 476 thyroid tissues, including 25 benign thyroid adenomas (BAs), 1,059 DTCs (999 PTCs, 43 follicular thyroid cancers [FTCs], seven oncocytic thyroid cancers, 10 poorly DTCs), and 74 ATCs. Bulk RNA sequencing data were sourced from eight independent datasets, 10,11,14,16 –19 including the TCGA study, 19 our previous studies, 10,16 and newly sequenced in-house samples (Table 1). The unified gene expression process 20 was used to minimize the batch effect among large datasets. For data processing, we used Trimmomatic (v0.39) 21 for base trimming, STAR (v2.7.4a) 22 for fragment alignment, and RSEM (1.3.1) 23 for gene quantification and length normalization. To avoid sequencing bias, genes were filtered from the 19,698 protein-coding genes in the GRCh38 reference genome; we excluded genes that were expressed exclusively in specific studies, despite being from the same thyroid histology (n = 1,135) or had zero expression across all samples (n = 23). The umapr R package (https://github.com/ropensci-archive/umapr, v0.0.0.9001) was used to project an integrated dataset, and we confirmed that samples could be differentiated based on molecular and histological subtypes without batch effects (Supplementary Fig. S1).
Sample Information and Data Sources according to Histological Group
ATC, anaplastic thyroid cancer; BA, benign adenoma; -B, BRAF V600E-like molecular subtype; DTC.adv, advanced DTC; DTC, differentiated thyroid cancer; FTC, follicular thyroid cancer; LT, lymphocytic thyroiditis; NT, normal thyroid; OCA, oncocytic carcinoma of the thyroid; PTC, papillary thyroid cancer; -R, RAS-like molecular subtype; TC, thyroid cancer.
This study was approved by the institutional review board of Seoul National University Hospital (SNUH) and was performed in accordance with the Declaration of Helsinki (IRB no.: 1307-034-501 and 1903-073-1017). All patients from SNUH provided written informed consent.
Sample classifications
DTC is classified into BRAF V600E-like or RAS-like subtypes based on molecular profiles, which are associated with distinct gene expression patterns and histological characteristics. 19 Therefore, we categorized various DTC types, including PTC and FTC, as either BRAF V600E-like or RAS-like, based on the BRAF-RAS score (BRS). 19,24 Then, to observe TME changes during thyroid cancer progression, we designated aggressive DTC subtypes based on pathological diagnosis as advanced DTC (DTC.adv). 22 The samples were classified as follows: normal thyroid (NT) without lymphocytic thyroiditis (LT) (n = 413), thyroid with LT (n = 63), benign thyroid adenoma (n = 25), RAS-like DTC (DTC-R) (n = 320), DTC.adv-R (n = 20), BRAF V600E-like DTC (DTC-B) (n = 675), DTC.adv-B (n = 44), and ATC (n = 74). Full sample details are provided in Table 1.
Deconvolution analysis
To deconvolute the TME, we used CIBERSORTx (https://cibersortx.stanford.edu/) 25 and EcoTyper (https://ecotyper.stanford.edu) 26 with input files containing fragments-per-kilobase of transcript-per-million-mapped-reads-normalized expression values. CIBERSORTx was applied with the TR4 signature matrix, 27 which contains sorted populations of epithelial, endothelial, fibroblast, and bulk immune cells, to identify major cellular components. Additionally, we used the LM22 signature matrix, which comprises 22 functionally defined human hematopoietic cell subsets, to assess immune cell abundance. EcoTyper was employed to characterize the functional states of specific cell types and their interactions within multicellular communities. To validate our findings, we further analyzed results using TIMER 2.0 (http://timer.cistrome.org) 28 and EPIC (http://epic.gfellerlab.org). 29
Differentially expressed genes, gene set scoring analysis, and clustering
Differentially expressed genes (DEGs) were identified using DESeq2, 30 with adjusted p values (q values) calculated by the Benjamini–Hochberg method. Genes with an absolute log2(fold change) of ≥1 and a q-value of <0.05 were defined as DEGs and displayed in volcano plots. To determine enriched biological functions and molecular pathways among DEGs, we performed Gene Ontology 31 enrichment analysis for biological processes, cellular components, and molecular functions, as well as Kyoto Encyclopedia of Genes and Genomes 32 pathway analysis using the DAVID 2021 database (https://david-d.ncifcrf.gov/home.jsp). 33 BRS, 19 thyroid differentiation scores (TDS), 19 and extracellular signal-regulated kinase (ERK) scores 10 were calculated following previously established protocols. Full scoring methods and gene set information are detailed in Supplementary Data. For our heatmap analysis, we used the ComplexHeatmap package, 34 applying Jaccard distance for row clustering to examine co-occurrence patterns between cell types and gene set scores and Euclidean distance for column clustering to assess sample similarity.
Statistical analysis
All statistical analyses were conducted using R version 4.2.2. Depending on data distribution, determined by Shapiro–Wilk and F-tests, we applied either two-tailed t-tests, Wilcoxon tests, or Kruskal–Wallis tests. Categorical data were analyzed using Fisher’s exact test. Statistical significance was defined as p < 0.05 unless stated otherwise.
Results
ATC showed a TME enriched with immune cells and fibroblasts
In the deconvolution analysis using CIBERSORTx with the TR4 matrix, ATCs had a significantly higher proportion of immune cells than DTCs or NT, similar to the proportion observed in LT (Fig. 1A). They also showed the highest levels of fibroblasts across all thyroid histologies (Fig. 1B). The proportion of endothelial cells in ATC was lower than in NT, DTC-R, DTC.adv-R, and DTC-B, but similar to that in DTC.adv-B (Fig. 1C). Although we classified DTC and DTC.adv based on histology rather than gene expression profiles, we found no differences in the proportions of immune cells, fibroblasts, or epithelial cells between DTC and DTC-adv in both BRAF V600E-like and RAS-like molecular subtypes. However, the proportion of endothelial cells was lower in DTC-adv than in DTC. Because of a significant increase in immune cells and fibroblasts in ATC, the proportion of epithelial cells in ATC was markedly lower compared to other thyroid histologies (Fig. 1D).
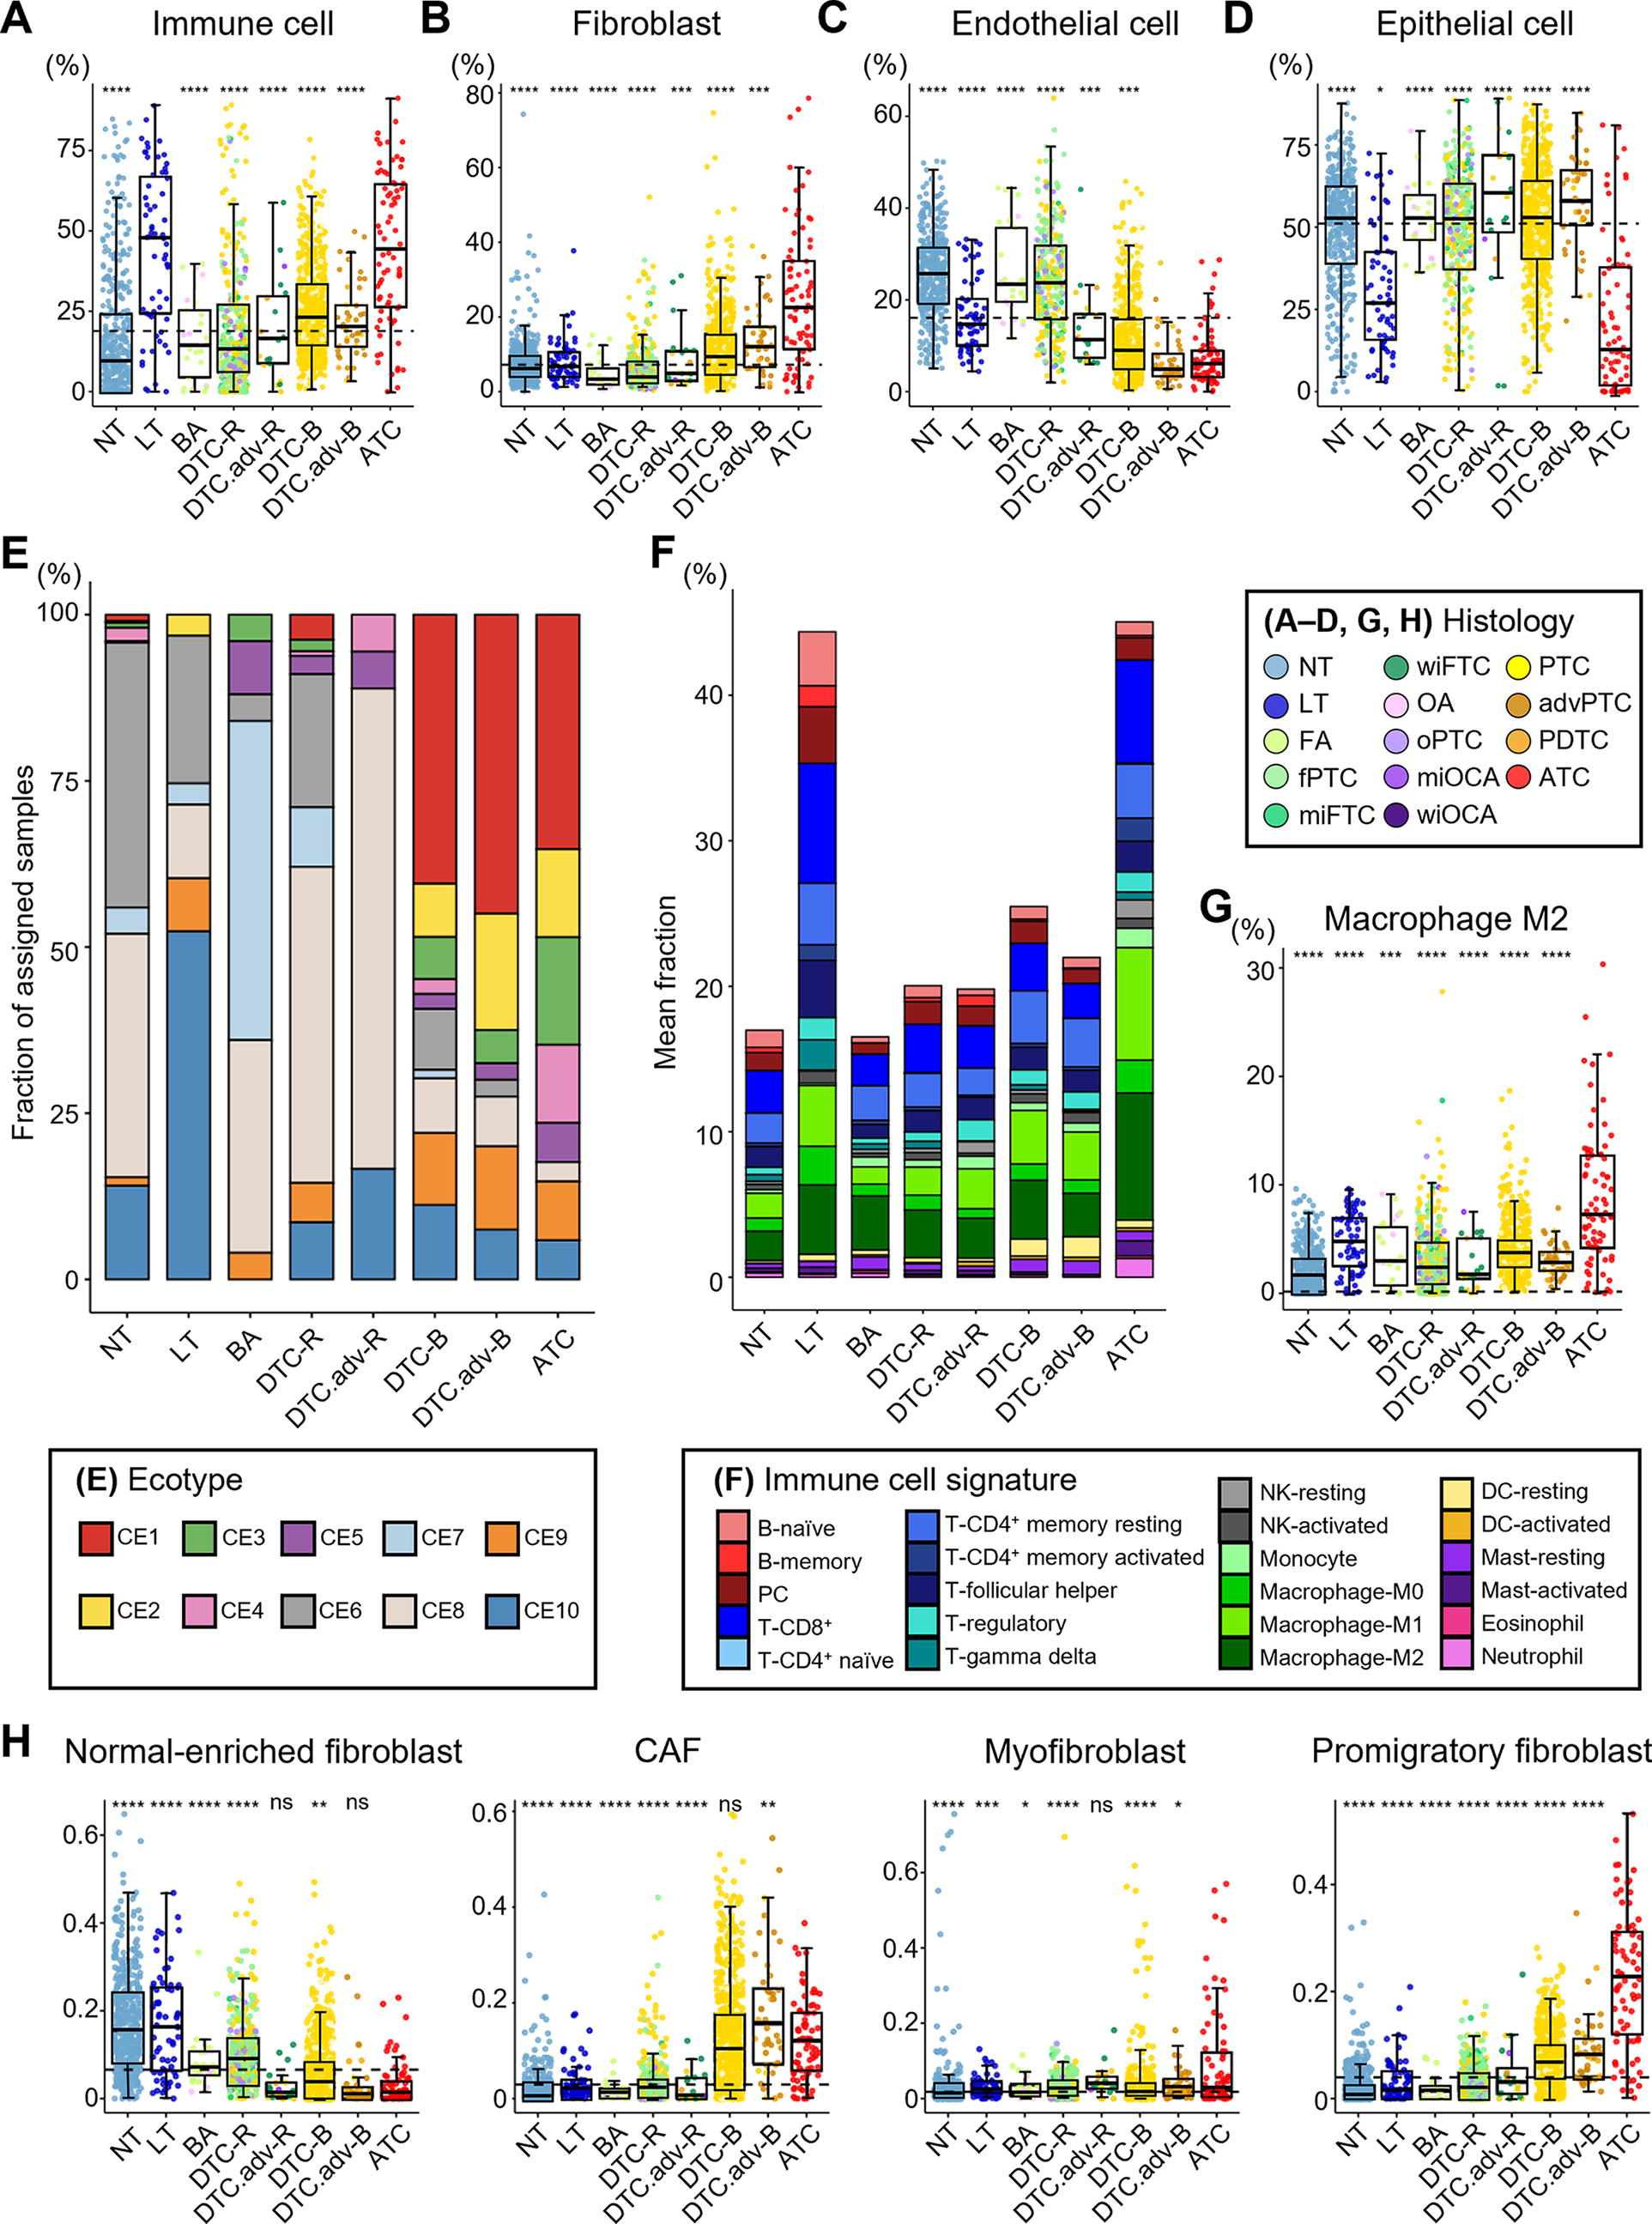
TME according to thyroid histological subtype. The fraction of
To understand how these differences in cell type proportions are reflected in the overall TME, we analyzed the cancer ecosystems via deconvolution, using the default 10 carcinoma ecotypes (CEs) provided by EcoTyper. Interestingly, the ecotypes of ATCs exhibited a composition similar to those of DTC-B/DTC.adv-B but showed a higher proportion of ecotypes associated with reduced lymphocyte levels, abundant cancer-associated fibroblasts (CAFs), and unfavorable prognosis (CE1-5). This markedly contrasted with other histological types, including DTC-R/DTC.adv-R, having a CE with a favorable prognosis (CE6-10) (Fig. 1E).
Since the ATCs had an immune cell-rich TME (Fig. 1A), we identified the present immune cell types using CIBERSORTx with the LM22 signature matrix (Fig. 1F and Supplementary Fig. S2). In particular, M2 macrophages exhibited the highest proportion in ATCs, comprising 8.7% of all tumor tissue cells (Fig. 1G). Furthermore, we found that the proportion of normal-enriched fibroblasts was lower in ATC. In contrast, fibroblast states associated with more aggressive ecotypes (CE1, 2, and 4) such as CAFs, myofibroblasts, and promigratory fibroblasts were increased (Fig. 1H and Supplementary Fig. S3). Similarly, in the endothelial state, the proportion of normal-enriched endothelial cells was lower in ATC, while tumor-associated tip cells and myoendothelium showed an increased tendency (Supplementary Fig. S3). Further analyses using additional deconvolution tools were conducted for verification (Supplementary Fig. S4), which found consistent results regarding the increased abundances of macrophages and CAFs in ATC.
To investigate key changes in gene expression profiles during the progression from DTC to ATC, we performed a DEG analysis. ATC exhibited 1,348 and 1,118 upregulated DEGs compared to DTC-R/DTC.adv-R and DTC-B/DTC.adv-B, respectively, with 889 genes commonly upregulated across comparisons. Pathway analysis revealed that immune and extracellular matrix (ECM)-related genes were commonly activated in ATC (Supplementary Fig. S5), which aligns with the findings from deconvolution analysis showing a marked increase in the proportions of immune cells and fibroblasts in ATC.
The composition of TME cells shifted across thyroid cancer types
To gain a deeper understanding of the shifts in cell proportions and states and activated signaling pathways 35 during the progression from DTC to ATC, we performed an unsupervised clustering analysis on all thyroid cancer samples, covering all states of immune cells, fibroblasts, endothelial cells, and epithelial cells, along with activation scores for pathways associated with cancer growth (Fig. 2A). First, the bottommost row cluster (RC1) in the heatmap was mainly composed of normal-enriched cells, which were increased in the leftmost column cluster (CC1) that consisted mostly of DTC-R samples. Next, row cluster 2 (RC2) showed an increase in cytotoxic immune cells such as lymphocytes, activated natural killer (NK) cells, and macrophages, along with pathways related to immune response and apoptosis, such as janus kinase–signal transducer and activator of transcription and tumor necrosis factor-related apoptosis-inducing ligand. This cluster was upregulated in the column cluster (CC2), consisted of a mix of DTC-R and DTC-B samples, and was related to CE9 and CE10, which are CEs associated with favorable cancer prognosis. In contrast, row cluster 3 (RC3) showed an increase in CAFs and dendritic cells, with activation of various cancer cell proliferation pathways, such as wingless-type mouse mammary tumor virus integration site family, mitogen-activated protein kinase, and epidermal growth factor receptor pathway, and was primarily associated with DTC-B samples (CC3 and CC4) and unfavorable cancer ecotypes such as CE1 and CE2. Interestingly, the topmost row cluster (RC4) was primarily associated with the rightmost column cluster (CC5), mostly composed of ATC samples. This cluster showed an increase in promigratory fibroblasts, myofibroblasts, myeloid-lineage cells, and resting NK cells, along with activation of vascular endothelial growth factor, phosphoinositide 3-kinase, and hypoxia pathways. The increase in B cell lineage and activated NK cells, major immune cell types in RC2 and elevated in a subset of DTCs, was associated with a favorable prognosis and suggested a potential protective role in cancer progression (Fig. 2B and C). In contrast, myeloid cells and resting NK cells predominantly increased in RC4, mainly in ATC, and were associated with a poor prognosis (Fig. 2D, E and Supplementary Fig. S5).
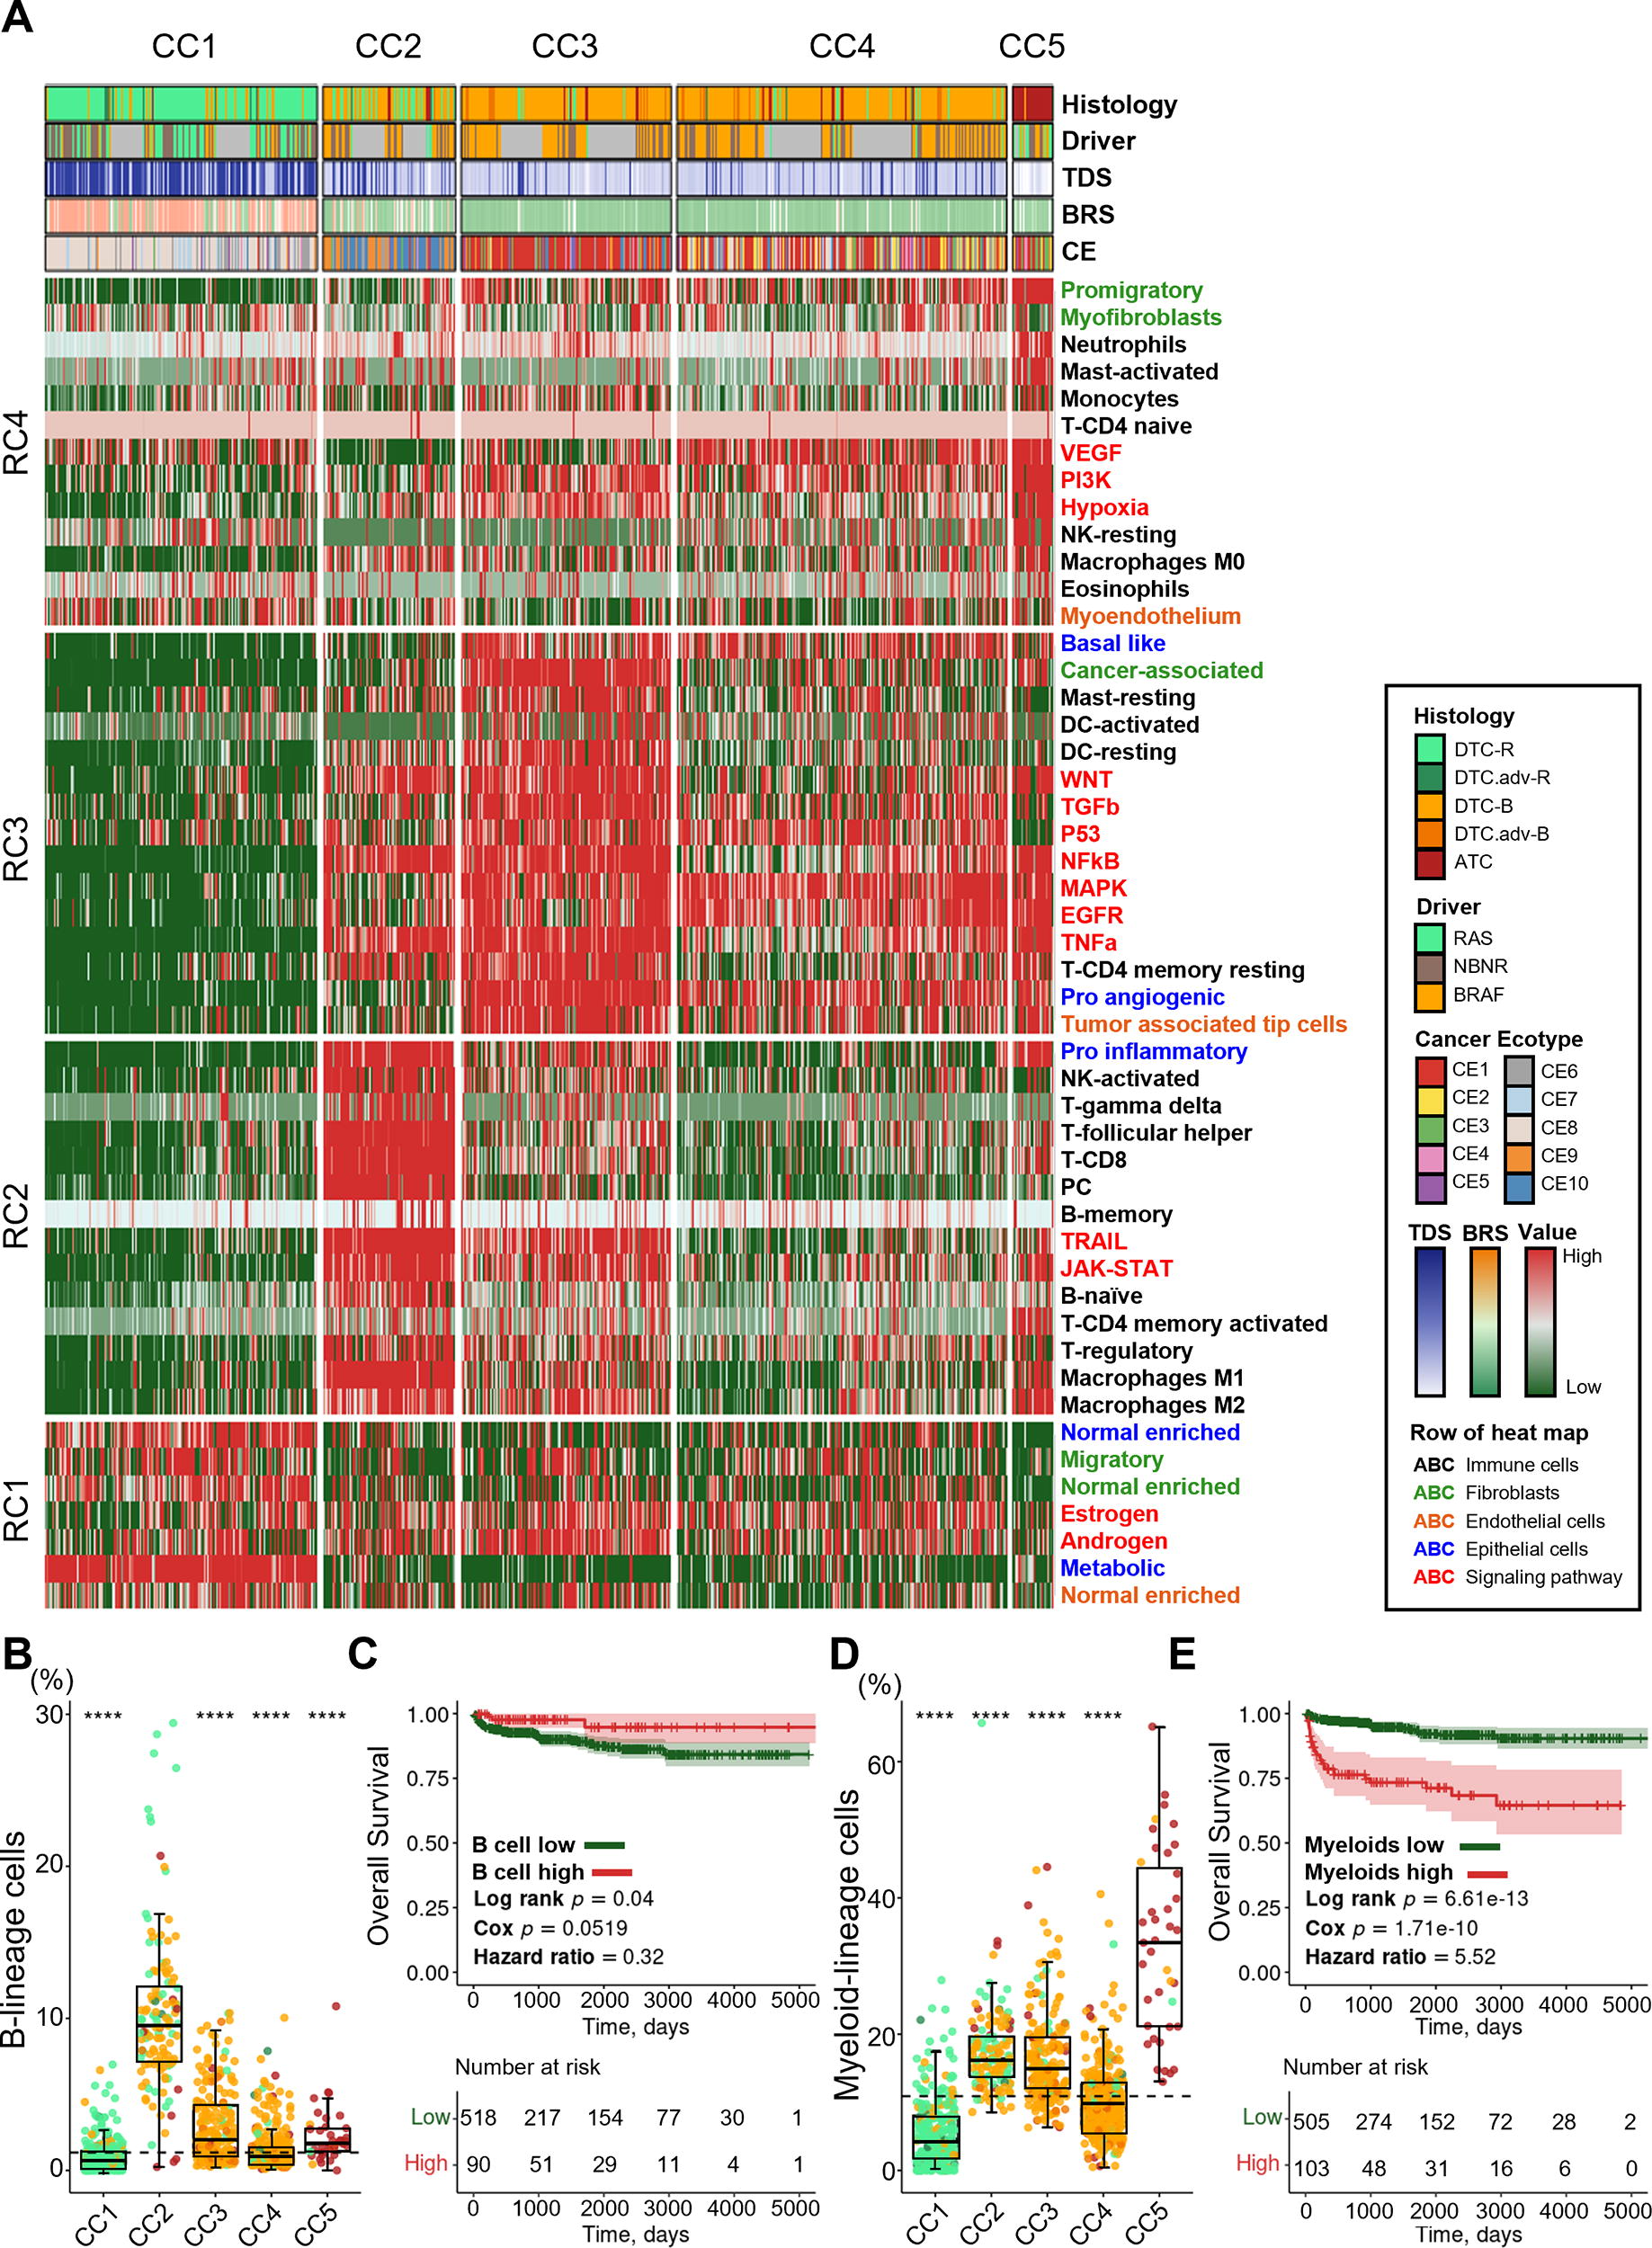
Differential TME landscapes across thyroid cancer types.
ATC clustered into two groups with different TMEs and prognoses
To determine whether there is heterogeneity in the TME within ATC, we performed principal component analysis and k-means clustering of 74 ATC samples, which revealed two clusters (Fig. 3A). During this process, four samples were identified as outliers and subsequently removed from the analysis (Supplementary Fig. S6). One cluster showed a relative increase in epithelial and endothelial cells, while the other cluster had a significant increase in immune cells and fibroblasts. Therefore, we named these clusters ATC-epithelial-endothelial (ATC-E) and ATC-immune-fibroblast (ATC-IF) groups based on the dominant cell types (Fig. 3B and Supplementary Fig. S7).
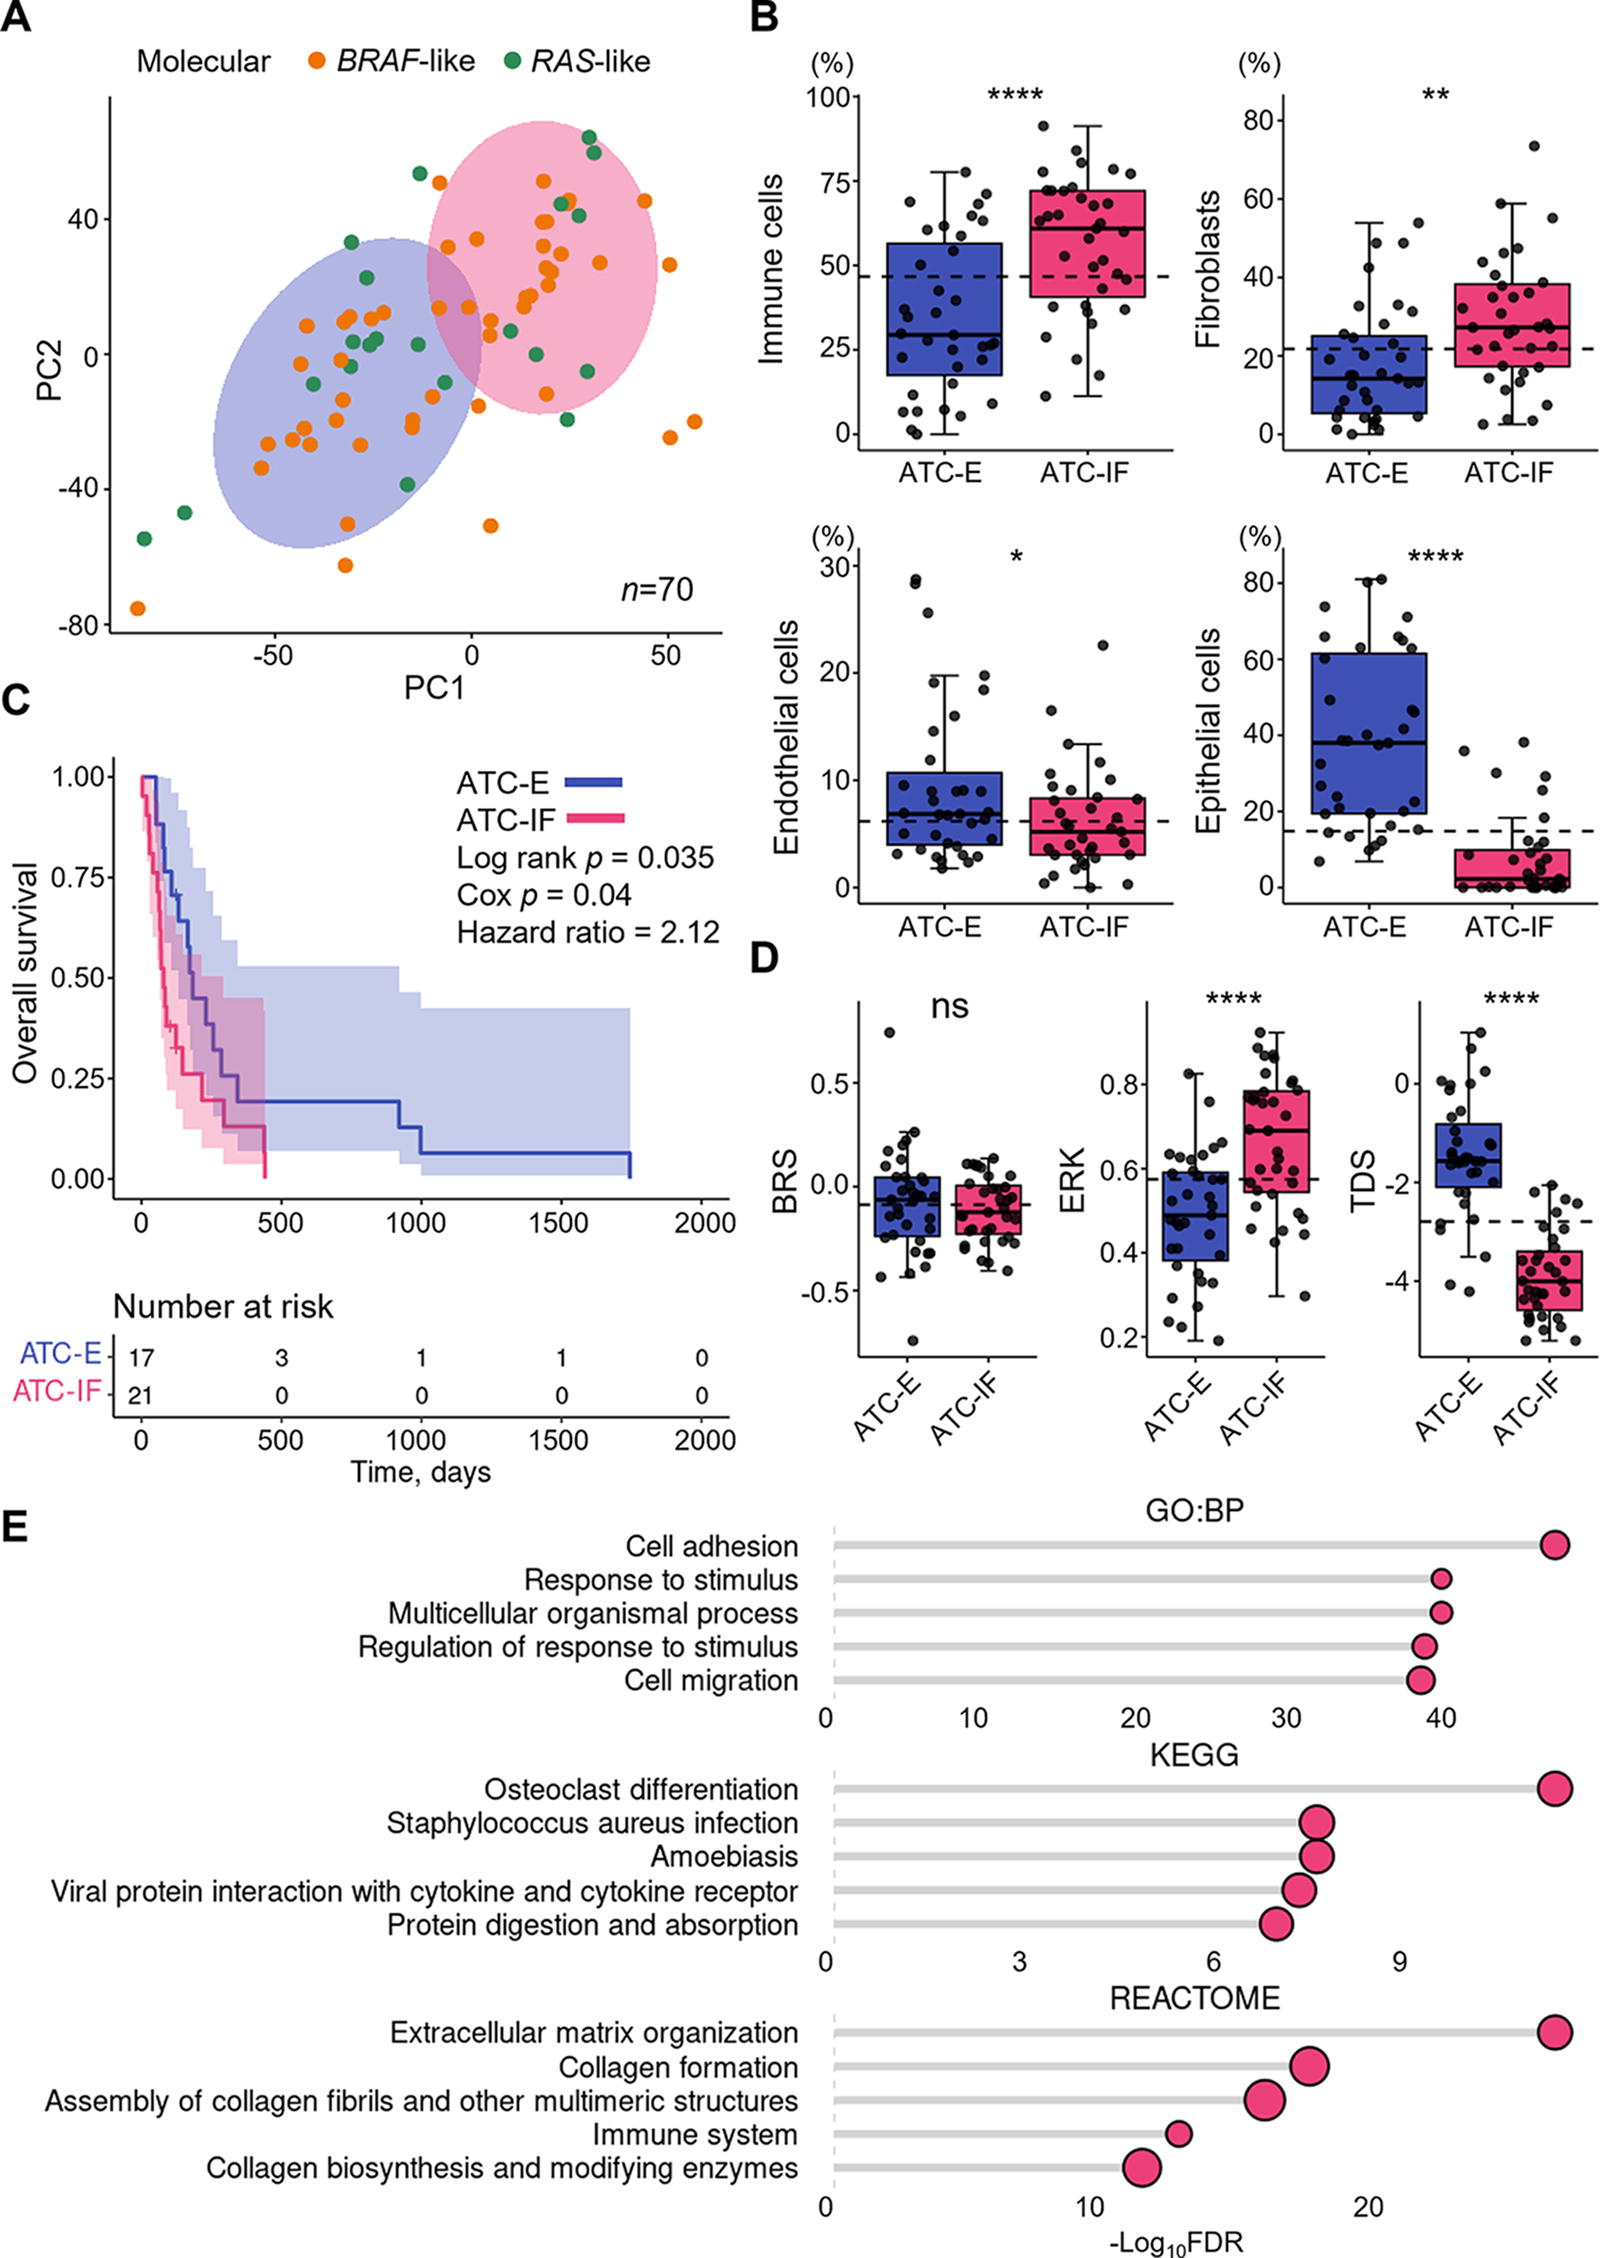
Two molecular clusters with different TMEs in ATC.
Comparing the clinicopathological characteristics of the two groups revealed no significant differences in age, sex, tumor origin, driver mutation, distant metastasis, final disease status, treatment methods, and morphological subtypes of ATC (Supplementary Table S1 and S2). However, interestingly, the ATC-IF group showed worse disease-specific survival (log-rank p = 0.035), with a hazard ratio of 2.12 (confidence interval, 1.04–4.34; Cox p = 0.04; Fig. 3C). There was no difference in BRS between the two groups, but the ATC-IF group had a higher ERK score and lower TDS (Fig. 3D and Supplementary Fig. S7). The ATC-IF group had a higher proportion of CE1-5 ecotypes, which are associated with poor prognosis, compared to the ATC-E group, although not statistically significant (Supplementary Fig. S7).
To identify the differences in overall gene expression characteristics between the ATC-IF and ATC-E groups, we examined the DEGs between the two groups. The inflammation, ECM, and cell migration-related genes were activated in the ATC-IF group (Fig. 3E).
The ATC-IF group exhibited the most distinct TME features
To investigate whether the changes in gene profiles are associated not only with TME cells but also with changes in epithelial cell characteristics, we examined gene set scores using thyroid cancer epithelial cell signatures from previous scRNA-seq 12,13 and bulk RNA-seq 36 studies of PTC and ATC samples. Signatures of NT follicular cells were elevated in NT and DTC-R, while PTC-related and ATC-related signatures were elevated in DTC-B and ATC, respectively, confirming overall consistency with previous studies (Supplementary Fig. S8). The ATC-IF group exhibited more mesenchymal characteristics, with higher expression of ATC-specific markers such as Cyclic AMP-responsive element-binding protein 3-like protein 1 (CREB3L1) and an increased MAP score (Fig. 4A).
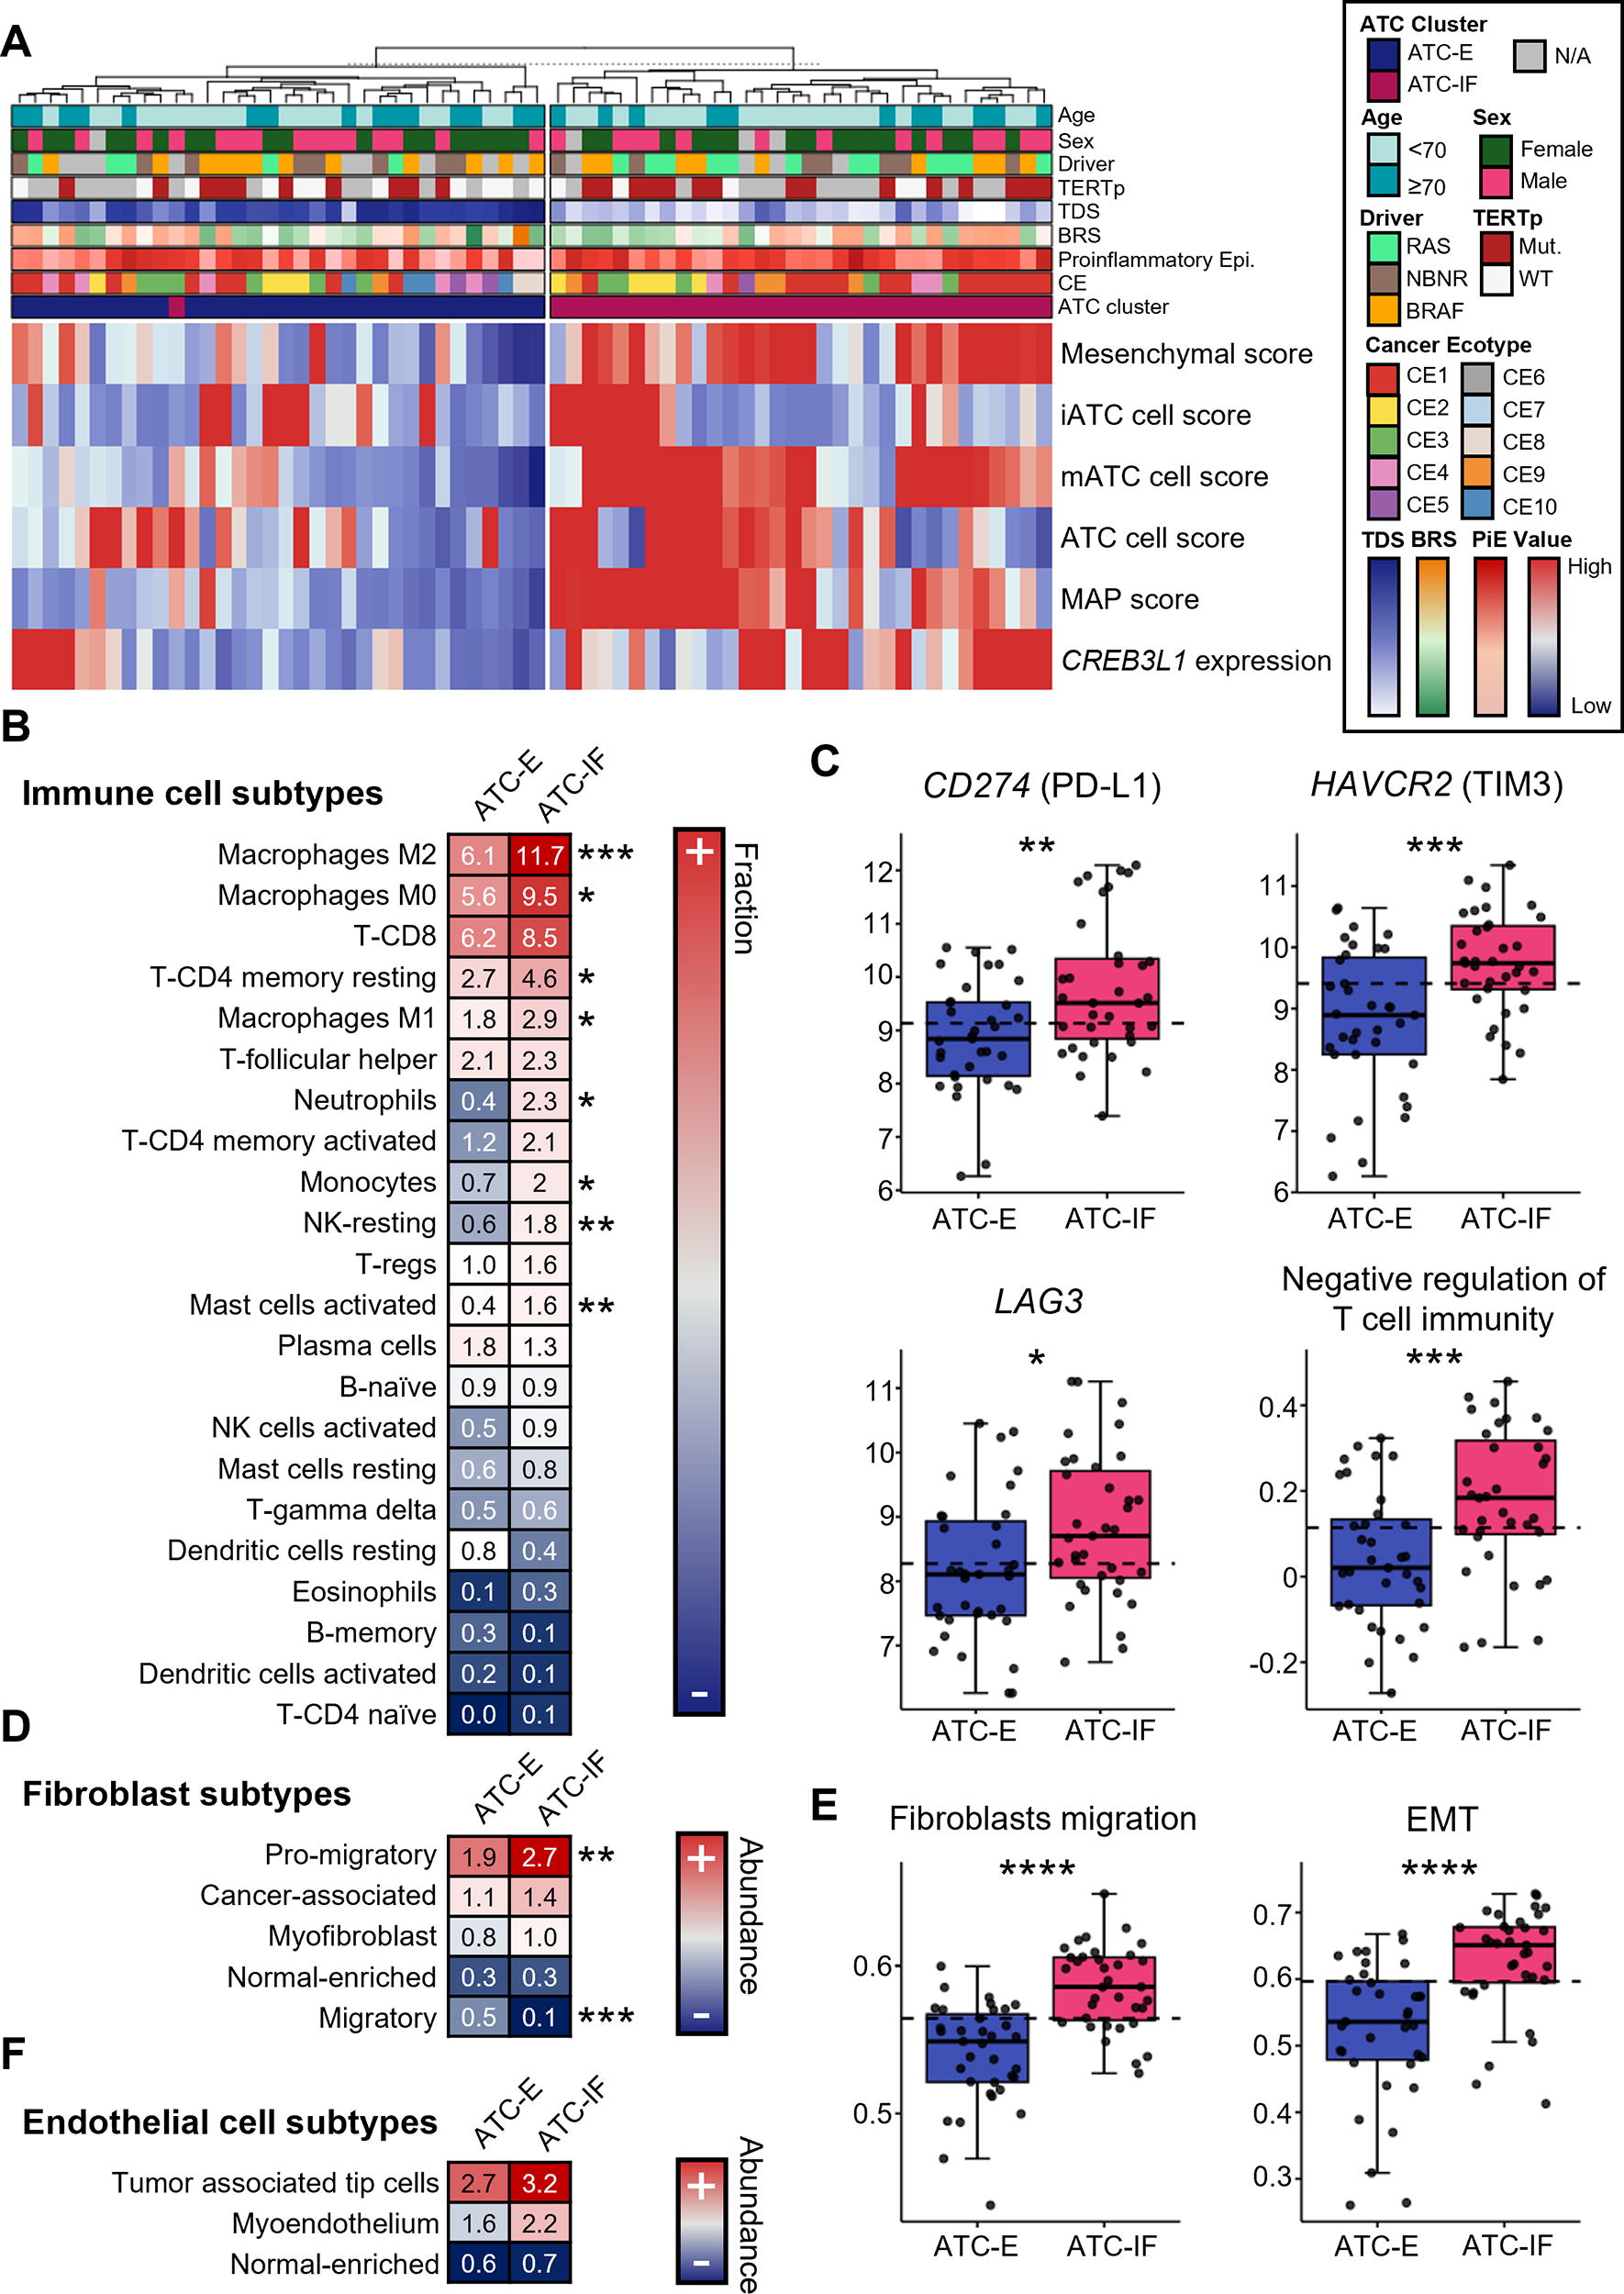
Detailed subtypes of epithelial and TME cells in the ATC-E and ATC-IF groups.
Next, we analyzed the immune cell subtypes and found that myeloid cells and resting NK cells were even more significantly elevated in the ATC-IF group compared with the ATC-E group (Fig. 4B). In contrast, B cells and activated NK cells, which were associated with favorable survival (Fig. 2), showed a low fraction with no difference between the two groups. Furthermore, to explore another potential mechanism underlying the substantial aggressiveness of cancer cells despite the high infiltration of immune cells, including CD8 T cells, we assessed the expression of immune checkpoint genes, such as CD274 (PD-L1), HAVCR2 (TIM3), and LAG3, and the gene set enrichment score for the negative regulation of T cell immunity. These gene expression levels and enrichment scores revealed a significant increase in the ATC-IF group, suggesting the potential effectiveness of immunotherapy (Fig. 4C and Supplementary Fig. S8).
Regarding stromal cells, promigratory fibroblasts were further increased in the ATC-IF group, and correspondingly, the gene set enrichment scores for fibroblast migration and epithelial–mesenchymal transition (EMT) 37 were also higher in this group. (Fig. 4D, E and Supplementary Fig. S8). In the endothelial cell state, we observed an increase in the average quantity of tumor-associated tip cells and myoendothelium in the ATC-IF group. However, these changes were not statistically significant (Fig. 4F and Supplementary Fig. S8).
Evolution of the TME during thyroid cancer progression
The TME shift through the evolution of thyroid cancer is summarized in Figure 5. NT or benign thyroid adenomas are dominated by epithelial cells, with a relatively low proportion of TME cells. As it progresses to DTC, immune cells and fibroblasts increase in DTC-B compared to DTC-R, while endothelial cells decrease. These characteristics of the TME become more pronounced in ATC. Immune cells increased in ATC are tumor growth-supporting cells, such as myeloid cells and resting NK cells. Fibroblasts in ATC mainly consist of the promigratory fibroblasts related to EMT. These TME changes are more extreme in the ATC-IF group compared to the ATC-E group, making this ATC-IF subtype the most aggressive form of thyroid cancer with the worst prognosis.
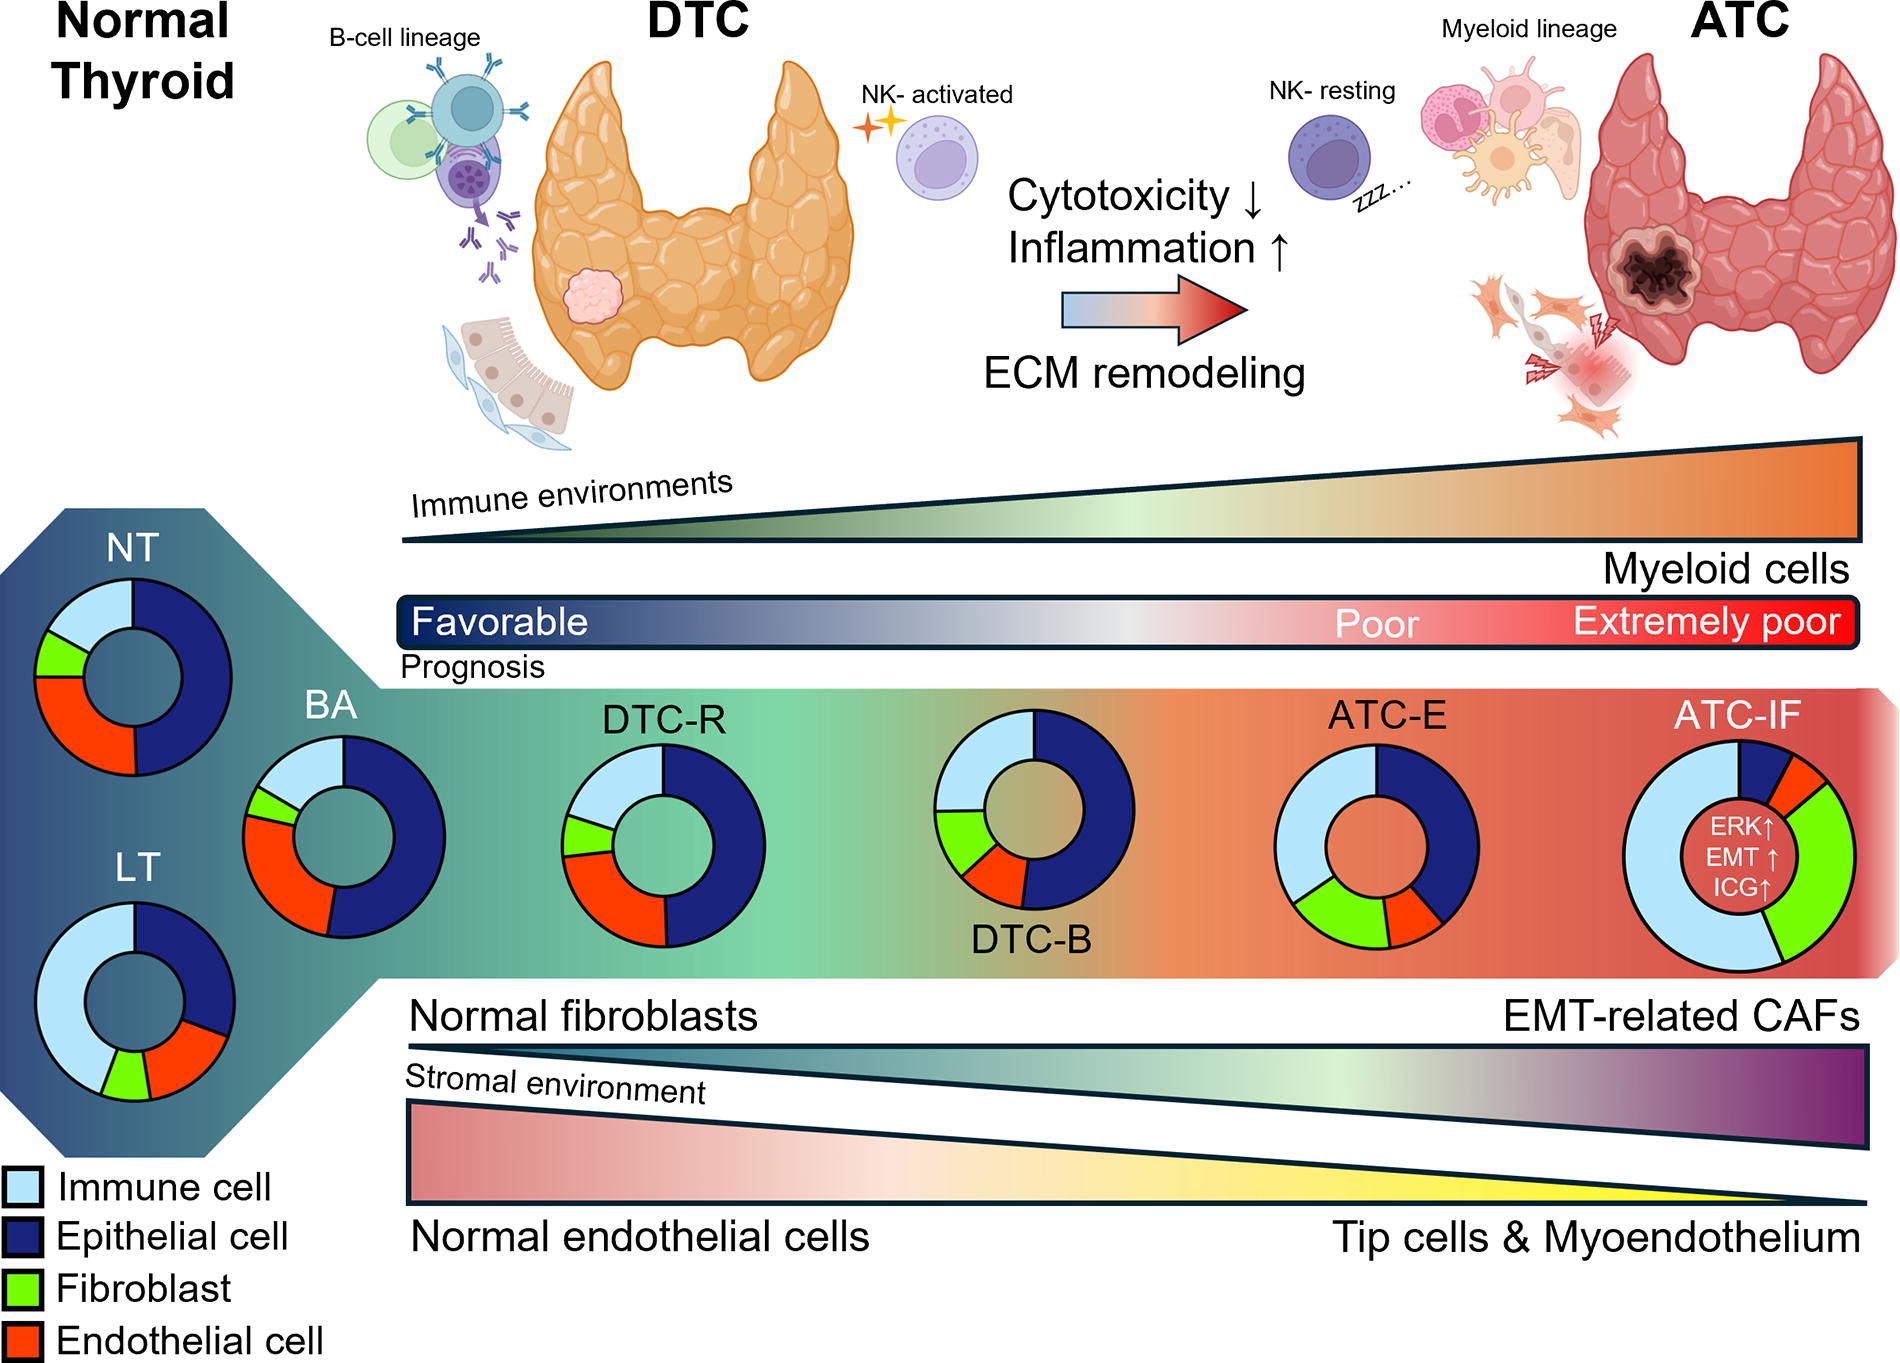
Shifting of the TME during thyroid cancer progression. This figure summarizes the changes in the TME during the progression of thyroid cancer, from normal thyroid to DTC and ultimately to ATC. The donut plots represent the composition of major cell types in each histology group, calculated via deconvolution with CIBERSORTx. The illustrations of thyroid glands and cells were created using BioRender.com. CAF, cancer-associated fibroblast; ECM, extracellular matrix.
Discussion
We analyzed TME changes associated with the anaplastic transformation of thyroid cancer using a large-scale, integrated analysis of bulk RNA-seq data, which included ATC. Our findings reveal that ATC has a distinct ecotype, differing from both molecular subtypes of DTC yet showing more similarity to DTC-B than to DTC-R. Furthermore, ATC can be divided into two transcriptomic clusters: the ATC-E and ATC-IF subtypes, each characterized by distinct TME features across the four major cell populations of thyroid tissue. The ATC-IF subtype exhibited a substantial increase in TME cellularity, with immune cells and fibroblasts collectively occupying >80% of the tumor volume, based on median values. Within this subtype, myeloid cells showed a particularly significant increase among immune cells, while promigratory fibroblasts were notably elevated within the fibroblast population. Clinically, the ATC-IF subtype demonstrated poorer differentiation and a worse prognosis than the ATC-E subtype. Additionally, the ATC-IF subtype exhibited the highest scores among thyroid cancer types for ERK pathway activity and negative regulation of lymphocyte gene sets, alongside elevated expression of immune checkpoint genes.
In our study, the most notable TME characteristics during the progression to ATC were the significantly increased abundance of myeloid cells and various types of CAFs. This observation aligns with findings from a recent scRNA-seq study on the anaplastic transformation of thyroid cancer, 13 which used NT, PTC, and ATC samples and reported that the ATC TME is marked by higher levels of M2 macrophages, exhausted T cells, and inflammatory CAFs. Similarly, Xu et al. 36 observed an increase in M2 macrophages, neutrophils, and CAFs in aggressive thyroid cancers. Another scRNA-seq study on PTC found that partial EMT-like and dedifferentiation-like malignant epithelial cells were primarily present in BRAF V600E-like PTC, rather than RAS-like PTC, and were associated with elevated CAF levels. 38 Our results are consistent with these findings.
Lu et al. 13 reported that ATC cancer cells transition from inflammatory to mesenchymal phenotypes at the terminal stage, as identified through scRNA-seq analysis. When we applied the gene signatures from their study to our ATC samples, we found that the inflammatory ATC cell signature was elevated in some samples from both the ATC-E and ATC-IF groups, while the mesenchymal ATC cell signature was notably higher in the majority of the ATC-IF group. Additionally, the transcription factor CREB3L1, which regulates EMT signaling, along with the EMT-related gene set, was activated in the ATC-IF group. Furthermore, promigratory fibroblasts, which facilitate ECM remodeling and cancer cell EMT, were significantly increased in this group. These findings suggest that the interaction between mesenchymal-like cancer cells and the EMT-supportive TME may drive the progression of ATC to its terminal stage.
Distinguishing whether the characteristics of the ATC transcriptome in bulk RNA sequencing arise from tumor cells or the TME remains challenging. However, no significant difference in BRS was observed between the ATC-E group, which retains a relatively preserved proportion of epithelial and endothelial cells, and the ATC-IF group, where immune cells and fibroblasts dominate. To better define the characteristics of tumor cells, we applied epithelial cell signatures proposed in recent scRNA-seq studies. 12,13 Our analysis confirmed that the majority of the ATC-IF group exhibits traits consistent with mesenchymal-like ATC. This suggests that the ATC transcriptome is influenced not only by distinct changes in the TME but also by intrinsic alterations within the tumor cells themselves.
In the ATC-IF group, immune checkpoint genes, such as CD274 (PD-L1), HAVCR2 (TIM3), and LAG3 (LAG3), and their related gene set scores were significantly upregulated, suggesting an immunosuppressive microenvironment. Spartalizumab, an anti-PD-1 antibody, was evaluated in a phase II study of 42 patients with locally advanced or metastatic ATC. 39 The objective response rate was 19%, but it was higher (28.6%) in patients with PD-L1-positive ATC and highest (35.3%) in patients with PD-L1 expression >50%. These findings suggest that PD-L1 expression may serve as a predictor of ATC response to immunotherapy, although it does not guarantee a cure. Activation of the ERK signaling pathway in the ATC-IF group may also contribute to its immune checkpoint gene expression pattern and immunosuppressive microenvironment. Blocking both ERK signaling and immune checkpoint genes in these patients may improve treatment outcomes, although this remains to be confirmed.
This study has several strengths. We used the largest-scale RNA sequencing dataset for various thyroid cancer types, including ATC, to perform deconvolution analyses and characterize the TMEs of thyroid cancers. This abundance of ATC samples enabled us to identify its two major clusters. We also characterized the evolutionary changes of DTC to ATC, focusing on TME changes, according to the BRAF V600E-like and RAS-like subtypes—which have distinct transcriptomic profiles 24 and histological subtypes of DTC. Recent scRNA-seq studies of thyroid cancer 12,13,38 have primarily focused on DTC-B rather than DTC-R.
Although our deconvolution analyses yielded valuable insights, they have certain limitations. First, because our computational approach used reference datasets, its results are dependent on these references and tools. We chose the TR4 and LM22 references provided by CIBERSORTx, which are widely used in the field, and supplemented our analysis with EcoTyper. To ensure robustness, we validated our results using additional deconvolution tools, including EPIC and TIMER 2.0, and confirmed their consistency with recent scRNA-seq studies of thyroid cancer. 13,36,38 However, the findings still require validation through experimental approaches. Second, while deconvolution can estimate cell proportions or states, it cannot determine gene expression at the cellular level. It is therefore difficult to determine the cell types from which the increase in ERK expression originated in the ATC-IF group tumors. Further, scRNA-seq studies are warranted to confirm these findings. However, the scRNA-seq approach also has certain technical and biological limitations, and most scRNA-seq data may not accurately represent the actual cell type proportions in intact tissues. For example, granulocytes such as neutrophils have relatively low RNA content and high RNase levels, making the RNA prone to degradation. Thus, they are not easily detected via scRNA-seq. However, we used bulk RNA-seq to confirm that neutrophils are one of the major increased immune cell types in the ATC-IF group. In conclusion, we revealed that the ATC TME is distinct from that of DTC and can be further divided into two molecular subtypes with unique TME profiles. The ATC subtype of thyroid cancer carries a poorer prognosis and higher ERK score and is characterized by more immune cells and-fibroblasts, especially myeloid-lineage cells and EMT-related CAFs. The differentiated TME features of ATC may represent potential prognostic indicators and therapeutic targets.
Footnotes
Acknowledgments
The bio-specimens and data used in this study were provided by the biobank of Seoul National University Hospital, a member of the Korea Bio-bank Network. The authors would like to express their deepest gratitude to Dr. Peter Zeng for generously providing the RNA sequencing data and assisting with the matching of the necessary metadata. The authors’ sincere appreciation also extends to the entire Global Anaplastic Thyroid Cancer Initiative team for their invaluable contributions to this research.
Authors’ Contributions
H.B.: Computational analysis, statistical analysis, figure preparation, and article writing. H.S.L.: Computational analysis, statistical analysis, figure preparation, and article writing. Y.S.S.: Conceptualization and coordination of the study, patient data and sample acquisition, article writing and editing, and funding management. Y.J.P.: Patient data acquisition and management, and critical revision of the study. All authors approved the final version of the article.
Data Availability Statement
The raw FASTQ files and associated sample metadata for the bulk RNA-seq data in this study have been deposited in the European Genome-Phenome Archive (dataset: EGAC00001001151). Access to these data will be granted upon submission of a reasonable request to the principal investigator of this study.
Author Disclosure Statement
The authors declare no conflict of interest.
Funding Information
This work was supported by the Korean Thyroid Association Young Investigator Award 2019, and National Research Foundation of Korea (NRF) grants funded by the Korean government (MSIT) (No. NRF-2020R1C1C1003924 and NRF‐2019R1A2C2084332).
Supplementary Material
Supplementary Data
Supplementary Figure S1
Supplementary Figure S2
Supplementary Figure S3
Supplementary Figure S4
Supplementary Figure S5
Supplementary Figure S6
Supplementary Figure S7
Supplementary Figure S8
Supplementary Table S1
Supplementary Table S2