
Abstract
Background:
Expression of natural killer group 2 member D (NKG2D) ligand (NKG2DL) plays a major role as a “danger signal” on stressed cells to promote removal of the latter by NKG2D-expressing cytotoxic lymphocytes. NKG2DL expression has been found in peripheral immune cells as well, such as in macrophages; however, the effect of this expression is yet to be determined.
Methods:
We determined instrumental variables (IVs; R 2 <0.01 in linkage disequilibrium), explaining the major variance in major histocompatibility complex class I chain-related protein A (MICA) and B (MICB) gene expression levels from the expression-quantitative trait locus (eQTL) of NKG2DLs based on the RNA-seq analysis of peripheral blood mononuclear cells (PBMCs) from 381 Japanese. Simultaneously, the target outcomes were filtered by PheWAS from 58 health risks, using a community-based cohort study composed of 44,739 Japanese residents. Finally, we estimated the causal effect of gene expression levels on the outcomes using the Mendelian randomization approach.
Results:
We determined nine and four IVs, explaining 87.6% and 33.0% of MICA and MICB gene expression levels, respectively. In the association test, we identified 10 or 13 significant outcomes associated with the MICA or MICB eQTLs, respectively, as well as the causal effect of MICA expression on Graves' disease (GD) (p = 4.2 × 10⁻³; odds ratio per 1 S.D. difference in the expression: 0.983 [confidence interval: 0.971–0.995]), using the weighted median estimator, without significant pleiotropy (p > 0.05), and the results were consistent across the sensitivity analyses.
Conclusions:
Our study provide novel evidence associating NKG2DL expression with GD, an autoimmune thyroiditis; direction of the effect indicated the immunoregulatory role of MICA expression in PBMCs, suggesting the importance of further functional assays in inflammatory diseases.
Introduction
Natural killer group 2 member D (NKG2D) ligands (NKG2DLs) are major histocompatibility complex (MHC) class I-like molecules (1,2). Human NKG2DLs are composed of eight genes, namely MHC class I chain-related proteins A (MICA) and B (MICB), and UL-binding proteins (ULBP) 1 to 6. NKG2DLs are expressed on the cell surface under “stressed” conditions, such as viral infection, DNA damage, heat shock, and transformation. A receptor of NKG2DL, NKG2D, is expressed on cytotoxic lymphocytes, including natural killer (NK) cells and CD8+ T cells, and triggers cytotoxicity in NK cells by recognizing NKG2DLs expressed on the surface of stressed cells (“induced-self” recognition). Therefore, NKG2DL plays a key role in the “danger signal” to maintain tissue homeostasis by promoting the elimination of stressed cells (1).
The expression of NKG2DL is upregulated in activated immunocompetent cells, such as macrophages in atherosclerotic plaques (3) and antigen-stimulated CD4+ and CD8+ T cells (4). Generally, cell-to-cell cross-talk through NKG2D-NKG2DL regulates the inflammatory response by stimulating NKG2D+ cells to produce cytokines, including interferon-γ (IFN-γ) (5), and/or promoting the killing of NKG2DL-expressing cells (4,6). Therefore, NKG2DL expression found in immunocompetent cells is assumed to provoke a similar reaction in NKG2D+ cells, although there have not been sufficient studies on the effect of NKG2DL upregulation in immunocompetent cells.
The rapid diversification found in mammalian NKG2DL genes prevents simple interpretation of the function of human NKG2DLs, based on the evidence from animal models (1). For instance, mice lack a homolog of human MICA/B, but have Mill1/2, which is absent in humans; the human ULBPs share origin with RAET1s, H60s, and MULT1 in mouse NKG2DLs; however, they are not simple counterparts, since diversification of NKG2DLs occurred after the divergence of human and mouse lineages. Owing to these differences in the NKG2DL repertory, assessment of the effect of NKG2DL expression in humans is indispensable for the determination of the role of NKG2DL expression in immune cells.
This study aimed to evaluate the physiological significance of NKG2DL expression in peripheral immune cells and estimates the causal effect of NKG2DL expression on the risk of diseases using a Mendelian randomization (MR) (7,8) approach while minimizing the risk of confounding, pleiotropy, and reverse causation.
Methods
Study subjects
The Tohoku Medical Megabank Community-Based Cohort (TMM CommCohort) study was designed as previously described (9,10). In brief, 20- to 75-year-old residents from Iwate and Miyagi, the Pacific coast prefectures in Northeast Japan, were recruited between May 2013 and March 2016. The TMM CommCohort was composed of type 1 and type 2 surveys; the type 1 survey recruited participants at specific health checkups, and the type 2 survey enrolled participants who visited the assessment centers set for the cohort study. The method for measurement, testing, and content of questionnaires were similar in both surveys.
The data set used for PheWAS was composed of 53,599 participants in the type 1 survey (Table 1). The data set applied for expression-quantitative trait locus (eQTL) analysis was composed of 381 participants enrolled in the type 2 survey at the assessment center in Iwate prefecture, Japan.
Characteristics of the Study Populations
eQTL, expression-quantitative trait locus.
Medical history and lifestyle were documented using self-administered questionnaires (9). We used the measured traits from laboratory-based tests, such as body mass index, HbA1c, and blood urine concentration, to identify case subjects with various phenotypes (Supplementary Table S1).
The study was approved by the Institutional Review Board of Iwate Medical University and Tohoku University Tohoku Medical Megabank Organization (ToMMo) (HG H25-2 and 2012-4-617, respectively). All TMM participants provided written informed consent. All analyses using personal genotype or phenotype information were conducted in a stand-alone computing system, namely the ToMMo supercomputer (11).
This study was conducted according to the principles of the Declaration of Helsinki.
Genotyping and genotype imputation
Genotyping and genotype imputation were performed as described previously (10,12,13). In brief, the customized genotyping array designed by the TMM, denoted as Japonica array version 2 (JPAv2), was used for genotyping 53,599 participants from the type 1 survey and 381 participants from the type 2 survey. The genotyped data were prephased using SHAPEIT version 2.r837 and imputed using IMPUTE version 2.2.2, with the 3.5KJPN, an allele frequency panel of ∼3500 Japanese individuals (14 –16). Subjects compatible with the following criteria were excluded from the analysis: low call rate (< 0.99), non-Japanese ancestry, or one of a close kin pair (PI_HAT > 0.1875).
Close kin pairs were identified using PLINK version 1.90b5.3. Variants with a low call rate (< 0.95), low Hardy–Weinberg equilibrium exact test p-value (p < 1 × 10⁻⁶), low minor allele counts (< 10), and low imputation quality (R 2 < 0.3) were also excluded. As a result, 8860 individuals were removed from type 1 survey, 44,739 subjects with 34,705,859 autosomal genotypes were retained, and PheWAS analyses were applied subsequently; in type 2 survey, 381 subjects with 6,458,337 autosomal genotypes remained and eQTL analysis was applied.
eQTL analysis
Transcriptome data from the type 2 survey subjects had been prepared previously for the iMETHYL database (17). The procedures used for the collection of peripheral blood mononuclear cells (PBMCs), RNA sequencing, and transcriptome analysis were performed as described previously (18,19). In brief, PBMCs were purified from whole blood samples immediately after collection from participants and stored at −80°C until use. For RNA sequencing, 200 ng of total RNA was used to prepare cDNA libraries and sequenced using HiSeq2500 (Illumina). After quality control, short reads were mapped onto the human genome reference sequence (GRCh37) using Bowtie version 2.2.9 and TopHat version 2.1.1. The expression levels were measured using Cufflinks version 2.1.1 based on GENCODEv19 annotation.
To adjust for bias in the genotype data associated with samples' relatedness, the principal component (PC) of the genotype data was calculated using PLINK version 1.90b5.3. We fitted the NKG2DL expression levels and genotypes within 2 Mbp from both termini of the genes to a general linear regression model using Plink version 2.00a3LM (20), with the following covariates: age, sex, the top PC in the genotype data, and top three PCs of the expression data; the top PC in the genotype data was significant in the Tracy-Widom tests in EIGENSOFT version 7.2.1 (21). The top three PCs of the expression data were calculated using R version 4.0.2 to adjust for the expected bias associated with samples and experimental batches. The three PCs represented > 5% of the total variation in the transcriptome, expecting it could adjust for major bias in the background of the transcriptome data.
Association test for outcomes
In the self-reported medical histories in the TMM CommCohort, we included 35 diseases concerning immune response, neoplasms that could activate the cytotoxic activity through NKG2D, and common phenotypes (otitis media, obesity, hypertension, deafness, hyperuricemia, ureteral stone, and migraine) with N > 1000 cases in the cohort (Supplementary Table S1). All outcomes were considered as binary traits. We sorted the outcomes of the latest ICD-11 (22); although pollinosis (CA08.00) was included as a subgroup of allergic rhinitis (CA08.0), we handled it distinctly in this study, owing to the difference in the method used for the survey, such as laboratory tests and self-reported questionnaires, respectively.
The genotypes in the target variants were fitted to each phenotype in the logistic/Firth regression model using Plink version 2.00a3LM (20), with adjustment for the following covariates: age, sex, and the top 10 PCs in the genotype data (21). Since the variants within the same haplotype block are simultaneously inherited in the next generation through linkage disequilibrium, the result of the association shows the summaries of each haplotype block as a unit. Therefore, we represented the peak association in each haplotype block determined by linkage disequilibrium clumping of the eQTL results using Plink version 1.90b5.1 (20).
MR analysis
Two-sample MR and sensitivity analyses were conducted using TwoSampleMR version 0.5.5 (8,23) in R version 4.0.2 (schematic illustration of the two-sample MR is shown in Supplementary Fig. S1). We estimated the causal effect of NKG2DL expression on the identified outcome using the eQTL summary as exposure. Instrumental variables (IV) for MR were selected from suggestive eQTLs (p < 5 × 10⁻³), and variants in the same haplotype block (R 2 > 0.01, linkage disequilibrium) were excluded. In addition, the weak genetic instruments with F-statistic <10 (8,24) and an outlying instrument detected by MR-PRESSO (p < 0.05) (25) were excluded to avoid bias.
We estimated the representative effect size of an individual genetic instrument by calculating the weighted median (WM) (26) estimator, and an association was deemed causal at p < 0.05 (27). We performed various sensitivity analyses, including the pleiotropic test by MR-Egger (28). We confirmed associations identified by different estimators, such as inverse-variance weighted (IVW) meta-analysis (7), weighted mode (29). Replication MR was conducted with a publicly available genome-wide association study (GWAS) summary as an outcome retrieved from the Open GWAS project (30).
Data sharing statement
The data sets analyzed in this study are not publicly available for ethical reasons. However, they can be made available upon request after approval from the Ethical Committee of Iwate Medical University, the Ethical Committee of ToMMo, and the Materials and Information Distribution Review Committee of TMM Project.
The codes and data prepared for this study are available at:
Results
eQTLs for NKG2DL expression
To determine the effective NKG2DL expression in the PBMCs, we assessed the expression level of all NKG2DLs in 381 subjects and confirmed MICA and MICB to be the predominant NKG2DLs in the PBMCs (Supplementary Table S2). Then, we applied eQTL analysis to MICA and MICB expression levels and identified a clear peak above the Bonferroni threshold for each gene (Supplementary Fig. S2). The top variant in the MICA eQTLs at 6:31353639 (rs2523484; β = −3.58 ± 0.172; p = 1.1 × 10−64) was found to be a MICA eQTL in the published eQTL database, such as GTEx (v8) (31) (normalized effect size [NES] = −0.16; p = 5.5 × 10⁻⁷ in whole blood) and human genome variation database (32) (p = 7.2 × 10⁻¹⁸ in whole blood). In addition, in the MICB eQTLs, the top variant at 6:31480005 (rs41293891; β = −5.95 ± 0.641; p = 1.4 × 10⁻¹⁸) was found to be an MICB eQTL in the GTEx (NES = −0.98; p = 1.2 × 10−42 in whole blood).
Association test between eQTLs and outcomes
We applied the suggestive eQTLs (p < 5 × 10⁻³; Supplementary Table S3) for outcomes and estimated the minimum p-value for each haplotype block (R 2 > 0.01) (Fig. 1 and Supplementary Table S4). We set the significance level at the Bonferroni threshold, determined by phenotype counts × haplotype blocks in the analysis [p = 0.05/(58 phenotypes × 10 haplotype blocks) ∼8.6 × 10⁻⁵ for MICA; p = 0.05/(58 phenotypes × 7 haplotype blocks) ∼1.2 × 10⁻⁴ for MICB], since eQTLs in the same haplotype block were correlated.
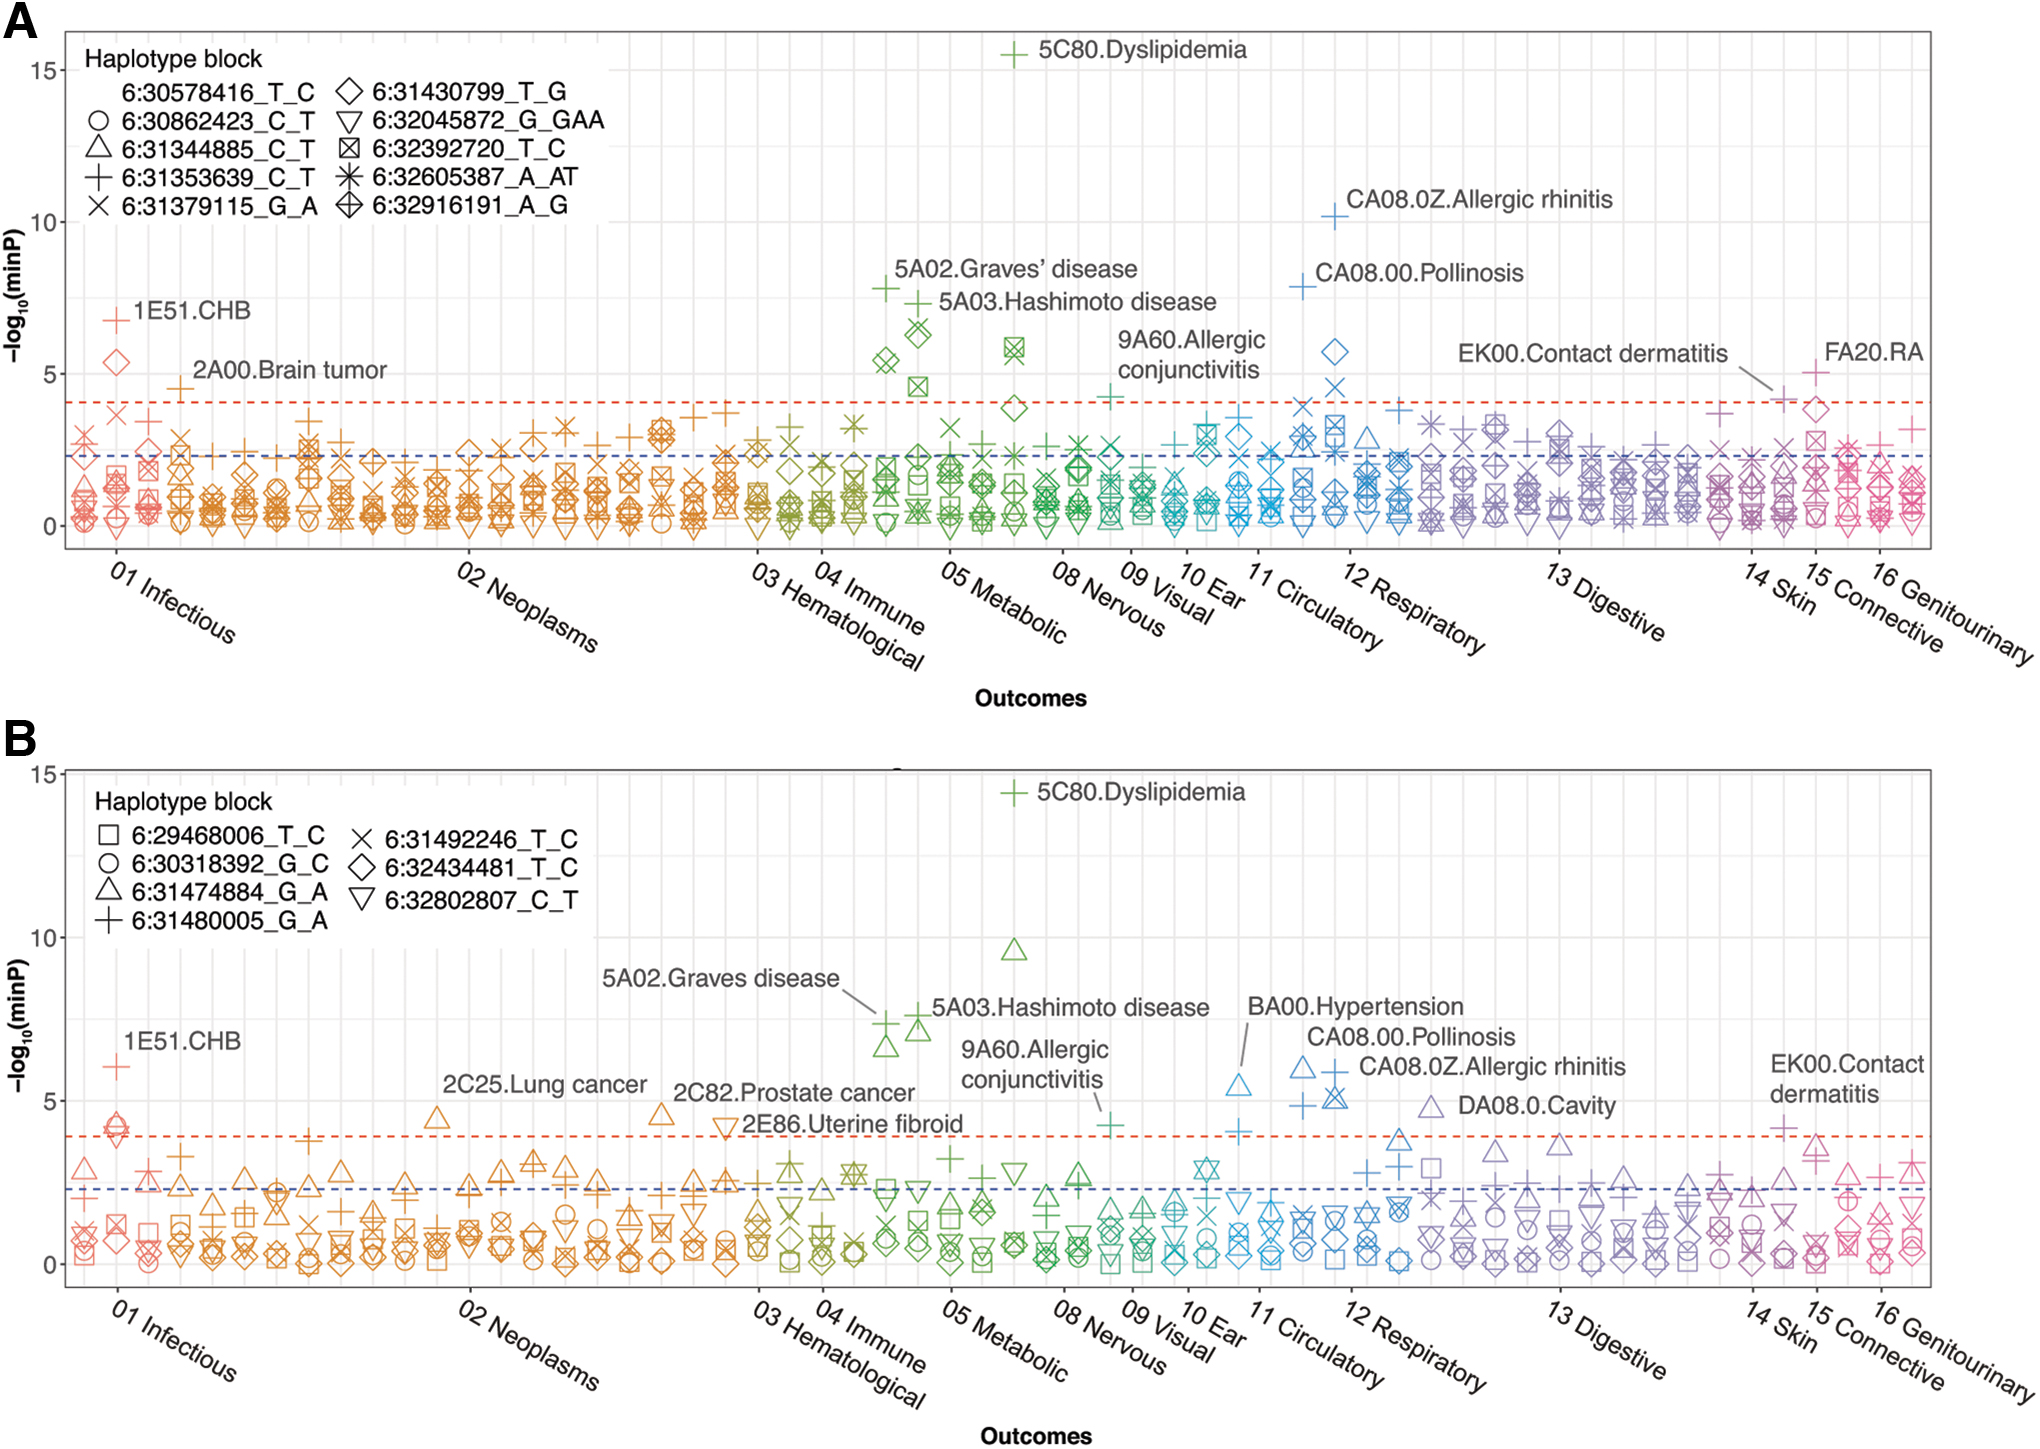
Association between eQTLs and the outcomes. The Manhattan plot shows the association between the outcomes and MICA
In the association test, we identified 10 or 13 significant outcomes associated with the MICA or MICB eQTLs, respectively. Among the identified outcomes, eight were common in both genes, namely chronic hepatitis B (CHB), Graves' disease (GD), Hashimoto disease, dyslipidemia, allergic conjunctivitis, pollinosis (to cedar pollen, the most frequent allergen in the cohort), allergic rhinitis, and contact dermatitis (“Methods”; Supplementary Table S1). In contrast, brain tumors and rheumatoid arthritis were associated with only MICA eQTLs; lung cancer, prostate cancer, uterine fibroid, hypertension, and cavity were associated with only MICB eQTLs.
MR analysis
We selected IVs belonging to an independent haplotype block (R 2 > 0.01) from the suggestive eQTLs (Supplementary Table S5). Variants with lower F-statistic (F < 10), such as rs1554327340 for MICA and rs2534652, rs7766082, and rs17202899 for MICB, were excluded from the IVs to avoid bias (24). Under the assumption of complete independence of the IVs, nine instruments explained 87.6% of the variance in MICA expression; similarly, four instruments explained 33.0% of the variance in MICB expression. Notably, rs2523484 was the strongest IV, which explained more than half of the variance (52.5%) in MICA expression. In the IV for MICA expression, rs4959069 was a variant shared with the suggestive eQTLs for MICB (p = 1.5 × 10⁻⁹) while rs41293891 in the instruments for MICB was shared with the suggestive eQTLs for MICA (p = 2.3 × 10⁻⁵).
Using the selected IVs, we performed MR with NKG2DL expression as exposure (Fig. 2 and Supplementary Table S6), and identified the causal effect of MICA expression level on the risk of GD (P WM = 4.1 × 10⁻³), allergic conjunctivitis (P WM = 1.8 × 10⁻²), and CHB (P WM = 4.6 × 10⁻²), using a WM estimator. Similarly, we found a causal effect of MICB expression on the risk of CHB (P WM = 2.9 × 10⁻²) and cavity (P WM = 3.4 × 10⁻²). No significant pleiotropy was found in these associations (p > 0.05) in the MR-Egger intercept test (Supplementary Table S6). Interestingly, MICA expression showed a negative causal effect on the risk of GD (odds ratio [OR] 0.983; confidence interval [CI 0.971–0.995]), per standard deviation increase in MICA expression, and allergic conjunctivitis (OR 0.986; [CI 0.975–0.998]).
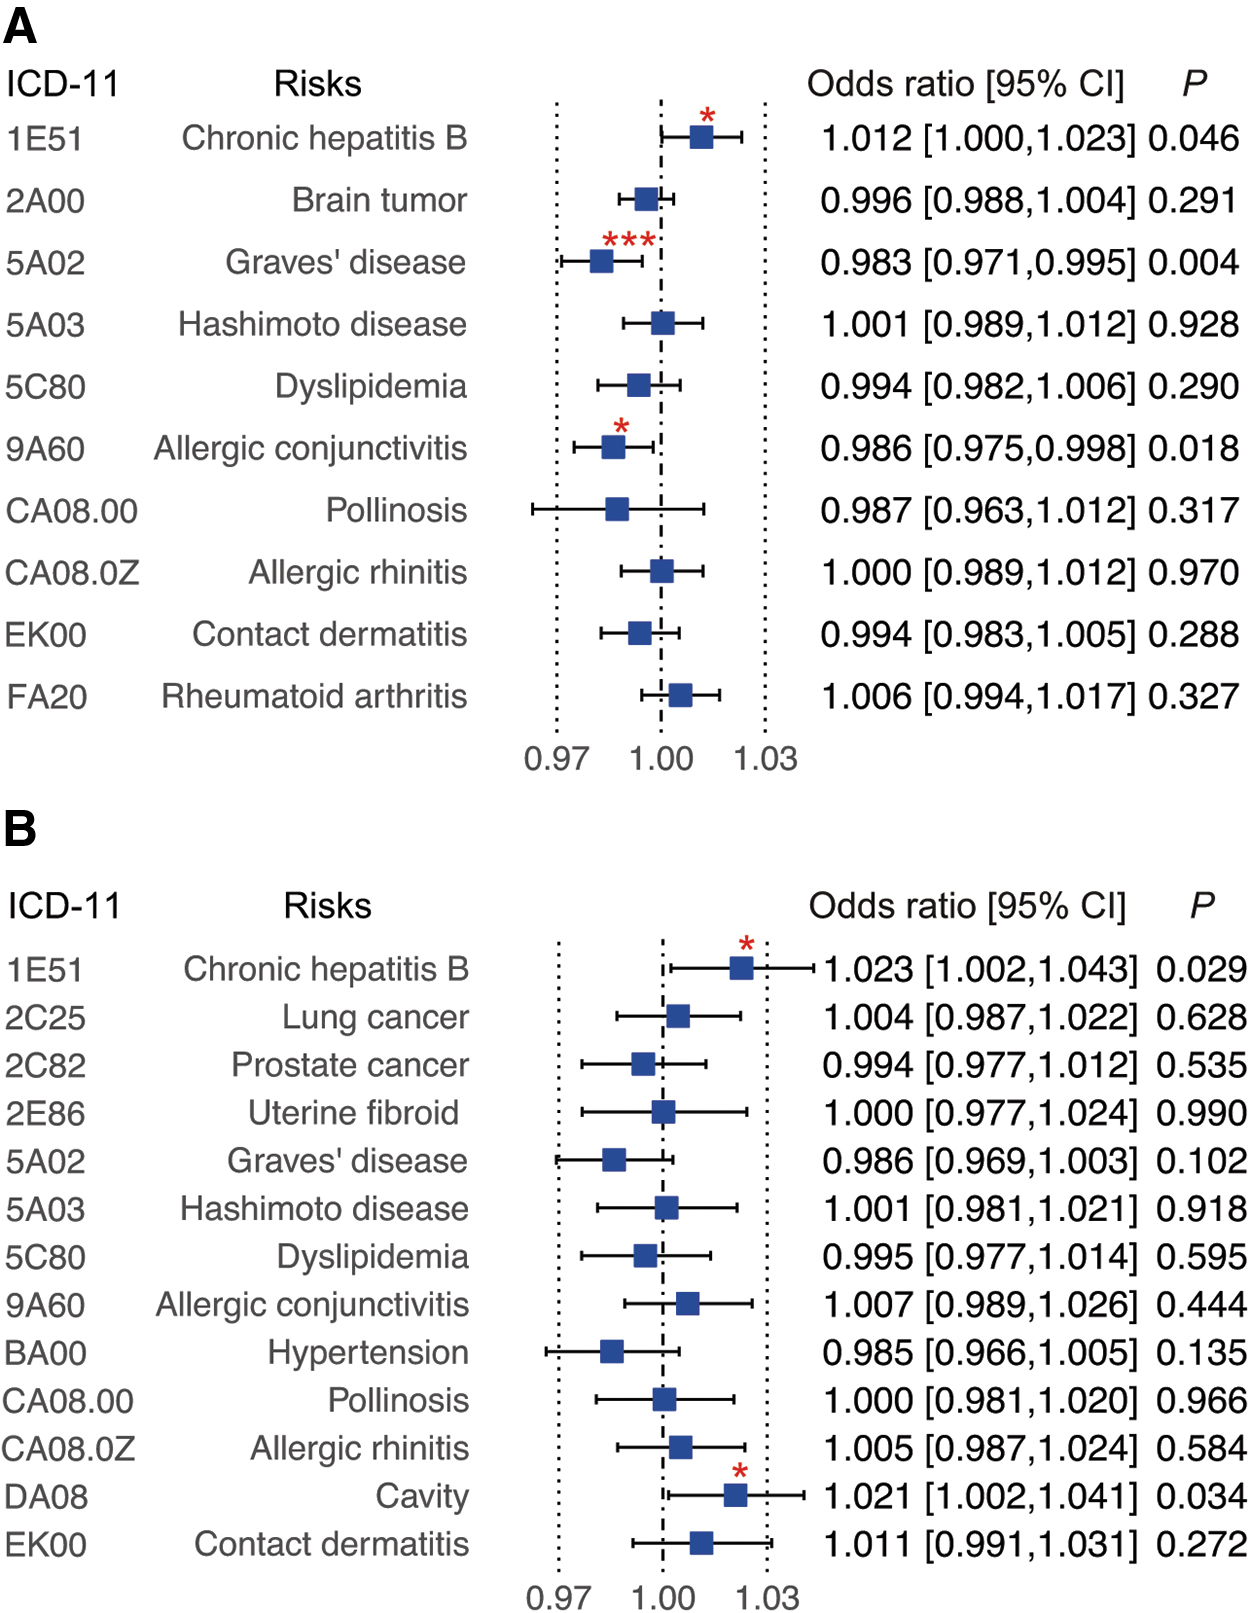
MR analysis for the outcomes associated with eQTLs for MICA/B expression. The effect sizes in MR analysis between the PheWAS-identified outcomes and the eQTLs for MICA (
We performed replication analysis of the identified causal effects using the different summary data as outcome, retrieved from the IEU OpenGWAS project (30,33), and found the causal effect of MICA expression on GD risk (open GWAS ID: bbj-a-123) to be replicated (OR 0.910; [CI 0.860–0.963]; P WM = 1.1 × 10⁻³; Fig. 3 and Supplementary Table S7). Similarly, the association between MICA and MICB expression and the risk of CHB were replicated (Supplementary Table S7).
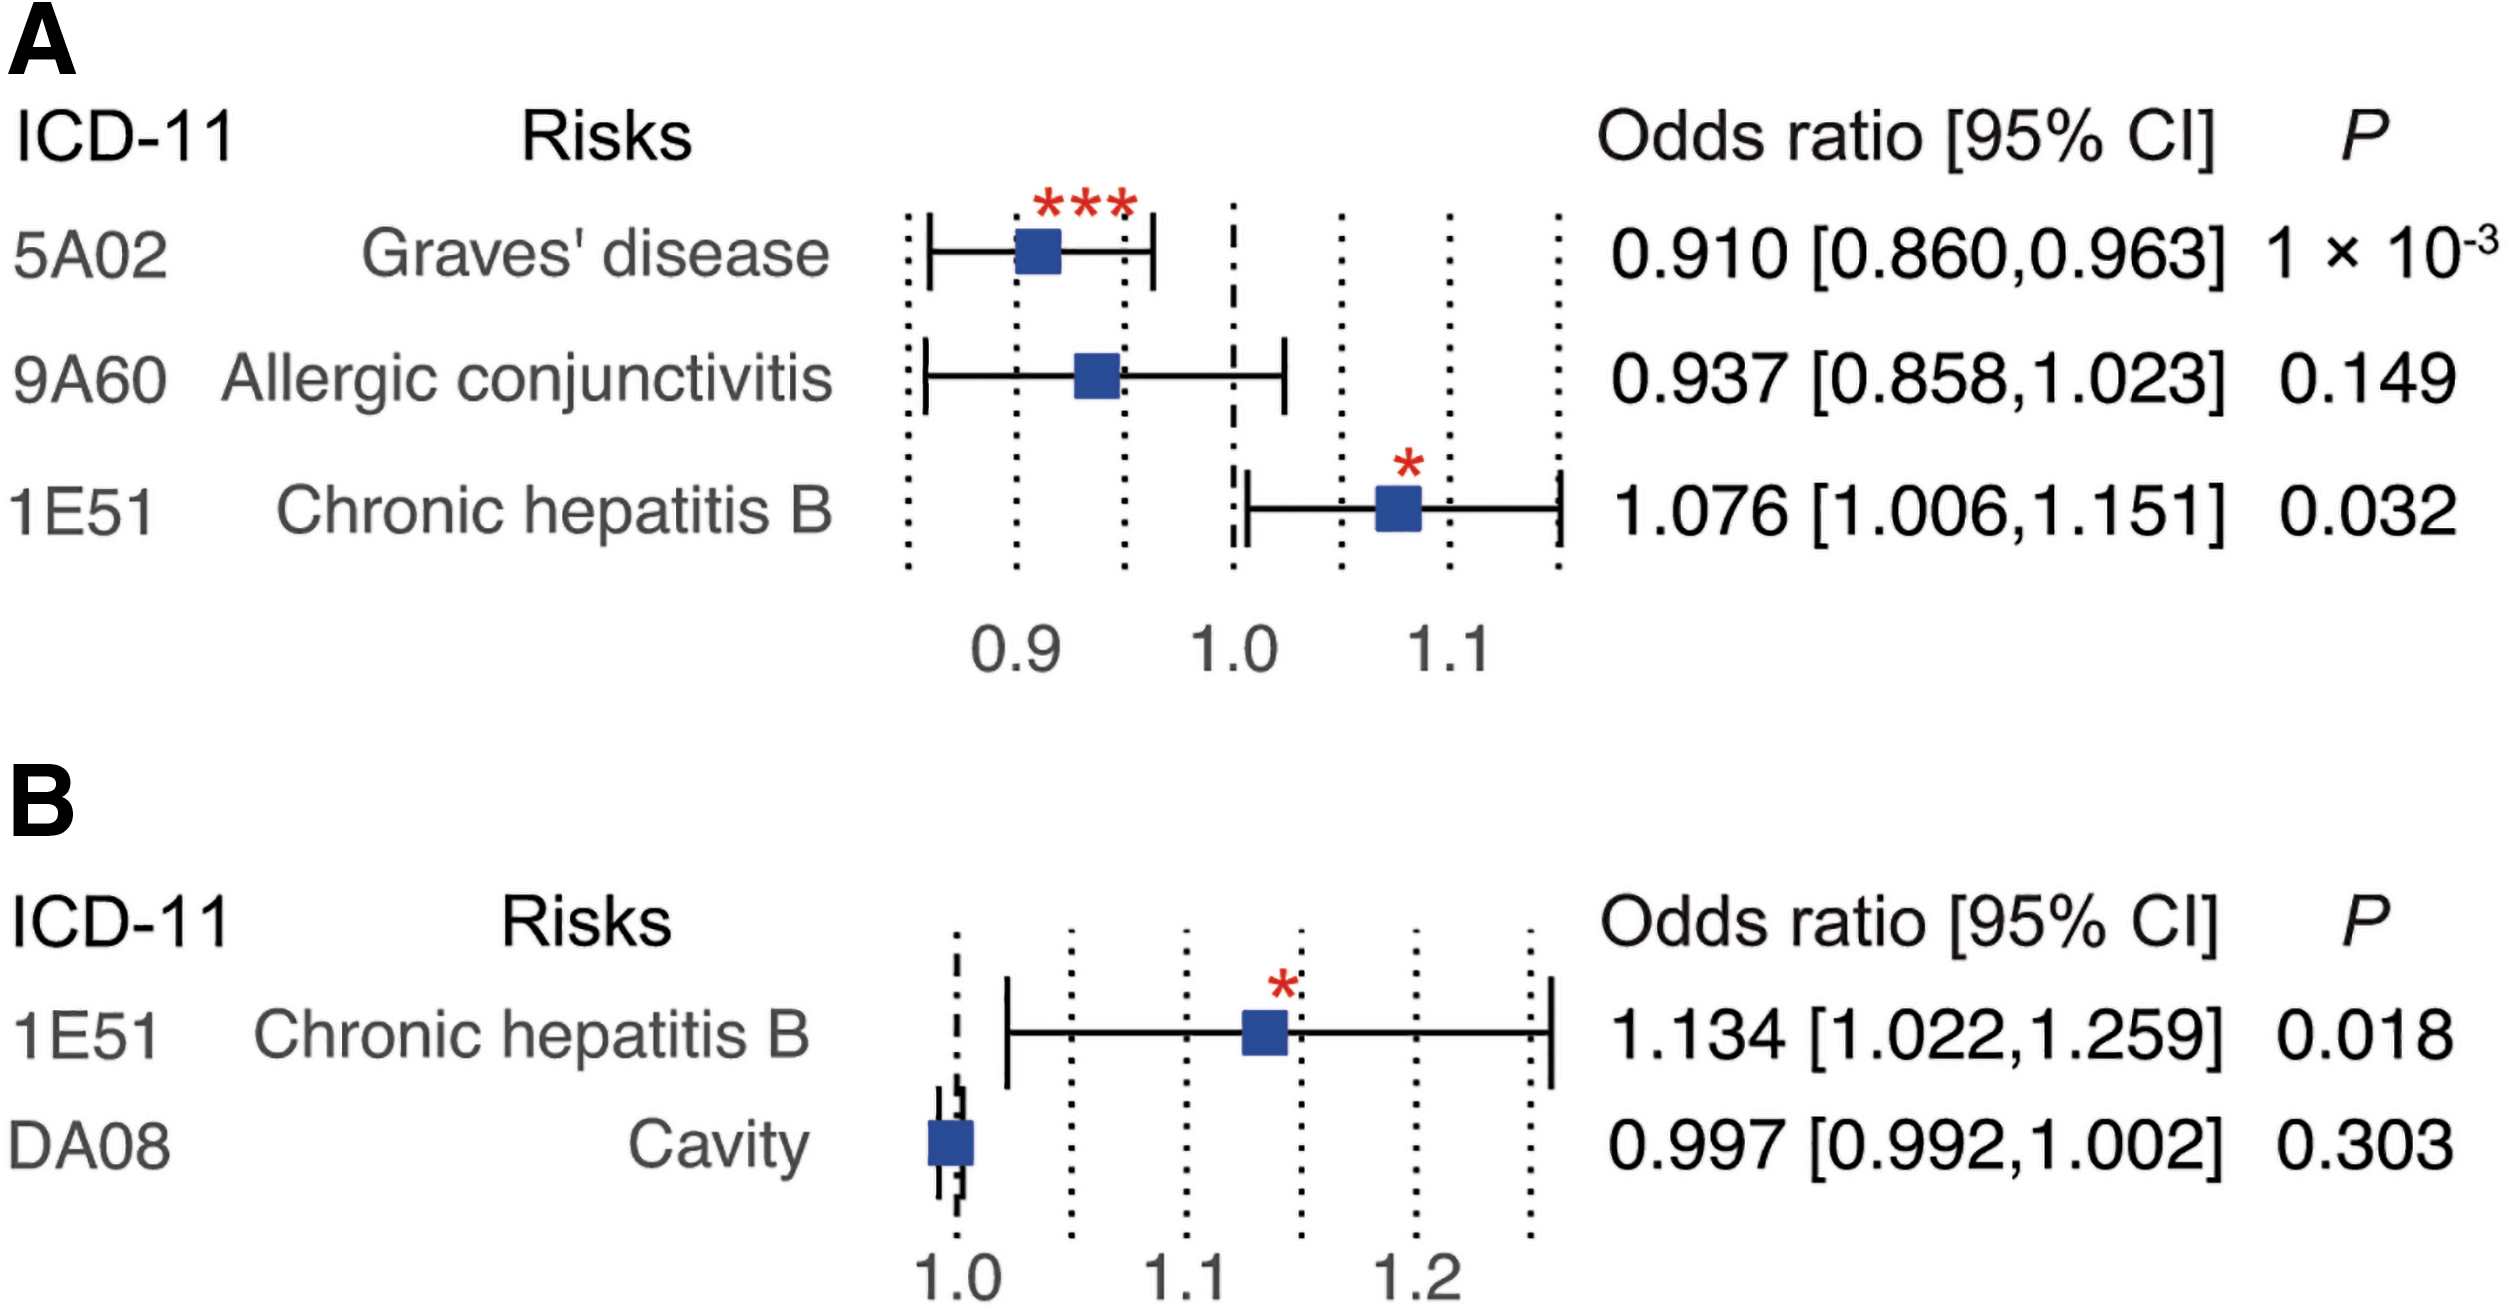
Replication analysis using publicly available GWAS summary. Replication analysis for the outcomes identified significant causal effects in the main analysis, which was conducted using publicly available GWAS summaries in open GWAS project (30). The effect size in MR analysis for MICA (
In addition, we conducted MR using the GWAS summary of hepatitis B surface antigen (HBsAg) serostatus in Cohort II of the Japan Public Health Center-based prospective (JPHC) study (34 –36) (Supplementary Table S8); however, no association was identified with the present MICA and MICB expression data.
Sensitivity analyses
We assessed the robustness of the main MR by the sensitivity analyses. First, to confirm whether the result in this study was dependent on the estimation method of causal effect, we reassessed the causal effect of MICA expression on the risk of GD and CHB using estimators based on different methods (Supplementary Figs. S3–S5 and Supplementary Table S9). The effect of MICA expression on the risk of GD was further supported when we estimated the same using MR-Egger (OR 0.955; [CI 0.925–0.987]; p = 0.027), IVW (IVW; OR 0.986; [CI 0.973–0.999]; p = 0.034), and weighted mode (OR 0.978; [CI 0.966–0.990]; p = 0.007) (Supplementary Fig. S3). The causal effect of MICA and MICB expression on CHB risk was supported by IVW analysis (OR 1.011; [CI 1.001–1.021]; p = 0.028 and OR 1.025; [CI 1.007–1.043]; p = 0.006, respectively). These results confirm the findings in this study when using different estimation methods.
In addition, we performed a leave-one-out test (Supplementary Figs. S3 and S4) to confirm that the finding in the multiple instrumental MR analysis is dependent on effect size of by which variant; this test estimates the causal effect size when one of the IVs is excluded. We found that rs2523484 in MICA eQTL had a predominant effect size in the causal association of MICA and GD, which suggests that the finding in our study is influenced by whether rs2523484 was included in the analysis.
Using this predominance, we tested the causal association in MICA and GD using a pair of exposure-outcome data sets independent of the discovery analysis (Supplementary Table S10). Although it was an MR analysis based on a single variant, the finding in the discovery analysis was confirmed (P wald = 1.6 × 10⁻⁴).
Discussion
In this study, we examined the causal effect of NKG2DL expression levels in PBMCs on the health risks identified in the PheWAS, with an assessment of the possibility of pleiotropy. Since MICA/B is in the MHC class I region, estimating the pleiotropic effect would be important to control the effect of human leukocyte antigen (HLA) and other immune-related genes in the analysis. The present MR showed that a lower MICA expression level was associated with a higher risk of GD. The p-value (P WM = 0.004) was lower than the Bonferroni threshold considering 10 tests of MR analysis for MICA and α = 0.05 (0.05/10 = 0.005). Similarly, higher MICA/B expression levels were associated with a higher risk of CHB infection. The results were replicated in another MR using the open GWAS summary (bbj-a-123 for GD and bbj-a-99 for CHB) (33). Notably, in the GWAS that provided the outcome data for the replication MR, the case subjects were determined by clinical diagnostics, suggesting that there is causal relationship of MICA/B expression and the diagnosis of GD and CHB.
GD is an autoimmune disease caused by autoantibodies that stimulate thyrotropin receptor (37). In twin studies, the heritability of GD was up to 79% (38), and the remaining are likely due to environmental factors. While infection, iodine, smoking, stress, and drugs have been reported as environmental stimulators (37), associations with particular HLA alleles have been reported as the genetic factors (39,40). In addition, Cho et al. had reported an association between the MICA allele MICA*010 (included in MICA A5) and autoimmune thyroid disease (AITD) (41). The subjects harboring MICA*010 showed a higher AITD risk (OR 2.21; [CI 1.30–3.76]). MICA*010 is known to inhibit protein folding and suppress surface expression of MICA. Other studies had assessed the risk in the MICA A5.1 allele; however, the conclusions therefrom have remained inconsistent (42,43).
Several studies have suggested an association between GD and chronic hepatitis. For instance, 40% of the patients with chronic hepatitis C (CHC), who receive IFN-α therapy, are eventually thyroid antibody-positive (44,45). IFN-α usually upregulates MICA expression in dendritic cells to activate NK cells; however, the upregulation of MICA protein was significantly suppressed in the dendritic cells of patients with CHC (44). This seemed to be an interesting finding with this study, where the reduction of MICA expression in PBMCs was associated with higher GD risk (Supplementary Fig. S6).
In contrast, in patients with CHB, dendritic cells did not show suppression of MICA expression (44). However, a cultured hepatic cell line transfected with HBsAg inhibited the expression of MICA/B protein on the cell surface, suggesting that it could also be involved in immune evasion (46,47). We could not identify the causal effect of MICA/B expression on HBsAg serostatus (Supplementary Table S8), possibly because the genetically determined MICA/B expression level did not have a significant effect on HBV (persistent) infection. The role of MICA/B expression in the later stages of CHB, such as the erupting inflammation or disruption of hepatic tissue, remains to be determined.
This study had several limitations. First, the ULBPs had been excluded from eQTL analysis since their constitutive expression levels are usually low in PBMCs. Next, we conducted replication analysis for pollinosis due to cedar pollen; however, subjects with pollinosis in the replication data (bbj-a-146) probably included those with pollinosis for other pollens as well, although the cedar pollen is the dominant allergen in patients with Japanese pollinosis (48). Finally, our replication analysis was conducted under the same exposure data in the discovery analysis, since the other exposure data fine-mapped in the MHC region and expression data were not available.
Conclusion
In conclusion, our results suggested that there is a causal effect of peripheral MICA/B expression levels on the risk of GD and CHB. Although a wide range of cells can express MICA/B, due to the general redundancy in NKG2DLs, the outcome due to reduction in the genetically determined MICA/B expression level might not be observed as the significant elevation of susceptibility in broad diseases. In other words, it could be considered as an alteration of risk of a specific disease where the part of the mechanism predominantly depended on MICA/B function rather than on NKG2DLs. Understanding the role of MICA/B expression in GD and CHB could help to mitigate this disease and better explain the immunoregulatory function of NKG2DLs.
Footnotes
Acknowledgments
We are grateful to the participants of the Tohoku Medical Megabank Project.
Authors' Contributions
Y.S. performed the statistical analysis and wrote the article; S.K., K.O., and H.O. performed the RNA-seq analysis; S.S. and T.Y. performed the analysis using JPHC data; R.K., N.S., Y.O., A.T., and S.U. provided advice for the study as specialists in genome epidemiology; T.H., M.I., and A.S. supervised the study; Y.S. and A.S. designed and coordinated the project; all authors commented on and approved the article.
Author Disclosure Statement
No competing financial interests exist.
Funding Information
This study was supported by the Tohoku Medical Megabank Project (Special Account for the Reconstruction from the Great East Japan Earthquake) from the Ministry of Education, Culture, Sports, Science and Technology (MEXT) and the Japan Agency for Medical Research and Development (AMED) [Grant Nos. JP19km0105004 and JP20km0105004]; the Japan Society for the Promotion of Science (JSPS) KAKENHI [Grant No. JP20K10509]; genetic research in the JPHC Study was supported by the Japan Agency for Medical Research and Development (AMED) [Grant No. JP21ck0106551] and by National Cancer Center Research and Development Fund [Grant No. 31-A-18].
Supplementary Material
Supplementary Figure S1
Supplementary Figure S2
Supplementary Figure S3
Supplementary Figure S4
Supplementary Figure S5
Supplementary Figure S6
Supplementary Table S1
Supplementary Table S2
Supplementary Table S3
Supplementary Table S4
Supplementary Table S5
Supplementary Table S6
Supplementary Table S7
Supplementary Table S8
Supplementary Table S9
Supplementary Table S10