
Abstract
Background:
Familial nontoxic multinodular goiter (MNG) is a rare disease. One of the associated genes is Kelch-like ECH-associated protein 1 (KEAP1), which encodes the main inhibitor of nuclear factor erythroid 2-related transcription factor 2 (Nrf2), a central mediator of antioxidant responses. The association of KEAP1 with familial MNG is based on only two loss-of-function mutations identified in two families, only one of which included proper phenotyping and adequate demonstration of co-segregation of the phenotype and the mutation. There is no experimental evidence from model organisms to support that decreased Keap1 levels can, indeed, cause goiter. This study used mice hypomorphic for Keap1 to test whether decreased Keap1 expression can cause goiter, and to characterize the activation status of Nrf2 in their thyroid.
Methods:
C57BL/6J Keap1flox/flox (Keap1 knock-down [Keap1KD]) mice were studied at 3 and 12 months of age. Plasma and thyroid glands were harvested for evaluation of thyroid function tests and for gene and protein expression by real-time polymerase chain reaction and immunoblotting, respectively.
Results:
Keap1KD mice showed diffuse goiter that began to develop in early adult life and became highly prominent and penetrant with age. The goiter was characterized by a markedly increased size of thyroid follicles, most notably of the colloid compartment, and by absence of thyroid nodules or hyperplasia. Keap1KD mice also showed decreased T4 levels in early adult life that were eventually well compensated over time by increased thyrotropin (TSH) levels. Nrf2 was activated in the thyroid of Keap1KD mice. Despite a known stimulatory effect of Nrf2 on thyroglobulin (Tg) gene transcription and Tg protein abundance, the expression levels were decreased in the thyroid of Keap1KD mice. No clear patterns were observed in the expression profiles of other thyroid hormone synthesis-specific factors, with the exception of Tg-processing and Tg-degrading cathepsins, including an increase in mature forms of cathepsins D, L, and S.
Conclusions:
Keap1KD mice develop age-dependent diffuse goiter with elevated TSH levels. The precise mechanism accounting for the thyroidal phenotype remains to be elucidated, but it may involve enhanced Tg solubilization and excessive lysosomal Tg degradation.
Introduction
Familial nontoxic multinodular goiter (MNG) is a rare disease that is characterized by Mendelian inheritance (mostly in an autosomal dominant pattern), nodular enlargement of the thyroid gland, normal thyroid function, and absence of thyroidal inflammation (1). Several associated genes and loci have been identified, including DICER1 (MNG-1, Online Mendelian Inheritance in Man [OMIM] #138800) (2), Xp22 (MNG-2, OMIM #300273) (3), 3q26.1-q26.3 (MNG-3, OMIM #606082) (4), and others (5,6). One of the genes more recently associated with familial nontoxic MNG is KEAP1, encoding Kelch-like ECH-associated protein 1, an adaptor protein tethered to the actin cytoskeleton as well as to the cytoplasmic surface of mitochondria (7,8). Specifically, two different inherited heterozygous loss-of-function mutations in KEAP1 have been reported in two unrelated families from Japan with autosomal dominant MNG (9,10). Co-segregation of the mutation (c.879_880delinsA, p.Asp294Thr, fs*23) and the phenotype was very convincingly documented in the first family (9). However, in the second family, only the proband was genotyped and directly phenotyped, and the diagnosis in family members was based only on history; therefore, co-segregation of the mutation (c.1448G>A, p.R483H) and the phenotype could not be conclusively demonstrated (10). Thus, with only one properly characterized family (9), the association of familial nontoxic MNG with KEAP1 remains tentative, because it cannot be formally excluded that some other distinct mutation closely linked to the KEAP1 locus may actually be the causal factor in the respective family (9). Of note, there is no published experimental evidence from model organisms to support the hypothesis that decreased Keap1 levels can cause goiter.
Keap1 is best known for its inhibitory function on nuclear factor erythroid 2-related transcription factor 2 (Nrf2), a central mediator of cellular antioxidant responses (11). Under basal conditions, Nrf2 is bound to its cytoplasmic inhibitory complex formed by Keap1 and Cullin 3 (Cul3). In this complex, Keap1 serves as an adaptor between Nrf2 and Cul3, targeting Nrf2 for poly-ubiquitination by Cul3, which, in turn, leads to Nrf2 degradation via the proteasome. Under conditions of oxidative stress, specific redox-reactive cysteines of Keap1 become oxidized, thereby abolishing its ability to target Nrf2 for poly-ubiquitination and degradation (7,11). Nrf2 is, thus, stabilized and accumulates in the nucleus, where it binds to DNA sequences called antioxidant response elements (AREs) located in the promoters and enhancers of numerous target genes (12).
We have recently shown that Nrf2 not only coordinates antioxidant defenses in the mouse thyroid but also directly increases thyroglobulin (Tg) synthesis, while at the same time inhibiting its iodination (13,14). Moreover, both of the loss-of-function KEAP1 mutations associated with familial MNG were experimentally shown to activate Nrf2 (9,10,15). Thus, it is conceivable that Nrf2 activation secondary to loss of Keap1 function may impact thyroid physiology in a manner that could lead to goiter. In this study, we used mice hypomorphic for Keap1 to directly test whether decreased Keap1 expression can cause goiter and to characterize the activation status of Nrf2 in the thyroids of these mice.
Materials and Methods
Mice
C57BL/6 J Keap1flox/flox mice were developed in the laboratory of Prof. Masayuki Yamamoto (University of Tsukuba, Japan) (16). For the present work, mice were obtained from the laboratory of Prof. Thomas Kensler (University of Pittsburgh, Pittsburgh, PA). Compared with wild-type (WT) control mice, C57BL/6J Keap1flox/flox mice express lower levels of Keap1 because of the loxP site insertions. In this study, the Keap1 hypomorphic mice are designated as Keap1 knock-down (Keap1KD) mice, similar to other publications (17,18). Because total knockout (KO) of Keap1 in mice leads to malnutrition and death at weaning as a result of esophageal hyperkeratosis (19), Keap1KD mice are a useful and validated model of constitutive Nrf2 pathway activation (20). Genotyping polymerase chain reaction (PCR) primers and cycling condition protocols for Keap1KD mice have been previously described and were used in this study (21). Colonies of C57BL/6J WT and Keap1KD mice were maintained in the animal facility of the Department of Physiology at the University of Lausanne in temperature-, light-, and humidity-controlled rooms with a 12-hour light/dark cycle. Mice with “thyroid-specific” deletion (more accurately, tissue-restricted deletion, since Pax8 is also expressed in other tissues) of the Nrf2 gene [Pax8(Cre/+)-Nrf2 flox/flox; also referred to as ts-Nrf2-KO] have been previously described (13). All animal procedures were in accordance with Swiss legislature and the study was approved by the Canton of Vaud SCAV (Service de la Consommation et des Affaires Vétérinaires).
Tissue collection
Mice were sacrificed by cervical dislocation immediately before removal of the thyroid, the liver, and the pituitary gland. After removal of the thyroid, mice were decapitated and neck blood was collected in EDTA-coated tubes. Tissues were submerged in RNAlater solution (ThermoFisher, Waltham, MA) for RNA and protein isolation, or in 4% neutral-buffered formalin for tissue fixation and hematoxylin and eosin (H&E) staining.
Hormonal measurements
Plasma was collected from EDTA-coated tubes by centrifugation at 2000 g for 20 minutes. Plasma thyrotropin (TSH), total thyroxine (T4), and total triiodothyronine (T3), were measured at the University of Chicago, as previously described (13,22).
RNA isolation and real-time reverse transcription polymerase chain reaction
Total RNA from RNAlater-preserved tissues was isolated by using TRIzol (Invitrogen, Carlsbad, CA) and further purified by using the RNeasy mini-kit with DNAse digestion (Qiagen, Valencia, CA) as previously described (13). RNA was quantified by spectrophotometry, and the purity was assessed by the absorbance ratios of 260:280 and 260:230 nm. RNA integrity was assessed by agarose gel electrophoresis. cDNA was synthesized by using 250 ng of RNA and the SuperScript VILO cDNA Synthesis Kit (Invitrogen). cDNA was diluted 20 to 80 times, and 5 μL was used for each reaction of 15 μL final volume. Real-time PCR was performed on a ViiA 7 Real-Time PCR System instrument (Applied Biosystems, Foster City, CA) by using FAST SYBR green (Kapa Biosystems, Woburn, MA) under the following conditions: 3 minutes at 95°C, followed by 40 cycles of 10 seconds at 95°C and 25 seconds at 60°C. The primers used are shown in Supplementary Table S1. Gene-specific amplification was confirmed by melt curve analysis. Gene expression in tissues was quantified by using the comparative delta-CT method with Ppia as the reference gene. PCR amplification efficiencies were estimated by using the LinRegPCR software (23).
Western immunoblotting
Total protein from thyroids was isolated from RNAlater-preserved samples following a modification of the TRIzol protocol previously described by our group (24). Protein concentration was measured by the Pierce BCA protein assay kit (ThermoFisher). For Western blots, 10 μg thyroid protein extracts (or 50 ng for the detection of Tg) were used, and procedures were performed as previously described (13). Immunoreactive bands were visualized by WesternBright Sirius (Advansta, Menlo Park, CA) and recorded by using a charge-coupled device image sensor (ChemiDoc XRS; Bio-Rad Laboratories, Cressier, Switzerland). The following primary antibodies were used: anti-Tg (A0251, 1:10,000; Dako, Glostrup, Denmark); anti-Tg-I (25) (1:3000); anti-NIS (26) (1:5000); anti-cathepsin B (AF965, 1:1000; R&D systems, Minneapolis, MN); anti-cathepsin D (AF1029, 1:1000; R&D systems); anti-cathepsin L (AF1515, 1:1000; R&D systems); anti-cathepsin S (sc-271619, 1:250; Santa Cruz Biotechnology, Dallas, TX); anti-cathepsin K (sc-48353, 1:250; Santa Cruz Biotechnology); anti-vinculin (SAB4200080, 1:5000; Sigma-Aldrich, St. Louis, MO); anti-Pax8 (1:1000); anti-Tttf1 (1:1000); and anti-Foxe1 (1:1000) (the latter three were kindly provided by Prof. Roberto Di Lauro). Secondary antibodies were anti-mouse HRP (#7076) and anti-rabbit HRP (#7074), both from Cell Signaling Technology (Danvers, MA; 1:5000). Densitometric quantification of relative protein levels was performed by using Image Studio Lite ver. 5.2 (LI-COR Biosciences, Lincoln, NE).
Histological morphometry
Thyroid slides of 12-month-old WT and Keap1KD mice stained with H&E by Synlab Pathology, Lausanne were photographed with a Leica upright microscope (Leica microsystems, Wetzlar, Germany). Thyroids from seven WT and eight Keap1KD mice were analyzed. Morphometry was performed by using the National Institutes of Health Image J software (27) as previously described (28). For better sampling of the thyroid gland, in each mouse, 21 consecutive sections with a thickness of 2 μm were cut from the paraffin block at a mid-point position of the gland by using a Microm microtome (HM 325; Thermo Fisher Scientific, Schwerte, Germany) and the 1st, 11th, and 21st section were selected from each block. Then, 30 thyroid follicles, selected at random from both the central and peripheral regions of thyroid lobes, were analyzed per section per mouse (thus, 90 follicles total per mouse), and the following parameters were quantified for each follicle: (i) whole-follicle area; (ii) colloid-containing area; (iii) number of thyrocytes in the follicle section (“thyrocyte number,” which equals the number of visible nuclei); (iv) total area occupied by thyrocytes in the follicle section (“thyrocyte area”); and (v) average size of individual thyrocytes. Thyrocyte area was calculated by subtracting the colloid-containing area from the whole-follicle area. The average thyrocyte size was calculated by dividing the thyrocyte area by thyrocyte number.
Statistics
Quantitative results are presented as mean ± standard deviation, and histomorphometry results are presented as histograms. Thyroid gland weight and hormone levels were compared by two-way analysis of variance (ANOVA) between WT and Keap1KD mice at 3 and 12 months of age, testing for main effects (genotype, age) and interaction (between genotype and age); post hoc comparisons were performed by Tukey's test. For the histomorphometry results, the comparison of the distribution curves was performed by using the Kolmogorov-Smirnov test. In all other comparisons between two groups (WT vs. Keap1KD), the Mann-Whitney test was used. GraphPad Prism v7 (GraphPad Software, Inc., La Jolla, CA) was used for graph preparations and statistical calculations.
Results
Age-dependent diffuse goiter in Keap1KD mice
To investigate whether Keap1KD mice develop goiter, thyroids from Keap1KD mice and WT controls were dissected and weighed at 3 and 12 months of age. The presence of goiter in Keap1KD mice was evident by gross examination at 12 months of age (Fig. 1A). Analysis of thyroid weights by two-way ANOVA showed that genotype had a significant effect on thyroid weight (p < 0.05), as did the interaction of genotype with age (p < 0.05). Post hoc comparisons showed that Keap1KD mice had significantly heavier thyroids (approximately six times, p < 0.05) at 12 months of age compared with WT controls (Fig. 1B). At that age, goiter in Keap1KD mice was 100% penetrant. At the age of three months, the difference in thyroid weight was overall not significantly different between Keap1KD and WT mice; however, a tendency for heavier thyroids was seen already at this age, with about 50% of the mice having a thyroid weight at least twice that of WT mice of the same age (Fig. 1B). Post hoc comparisons also confirmed a significantly higher thyroid weight in Keap1KD mice at age 12 months compared with 3 months (p < 0.05) (Fig. 1B).
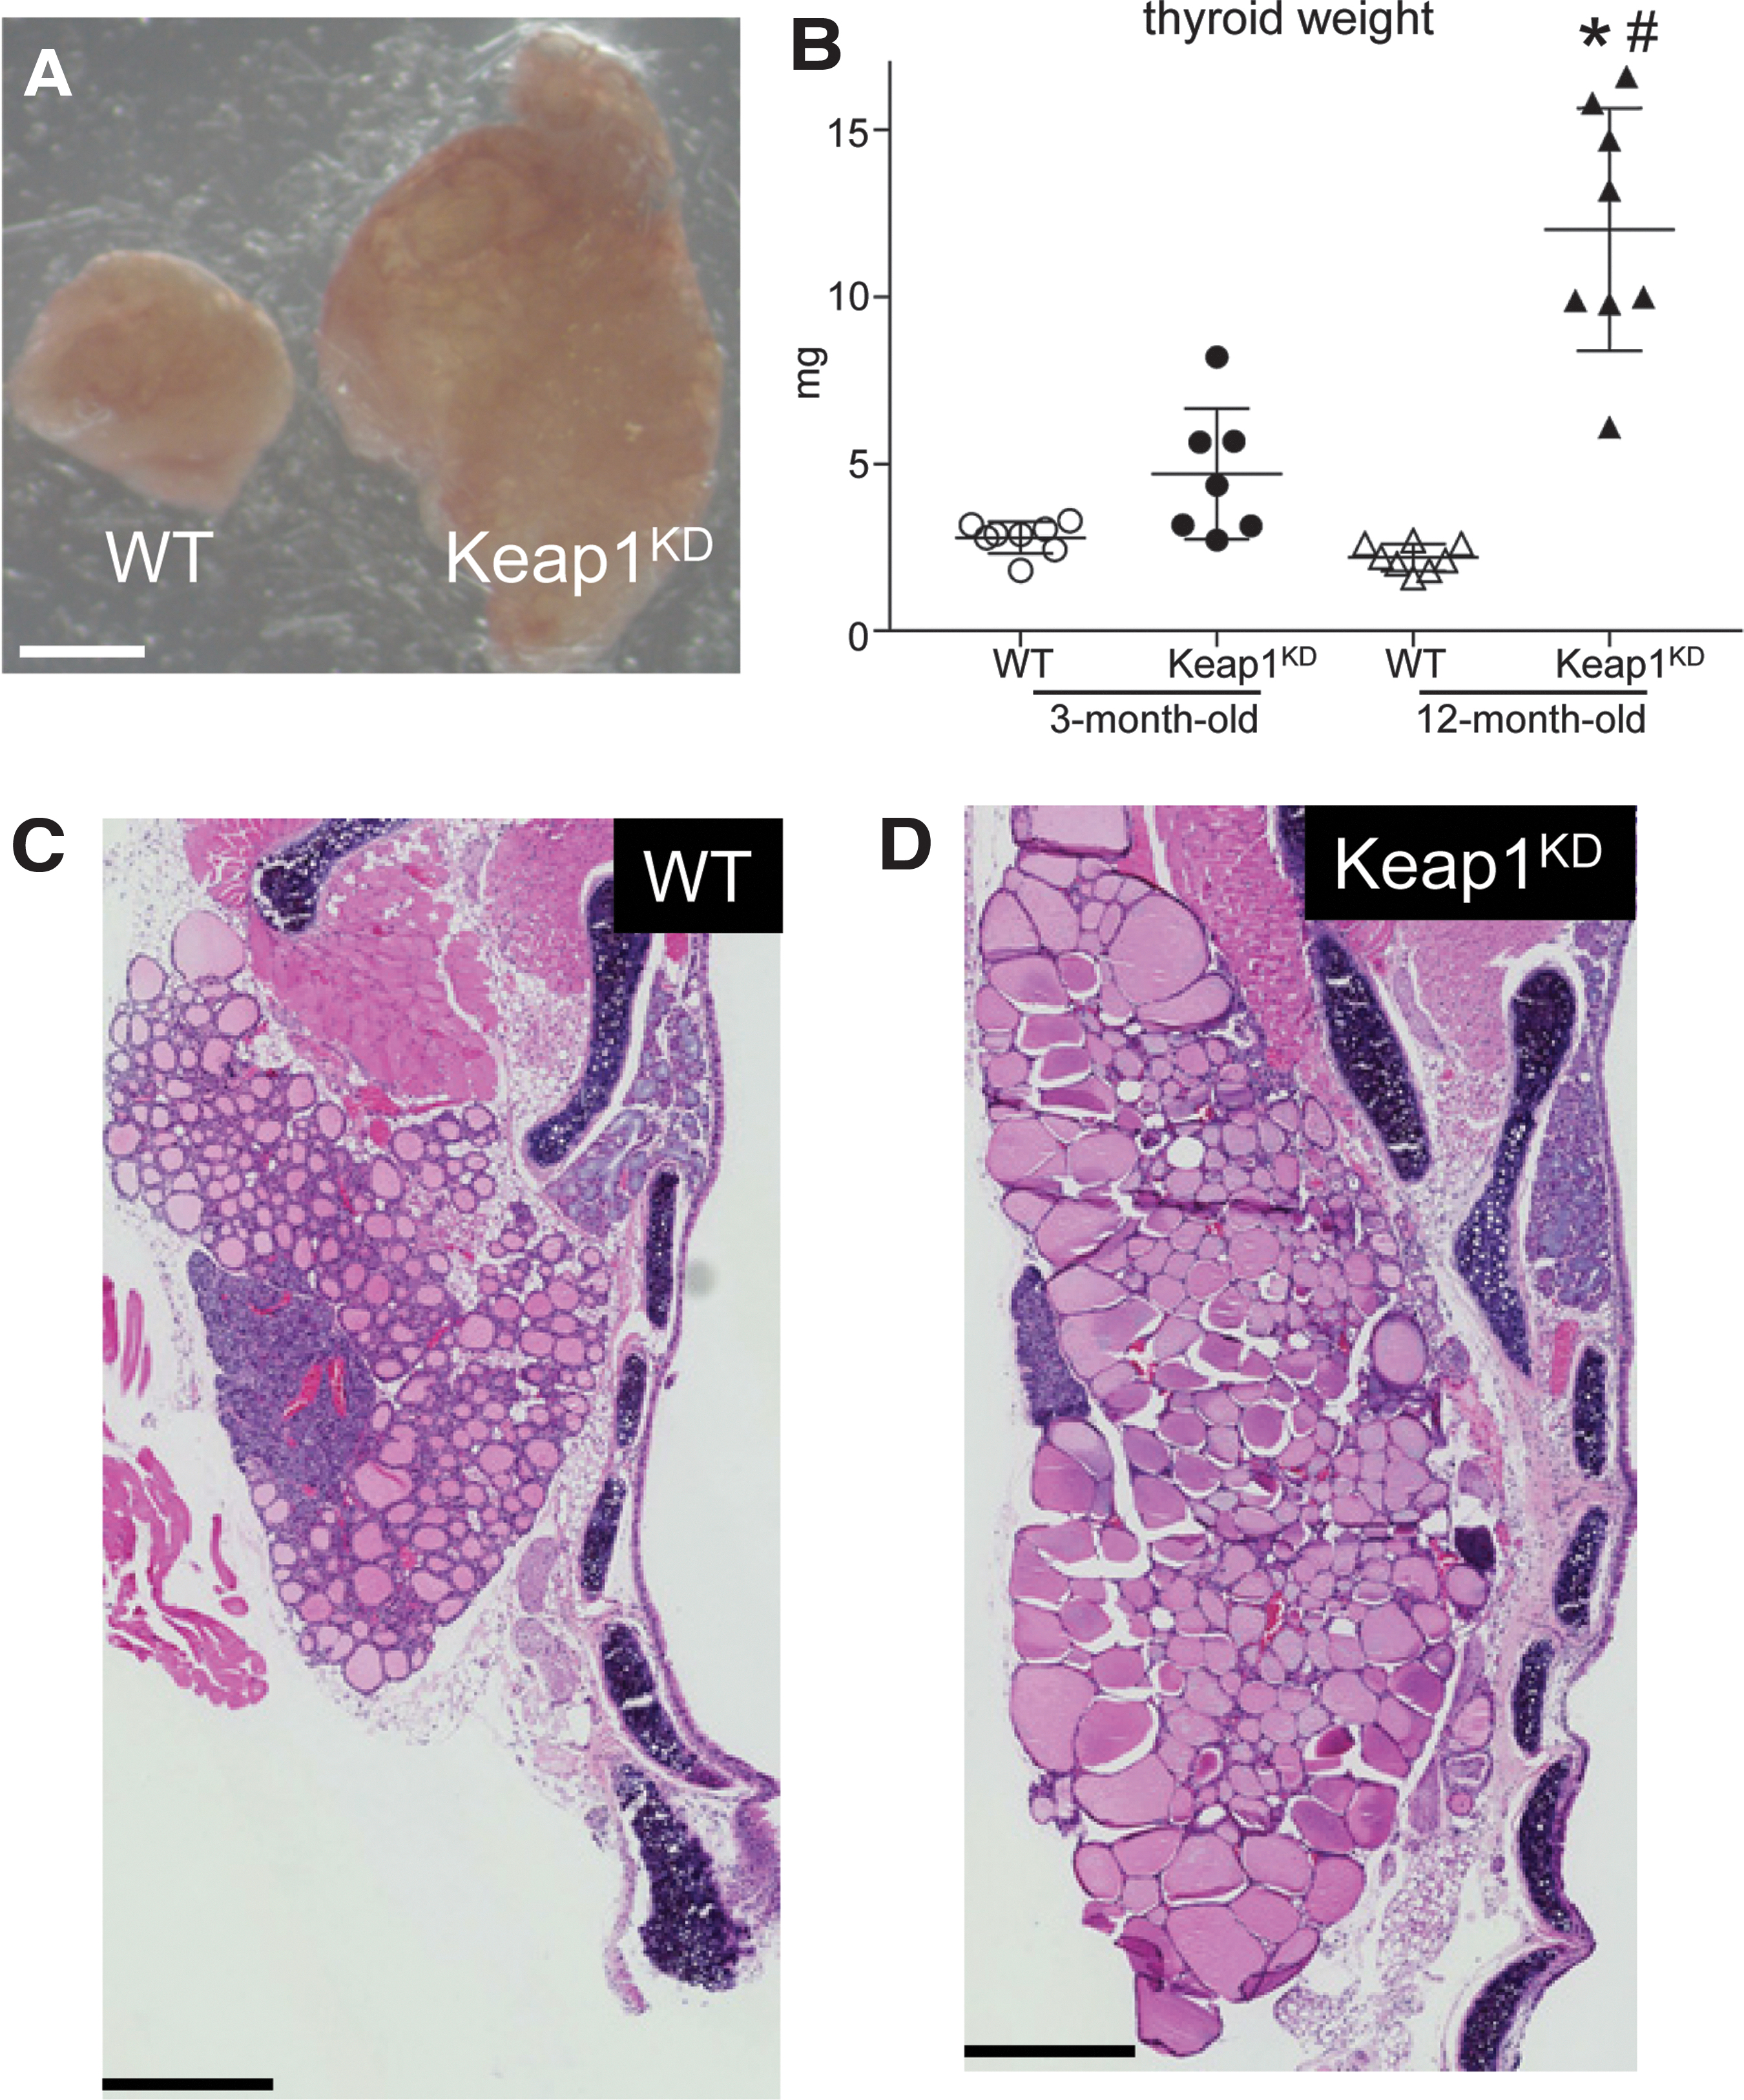
Goiter phenotype in Keap1 hypomorphic (Keap1KD) mice. (
To start characterizing the nature of goiter in Keap1KD mice, formalin-fixed paraffin-embedded thyroids from 12-month-old WT and Keap1KD mice were sectioned and stained with H&E (Fig. 1C, D). Visual inspection of the thyroid lobes in Keap1KD mice showed a markedly increased size of thyroid follicles; this difference specifically concerned the colloid compartment, and it was evident not only at the periphery but also at the center of the lobes (Fig. 1D). Of note, there was no evidence of thyroid nodules or follicular cell hyperplasia, nor were there any detached cells within the colloid of the follicle lumen.
To more systematically evaluate the histological aspects of the goiter phenotype, histomorphometric analysis was performed in H&E-stained thyroid sections of 12-month-old WT and Keap1KD mice (Fig. 2). Consistent with the visual inspection (Fig. 1C, D), Keap1KD mice showed a significantly increased total follicle area (approximately three-fold, p < 0.05) (Fig. 2A) and colloid area (approximately three-fold, p < 0.05) (Fig. 2B) compared with WT mice. In addition, the area of the follicle that was occupied by thyrocytes (Fig. 2C) and the average size of the thyrocytes (Fig. 2E) were also significantly increased in Keap1KD mice compared with WT mice (both p < 0.05). However, and in contrast to the marked increase in the colloid area, these thyrocyte-related parameters were only slightly increased (<50%). Lastly, the total number of thyrocytes per follicle showed no difference between the two genotypes (Fig. 2D). Taken together, these results indicate that Keap1KD mice develop diffuse goiters with an onset in early adult life and progression with age.
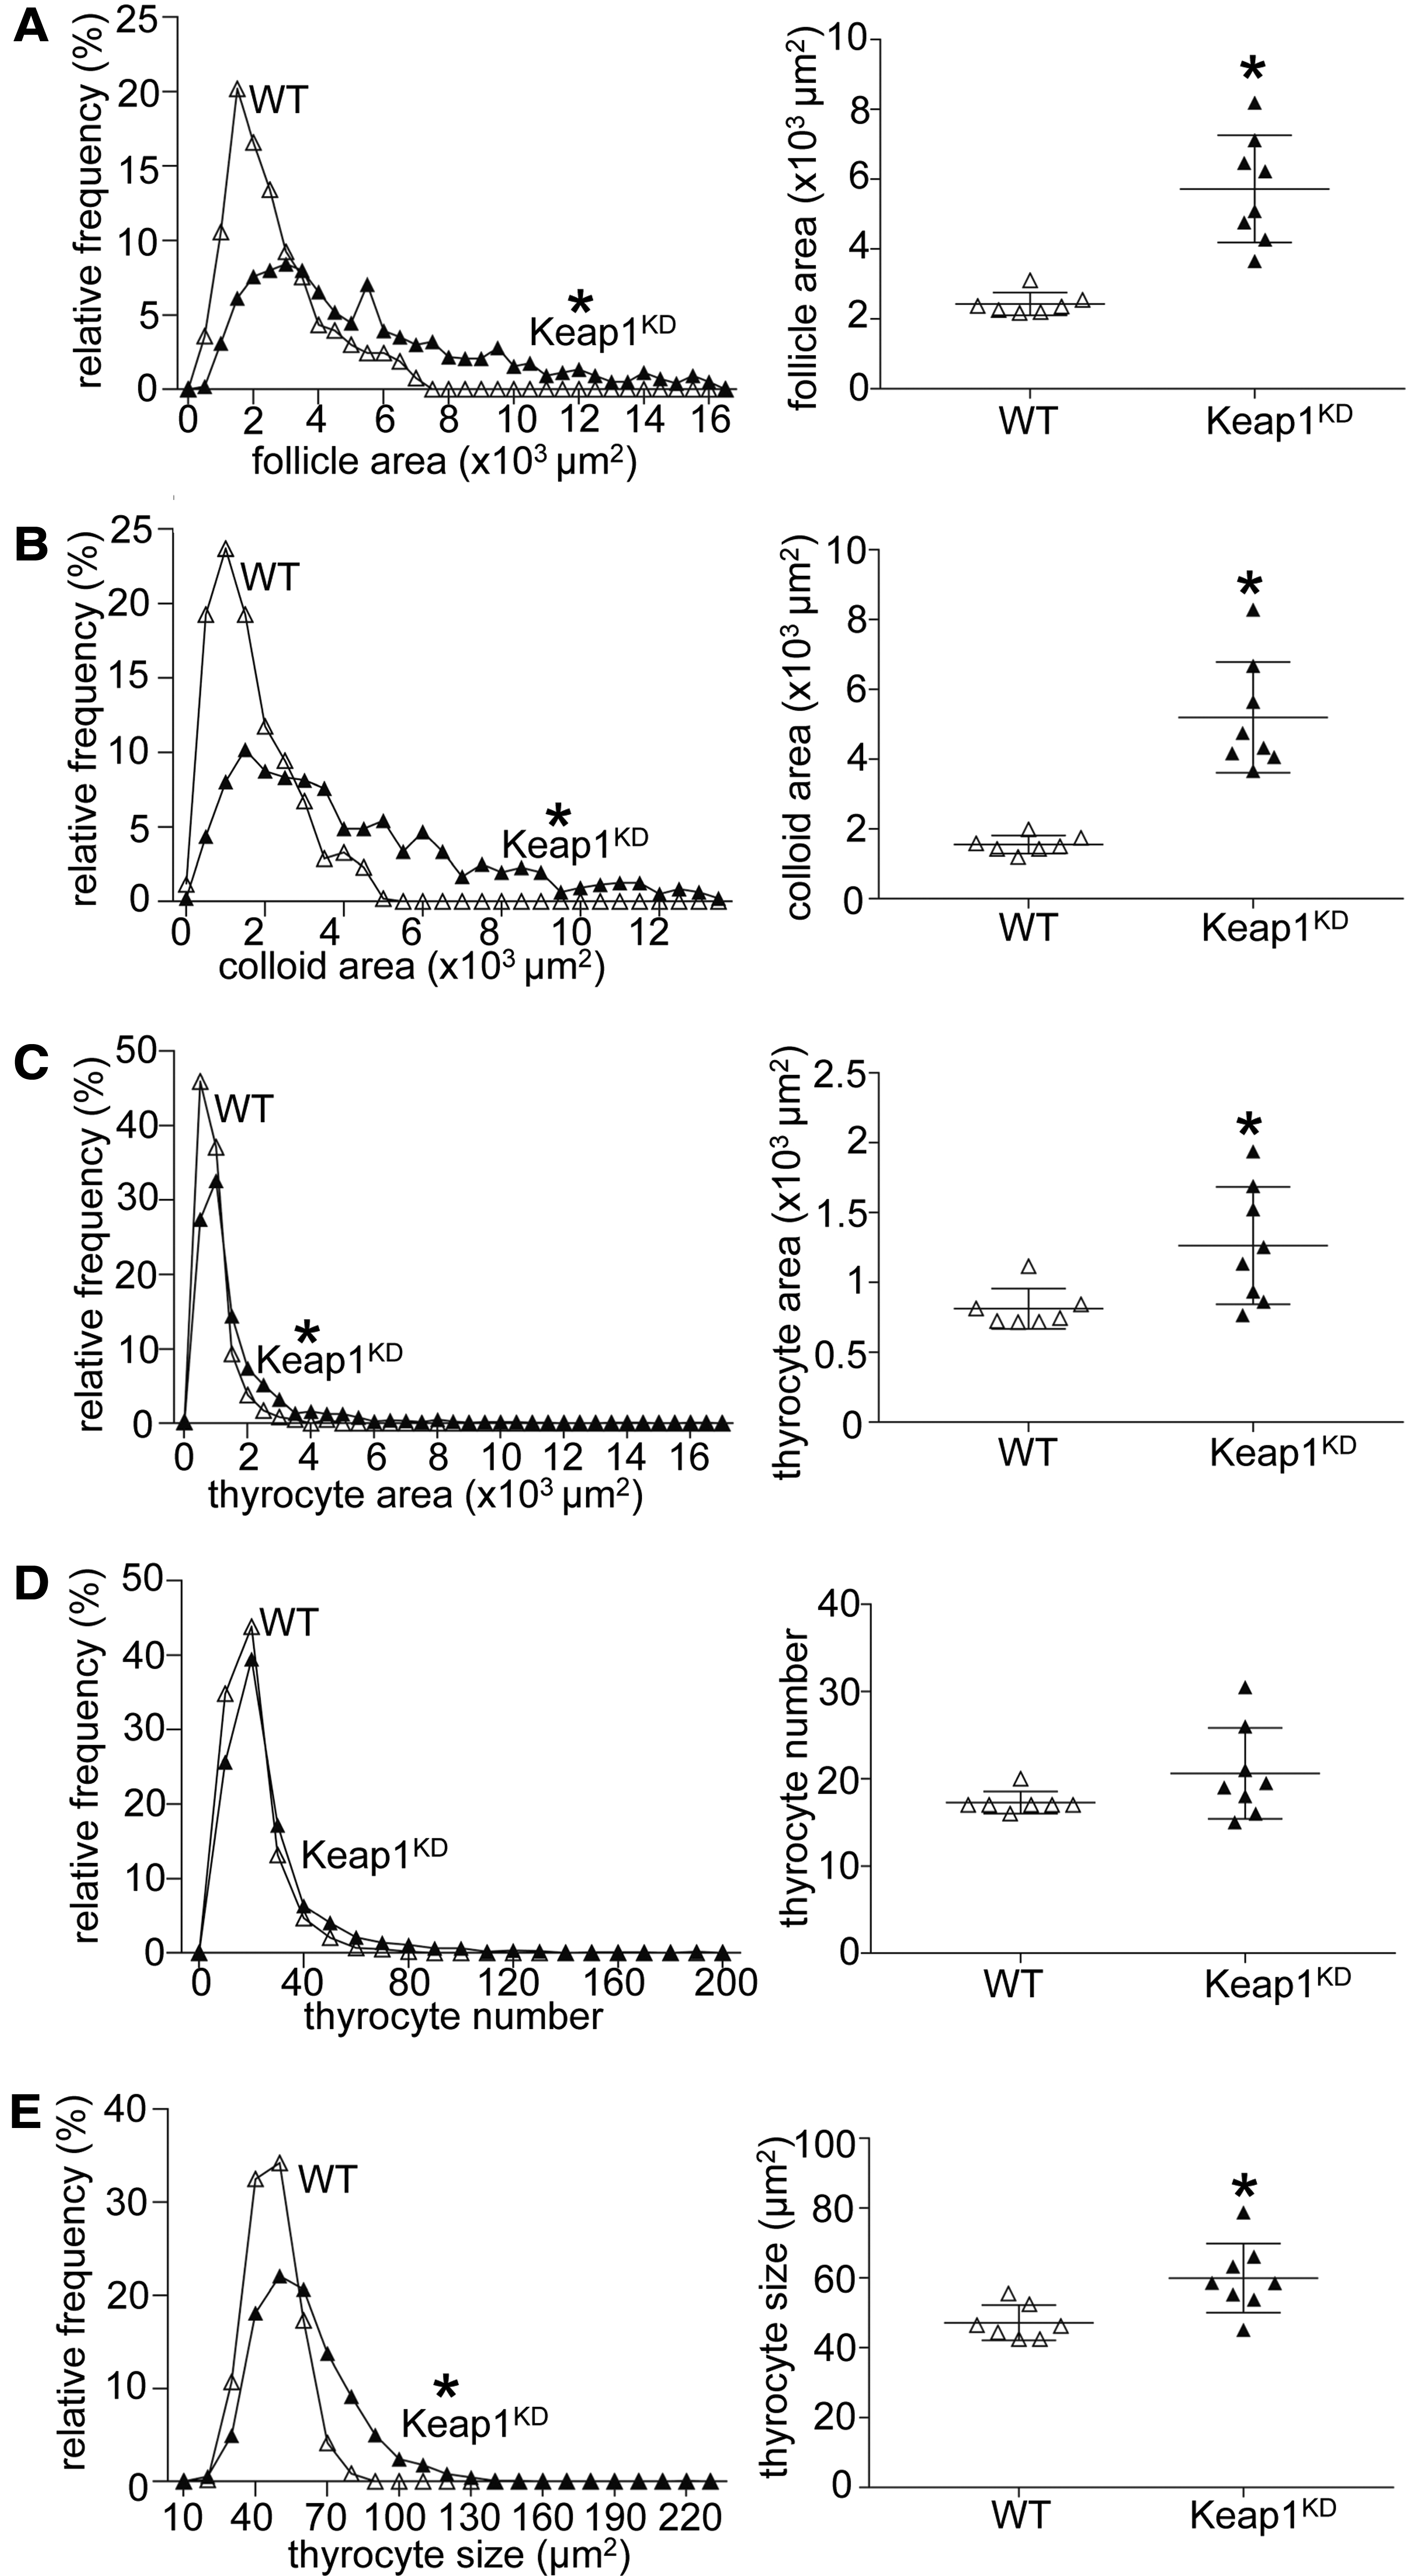
Histomorphometric analysis of thyroid gland sections of 12-month-old male WT and Keap1KD mice showing the whole-follicle area (
Age-dependent increase in TSH levels in Keap1KD mice
To assess the functional correlates of the goiter phenotype, plasma levels of TSH, total T4, and total T3 were measured in 3- and 12-month-old WT and Keap1KD mice (Fig. 3). Analysis of TSH levels by two-way ANOVA showed that the genotype had a significant effect on TSH (p < 0.05), as did the interaction of genotype with age (p < 0.05). The TSH levels were markedly increased (∼10-fold) in 12-month-old Keap1KD mice compared with WT mice of the same age (p < 0.05) (Fig. 3A). Similar to thyroid weight (Fig. 1B), a tendency for higher TSH levels was seen at three months, but it was not statistically significant (Fig. 3A). Post hoc comparisons also confirmed significantly higher TSH levels in Keap1KD mice at age 12 months compared with 3 months (p < 0.05) (Fig. 3A).
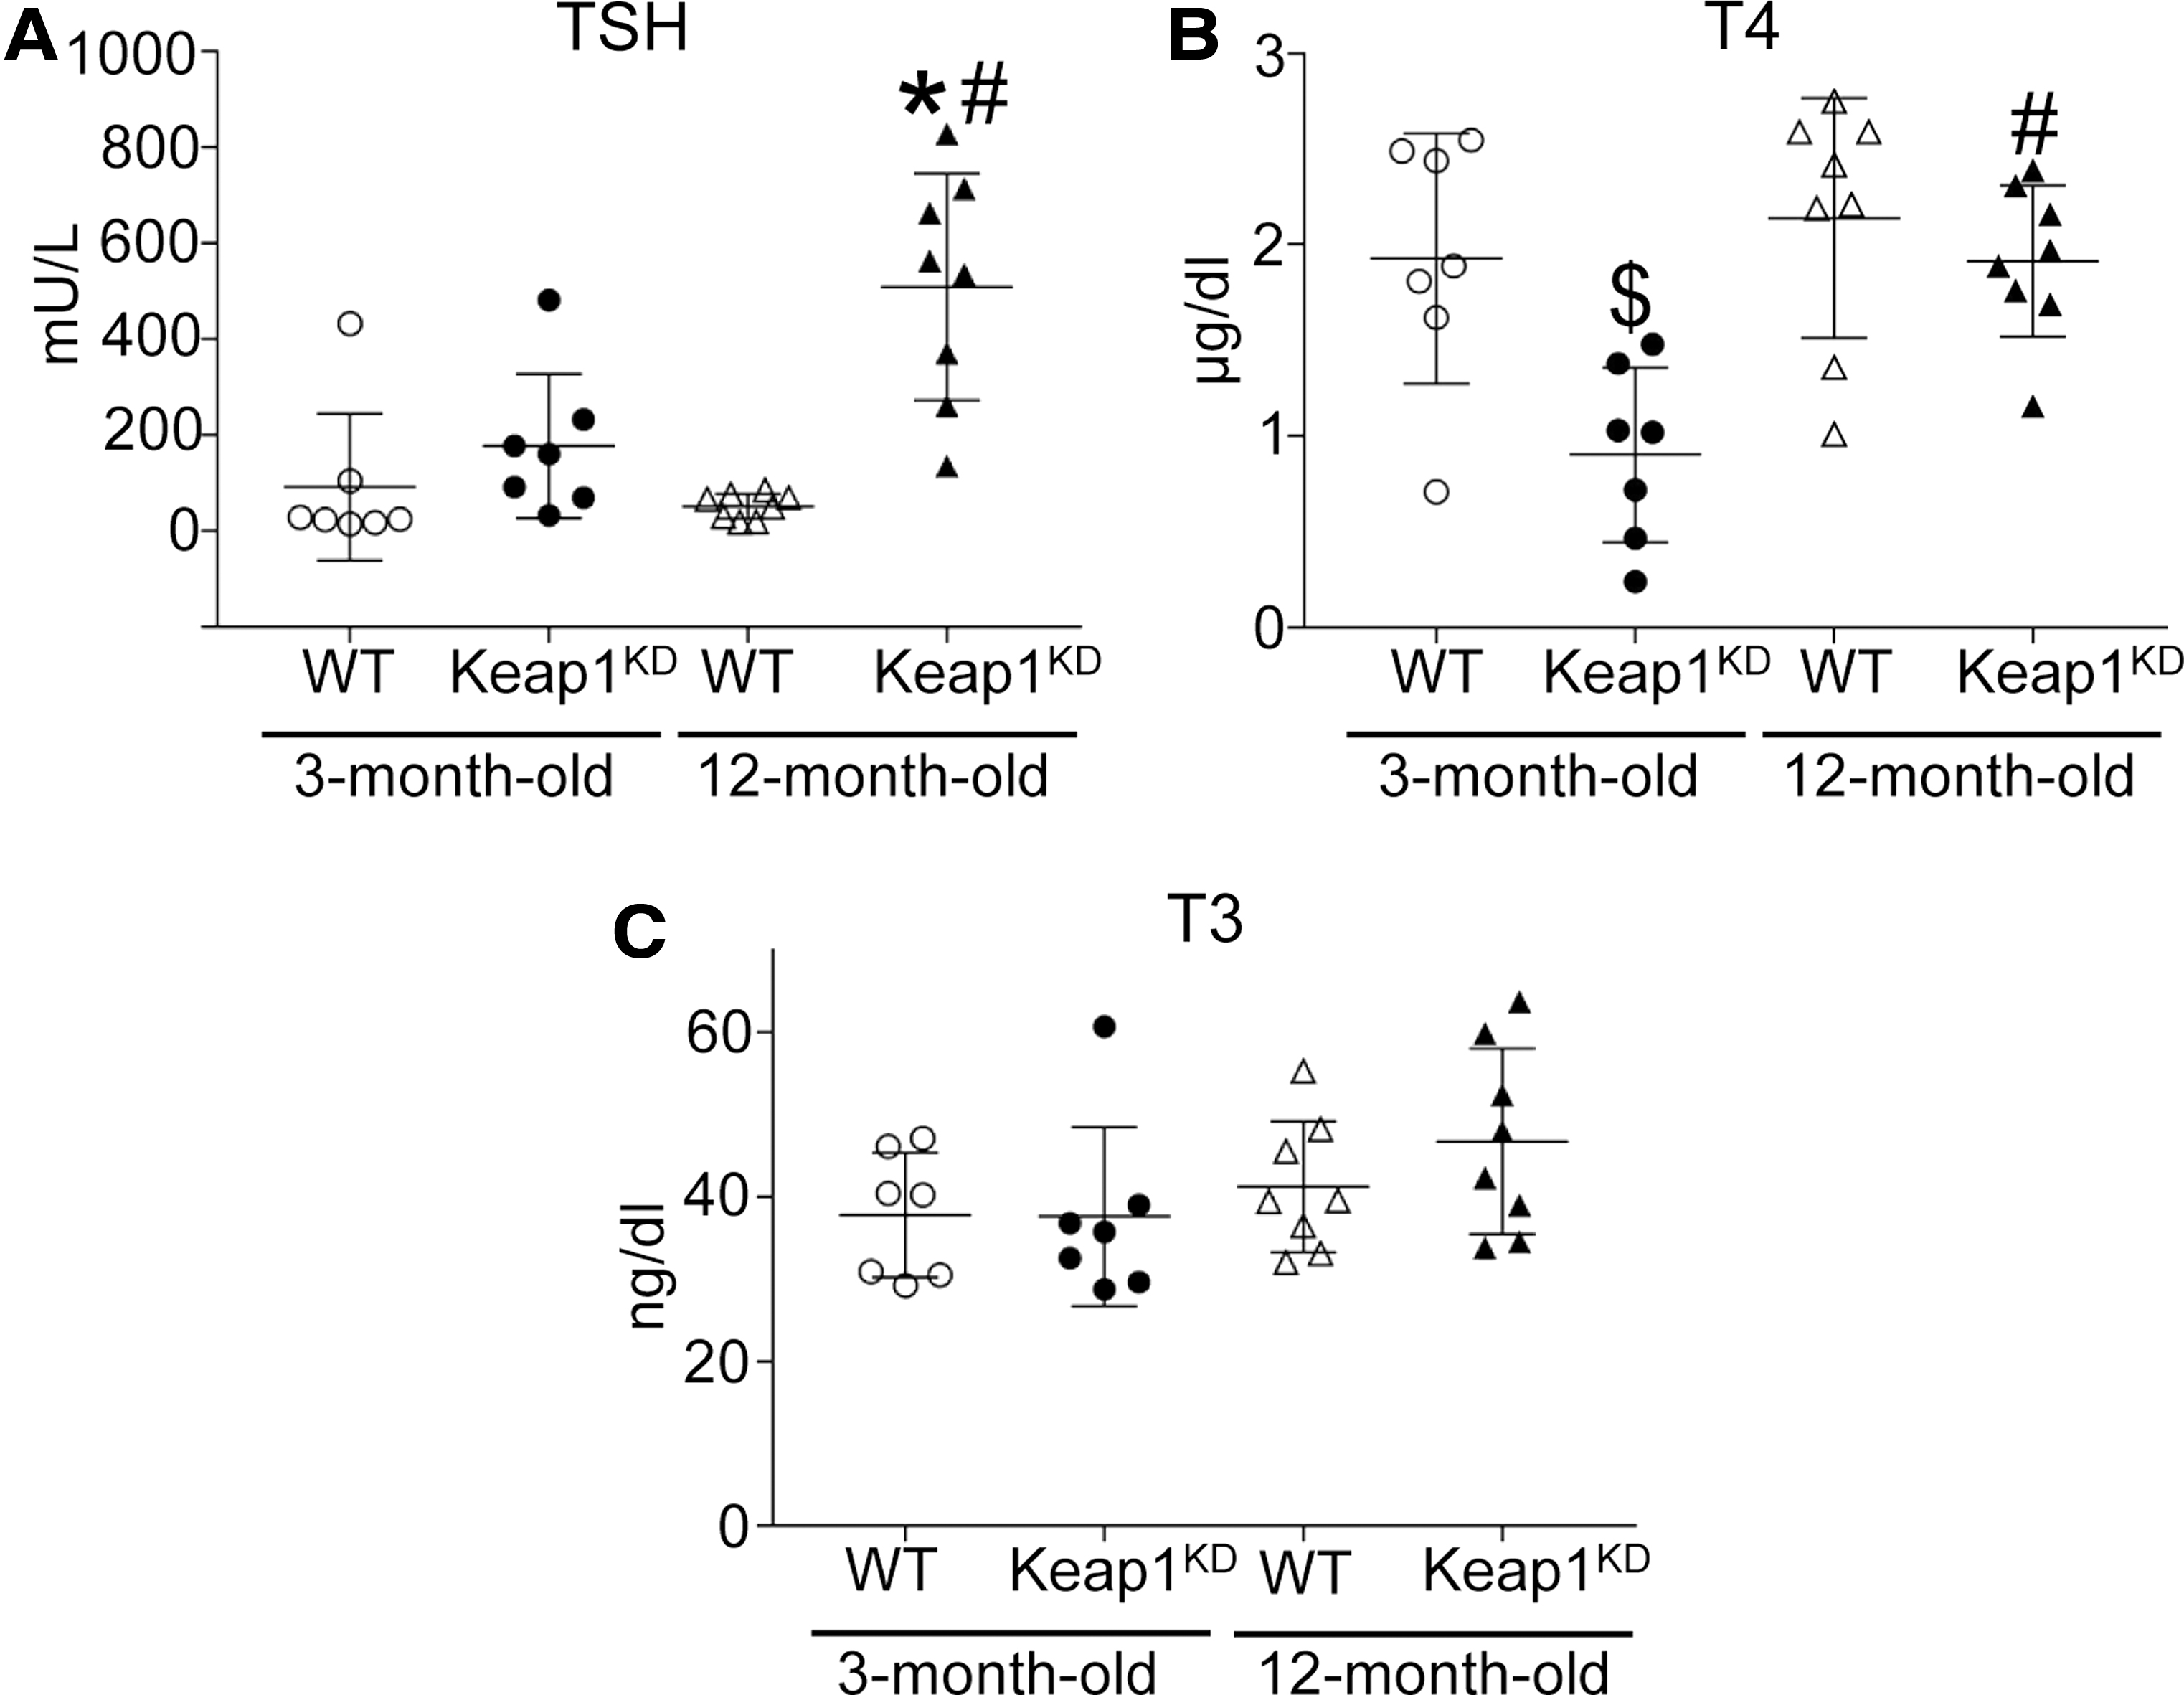
Thyroid function tests. (
Consistent with the increased TSH plasma levels, 12-month-old Keap1KD mice also showed significantly increased messenger RNA (mRNA) expression levels of Tshb (p < 0.05) in the pituitary gland (Supplementary Fig. S1A). Interestingly, significantly increased Tshb mRNA levels were also found in three-month-old Keap1KD mice (p < 0.05) (Supplementary Fig. S1A), which is consistent with the nonsignificant trend observed in TSH plasma levels at age three months (Fig. 3A). For control purposes, growth hormone mRNA (Gh) was measured in the pituitary of WT and Keap1KD mice and showed no difference (Supplementary Fig. S1B). The relative mRNA levels of the Nrf2 target genes Nqo1 and Gpx2 were also assessed. No difference was found in Nqo1 levels at either age (Supplementary Fig. S1C), which is consistent with the fact that in the brain of Keap1KD mice, Nqo1 mRNA expression levels and Nqo1 protein abundance are not increased, in contrast to other tissues, where the levels are increased substantially (20). On the other hand, Gpx2 levels were significantly increased in the pituitary of Keap1KD mice at both ages (both p < 0.05) (Supplementary Fig. S1D).
In terms of thyroid function, total T4 levels were significantly lower in 3-month-old Keap1KD mice compared with 3-month-old WT mice and 12-month-old Keap1KD mice (both p < 0.05), whereas they were not significantly different between WT and Keap1KD mice at age 12 months (Fig. 3B). T3 levels were similar among all groups (Fig. 3C). Data regarding hormonal and morphometric measures of Keap1KD and respective WT mice are summarized schematically in Supplementary Table S2. Taken together, these results suggest that Keap1KD mice show decreased T4 levels in early adult life that are eventually well compensated over time by increased TSH levels.
Decreased Tg levels despite Nrf2 activation in the thyroid of Keap1KD mice
Consistent with the fact that Keap1 is the main negative regulator of Nrf2, Keap1KD mice are known to display moderately increased Nrf2 activity in other tissues (20). To examine whether this is also true for the thyroid, we analyzed the expression of three genes that we have previously shown to be regulated by Nrf2 in the thyroid by real-time reverse transcription polymerase chain reaction (13). Thyroidal mRNA expression levels of Nqo1, Gpx2, and Txnrd1 were significantly increased in both 3-month-old (approximately eight-fold, approximately three-fold, and approximately three-fold, respectively; all p < 0.05) and 12-month-old Keap1KD mice (approximately six-fold, approximately three-fold, and approximately two-fold, respectively; all p < 0.05) compared with WT mice of the same age (Fig. 4A, C, D). The induction of the prototypical Nrf2 target gene Nqo1 was also confirmed at the protein level, as the abundance in the thyroid was found to be significantly increased in both 3-month-old Keap1KD mice (∼10-fold) and 12-month-old Keap1KD mice (∼5-fold) compared with WT mice (Fig. 4B). Data regarding mRNA expression levels or protein abundance of Nrf2 targets and various thyroid-specific genes in Keap1KD and respective WT mice are summarized schematically in Supplementary Table S3.
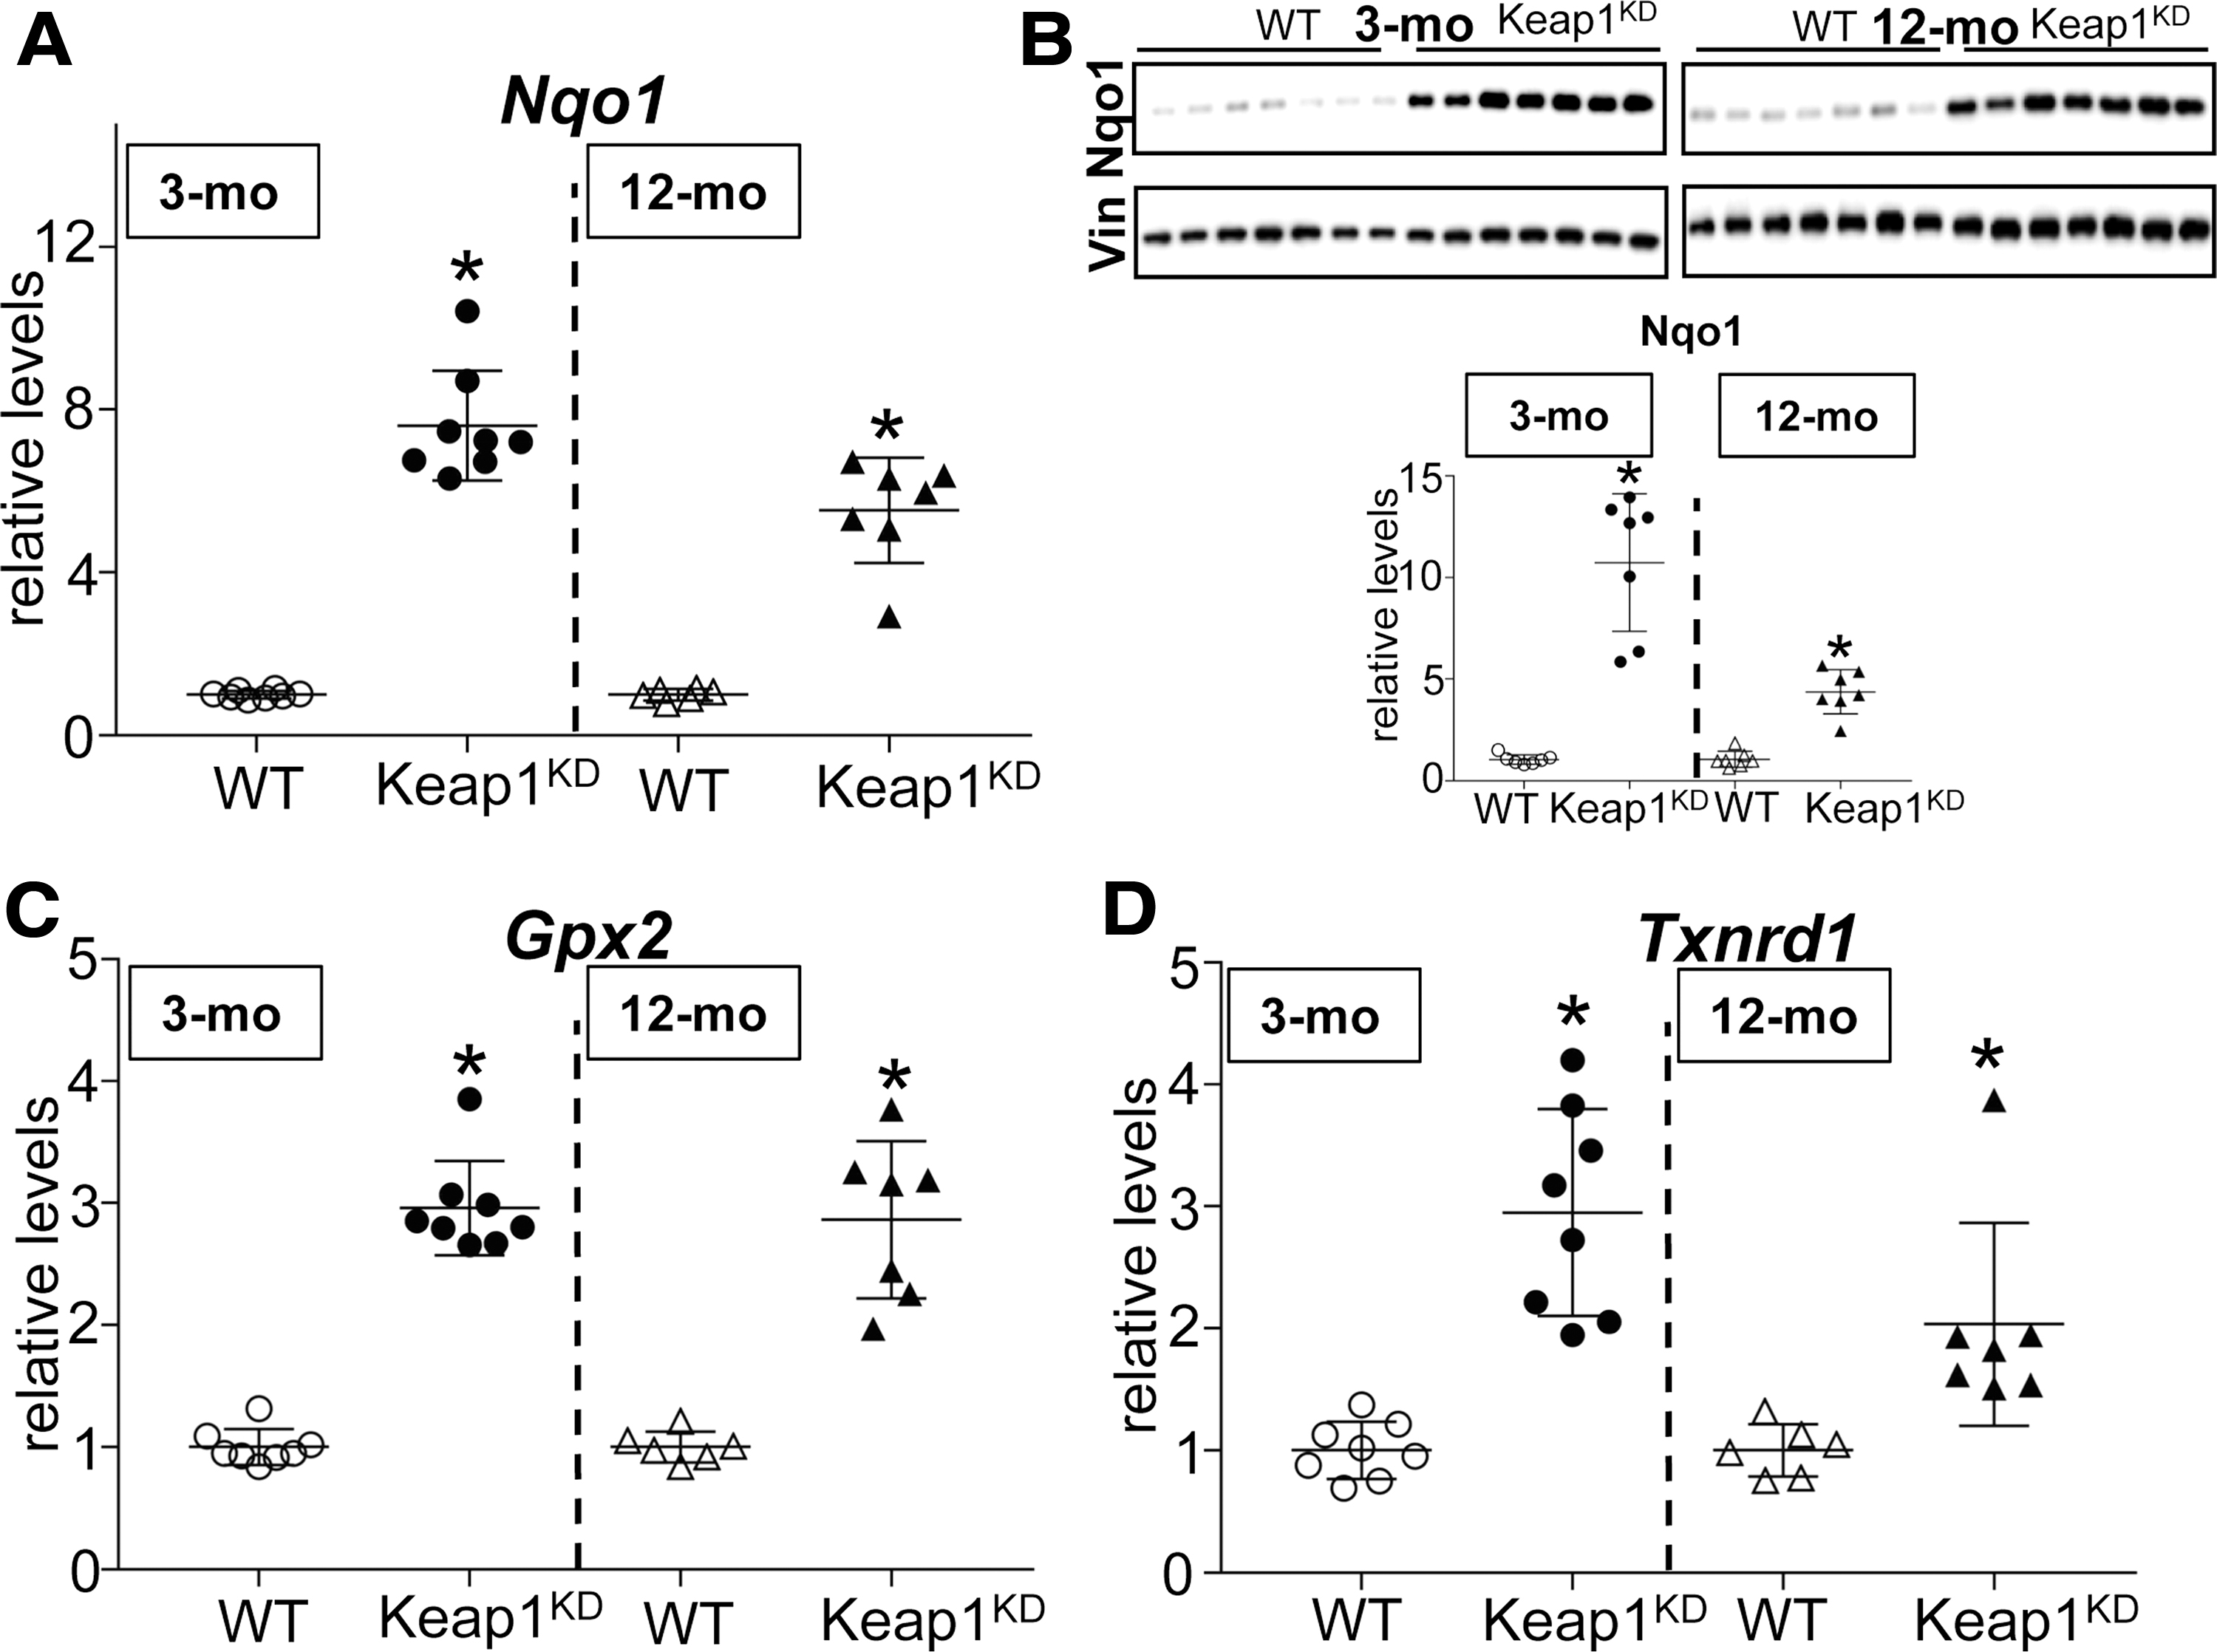
Relative gene expression and protein abundance of Nrf2 target genes in thyroids of 3-mo and 12-mo WT and Keap1KD male mice. (
We have previously shown that Nrf2 positively regulates the transcription of the Tg gene and thereby the mRNA levels and protein abundance of Tg in cultured thyroid follicular cells and in the mouse thyroid (13). Therefore, in view of the enlarged thyroid follicles in Keap1KD mice (Figs. 1D and 2A), we expected that the mRNA and protein levels of Tg would be higher in these animals. Surprisingly, we found that Tg mRNA levels were significantly lower in Keap1KD mice at both 3 and 12 months of age compared with respective WT mice (both p < 0.05) (Fig. 5A). This difference was also present at the Tg protein level, as assessed by Coomassie blue staining of protein extracts from individual mouse thyroids at 3 and 12 months of age (Fig. 6A, B), and confirmed by Tg immunoblots (Fig. 6C, D).
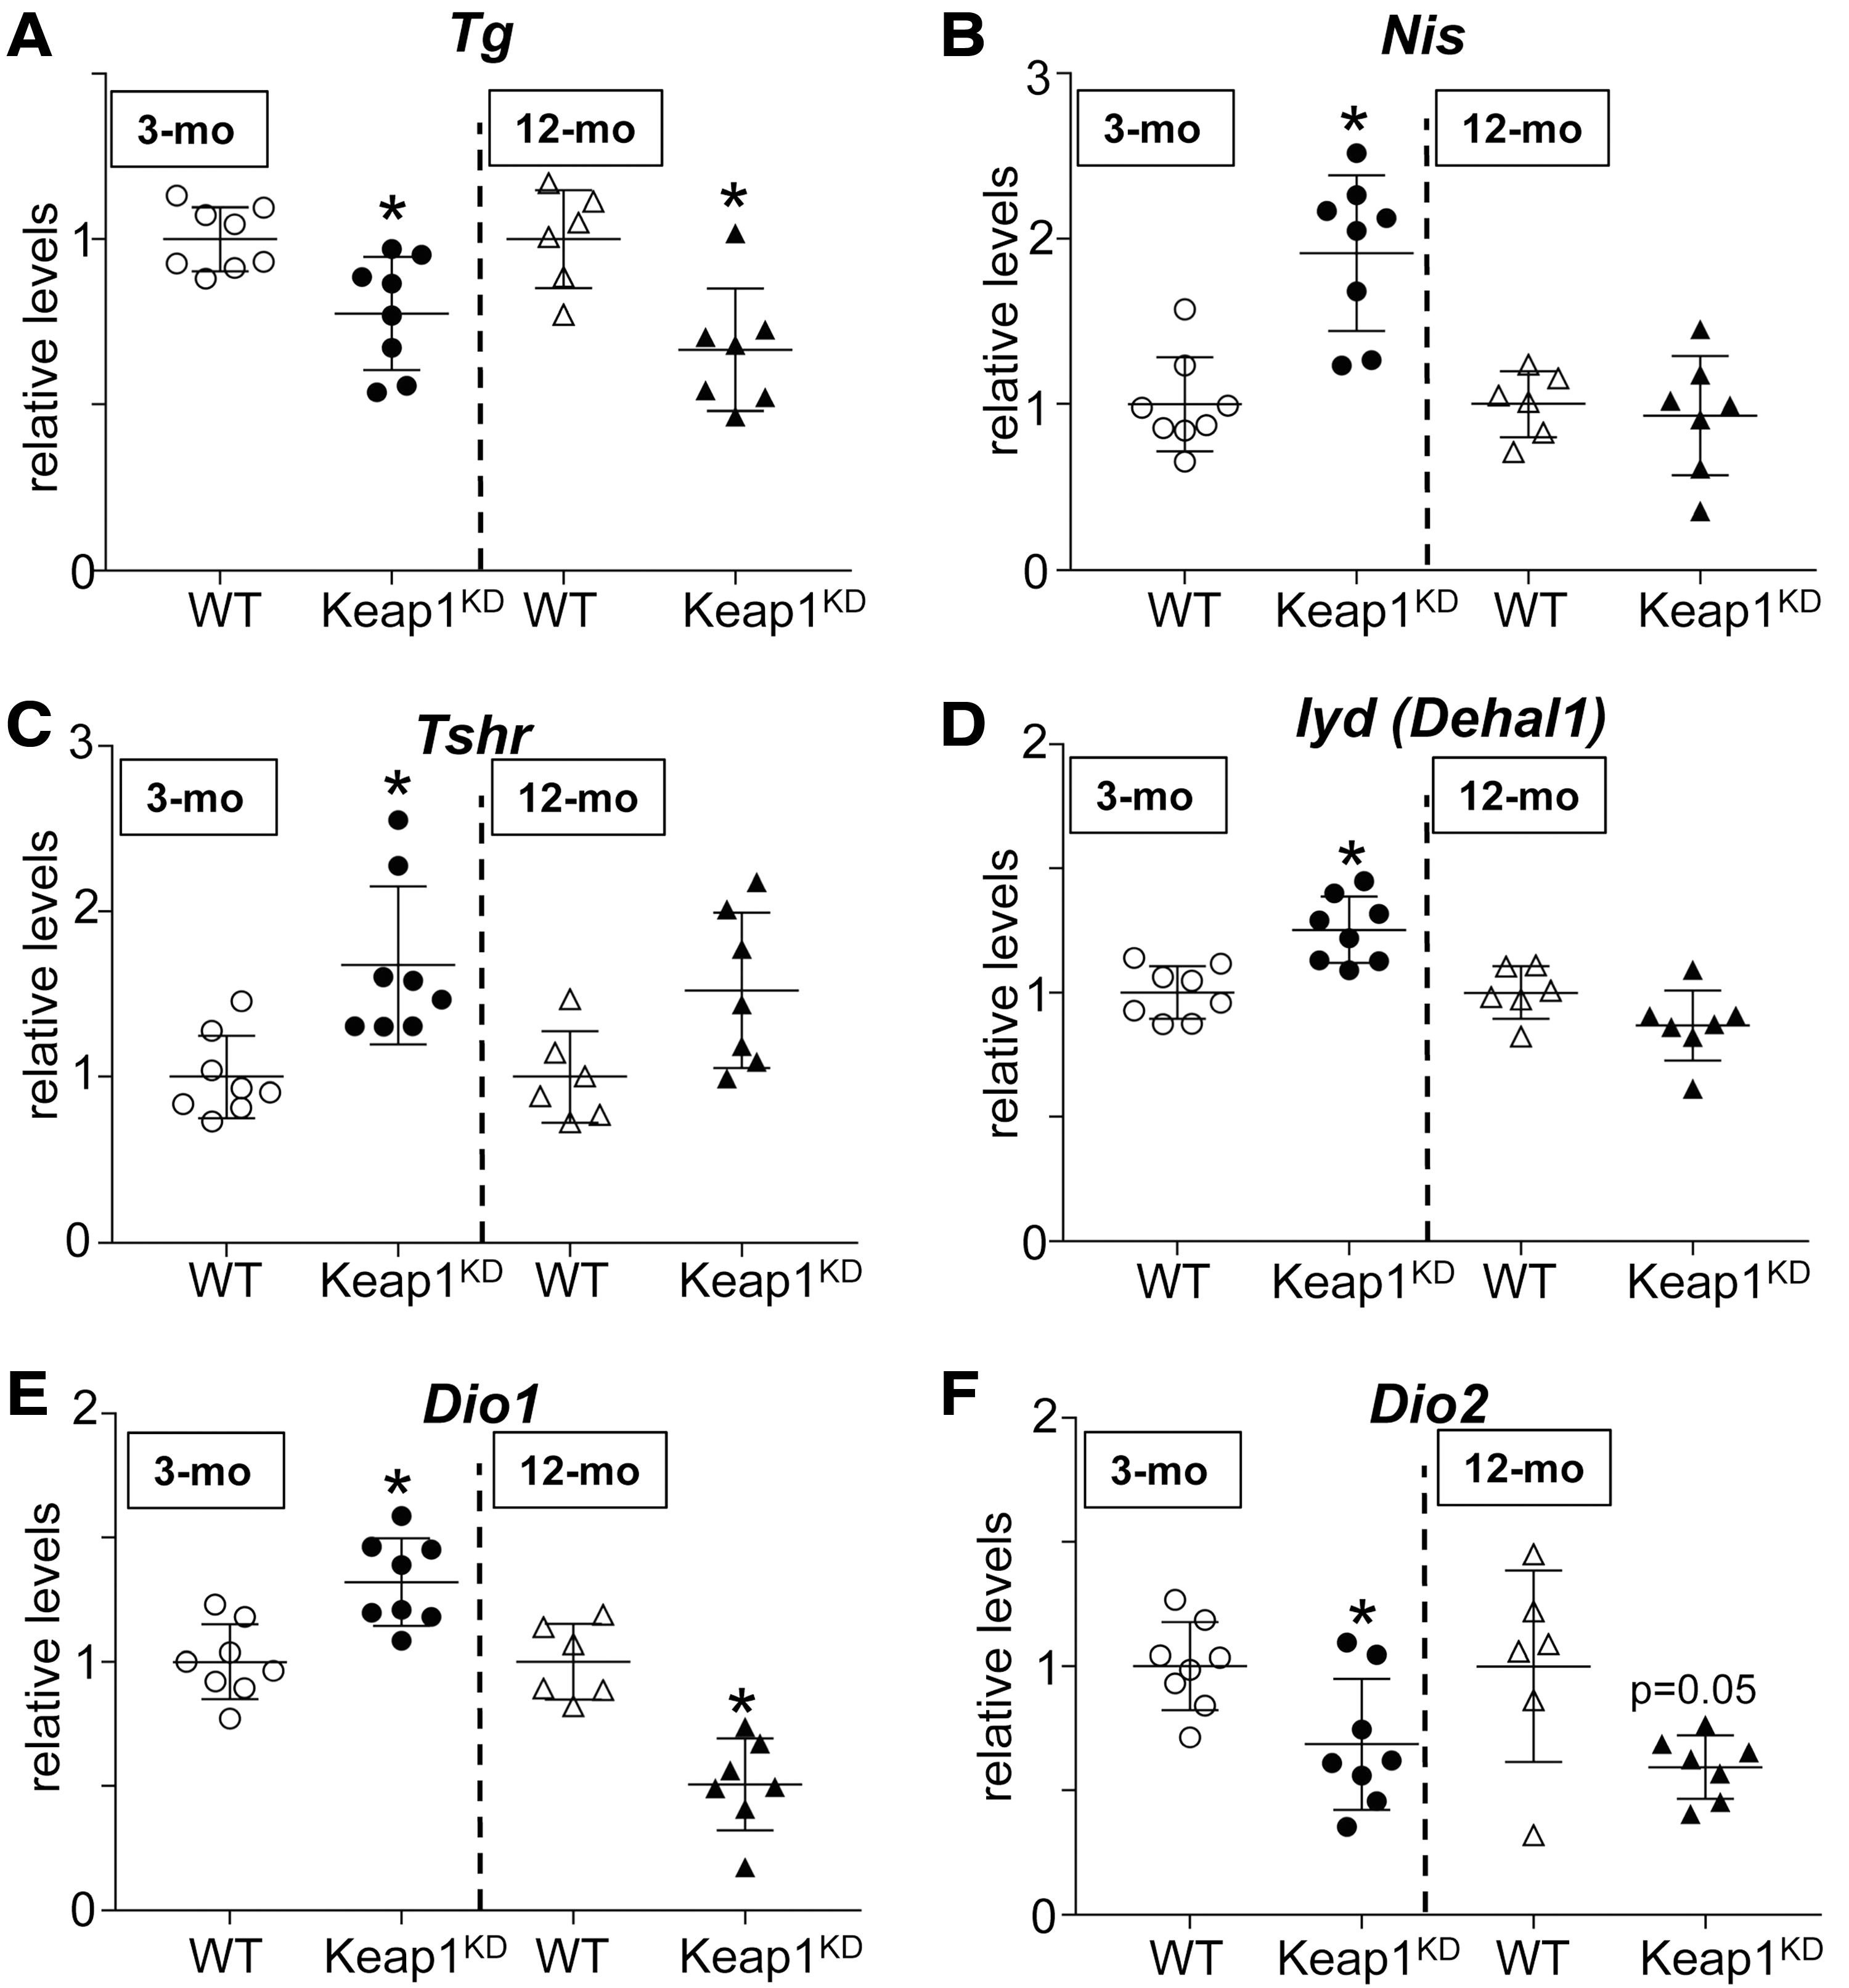
Relative gene expression levels in thyroids of 3-mo and 12-mo WT and Keap1KD male mice. (
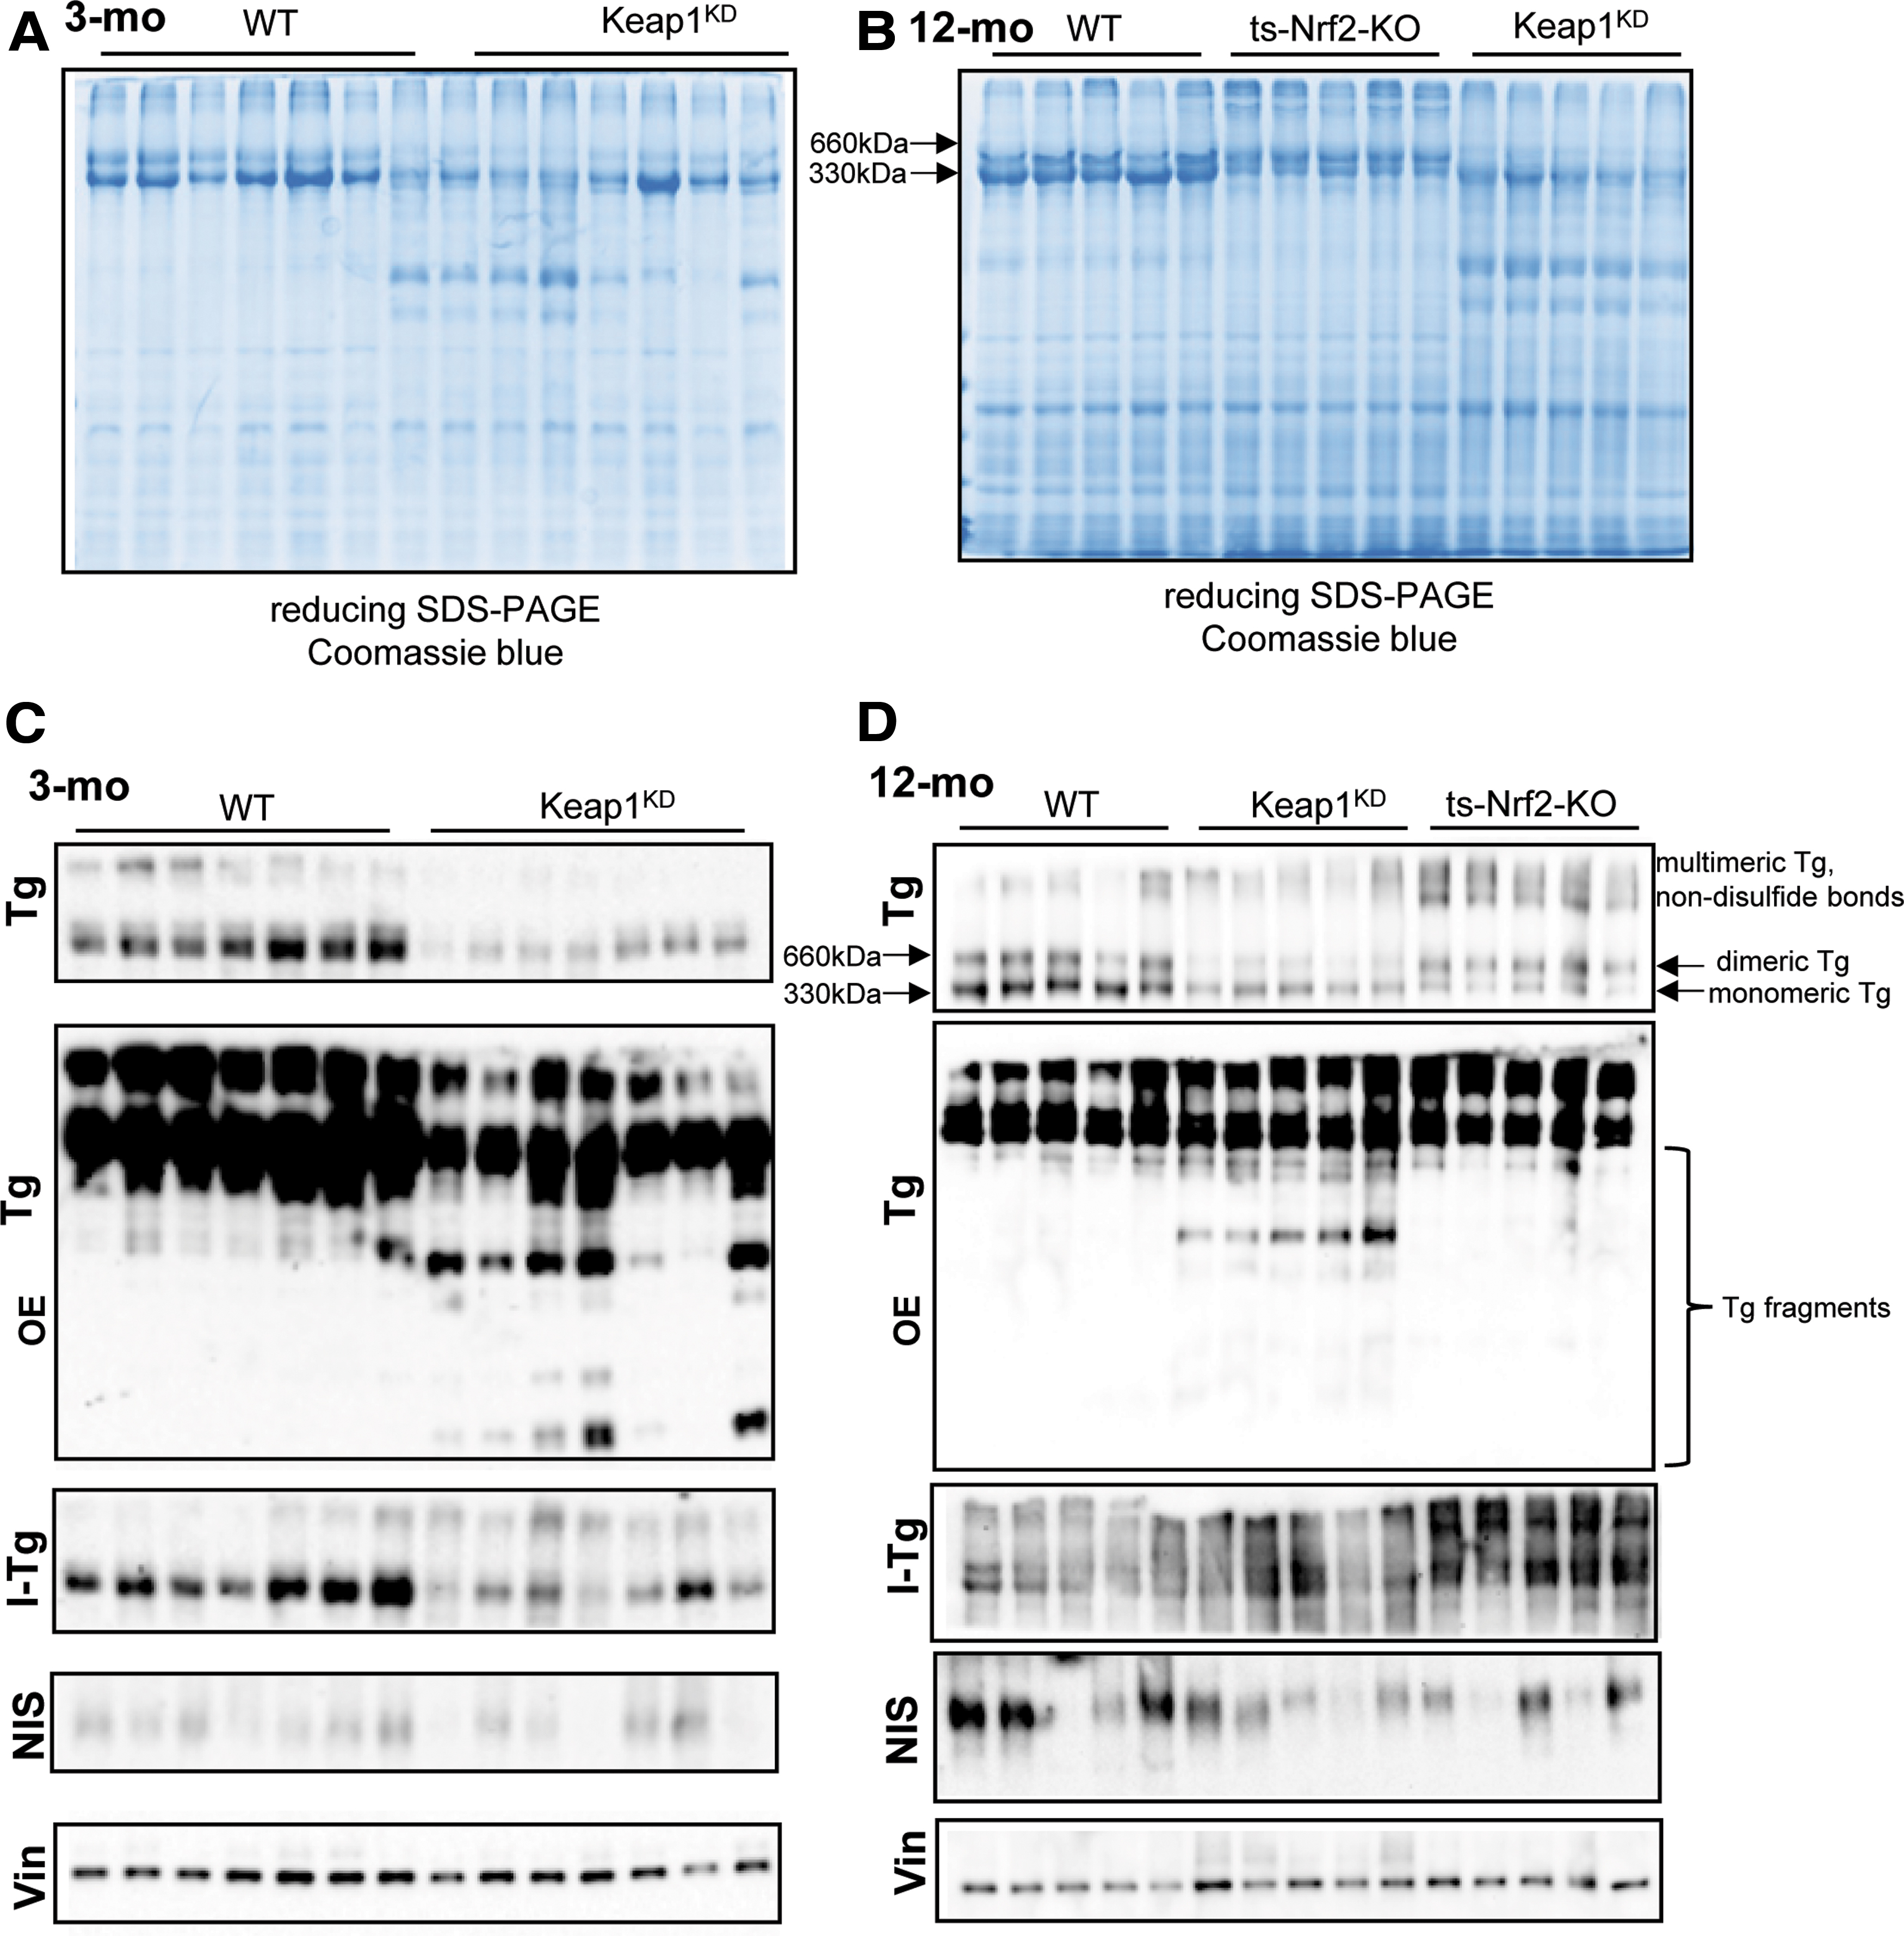
Tg, I-Tg and NIS protein levels in 3-mo and 12-mo WT and Keap1KD male mice. (
Quantification of the expression of thyroid hormone synthesis and metabolism factors in Keap1KD mice
Before investigating the reasons for the decreased Tg levels in more detail, and to better characterize the hormonal phenotype of Keap1KD mice, we first analyzed the mRNA expression levels and/or the protein abundance of various additional factors involved in thyroid hormone synthesis or metabolism. These data are shown in Figures 5 and 6, and Supplementary Figures S2–S4 and are summarized schematically in Supplementary Table S3. Consistent with the decreased total T4 plasma levels specifically in 3-month-old Keap1KD mice compared with 3-month-old WT mice and with 12-month-old Keap1KD mice (Fig. 3B), the thyroidal abundance of iodinated Tg was clearly reduced in the thyroids of 3-month-old Keap1KD mice compared with 3-month-old WT mice (Fig. 6C), whereas such differences were not observed in 12-month-old mice (Figs. 3B and 6D). Another factor that might account, at least in part, for the lower total plasma T4 levels in 3-month old Keap1KD mice (Fig. 3B) is the observation that the mRNA expression levels of deiodinase 1 (Dio1) were significantly lower (by ∼50%, p < 0.05) in the liver of 12-month-old Keap1KD mice but not in the liver of 3-month-old Keap1KD mice, compared with respective WT mice (Supplementary Fig. S2A). On the other hand, the liver expression levels of Nqo1 mRNA were significantly increased in both 3- and 12-month-old Keap1KD mice compared with respective WT mice (approximately three-fold and approximately four-fold, respectively; both p < 0.05) (Supplementary Fig. S2B), indicating that Nrf2 is consistently activated in these mice, a fact that has been previously established (20).
Other notable differences observed between the genotypes specifically at the age of 3 months and not at the age of 12 months concern the mRNA expression levels of Nis and Tshr, both of which were significantly higher (approximately two-fold; both p < 0.05) in 3-month-old Keap1KD mice compared with WT mice (Fig. 5B, C), with a nonsignificant tendency observed only for Tshr in 12-month-old mice (Fig. 5C). At the protein level, there were no clear differences in NIS abundance between the two genotypes at either age (Fig. 6C, D). Finally, the thyroidal mRNA levels of the iodine-recycling enzyme iodotyrosine dehalogenase 1 (Iyd, formerly known as Dehal1) also showed a significant yet very mild increase in 3-month-old Keap1KD mice but not in 12-month-old mice, compared with respective WT mice (Fig. 5D). The observed mild differences in Nis, Tshr, and Iyd mRNA levels between the two genotypes only in 3-month-old mice may represent secondary adaptations to the decreased T4 levels that are well compensated by age 12 months.
The thyroidal mRNA expression levels of Dio1 and Dio2 were significantly but mildly increased (by ∼30%) and decreased (by ∼30%), respectively, in three-month-old Keap1KD mice compared with three-month-old WT mice (both p < 0.05) (Fig. 5E, F). In 12-month-old Keap1KD mice, thyroidal mRNA expression levels of both Dio1 and Dio2 were significantly and moderately decreased (both by ∼50%) compared with 12-month-old WT mice (p < 0.05 for Dio1, p = 0.05 for Dio2) (Fig. 5E, F). Of note, even though Dio2 mRNA levels were reduced at both ages in Keap1KD mice, this gene is expressed only in low amounts in the mouse thyroid. Regarding the mRNA levels of the various thyroidal oxidases, significant differences were observed only for Duoxa2 and Tpo, both of which were moderately decreased (by ∼50%) in 12-month-old Keap1KD mice compared with 12-month-old WT mice (both p < 0.05) (Supplementary Fig. S3D, E). No differences were observed between the two genotypes in Duoxa2 and Tpo mRNA expression levels in three-month-old mice (Supplementary Fig. S3D, E) or in Duox1, Duoxa1, and Duox2 mRNA expression levels at either age (Supplementary Fig. S3A–C).
Finally, we quantified the mRNA expression levels and protein abundance of the three transcription factors that regulate thyroid follicular cell differentiation, that is, Pax8, Ttf1 (Nkx2.1), and FoxE1. Some significant differences were observed, but they were all quite mild (Supplementary Fig. S4). Specifically, Pax8 showed a significant but mild decrease in mRNA expression levels only in 3-month-old Keap1KD mice (p < 0.05) (Supplementary Fig. S4A) and in protein abundance only in 12-month-old Keap1KD mice (p < 0.05), compared with respective WT mice (Supplementary Fig. S4B). Ttf1 showed no differences in either mRNA expression levels or protein abundance between the two genotypes at either age (Supplementary Fig. S4C, D). Lastly, FoxE1 showed a mild decrease in Keap1KD mice of both age groups (Supplementary Fig. S4E), but only a nonsignificant trend for decrease in its protein levels (Supplementary Fig. S4F). Taking into consideration also the morphology (Figs. 1 and 2), hormonal profile (Fig. 3), and general thyroidal gene expression pattern of Keap1KD mice (Figs. 5 and 6, and Supplementary Figs. S3 and S4), we conclude that the differentiated thyroid follicular phenotype is well preserved in these mice.
Differential expression of cathepsins in the thyroids of Keap1KD mice
Interestingly, the Coomassie blue-stained gels and the Tg immunoblots showed the presence or increased intensity in Keap1KD mice of several immunoreactive proteins with molecular weights lower than that of monomeric Tg (i.e., <330 kDa), presumably representing Tg fragments and isoforms; these differences were detectable at both 3 and 12 months of age (Fig. 6A–D and Supplementary Table S3). This observation prompted us to examine the expression of cathepsins, a family of proteases that are known to participate in the processing of Tg, thereby facilitating its solubilization from multimeric storage forms (cathepsins B and L) and the liberation of T4 and T3 (cathepsins K, L, and S), but also in its ultimate degradation (cathepsins B, D, and L) (29 –34). Because cathepsins are enzymes, we focused primarily on evaluating by immunoblot the protein amounts of the faster migrating, mature, presumably active forms (produced auto-catalytically or by legumain-mediated proteolytic cleavage of the proforms); the slower migrating proforms were also quantified wherever possible, as were the respective thyroidal mRNA levels. Data regarding the protein abundance and the mRNA expression levels of the various cathepsins are shown in Supplementary Figures S5 and S6, respectively, and they are summarized schematically in Supplementary Table S4.
The mature form of the cysteine protease cathepsin B showed no difference in 3-month-old Keap1KD mice, but it was slightly decreased in 12-month-old Keap1KD mice (p < 0.05) (Supplementary Fig. S5A, B). The aspartyl protease cathepsin D mostly acts in lysosomal, exhaustive Tg degradation; its active forms comprise a heavy chain of ∼34 kDa and a light chain of about 14 kDa. The protein abundance of the light chain was substantially (∼3.5-fold) and significantly increased in Keap1KD mice of both ages compared with respective WT mice (both p < 0.05) (Supplementary Fig. S5C, D). The mature form of the cysteine protease cathepsin L, involved in Tg solubilization and T4 liberation, was found to be substantially (approximately five-fold) and significantly increased in 3-month-old Keap1KD mice compared with WT mice (p < 0.05), with no difference observed in 12-month-old mice (Supplementary Fig. S5E, F). The protein abundance of the mature band of the T4-liberating cysteine protease cathepsin S, the closest relative of cathepsin L, was increased by ∼50% in 12-month-old Keap1KD mice (p < 0.05) compared with WT mice, and it showed a similar but nonsignificant trend in 3-month-old Keap1KD mice (Supplementary Fig. S5G, H). The protein abundance of mature cathepsin K, which is involved in direct liberation of T4 from Tg (35), and is functionally redundant with cathepsin L (32), was similar between WT and Keap1KD mice at both ages (Supplementary Fig. S5I, J). Other cathepsins (cathepsins F, H, O, and X encoded by Ctsf, Ctsh, Ctso, and Ctsz, respectively) were tested only at the mRNA level and showed no significant differences, with the sole exception of a mild decrease in Ctsf mRNA expression levels in 12-month-old Keap1KD mice (Supplementary Fig. S6F–I and Supplementary Table S4).
Discussion
The main novelty of this study is the demonstration that mice with ubiquitously decreased expression of Keap1 show age-dependent diffuse goiter with elevated TSH levels. This is important because it provides strong and independent experimental evidence from a murine model organism to support the association of KEAP1 with familial goiter proposed based on genetic studies in two families (9,10). However, the phenotype of Keap1KD mice does not fully recapitulate the reported phenotypes in affected members of these families. Specifically, patients in the first family presented with euthyroid MNG (9) whereas the proband in the second family presented with Graves' hyperthyroidism and an MNG with scintigraphically cold nodules (10). In contrast, Keap1KD mice were found to have elevated TSH levels and diffuse goiters with no evidence of thyroid nodules or follicular cell hyperplasia (Figs. 1 and 3). There are several potential explanations for these discrepancies. One possibility is the difference in residual Keap1 abundance between patients with heterozygous loss-of-function KEAP1 mutations and mice homozygous for hypomorphic Keap1 alleles. Specifically, the amount of Keap1 produced from the floxed allele is estimated at ∼5% of that from the WT allele (20), which is much lower than the residual amount associated with heterozygosity for a KEAP1 loss-of-function mutation (e.g., estimated at ∼50% for the amorphic c.879_880delinsA, p.Asp294Thr, fs*23 mutation, where the truncated Keap1 protein is not generated, probably due to nonsense-mediated mRNA decay) (9). A lower residual Keap1 abundance in Keap1KD mice might account, at least in part, for the difference in phenotype regarding thyroid function (elevated TSH levels) as compared with haploinsufficient patients (normal TSH levels). On the other hand, the more severe phenotype of the patients in terms of thyroid structure (nodular goiter) compared with the mice (diffuse goiter) is more difficult to ascribe to the difference in residual Keap1 abundance. Other possibilities that should be considered include the impact of differences in species-specific physiology, genetic background, age-dependent expression of the phenotype, or iodine intake; regarding the latter, it is interesting to note that both families were described in Japan, where average iodine intake is high (36). In ongoing studies, the impact of differences in iodine intake on the penetrance and severity of the goiter phenotype in Keap1KD mice will be further examined.
Although full elucidation of the pathophysiological mechanism responsible for the goiter and elevated TSH phenotype of Keap1KD mice is beyond the scope of this study, the data indicate that the pathophysiological mechanism is unlikely to be related to the known stimulatory effect of Nrf2 on the transcription of the Tg gene (13,37). We have previously shown that Nrf2 binds directly to two conserved AREs in a distal enhancer of Tg, and that Tg mRNA expression levels and Tg protein abundance are markedly decreased in the thyroids of Nrf2 KO mice (13). Nevertheless, and despite the fact that Nrf2 is potently activated in the thyroids of Keap1KD mice (Fig. 4), Tg mRNA expression levels and Tg protein abundance were decreased, rather than increased (Figs. 5A and 6). Thus, the observed enlargement of thyroid follicles in Keap1KD mice (Figs. 1D and 2A) with larger colloid areas (Fig. 2B) cannot be accounted for by an Nrf2-driven increase in Tg production. Rather, the decreased Tg mRNA and total Tg protein levels, the decreased monomeric and dimeric Tg forms, and the altered expression pattern of Tg-processing and Tg-degrading cathepsins (Supplementary Fig. S5) point to transcriptional and post-transcriptional defects in Tg economy. The elucidation of the molecular nature of these defects, including their dependence on (or independence from) Nrf2, is a primary focus of our current research. Besides the alterations in Tg, the vast majority of the differences observed in other thyroid-specific genes were mild or moderate, and mostly inconsistent between 3- and 12-month-old mice (Figs. 5 and 6, Supplementary Figs. S3 and S4, and Supplementary Table S3). We, therefore, believe that such differences are more likely to represent secondary adaptations to the molecular and/or hormonal defect induced by Keap1 hypomorphism rather than primary events.
The most remarkable, unexpected, and consistent findings from the aforementioned molecular profiling studies were the decreased levels of Tg mRNA and Tg protein in both 3- and 12-month-old Keap1KD mice (Figs. 5A and 6), and this despite the fact that Nrf2 is a direct transcriptional activator of the Tg gene (13). We, thus, contemplated whether these observations might represent causal events associated with the observed phenotypes. Regarding cathepsins, some of the observed alterations in the proteolytic network of thyroid tissue from Keap1KD mice might well cause or contribute to the observed phenotype, specifically the elevated TSH levels and the presence of Tg degradation fragments. For example, increased activity of the Tg-degrading cathepsin D observed in both 3- and 12-month-old Keap1KD mice (Supplementary Fig. S5C, D) is consistent with the increased abundance of Tg fragments that was consistently present in Keap1KD mice at both ages (Fig. 6C, D). Other alterations are more likely to represent adaptive responses that facilitate the prevention of overt hypothyroidism in these mice, such as the increased abundance of the mature form of the T4-liberating cathepsin S, which was significant only in 12-month-old Keap1KD mice (Supplementary Fig. S5G, H).
The possible contribution of the decreased Tg mRNA levels to the observed phenotypes is difficult to ascertain at present. A contribution to the hormonal phenotype cannot be completely excluded, as mice with decreased Tg mRNA expression due to double heterozygosity for Ttf1 and Pax8 (both positive regulators of Tg transcription) show overt hypothyroidism (associated also with thyroid dysgenesis). Of note, the presence or absence of this phenotype is contingent on the genetic background (38). Similarly, mice homozygous KO for Ctns, the gene mutated in infantile cystinosis, have reduced Tg mRNA levels and show elevated TSH levels with normal T4 levels (39). Cystinotic mice do not develop goiter; rather, their follicles commonly show a range of abnormalities not observed in Keap1KD mice, such as exhausted colloid, hypertrophic, and hyperplastic thyrocytes; formation of papillae; and shedding of cell remnants into the follicular lumen (39). The expression of hormonogenic cathepsins is not altered in these mice, but there is impaired Tg production linked to endoplasmic reticulum stress and the unfolded protein response, as well as altered endolysosomal Tg trafficking and altered processing of iodinated Tg (39). Similar to the Keap1KD mice, the mechanism underlying the reduced Tg mRNA levels in the cystinosis mice and their contribution to the phenotype are unclear. Finally, the data in the Nrf2 global KO mice and tissue-restricted Nrf2 KO mice (Fig. 6B, D) illustrate that the reduced Tg mRNA levels observed in these mice are not accompanied by hypothyroidism, goiter with enlarged follicles, or increased Tg degradation fragments (Fig. 6B, D), even though Nrf2 is, like Ttf1 and Pax8, a direct activator of Tg gene transcription (13). Thus, overall, we believe that the reduced Tg mRNA levels are more likely to present a secondary, adaptive phenomenon in the Keap1KD mice.
This study has certain limitations. First, as already mentioned, the roles of the observed changes in the levels of Tg mRNA, Tg protein, and cathepsin processing/degradation in the manifestation of the hormonal and morphological phenotypes warrant further elucidation. Specifically regarding the enlarged follicles, it is interesting to note that mice with KO of single (B, K or L) or multiple cathepsins (B and K, or K and L) show increased follicle diameter as compared with WT mice (32). However, each of these genotypes also shows increased amounts of dimeric and monomeric Tg protein, whereas in Keap1KD mice the levels of these Tg forms are decreased compared with respective controls (Fig. 6C, D). Thus, the mechanism leading to follicle enlargement in Keap1KD mice remains to be elucidated, and the potential contribution of the reduced mature form of the Tg-solubilizing cathepsin B in the thyroids of 12-month-old Keap1KD mice (Supplementary Fig. S5A, B) remains to be clarified. Second, it is known that cathepsin activities can be impacted by the redox status and the pH of the cells (33); we have not quantified these parameters directly, even though we have shown that antioxidant genes are induced in the thyroids of Keap1KD mice (Fig. 4), ostensibly leading to a more reducing cellular environment. In fact, previous studies in other tissues and cell models have clearly established that activation of Nrf2 upregulates not only genes that are mainly responsible for the detoxification and elimination of electrophiles, such as Nqo1 [as found also in the thyroids of Keap1KD mice (Fig. 4)], but also genes controlling glutathione (GSH) biosynthesis; this includes the gene encoding the catalytic subunit of glutamate-cysteine ligase (Gclc) (40) that catalyzes the rate-limiting first step of GSH biosynthesis. In accordance with this, liver tissue from Keap1KD mice shows increased levels of reduced GSH (41). It is, thus, possible that some of the observed changes in cathepsin activation status may be linked to a more reducing environment in the thyroids of Keap1KD mice, though this will need to be confirmed experimentally in future studies. Lastly, to formally exclude the possibility that the loxP sites flanking the Keap1 gene may cause the phenotype by impacting the expression of other nearby genes or regulatory sequences, it will be necessary to either restore Keap1 expression to physiological levels or demonstrate the Nrf2 dependence of the phenotypes. Direct rescue by expression of Keap1 at physiological levels has been performed in highly selected cases (actually using Keap1 KO mice) to address the in vivo physiological relevance of specific Keap1 cysteines (42). In other instances, evidence that the phenotypes observed in Keap1KD mice are, indeed, Keap1-dependent is obtained indirectly, by demonstrating dependence on Nrf2 (16). To the best of our knowledge, no Keap1-dependent Nrf2-independent phenotypes have been described to date in vivo in Keap1KD or Keap1 KO mice.
Activation of the Keap1/Nrf2 pathway and/or mutations in KEAP1 or NFE2L2 (the gene encoding Nrf2) have been previously described in differentiated thyroid carcinomas by our group and others (43 –47). Whether the association of goiter with genetic events impacting Keap1 in mice (Fig. 1) and humans (9,10) may have broader clinical implications for the pathogenesis of more common forms of sporadic nodules and/or goiter is currently unknown. Nevertheless, the presence of goiter in mice and humans with reduced Keap1 expression is intriguing from a physiological perspective, because it suggests that there may be a special relationship between Keap1/Nrf2 signaling and the thyroid that is not present in other tissues. Though not directly demonstrated, it can be reasonably assumed that, in the identified patients harboring germline loss-of-function mutations in KEAP1 (9,10), Nrf2 was activated in all tissues, as is known to be the case in Keap1KD mice (20). However, these subjects came to medical attention because of the goiter phenotype, and no extra-thyroidal manifestations have been reported (9,10). Hence, it is possible that reduced Keap1 activity may activate Nrf2 more potently in the thyroid compared with other tissues, as suggested by the higher induction of Nqo1 mRNA levels in the thyroid (Fig. 4A) compared with the liver (Supplementary Fig. S2B), or that the thyroid may be more sensitive to Nrf2 activation than other tissues (or both). Systematic follow-up and extended phenotyping of the few known patients with germline KEAP1 mutations (9,10), as well as the identification of additional patients, could help to address this intriguing question.
In conclusion, this study demonstrates that mice hypomorphic for Keap1, the negative regulator of the Nrf2 antioxidant response, show age-dependent diffuse goiter with elevated TSH levels. The precise mechanism accounting for the thyroidal defect in these mice remains to be elucidated, but it may involve altered and/or inappropriate Tg processing and degradation.
Author Contributions
P.G.Z. and G.P.S. designed the study; P.G.Z., C.O.R., D.V.C., M.B., I.G.H., and X.-H.L. performed experiments; P.G.Z., C.O.R., D.V.C., and G.P.S. drafted the article; and all authors analyzed data and edited the article.
Footnotes
Acknowledgments
The authors express their gratitude to Prof. Masayuki Yamamoto (Tohoku University, Sendai, Japan) and Prof. Thomas W. Kensler (Fred Hutchinson Cancer Research Center, Seattle, WA) for providing them the Keap1flox/flox mice; to Prof. Carrie Ris-Stalpers (University of Amsterdam. Amsterdam, Netherlands) for the antibody recognizing iodinated Tg; and to Prof. Roberto Di Lauro (University of Naples, Naples, Italy) for the antibodies recognizing Pax8, Ttf1 (Nkx2.1), and Foxe1.
Author Disclosure Statement
M.B. is an employee of Synlab Pathology, Lausanne, Switzerland. For all other authors, no competing financial interests exist.
Funding Information
This work was supported by Swiss National Science Foundation Research Grants 31003A_182105 and IZCOZ0_177070 (to G.P.S.); a Leenaards Foundation 2016 Fellowship for Academic Promotion in Clinical Medicine (to G.P.S.); two Short-Term Scientific Missions funded by European Cooperation in Science and Technology (COST) Action CA16112 (NutRedOx) (to D.V.C.); an Exchange in Endocrinology Expertise (3E) Fellowship from the Section/Board of Endocrinology of the European Union of Medical Specialists (UEMS) (to D.V.C.); and by grant R37DK15070 from the National Institutes of Health (to S.R.). The content is solely the responsibility of the authors and does not necessarily represent the official views of the funding agencies.
Supplementary Material
Supplementary Figure S1
Supplementary Figure S2
Supplementary Figure S3
Supplementary Figure S4
Supplementary Figure S5
Supplementary Figure S6
Supplementary Table S1
Supplementary Table S2
Supplementary Table S3
Supplementary Table S4