
Abstract
Donor cell-specific tissue-engineered (TE) implants are a promising therapy for personalized treatment of cardiovascular diseases, but current development protocols lack a stable longitudinal assessment of tissue development at subcellular resolution. As a first step toward such an assessment approach, in this study we establish a generalized labeling and imaging protocol to obtain quantified maturation parameters of TE constructs in three dimensions (3D) without the need of histological slicing, thus leaving the tissue intact. Focusing on intracellular matrix (ICM) and extracellular matrix (ECM) networks, multiphoton laser scanning microscopy (MPLSM) was used to investigate TE patches of different conditioning durations of up to 21 days. We show here that with a straightforward labeling procedure of whole-mount samples (so without slicing into thin histological sections), followed by an easy-to-use multiphoton imaging process, we obtained high-quality images of the tissue in 3D at various time points during development. The stacks of images could then be further analyzed to visualize and quantify the volume of cell coverage as well as the volume fraction and network of structural proteins. We showed that collagen and alpha-smooth muscle actin (α-SMA) volume fractions increased as normalized to full tissue volume and proportional to the cell count, with a converging trend to the final density of (4.0% ± 0.6%) and (7.6% ± 0.7%), respectively. The image analysis of ICM and ECM revealed a developing and widely branched interconnected matrix. We are currently working on the second step, that is, to integrate MPLSM endoscopy into a dynamic bioreactor system to monitor the maturation of intact TE constructs over time, thus without the need to take them out.
Impact statement
Fluorescence imaging is a cornerstone for monitoring tissue formation and remodeling processes during tissue maturation. Conventional tissue sectioning, staining, and imaging is considered the gold standard, but it has several drawbacks that preclude its use for longitudinal tissue maturation monitoring. Multiphoton microscopy offers opportunities for non-invasive tissue imaging in 3D. This non-invasive nature ultimately would allow imaging without interfering with the conditioning process. As a first step in this process, this study explains where multiphoton microscopy can outperform conventional tissue sectioning methods in non-invasive biomedical imaging of tissue engineered samples and thus highlights the opportunities in tissue engineering.
Introduction
Current gold standard of optical engineered tissue analysis is the (immuno-) histological staining of thin tissue slices. 1 Such histological methods are based on a process of sectioning into slices of usually 3 up to 10 μm thickness, labeling, and histological imaging. 2 However, intrinsically destroying the sample (due to the cutting) and being only capable of two dimensional imaging, histology is not suitable for quality assessment of the intact tissue structure in three dimensions (3D) and makes longitudinal (i.e., over time) monitoring of one and the same specific tissue-engineered (TE) construct impossible.
The motivation of the work presented here is to demonstrate the advantages of the use of MPLSM as a method to provide three-dimensional structure visualization and quantification of unsliced and thus whole-mount TE samples. As shown in many other applications, MPLSM offers in situ imaging of tissues en bloc and provides 3D information over thicknesses up to several hundreds of micrometers due to its increased penetration depth, without further damage to the construct.3,4
Since excitation wavelength in MPLSM is in the infrared spectrum and absorption is limited to the focal point only, 5 this technique is considerably less phototoxic compared with widefield or confocal techniques, while still reaching sub-cellular and sub-micrometer optical resolution.6,7 These properties make MPLSM a promising modality for quality assessment in TE, that in the future may allow us to gain a deeper understanding of the in vitro maturation of TE-implants.
However, to apply this routinely, the establishment of a standardized and quantifiable protocol is crucial. Therefore, the main objective of this study was to validate MPLSM as a means for quantitative 3D monitoring of the maturation process of TE cardiovascular implants, particularly with regard to tissue-engineered heart valves (TEHV). 8
We focused on two components of the TEHV samples, (1) alpha-smooth muscle actin (α-SMA) as an intracellular component of smooth muscle cells (SMCs) and marker of the interior cell, and (2) collagen as part of the exterior neotissue. In addition, we observed and quantified the amount and distribution of cell nuclei. To achieve MPLSM imaging, tissue was taken out of the maturation chamber at a specific time point; the whole-mount tissues were labeled, and consecutively imaged and analyzed in 3D.
This was done for different constructs at a variety of time points. We thus demonstrate how using MPLSM we were able to monitor and quantify maturation stages with progressing maturation time in a tissue conditioning procedure. In our opinion, the method offers high potential to become a future standard technique for monitoring any desired TE soft tissue maturation.
While in this study, TE patches are taken out of the maturation chamber at a certain time point, imaged, and subsequently discarded, we ultimately pursue to develop a non-invasive imaging method by integration of MPLSM endoscopy into a dynamic bioreactor. A stable, non-destructive longitudinal assessment of tissue development at subcellular resolution, eliminating the need to remove a sample from the bioreactor and allowing the experiment to continue with the very same TE construct, would give us a deeper understanding of donor-specific cell and tissue behavior and ultimately a better comprehension of the in vitro maturation process.
With the here given advantages of MPLSM, the quantification of TE patches in 3D, we are currently developing a method based on label-free multiphoton endoscopy inside the cultivation chamber and during maturation.
Methods
Cell isolation and amplification
Cells were isolated and cultivated according to a protocol described in a previous work. 9 Human umbilical cord arteries were washed in phosphate-buffered saline (PBS; Gibco, Rockville, MD), cut in rings of 1 mm thickness, and cultivated in cell culture media to obtain aortic SMCs. Cultivation and amplification of the cells was carried out in cell culture flasks (Nunc TripleFlask, 132913; Thermo Fisher Scientific, Inc.).
The cells were fed with primary cell culture medium, a Glutamax-containing, low-glucose Dulbecco's modified Eagle's medium (DMEM; 21885-025, Gibco) supplemented with 10% fetal calf serum (FCS; 10270106, Gibco) and 1% antibiotic/antimycotic solution (ABM, Penicillin-Streptomycin/Amphotericin B mix; P06-07300; PAN-Biotech GmbH, Aidenbach, Germany). To obtain a sufficient population, the cells were passaged at a confluency of 80% using 0.25% trypsin/0.02% EDTA solution (P10-023100; PAN-Biotech GmbH) and cultured in an incubator at 37°C, 5% CO2, and 95% humidity.
The cells were cultured until passage 4, reaching up to maximum passage 7. Before molding was started, the cellular phenotype was confirmed by staining positive against SMC-specific α-SMA and negative for von Willebrand factor (vWf, rabbit anti-human; A0082, Dako, Santa Clara, CA).
Hydrogel molding
The matrix used for 3D cell culture is based on a clot-equivalent fibrin scaffold. 10 The components of the fibrin gel were molded as a two-component mixture of fibrinogen and cell-containing thrombin solution. For the preparation, lyophilized fibrinogen from human plasma (Calbiochem) was dissolved in purified water (Arium Pro, Sartorius) and dialyzed overnight against Tris-buffered saline (TBS; pH 7.4) using a membrane tubing (Spectra/Por 1; Spectrum) with a molecular weight cut-off of 6000–8000 Da.
After sterile filtration (0.20 μm pore size; Corning), the fibrinogen concentration was determined by measuring the absorbance at a wavelength of 280 nm using a spectrophotometer (Infinite M200; Tecan Group Ltd.; Männedorf, Switzerland). The final concentration was adjusted to a concentration of 10 mg mL−1 with sterile TBS. The amounts for a total final volume of 6 mL fibrin gel consist of 3 mL Fibrinogen (50%) as the first component and 0.45 mL Thrombin (7.5%; from bovine plasma, 40 U mL−1; Sigma-Aldrich, Saint Louis, MO), 0.45 mL 50 mM CaCl2 in TBS (7.5%; Sigma-Aldrich), and 2.1 mL TBS containing 10 × 106 HUASMCs (35%, final cell concentration in hydrogel 1 × 10⁶ mL−1) as the second component.
The components were injected with a dual injection method, placing two 3 mL syringes with the corresponding solutions in a double syringe holder equipped with a joining piece and a mixing cannula. Afterward, the disk-shaped patches with a diameter of 60 mm and a thickness of ∼1.7 mm were allowed to polymerize for 20 min under the working bench, followed by another incubation period of 20 min inside a standard cell culture incubator for full gelation.
Cultivation of TE patches
The patches were cultivated for 21 days in a static conditioning environment, without application of mechanical stimulation, while an exchange of culture medium was carried out daily to counter supplement degradation and remove metabolites. Perfusion of diluted gases (pCO2, pO2) was tested daily before culture medium exchange (cf. to “Supplemental Data 3”).
Samples were extracted daily using a biopsy stamp, resulting in samples with a diameter of 6 mm (cf. to “Supplemental Data 1”). After detaching the constructs, they were fixed for 90 min in a stirred solution of 4% paraformaldehyde (252549; Sigma-Aldrich) in PBS (14190094; Gibco) and subsequently washed for 90 min in PBS. For the preparation of histological slices only, constructs were embedded in agarose gel (2 wt% in purified water; A4718, Sigma-Aldrich), dehydrated, and finally embedded in paraffin, followed by cutting 10 μm slices, and deparaffinization.
Staining and imaging of histological slices and whole-mount samples
All samples were stained for collagen, α-SMA, and cell nuclei. For collagen, we used the fluorescent probe CNA35-OG488, 11 specific for collagen types I, III, and IV, with the strongest affinity for type I, 12 which is of the greatest importance for fibrous collagen-synthesizing SMCs. 13 To visualize α-SMA, double antibody staining was used. Cell nuclei were identified with 4′,6-diamidino-2-phenylindole (DAPI). Fluorescent staining of the whole-mount samples was carried out on a plate rocker.
In the first step, nonspecific sites of the fixed whole-mount tissue samples were blocked and simultaneously cell membranes permeabilized for 1 h at room temperature using 5% normal goat serum (NGS; X0907, Dako) in washing buffer, a 0.1% dilution of Triton X-100 (X100; Sigma-Aldrich) in PBS. Subsequently, the samples were cleaned from any excess NGS in washing buffer for 1 h. Afterward, the samples were incubated for 16 h at 37°C in the primary fluorescent probe mixture, consisting of a blend of anti-α-SMA (125 nM; host mouse, A2547; Sigma-Aldrich) and CNA35-OG488 (50 nM; PharmaTarget B.V., Maastricht, The Netherlands).
Followed by an extensive washing step, the samples were incubated for another 16 h at 37°C in the secondary goat anti-mouse antibody, conjugated to Alexa Fluor 594 (1.00 μM; A11005; Invitrogen, Carlsbad, CA) that targets the primary α-SMA antibody. After an additional washing step, the tissues were counterstained with DAPI DNA fluorescent stain (2.86 μM; 6335, Carl Roth GmbH Co. KG, Karlsruhe, Germany) for 15 min and afterward washed thoroughly to remove any excess probes. The tissues were stored in PBS supplemented with 1% antibiotic/antimycotic solution (ABM, Penicillin-Streptomycin/Amphotericin B mix; P06-07300, PAN-Biotech GmbH) at 4°C until imaging.
In contrast to the en bloc investigated patches, 10 μm-thick histological slices were stained for widefield fluorescence microscopy and mounted on object slides (Superfrost Plus; J1800AMNZ, Menzel GmbH & Co KG, Braunschweig, Germany). Analogously, the slices were blocked with NGS for 1 h, washed for 15 min with PBS, and incubated for 1 h at 37°C with the same primary probe mixture, followed by washing three times with PBS for 5 min.
After that, the sections were incubated for 1 h at 37°C with the secondary antibody probe, subsequently washed three times with PBS for 5 min to be finally counterstained with DAPI for 5 min. As a confirmation of a successful staining procedure, native human umbilical cord sections served as a positive control, whereas samples incubated with the secondary antibody only served as a negative control.
Imaging of the samples
The MPLSM imaging was carried out using Olympus FluoView 1000MPE Microscope with a 25 × water-immersive objective (Numerical aperture NA = 1.05; Olympus, Tokyo, Japan) and MaiTai DeepSee Titanium:Sapphire Laser (Spectra-Physics, Stahnsdorf, Germany) at excitation wavelength of 800 nm. An emission signal was detected with three non-descanned photomultiplier tubes with BP filters for 419–465; 495–540; 590–650 nm. A tissue volume of 508 × 508 × 200 μm was imaged for each sample, with a voxel size of 0.497 × 0.497 × 2 μm. The acquisition time for each complete dataset was about 12 min.
To image histologically sliced tissues, AxioObserver Z1 fluorescence microscope (Carl Zeiss AG, Oberkochen, Germany) equipped with AxioCam MRm digital camera was used. For the different channels, the filter set 20 (excitation BP 546/12, emission BP 575–640) for red, filter set 38 (excitation BP 470/40, emission BP 525/50) for green, and filter set 49 (excitation G365, emission BP 445/50) for blue fluorescence were used.
Image processing of whole-mount tissue samples
Image processing and evaluation of the whole-mount patches was carried out with the microscopy image analysis software Imaris 9.6.0 (Bitplane, Inc., Zurich, Switzerland). Initially, steps of removing background noise, Gaussian filtering (σ = 0.5 μm), and layer normalization were applied. Next, z-stacks of whole patch samples were thresholded using local contrast methods. The obtained binary datasets were used for intracellular matrix (ICM) and extracellular matrix (ECM) protein quantification.
For network analysis, surfaces of binary-positive pixel volumes were software-generated, according to the mentioned binary datasets, and then analyzed for co-localization. In such way, the protein areas depending to the volume bounded by single surface were identified as connected. We state that this method is sufficiently accurate in our application, as the step size in our z-stacks (2 μm) is kept close to axial resolution (1.5 μm).
For analyzing the angular distribution of nuclei orientations, the surfaces corresponding to nuclei were approximated to ellipsoids, and the vectorial representation of the ellipsoids longest axis was used to identify the orientations of the nuclei. For nuclei enumeration, a threshold value was validated by manual counting. The average data values in the text are given together with standard error.
Experiment
Histology versus MPLSM
The histological slices of the tissue were imaged with both standard widefield fluorescence microscopy and MPLSM (Fig. 1a, b, respectively). Both microscopy techniques showed similar capabilities in registering the emission of the fluorophores. However, even with 10 μm-thick histological slices, the additional optical sectioning (with a slice resolution of 1.5 μm) in multiphoton microscopy results in much sharper images, avoiding the blur coming from out-of-focal planes.
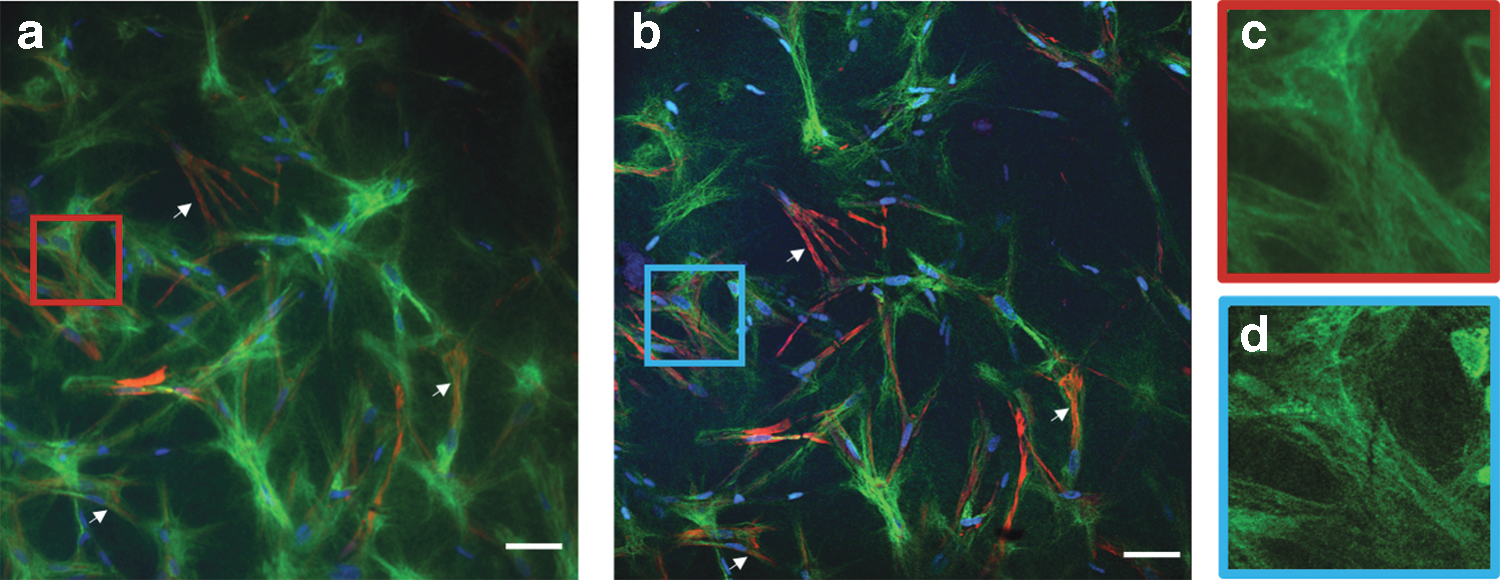
Comparison between widefield fluorescence and MPLSM images of histology slices of tissue after 10 days of maturation. Fluorescent staining against collagen (green), α-SMA (red), and DNA (blue). Scale bars 50 μm.
This effect allows better separation of especially fine structures as, for example, collagen fibers (Fig. 1c, d). Next, using MPLSM, stacks of optical sections were imaged en bloc (Fig. 2). While each individual optical slice from such an image stack impresses like an improved version of the image of a histological slice (Fig. 2a) additionally, MPLSM preserves the 3D information of the sample (Fig. 2b).
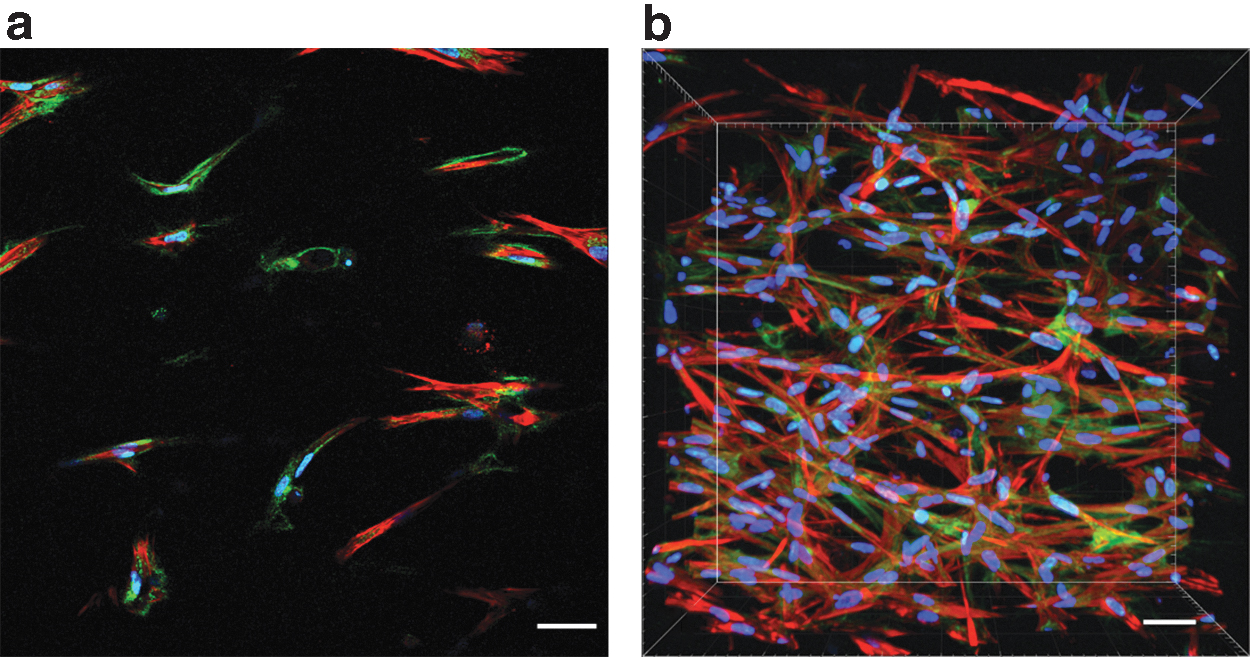
MPLSM imaging of the whole-mount sample
Taking this combination of high similarity of the resulting images and 3D capability into account, hereafter we have exclusively focused on imaging using MPLSM and subsequent 3D analysis of the results on intact TE samples at various time points of cultivation.
Quantification of cells and matrix proteins from MPLSM imaging of 3D samples
The collected z-stack MPLSM images at various time points of cultivation were quantified for the cell nuclear content and the ICM and ECM proteins. As can be seen in Figure 3, the amount of nuclei, ICM, and ECM that were detected not only depended on the progression of maturation time (indicated by different color or style of the curve), but also varied greatly with sample depth within a sample at every single time point.
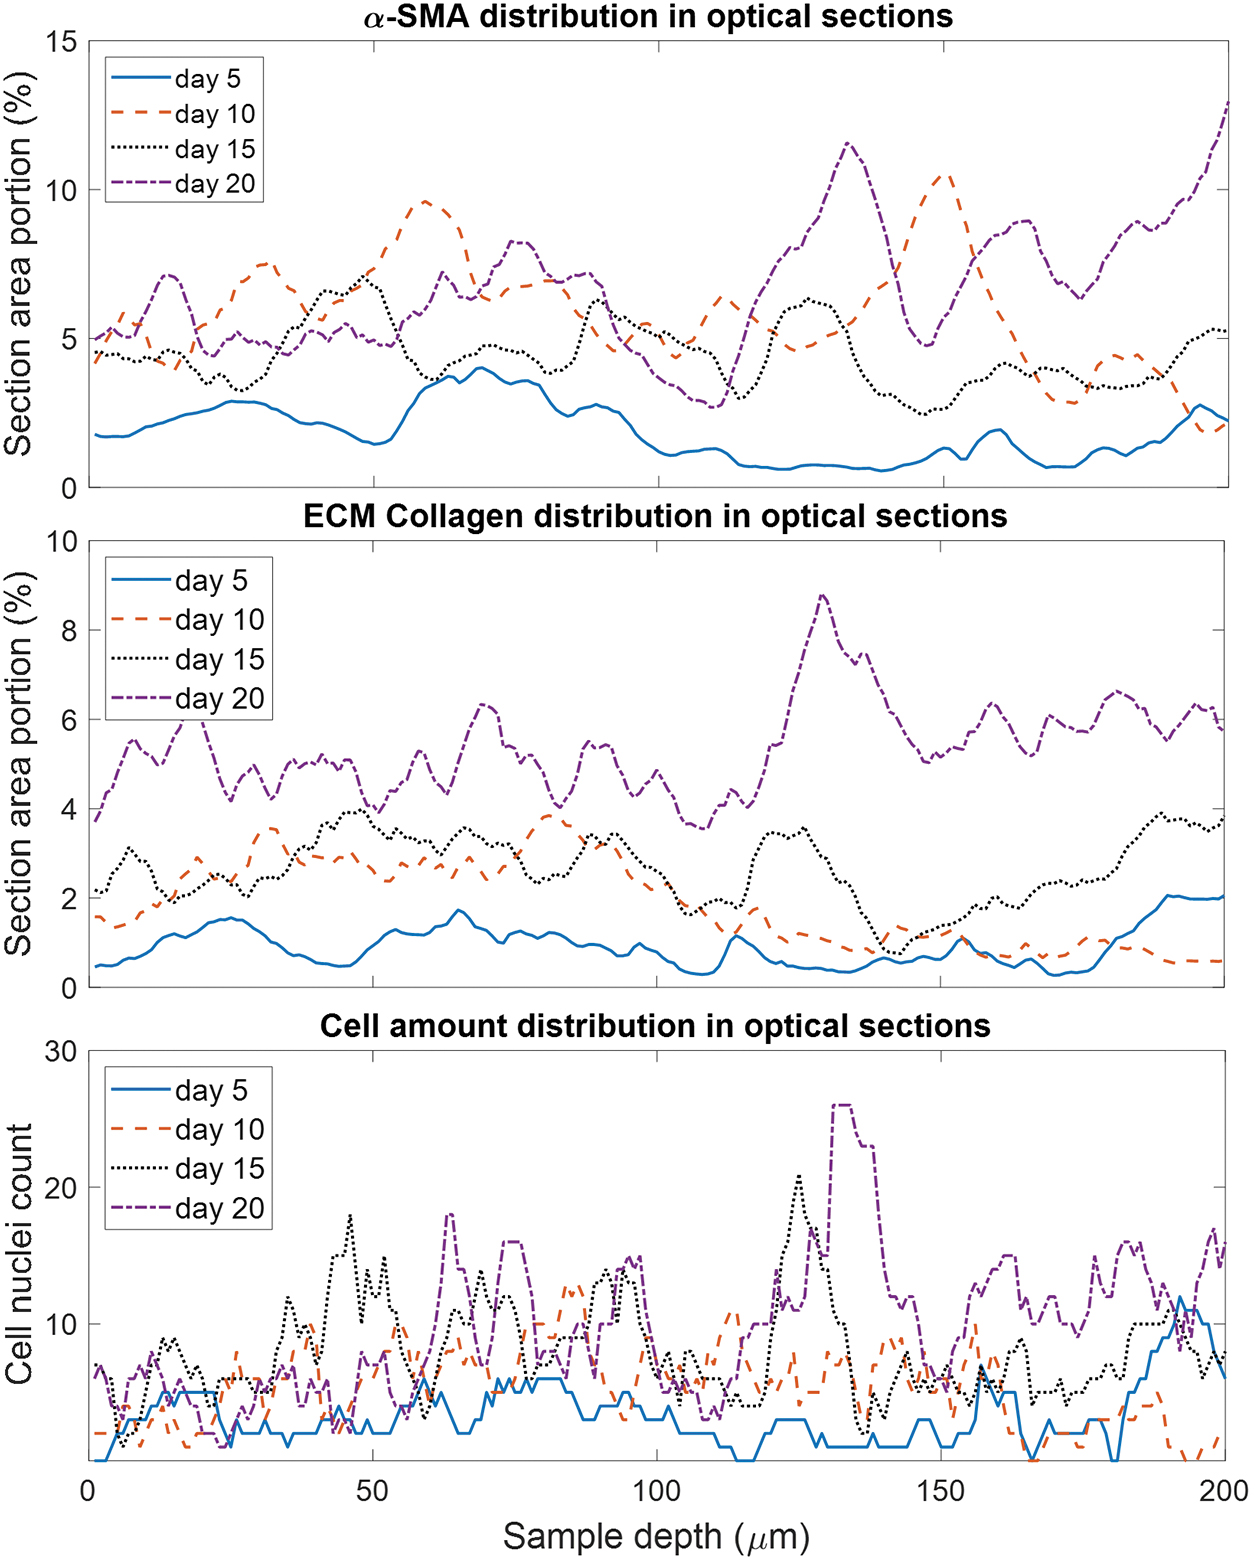
α-SMA, ECM collagen, and cell amount variations over depth of the optical image slices (relative to the surface) in whole-mount samples. The evolution is exemplarily shown for 4 different days of tissue maturation. ECM, extracellular matrix. Color images are available online.
After thresholding and processing 3D images, nuclei number was calculated counting the amount of separate software-generated surfaces as indicated in Figure 4.
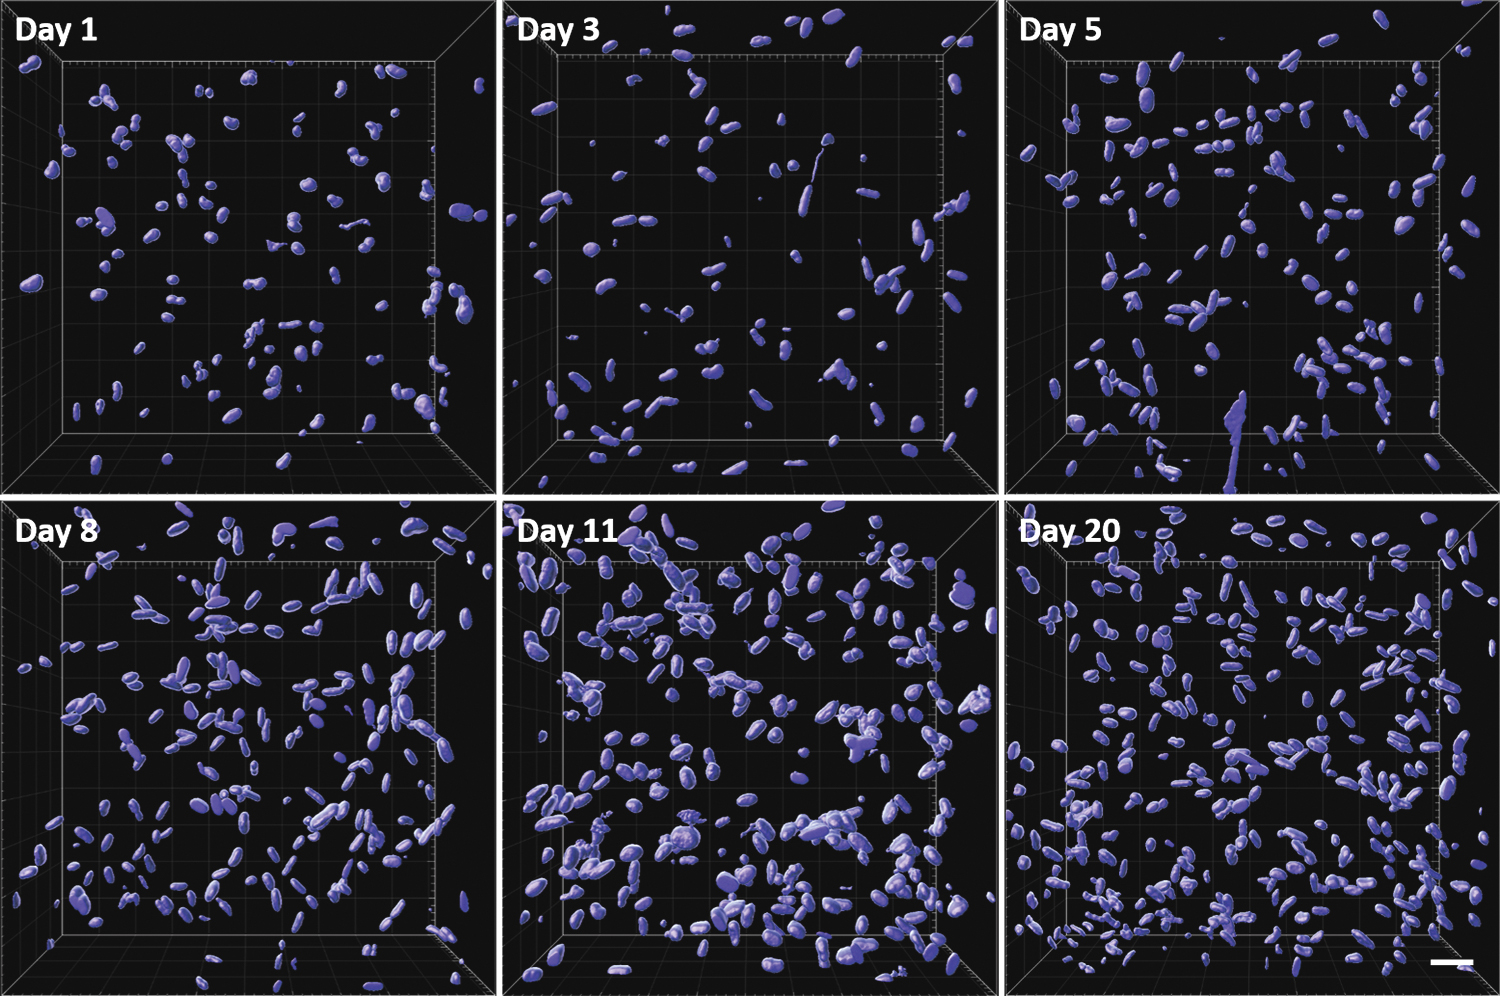
Software-identified and marked nuclei volumes at different cultivation times. Scale bar 50 μm. Color images are available online.
Volume of α-SMA and collagen was evaluated adding all binary-positive surfaces together. Following, these values were averaged for n = 5 batches of experiments. In Figure 5, the evolution of the average cell count and average volume percentages of ICM and ECM proteins are shown over maturation time. The cell number increased from (2.1 ± 0.2) × 106 cm−3 on the first day to (5.5 ± 0.7) × 106 cm−3 on the final day. In the same period, α-SMA and collagen amounts, normalized to the total volume, increased from (1.6% ± 0.3%) to (7.6% ± 0.7%) and from (0.4% ± 0.3%) to (4.0% ± 0.6%), respectively.

Evolution of cell nuclei amount, α-SMA volume, and collagen volume over the maturation period of 21 days. Color images are available online.
Qualitative network analysis
As stated earlier, not only does the multiphoton imaging technique allow collecting accurate and representative numerical data avoiding the laborious histology process, but it also preserves the volumetric information of the tissue, allowing to assess nuclei orientation, protein network (e.g., branching, orientation), and relation between cells and the networks of collagen and α-SMA.
The nuclei of the smooth-muscle-phenotypic cells in the observed tissues have ellipsoidal shape (cf. Fig. 4). 14 The shape of each nucleus was approximated with an ellipsoid, and the direction of the long axis was calculated. While the axes of the tissue during maturation are coincident with the ones in the image (i.e., the x and y-axes of the images lay in the horizontal plane of actual tissue maturation and z-axis represent the vertical direction), the distributions of ellipsoid long-axis directions were plotted in the horizontal plane (Fig. 6a) and in the vertical plane (Fig. 6b). Most of the nuclei orientations lay in the vicinity of the horizontal plane. However, no preference of nuclei orientation within this plane is expressed.
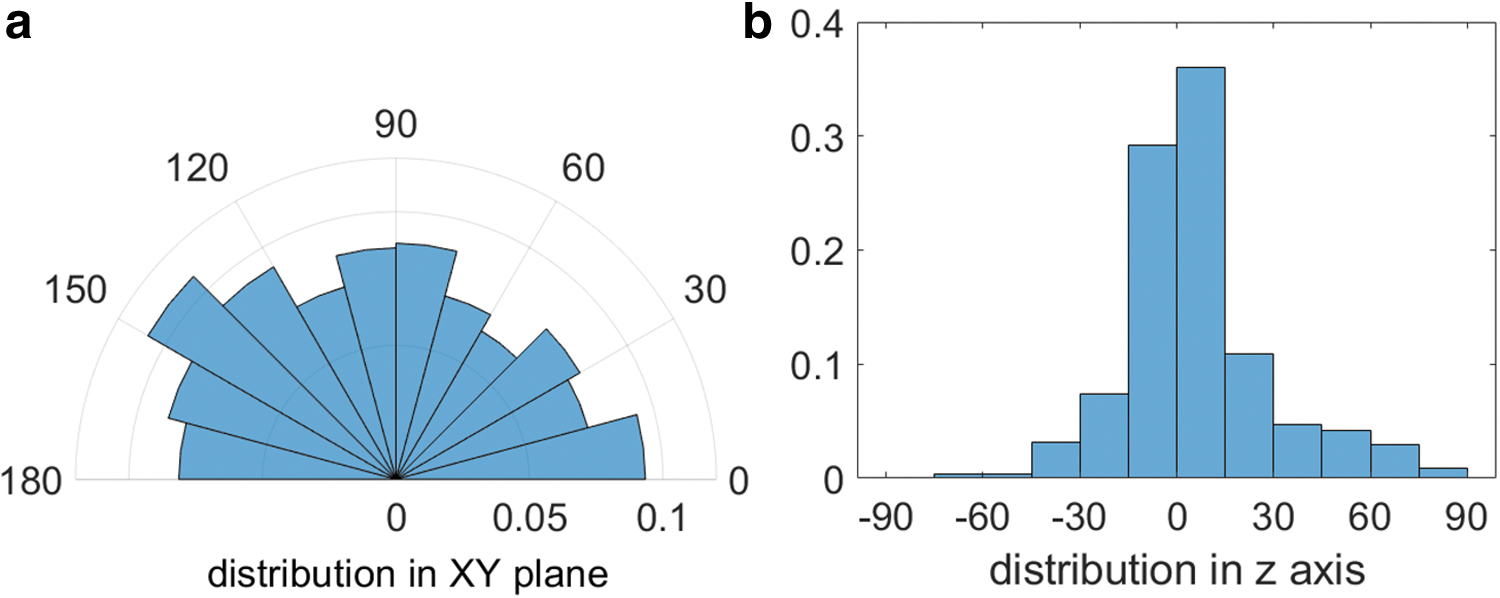
Histograms of nuclei long axis orientation (maturation day 21), with the distribution in horizontal plane
Concerning α-SMA, it becomes obvious that cells started ICM secretion from the moment they were seeded, as indicated in Figure 7. Clearly, the increase over time in amount of α-SMA content is visible. Importantly, also the interconnectivity of α-SMA increases, gradually creating a true network. During the first 3 days, α-SMA branches are only reaching to proximal cells, whereas from day 5 onward they start connecting to a global matrix network.
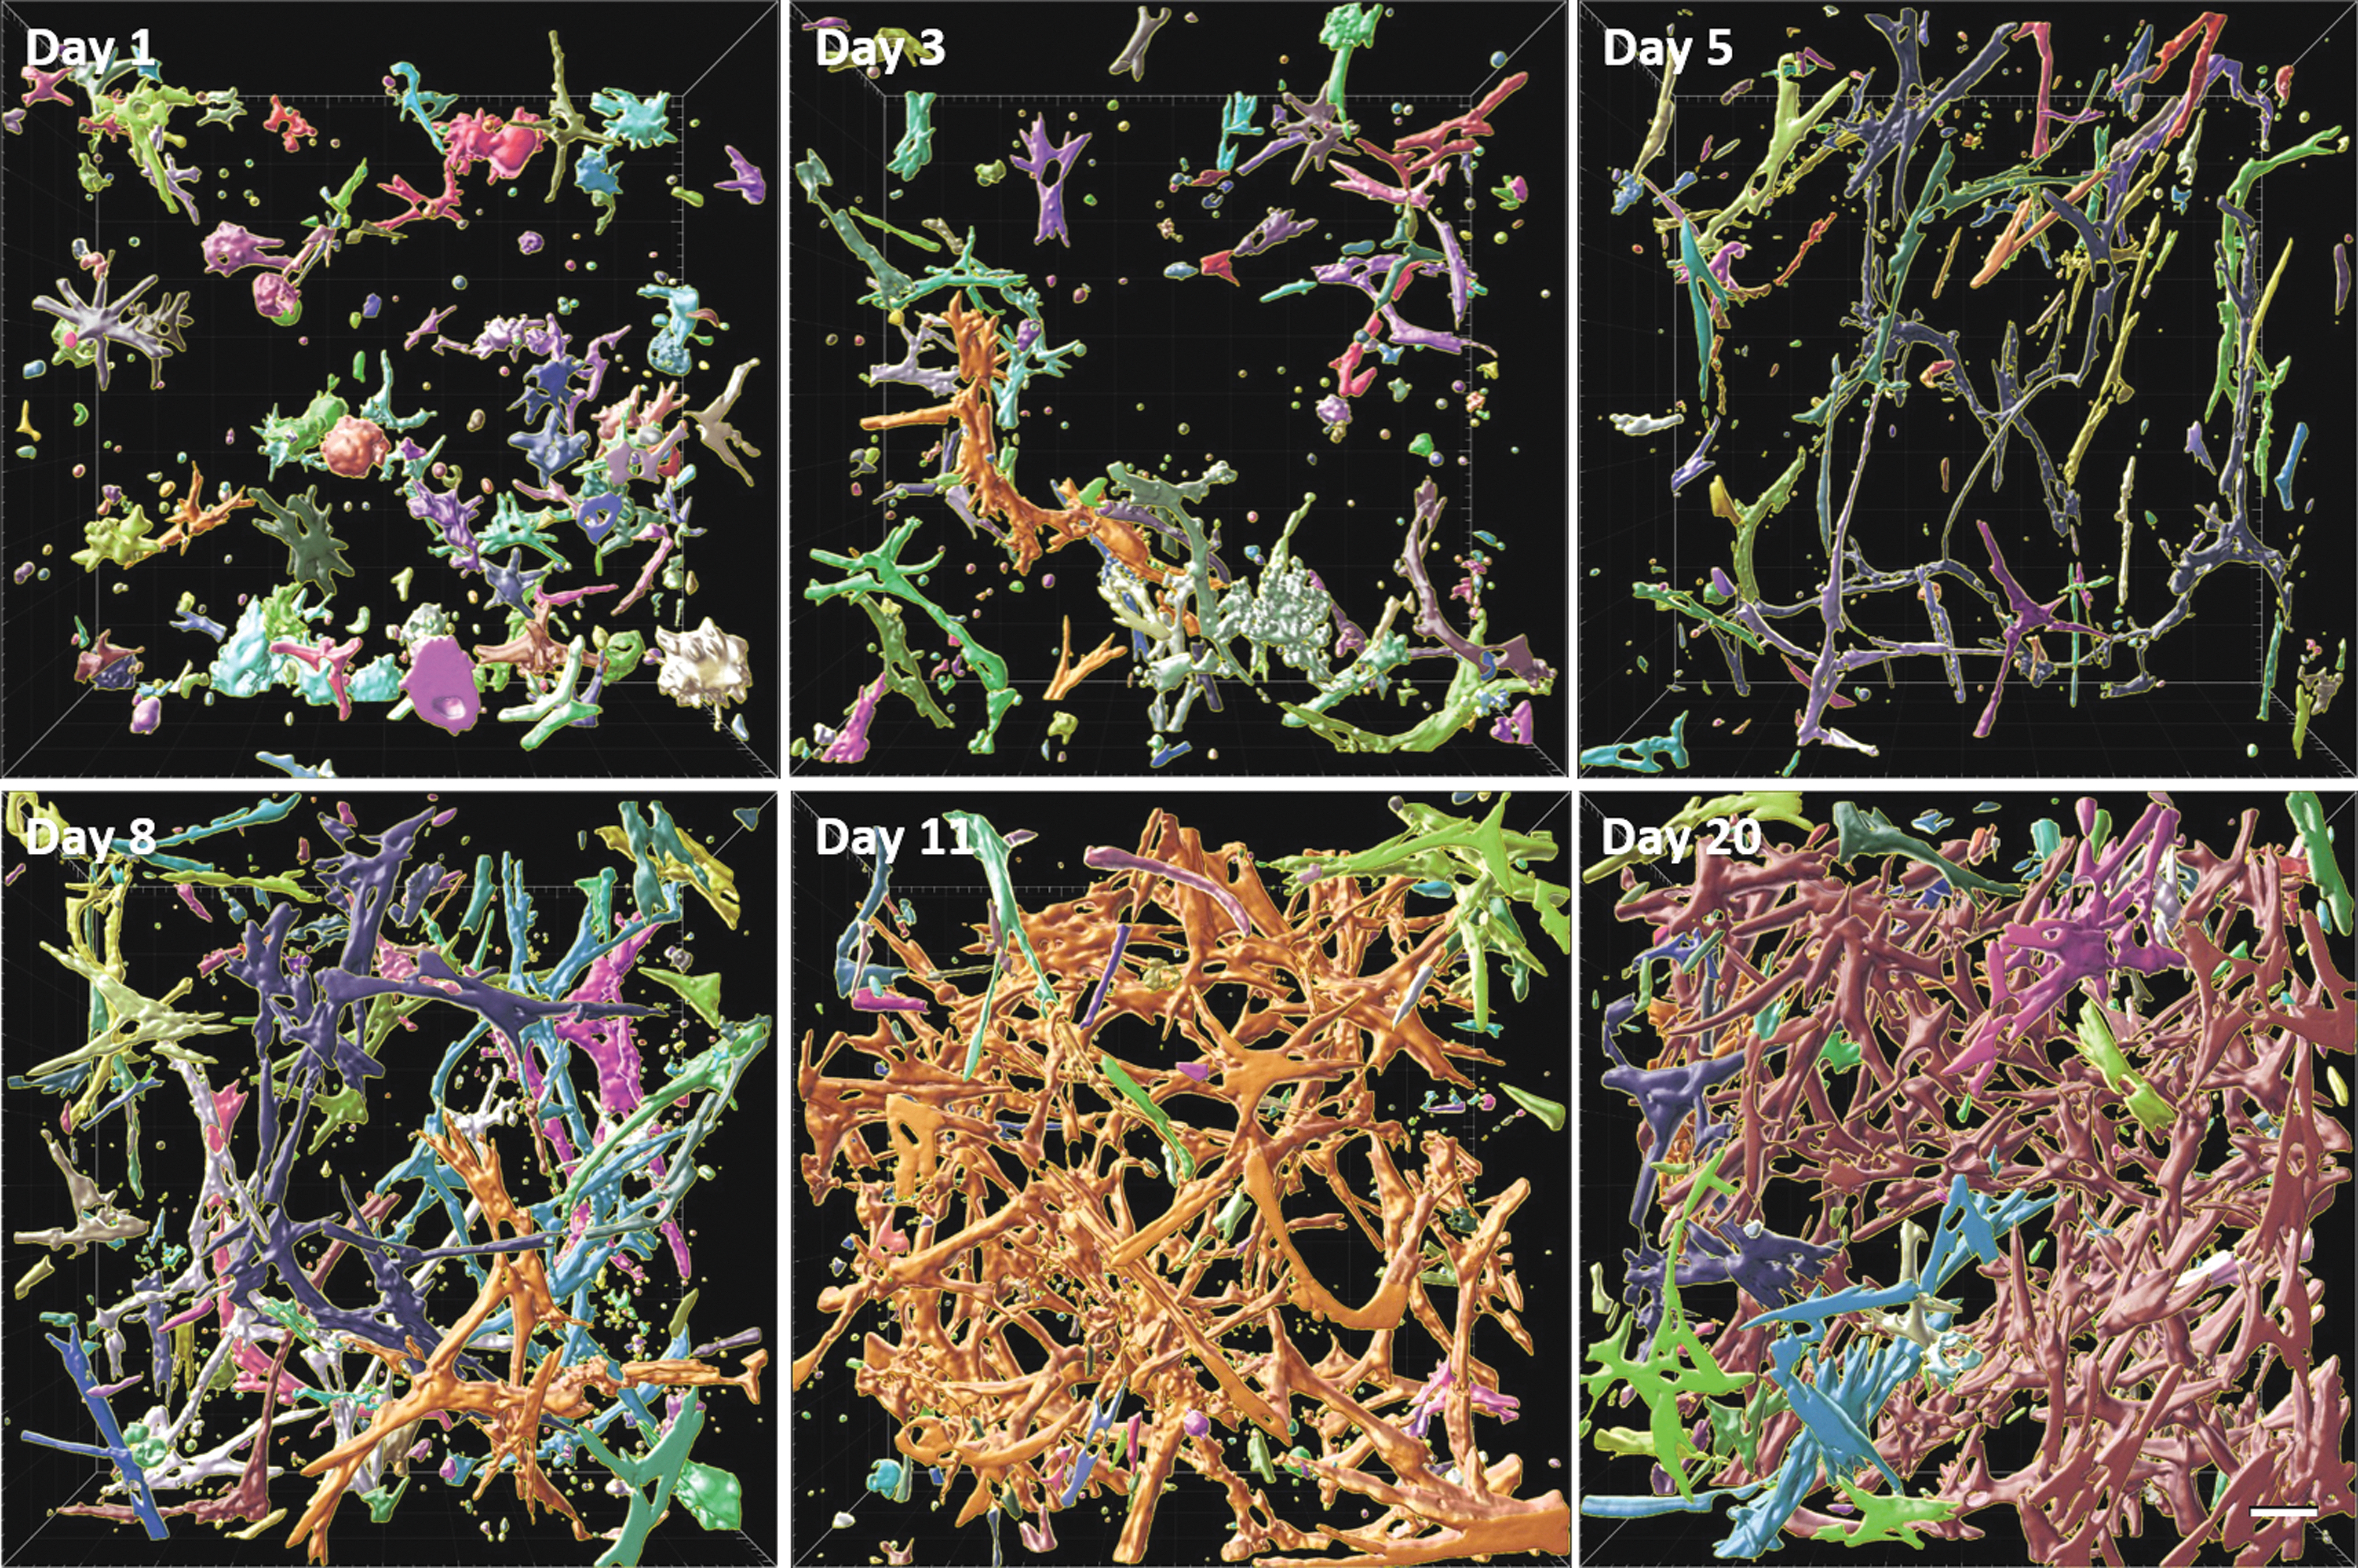
α-SMA network formation during the maturation process. Similar color shows the α-SMA belonging to the same network. Scale bar 50 μm. Color images are available online.
Once connected, the joint branches grow thicker and the overall density of α-SMA increases. Many smaller subnetworks interconnect to one single network at around the 11th day of maturation. This process can be correlated to the density increase in Figure 5, where a slowdown in α-SMA growth can be noticed at the same time.
However, even on day 20, it seems that there is still a notable amount of subnetworks appearing disconnected, observable by the different coloring. Imaging the whole sample size on a wider area revealed that these subnetworks are often connected outside of the current field of view (cf. to “Supplemental Data 2”). In contrast, collagen production and network creation (Fig. 8) starts much later around day 8 of maturation, when α-SMA is already connected between single cells.
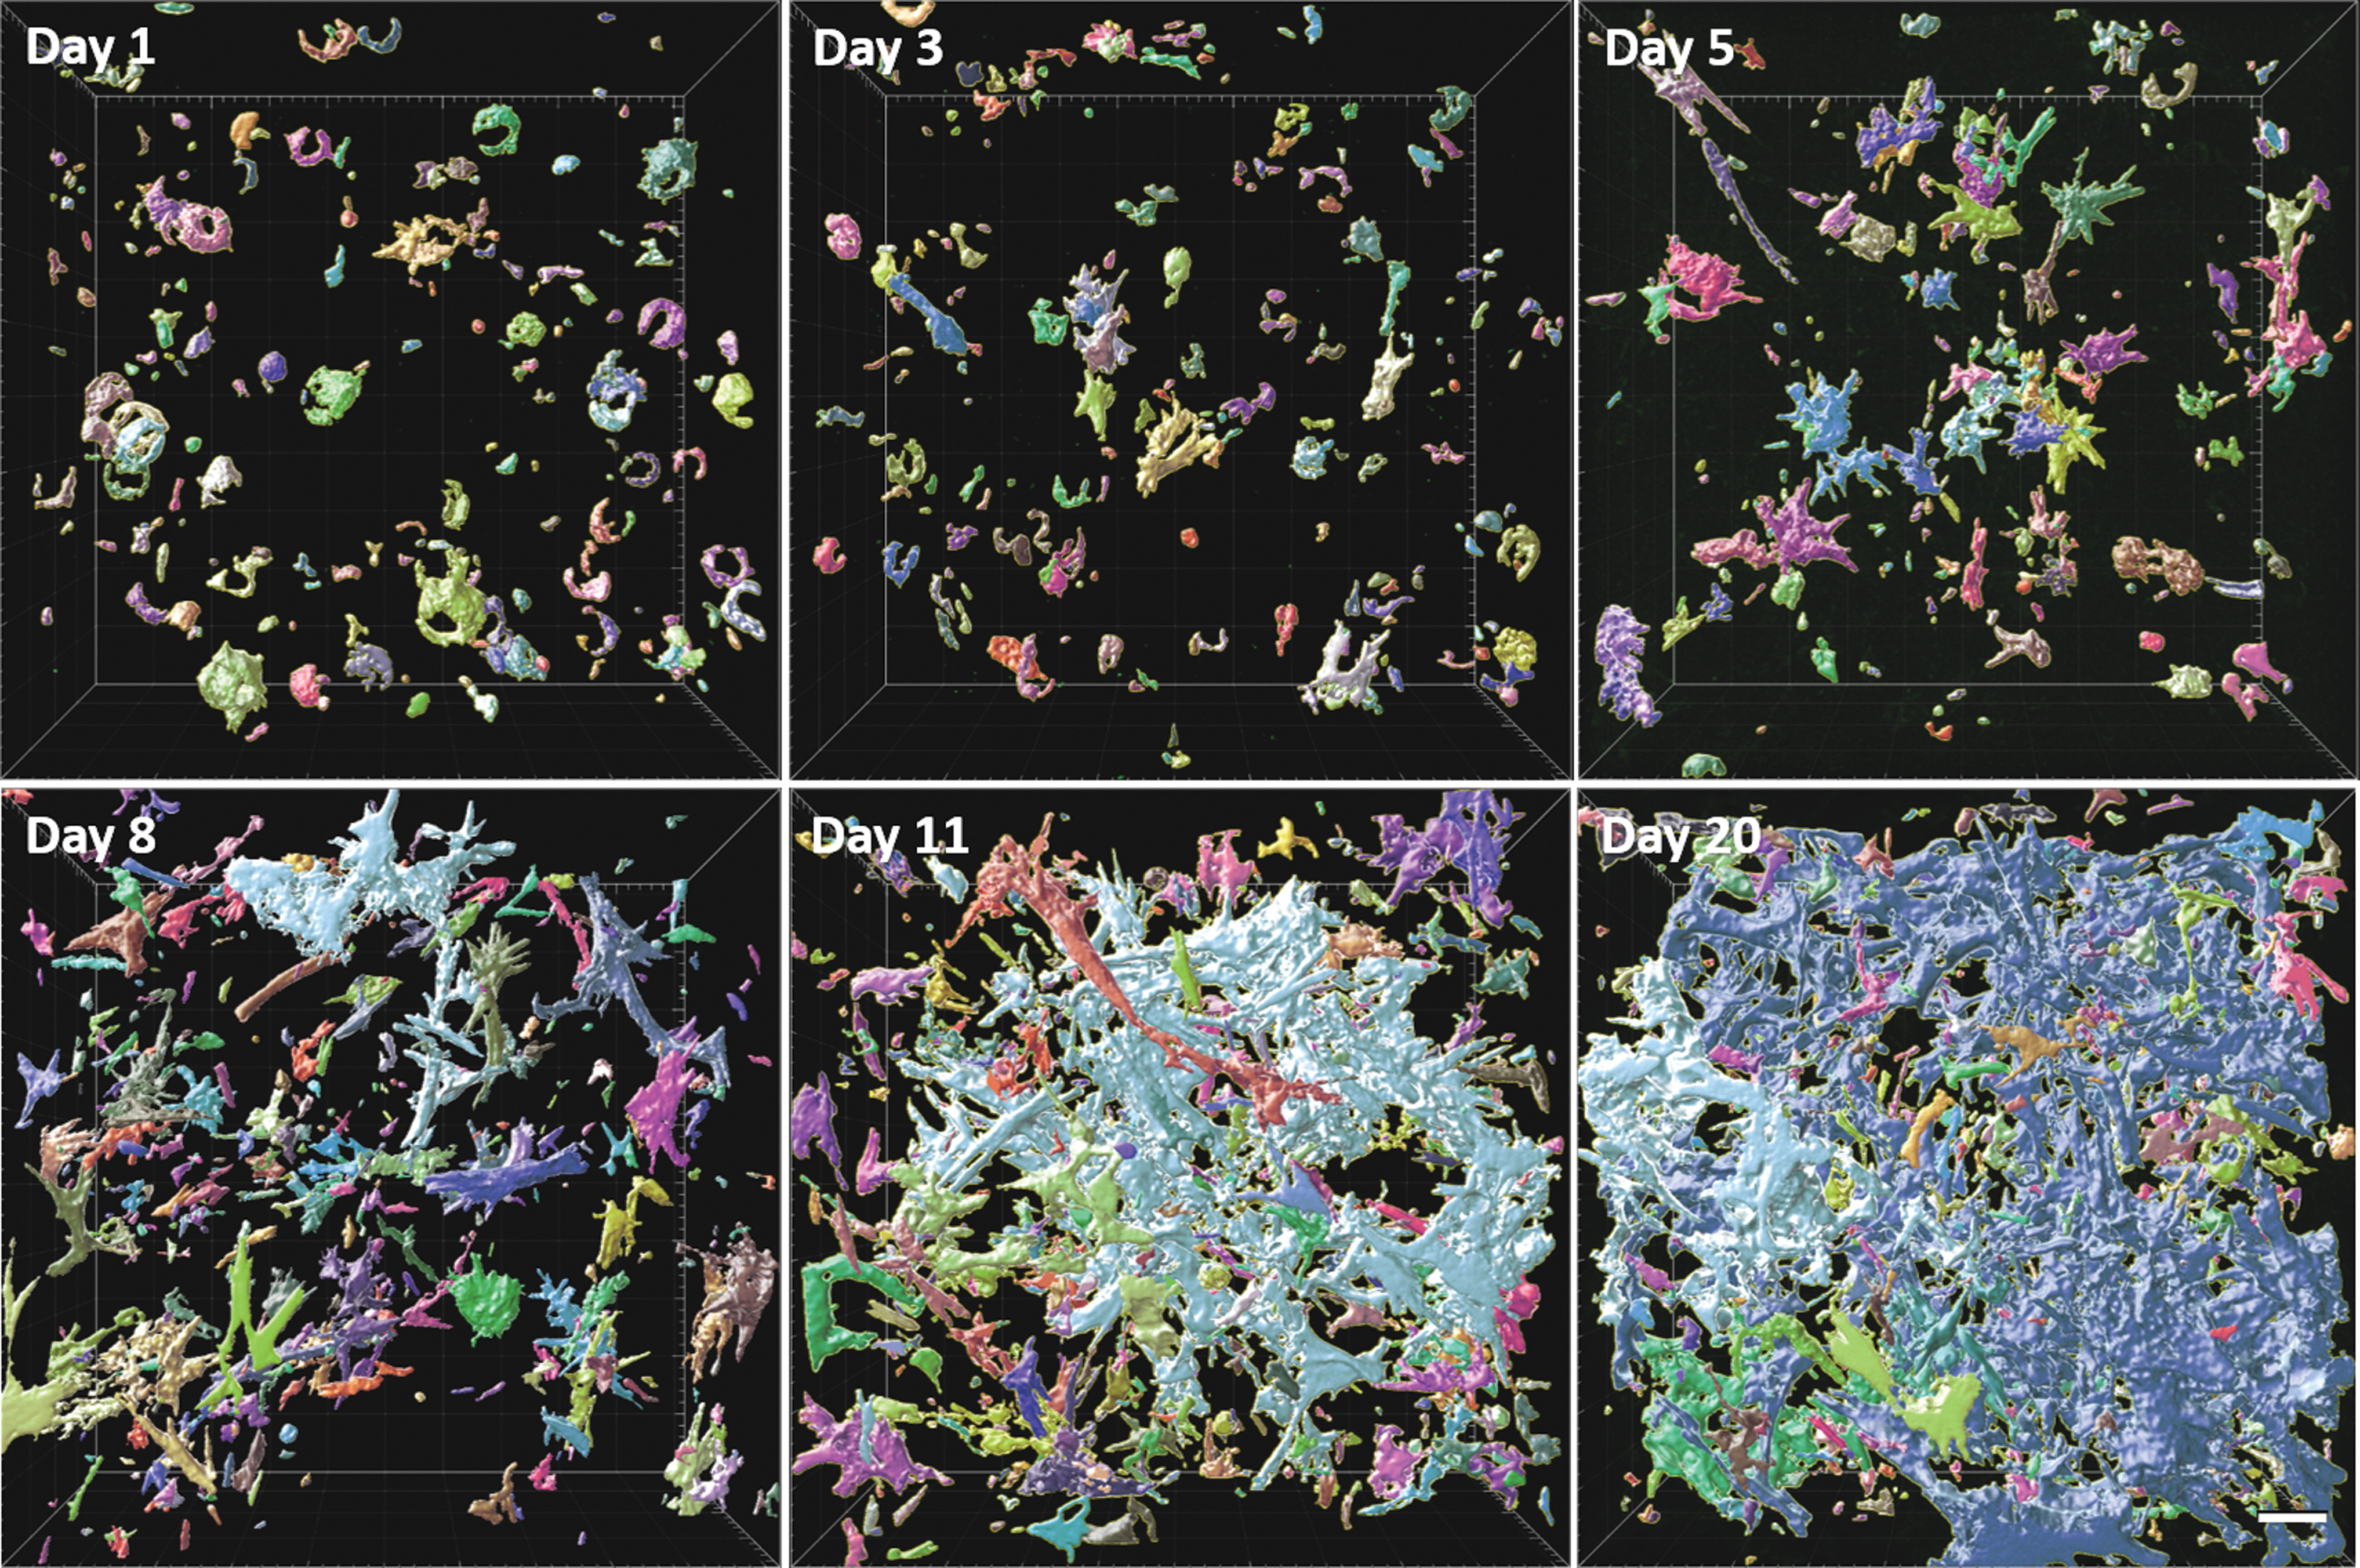
Collagen network formation during the maturation process. Similar color shows collagen belonging to the same network. Scale bar 50 μm. Color images are available online.
However, subsequent network formation proceeds in a very similar way. Note that indeed interconnectivity increases rapidly. Both α-SMA and collagen networks do not show any preference of orientation, in agreement with the absence of outer forces orienting cells and structures, such as stretch and bending.
Discussion
Multiphoton imaging in tissue engineering and comparison with histology
In the past two decades, MPLSM has experienced extensive application in biomedical research. An overview of this complete field is, however, beyond the scope of this paper. In the past 5 years, MPLSM started becoming recognized also in the TE community. Calle et al. used MPLSM to image collagen distribution in TE vascular grafts and decellularized lung tissues. 15 Their experiment proved the additional value of 3D capability of MPLSM, similarly to our experiments, but involving optical clearing methods. Vielreicher et al. used MPLSM to prove the differences in collagen deposition of 2D and 3D mesenchymal cell cultures, showing significant morphological differences. 16
They confirmed an increased synthesis of fibrous collagen in 3D cell cultures, compared with a monolayer culture, and analyzed the 3D networking of collagen fibrils in terms of orientation and connectivity. Their findings suggest the importance of 3D constructs and adequate 3D-capable imaging modalities. Kim et al. proved that during 3D-TE, like the hydrogel-embedded cell differentiation, MPLSM is indeed a highly usable and versatile tool compared with conventional microscopy, especially for parameters that are volume-dependent and very critical like cellular viability. 17
Sun et al. demonstrated the Second Harmonic Generation (SHG) and MPLSM application to image different 3D scaffolds most often used in TE. 18 They were able to depict structural information over wide volumes in 3D. The MPLSM application on the evaluation of TE constructs was shown by Syverud et al., where intracellular (myosin) and extracellular (collagen) matrix proteins were imaged with SHG to show structural integrity of TE skeletal muscle. 19
They also quantified structure ratios of myosin and collagen from multiphoton images and compared those with immunohistochemistry, and additionally evaluated metabolic function by calculating redox ratio, showing the potential capability of assessing viability of the TE constructs before the implantation. For a detailed overview of the possibilities of MPLSM in TE, the recently published review article by Lee et al. is recommended, which provides an overview of applications and possibilities in three-dimensional angiogenesis research, being applicable in TE even without a vascularization background. 20
While these studies clearly show the benefits of applying MPLSM in TE, it has not been widely applied in cardiovascular TE, for example, in TEHV maturation studies. Similar to the named studies, we want to pave the way for MPLSM to be used in the monitoring of heart valve tissue engineering process, benefiting from 3D imaging capability, nonlinear and other label-free imaging contrasts, and non-destructiveness.
In our study, as a first step toward this goal, comparison of our MPLSM images of slices and en bloc samples with widefield microscopy of histological slices shows that the information obtained is very similar and that both methods provide clear images of the cell structure and composition of ICM and ECM. However, several important differences can be observed and appreciated:
Histological slices, imaged with both widefield fluorescence and MPLSM (Fig. 1a, b), show an increased density of cells and ICM/ECM structures, compared with that in the optical slices of the whole-mount tissue as imaged with MPLSM (Fig. 2a). This difference is most likely caused by the shrinkage of the specimen during the preparation for histological slicing, showing that histology potentially causes mistakes in the assessment of protein and cell levels in the tissue. This implicates, in addition, that the ICM and ECM network undergo a significant modification during histologic preparation. While the histology process is tedious and time consuming, taking hours of preparation for specimen slicing, labeling, and imaging of each separate slice, multiphoton imaging of a large-scale sample is able to provide hundreds of image (optical) slices in tens of minutes, without complex and error-prone processing procedures. It should be noted that in this work antibody-based labeling of histology sections took 4 h, whereas labeling of intact patches required up to 3 days due to the greater sample thickness increasing dye perfusion times. However, here we address the prospective potential of MPLSM to use intrinsic signals as a fluorescence source. In future studies, we focus on these intrinsic signals as a source of fluorescence, since the current staining protocol is not compatible with experiments inside the maturation chamber. Indeed, MPLSM and other nonlinear optical microscopy modalities enable some additional label-free contrasts, such as Second Harmonic Generation (SHG, e.g., from collagen21,22 or myosin), Third Harmonic Generation (THG, e.g., refractive index-based contrast
23
), Coherent Anti-Stokes Raman (CARS, for chemical information22,24), and autofluorescence (AF, e.g., from elastin,
25
lipofuscin
3
or NADPH26,27). In addition, well-accepted vital and quickly distributing dyes such as SYTO (for cell nuclei
28
) and wheat germ agglutinin (WGA, for glycocalyx
29
) can be used. We have observed from our whole-mount samples that the protein and cellular amount at a single time point is significantly varying (Fig. 3) in different optical slices. Thus, the volumetric assessment of the protein content purely from histology would require imaging a large amount of histology slices, even for one time point, to obtain error-proof mean values. Alternatively, as we show here, the same information can be acquired with a single multiphoton imaging stack over many micrometers, followed by a well-defined segmentation and quantification procedure. By using automatic processing tools, both imaging and analysis using multiphoton microscopy take significantly less time while being more reliable. Imaging optical slices over a large volume not only provides enough data to average variations, but it also visualizes the 3D structure underlying these variations, revealing information such as 3D orientation, networking, and connections. This information is obviously not available (and is thus often ignored, resulting in faulty values) when imaging separate histological slices. The same applies to variations of parameters between different samples (e.g., at different time points of maturation, either due to different cultivation conditions or due to environmental differences under the same conditions). The strong variation between optical slices at various depths illustrates the need for 3D imaging to assess valid ICM and ECM quantification and stresses the importance of whole-volume 3D multiphoton imaging. Confocal laser scanning microscopy (CLSM) could also be applied for similar 3D imaging, surpassing image resolution of both—widefield fluorescence and multiphoton microscopies—in the histological slides and shallow depths (up to 50 μm) in whole-mount samples.30,31 However, the CLSM signal is rapidly decreasing when going into deeper layers, also quickly losing resolution. In contrast, multiphoton signals maintain intensity and resolution. In addition, in contrast to nonlinear microscopies, CLSM is limited to stained samples, not benefiting from potential label-free contrasts in the near future as listed under (ii) and in the Discussion-Limitations paragraph.
Quantification of tissue parameters
Cell distribution density and orientation are essential parameters in 3D tissue maturation. According to multiphoton imaging, the cell proliferation, based on values of the nuclei distribution, showed a significant increase with an average doubling after 9 days and tripling until day 15. The great impact of cell behavior on the tissue maturation becomes obvious with the evolution and development of fibrous proteins, as the protein proportion increased, analogous to the nuclei count, with a similar course. The volume fraction of α-SMA strongly increases in the first days of maturation, whereas the increase in collagen is delayed about 5 days. Very early expression of α-SMA is a sign of activation of the SMCs.
The delayed collagen secretion could be explained by the progressing cell number, therefore the increase in cell-cell contacts, which, in turn, induce a modulation toward a less protein-synthesizing phenotype. Both protein proportions show a converging trend until day 21. A further increase in cell-cell contacts evidentially leads to a decreased biosynthesis of fibrous proteins, 32 which becomes evident by decreasing slopes of both the α-SMA and collagen volume fraction curves.
In summary, the strong expression of the intracellular protein α-SMA and extracellular collagen proved intense neo-tissue formation during the tissue conditioning.
Network analysis
With the three-dimensional information offered by MPLSM, it was possible to depict the tissue formation by a qualitative network analysis. Using the image analysis protocols described in Materials and Methods, determination of the cell nuclei orientation was carried out as an indicator for cell alignment. 33 The even distribution of nuclei orientations in the horizontal plane suggests that the governing force for cell alignment in such tissue formation is gravity.
The evaluation of the network formation of fibrous proteins argues in favor of this alignment theory. Further, the development of the cytoskeleton, represented by α-SMA, revealed the formation of a reticular network. The subsequent collagen fibril formation was suggested to be directly spatially coupled to α-SMA fibrils, indicating that the guidance of matrix formation starts with appropriate cell alignment. 34 Besides, collagen synthesis is known to be regulated by mechanical forces. 35
Even though the present study does not involve any dynamic movement, the cell-mediated contraction of the tissue still induced internal mechanical forces. This became obvious as the collagen fibrils seemed to mature during their conditioning, where the SMCs in juxtaposition gradually polymerized collagen fibers to larger supramolecules. 34 This is important in that the biomechanics of collagen fibers may, in turn, influence the phenotype of SMCs.36,37
Limitations
It is important to point out some limiting factors in our study.
Firstly, as already stated earlier, this study employs fluorophore staining. We are fully aware that label-free contrasts are important for future goals. However, in this study, we deliberately chose to label collagen using CNA35 probe over using SHG for the following reasons: (1) our workflow included labeling other proteins, therefore co-labelling collagen did not add additional workload and disadvantages; (2) for MPLSM comparison to widefield fluorescence microscopy, we require contrast visible in both approaches; (3) since an SHG signal is present in fibrillar collagen only, and while it is sensitive to collagen fibril thickness and excitation light polarization, separate single collagen fibers, as well as non-fibrous collagen are both bound to be missed by SHG contrast.
In contrast, staining using CNA35 is shown to allow visualization of the smallest amounts of collagen types I, III, and IV, the latter being non-fibrillar. Of course, label-free SHG imaging would be generally preferred in future experiments where labeling during the maturation process needs to be avoided.
Second, we acknowledge that the imaging method is not sufficient to visualize the fine nanoscale structures of fibrous proteins, thus being prone to volume overestimation in protein quantification. While our focus is on cell-to-cell interactions and the corresponding ECM scale, we believe that the current imaging resolution is sufficient to show the coarse protein structures (e.g., thick collagen fiber bundles).
Due to this reason, we chose specific imaging settings, even though more precise results could have been acquired (e.g., keeping z-step sampling at the Nyquist criterion) at the expense of significantly longer imaging time.
Outlook: toward a non-destructive approach
The cardiovascular system is constantly exposed to mechanical loads, and a healthy and resilient TE implant is crucial for a successful performance after implantation. Besides biochemical influences, 38 mechanical forces are one of the most promising extrinsic influences to stimulate the biosynthesis of essential ICM and ECM proteins in the bioreactor, to improve biomechanical properties: through three-dimensional bending of TE constructs, for example, the cyclic opening and closing of a heart valve, a significantly increased cell proliferation, collagen- and α-SMA formation can be achieved, as well as cyclic uniaxial stretching stimulates the secretion of different collagen types, but also non-collagenous proteins such as elastin. 39
These results motivate a follow-up study to investigate the influence of different levels of mechanical loading on the ICM and ECM formation using the presented multiphoton imaging technique of fluorescence-based protein quantification. Further, we are currently working on the development of an endoscopic system based on the multiphoton technique, 6 which could be integrated into an in vitro bioreactor environment.
Combined with the label-free imaging possibilities described earlier, this would allow to observe maturation and remodeling of TE constructs in real time and longitudinally without interfering with the process itself. Such information would enable feedback-based control of the individual maturation process, adaptive to donor-dependency of cells and tissue, ultimately allowing optimal maturation of clinically usable constructs for implantation into patients.
Conclusion
Our study shows that the information on tissue maturation from MPLSM images contains the full three-dimensional structure of the intra- and extracellular tissue, whereas histology contains only a small part, which may include misleading information, or is not representative of the entire tissue. This implicates also that a lot less processing time is required with MPLSM to obtain the very same volumetric information, than it does with traditional sectioning methods.
Further, we demonstrated that the 3D reconstructed stacks acquired with MPLSM offer the possibility to track the current volume share of distinct tissue components. Lastly, in contraposition to MPLSM, standard histology causes significantly more image artefacts, due to preparation-induced shrinkage. Overall, the MPLSM technique seems to have excellent potential for imaging engineered tissue in 3D during maturation.
Footnotes
Acknowledgments
The authors thank Michael Vogt and Leon Decker for their support at the core facility Two-Photon Imaging, Interdisciplinary Center for Clinical Research (IZKF) Aachen within the Faculty of Medicine at RWTH Aachen University.
Authors' Contributions
M.P.W.: conceptualization, methodology, validation, formal analysis, investigation, data curation, writing (original draft), writing (review & editing), and visualization; V.K.: conceptualization, methodology, software, validation, formal analysis, investigation, data curation, writing (review & editing), and visualization; K.V.: resources, writing (review & editing); D.A.: writing (review & editing), supervision, project administration, and funding acquisition; S.J.: resources, writing (review & editing), and supervision; M.A.M.J.Z.: resources, writing (review & editing), supervision, project administration, and funding acquisition; T.S.-R.: resources, writing (review & editing), supervision, project administration, and funding acquisition.
Ethics Statement
The studies involving a human cell source were reviewed and approved by University Hospital Aachen Local Ethics Committee (Reference number: EK 278/16). The cell source was based on the isolation of target cells from human umbilical cords that were kindly provided by the clinic of gynecology and perinatal medicine of the University Hospital Aachen.
Data Availability
The data that were used to support the findings of this study are available from the corresponding author on request. The entire data set includes raw data files acquired during imaging, processed data files as software-reconstructed images, and numerical records and statistical calculations from software analysis.
Disclosure Statement
The authors declare that there is no conflict of interest regarding the publication of this paper.
Funding Information
This research was carried out in the framework of the PAK961 project “Toward model-based control of biohybrid implant maturation” in the subproject P4 “Process Modelling—Process-oriented maturation model of biohybrid heart valves in a bioreactor,” funded by the German Research Foundation (Deutsche Forschungsgemeinschaft—DFG)—project number 403043858.
References
Supplementary Material
Please find the following supplemental material available below.
For Open Access articles published under a Creative Commons License, all supplemental material carries the same license as the article it is associated with.
For non-Open Access articles published, all supplemental material carries a non-exclusive license, and permission requests for re-use of supplemental material or any part of supplemental material shall be sent directly to the copyright owner as specified in the copyright notice associated with the article.