
Abstract
Lung branching morphogenesis has been studied for decades, but the underlying developmental mechanisms are still not fully understood. Cellular movements dynamically change during the branching process, but it is difficult to observe long-term cellular dynamics by in vivo or tissue culture experiments. Therefore, developing an in vitro experimental model of bronchial tree would provide an essential tool for developmental biology, pathology, and systems biology. In this study, we succeeded in reconstructing a bronchial tree in vitro by using primary human bronchial epithelial cells. A high concentration gradient of bronchial epithelial cells was required for branching initiation, whereas homogeneously distributed endothelial cells induced the formation of successive branches. Subsequently, the branches grew in size to the order of millimeter. The developed model contains only two types of cells and it facilitates the analysis of lung branching morphogenesis. By taking advantage of our experimental model, we carried out long-term time-lapse observations, which revealed self-assembly, collective migration with leader cells, rotational motion, and spiral motion of epithelial cells in each developmental event. Mathematical simulation was also carried out to analyze the self-assembly process and it revealed simple rules that govern cellular dynamics. Our experimental model has provided many new insights into lung development and it has the potential to accelerate the study of developmental mechanisms, pattern formation, left–right asymmetry, and disease pathogenesis of the human lung.
Introduction
T
In this study, we succeeded in developing an in vitro experimental model, which was able to reconstruct a branching structure with secondary and tertiary branches from primary bronchial epithelial cells. A highly dense epithelial cell spot with sufficient space in Matrigel was required to initiate branch formation, and then epithelial–endothelial interactions generated the successive branches. The branches grew in size to the order of a millimeter. Unlike an in vivo system, the developed experimental model requires only two types of cells, normal human bronchial epithelial (NHBE) cells and HUVECs, which make the study of the developmental mechanisms of branching formation considerably easier in terms of molecular interactions and analysis of cellular dynamics. Various epithelial cell dynamics, such as NHBE cell self-assembly, rotation, and spinal motion, which are required for multicellular organization, can be observed during each branching step with our experimental model. Both NHBE cells and HUVECs have normal human genes and they are commercially available in contrast to stem cell studies. This accessibility of the experimental model enhances study of lung developments.
Materials and Methods
3D culture
NHBE cells and HUVECs were both purchased from Lonza (CC-2541, C2519A; Walkersville, MD). The growth factor-reduced, reconstituted basement membrane Matrigel (No. 356230; Corning, NY) was used for 3D culture experiments. HUVECs (6.0 × 10⁵ cells) were seeded into 200 μL Matrigel in suspension and gently mixed with a pipette. They were then added on a φ 12-mm cover glass placed on a 12-well plate so that a sufficient Matrigel height could be sustained by the surface tension applied on the Matrigel. After centrifugation, 1 μL of concentrated NHBE cells (5.0 × 10⁴ cells μL−1) was then injected into the center of the HUVEC distributed Matrigel and incubated for 25 min at 37°C to facilitate gelatinization. As a cell culture medium, a one-to-one mixture of bronchial epithelial growth medium (CC-3170; Lonza) and endothelial growth medium (CC-3162; Lonza) supplemented with 50 IU·mL−1 penicillin and 50 μg·mL−1 streptomycin was prepared. Two milliliters of the medium was added to each well and the medium was changed every day.
Time-lapse imaging
Live cell images were acquired with a JuLi Br (NanoEntek, Seoul, Korea) placed in the cell incubator or with a BZ-X700 microscope (Keyence, Osaka, Japan) equipped with a stage-top incubator (Tokai Hit Co. Ltd., Shizuoka, Japan). Images were taken every 5 or 10 min.
Cell tracking
Cells were manually tracked and the cell dynamics were quantified using the Matlab software (The MathWorks, Inc., Natick, MA). Two to four continuous images from a time-lapse video were loaded to the figure command in turn and cells were marked to record their positions in x axis and y axis, respectively. The positional data from the cell tracking were converted to a vector format, and the velocity and relative angles of branch direction were calculated.
Immunostaining
The samples were freeze-sectioned and nuclear, E-cadherin, Sprouty 2 (SPRY2), Sonic Hedgehog (SHH), fibroblast growth factor receptor 2 (FGFR2), and CD31 staining was performed on the sections to enhance imaging quality. For fixation, 4% paraformaldehyde (Wako Pure Chemical Industries, Ltd., Osaka, Japan) was applied to the Matrigel at room temperature for 20 min, followed by two rinses with phosphate-buffered saline (PBS), 10 min each. Subsequently, 100-μm-thick samples sections were produced by a microtome equipped with a cryostat (REM-710, YAMATO Kohki Co. Ltd., Japan). The sectioned samples were placed on glass slides and were permeabilized with PBS containing 0.5% Triton X-100 for 10 min at 4°C, followed by three washes with PBS containing 100 mM glycine, 10 min each. Then, they were incubated with 10% goat serum in IF buffer (0.2% Triton X-100, 0.1% bovine serum albumin, and 0.05% Tween-20 in PBS) for 60 min at room temperature for a primary blocking step. As a secondary blocking step, the samples were incubated with 1% goat anti-mouse immunoglobulin G and 10% goat serum in IF-buffer for 40 min at room temperature. For the staining of E-cadherin, SPRY2, SHH, and FGFR2, the samples were incubated with a mouse monoclonal anti-E-cadherin antibody (1:100, ab1416; Abcam plc, Cambridge, UK), an anti-CD31 antibody (JC/70A) (1:20, MO823; DAKO), a rabbit monoclonal anti-SPRY2 antibody (1:50, ab85670; Abcam plc), an anti-SHH antibody (1:100, ab53281; Abcam plc), and an anti-FGFR2 antibody (1:50, ab5476; Abcam plc) overnight at 4°C, followed by three rinses with IF-buffer, 20 min each. Secondary antibodies labeled with Alexa Fluor 488, 555, or 596 (1:200, Thermo Fisher Scientific, Inc., Waltham, MA) were then used. For nuclear staining, the samples were incubated with 300 nM 4′,6-diamidino-2-phenylindole in PBS for 20 min at room temperature, followed by three rinses with PBS, 20 min each.
Computational simulation
A computational simulation was conducted to analyze the mechanism of the self-assembly process. Simple rules stating that cells migrate toward higher concentrations of an activator secreted by them and that cell migration speed depends on the activator concentration were assumed. Activator diffusion and cell migration in very short time scale can be expressed as differential equation.
13
In addition, to incorporate discrete cell distribution with continuous morphogen distribution, delta function can be used.18,19 The mathematical expression of this hypothesis is shown below:
A is the activator concentration and N represents the positional information of cell and it expresses as delta function of position vector γ to incorporate discrete cell distribution with continuous model of morphogen A diffusion. Ai denotes the activator concentration at γi position.
Results
Reconstruction of the bronchial tree by epithelial–endothelial interactions
To develop an experimental model for branching morphogenesis of the lung airway, we cultured primary cells of NHBE cells in Matrigel, which is a reconstituted basement membrane. When epithelial cells were homogeneously distributed in Matrigel, they barely moved in 3D space and did not develop branch formations (Fig. 1A). On the other hand, cells dynamically migrated to generate primary duct formations when highly dense epithelial cells were placed at one spot in Matrigel (Fig. 1B and Supplementary Video S1; Supplementary Data are available online at
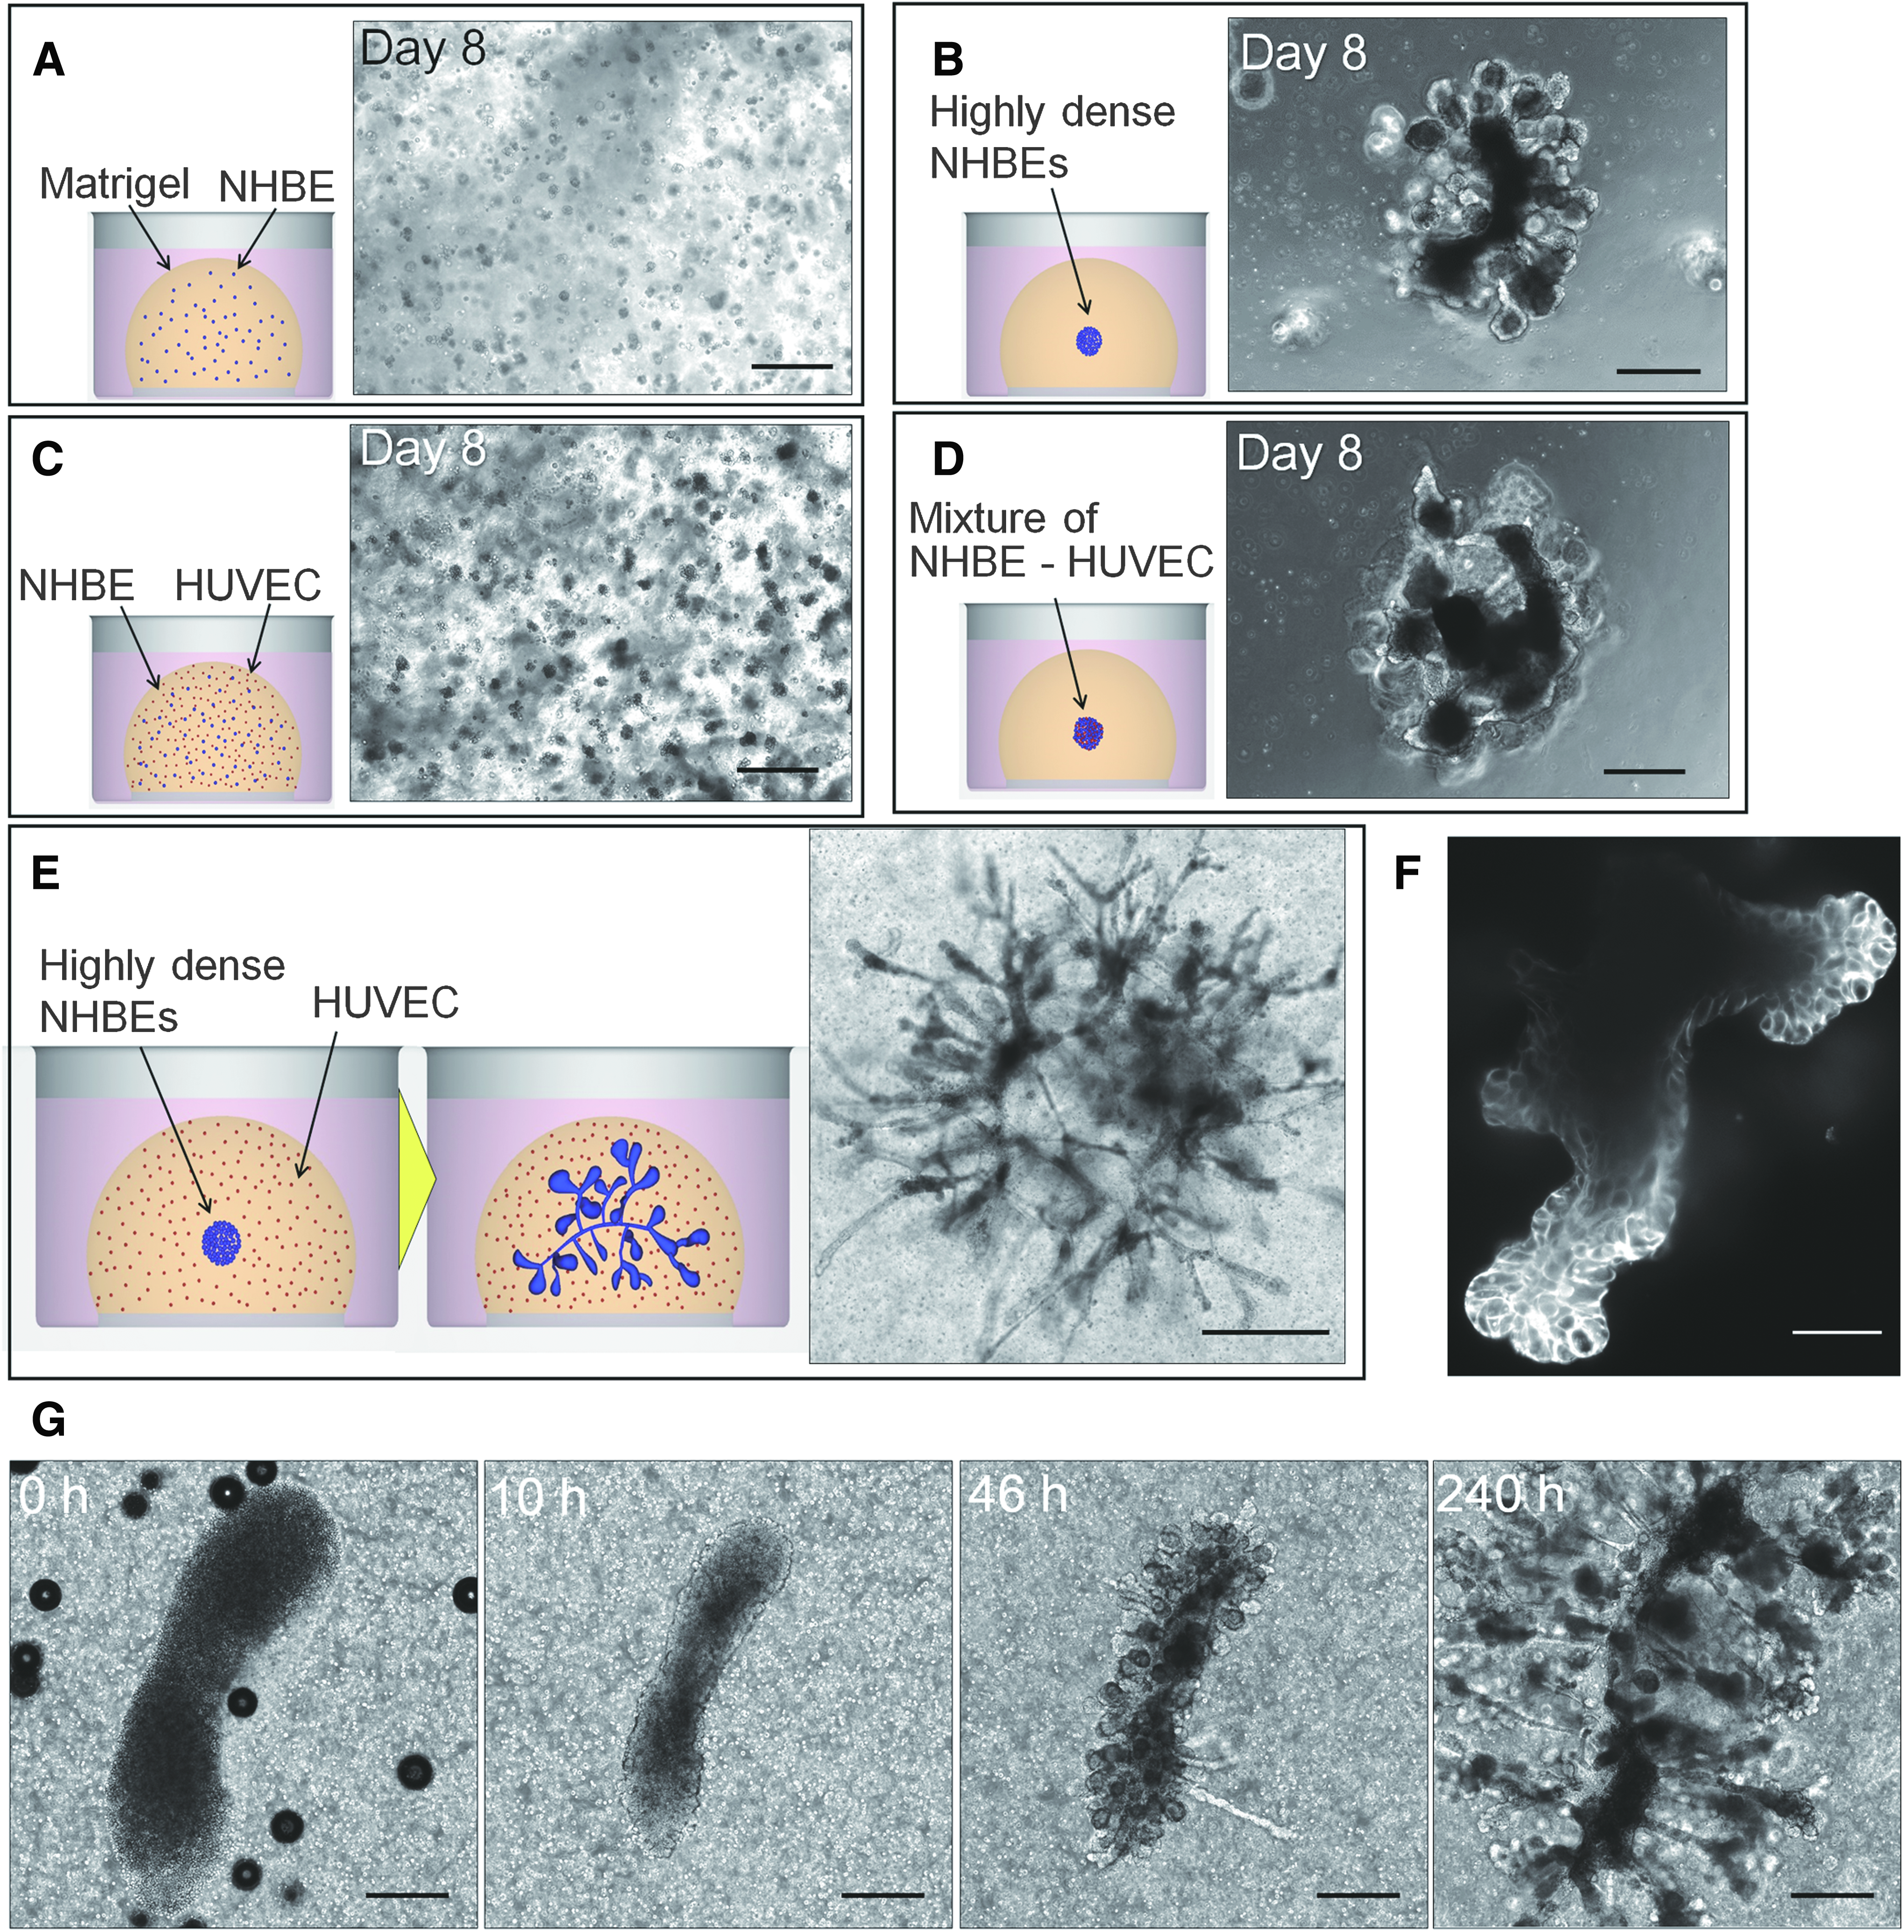
In vitro reconstruction of successive branches from primary bronchial epithelial cells.
This result indicates that the required morphogens in this system for secondary branch formation were either missing or not present in sufficient quantities. Thus, HUVECs were cocultured with NHBE cells to induce epithelial–endothelial interactions. When both cells were homogeneously distributed, no branching formation could be observed (Fig. 1C and Supplementary Video S2), similar to the results presented in Figure 1A., to enhance the physical contact between NHBE cells and HUVECs, a highly dense cell mixture of NHBE cells and HUVECs was placed at one spot (Fig. 1D and Supplementary Video S3); however, the results showed no distinct differences from the case presented in Figure 1B, and secondary branches were barely observed. On the other hand, when HUVECs were homogeneously distributed, whereas highly dense NHBE cells were placed at the center of Matrigel, NHBE cells developed secondary and tertiary branches that grew to the order of millimeter (Fig. 1E). The highly dense epithelial cell clot was remodeled to create the center shaft connecting each primary branch, and many successive branches were formed from the primary branches. Figure 1F shows the section image of developed branches staining F-actin by phalloidin and it reveals the branches that formed lumen structures.
The morphological changes accompanying these events over time are shown in Figure 1G and Supplementary Video S4. At the beginning, highly dense NHBE cells were injected into Matrigel with uniformly distributed HUVECs (0 h). The epithelial cells migrated toward the center of the epithelial distribution area and self-assembled to form a clot (10 h). After cell aggregation, epithelial cells migrated radially from the clot to form a primary bud, which continuously grew for 40–70 h. During formation of primary bud, some groups of cells formed rod-like elongated structures, but they returned to the clot after a certain period of time. Subsequently, the outward primary branches started to bifurcate to form secondary and tertiary branches from day 4 to day 10. During the whole process of epithelial cell branch formation, HUVECs barely migrated or proliferated. This long-term time-lapse observation revealed that epithelial dynamics continuously changed depending on the stage of the branching process. Cells did not simply migrate outward to form branches; instead, back and forth cell movements accompanied by cell communication were required for branch elongation and bifurcation. The developed model is widely available for researchers and it can provide new insight for developing mechanisms of lung.
Effect of HUVECs on branch formation
To analyze the function of HUVECs on epithelial branch formation, 3D culture experiments using different HUVEC densities (0, 200, 800, and 3200 cells/μL) were conducted. Figure 2A shows phase-contrast images of branches developed at day 8. The length of the primary branches increased with increasing HUVEC density in Matrigel, reaching saturation at very high HUVEC numbers (Fig. 2B). In the same manner, the number of successive branches formed on a primary branch increased with increasing HUVEC density (Fig. 2C). These results indicate that HUVECs supported primary branch outgrowth and induced subsequent branches.
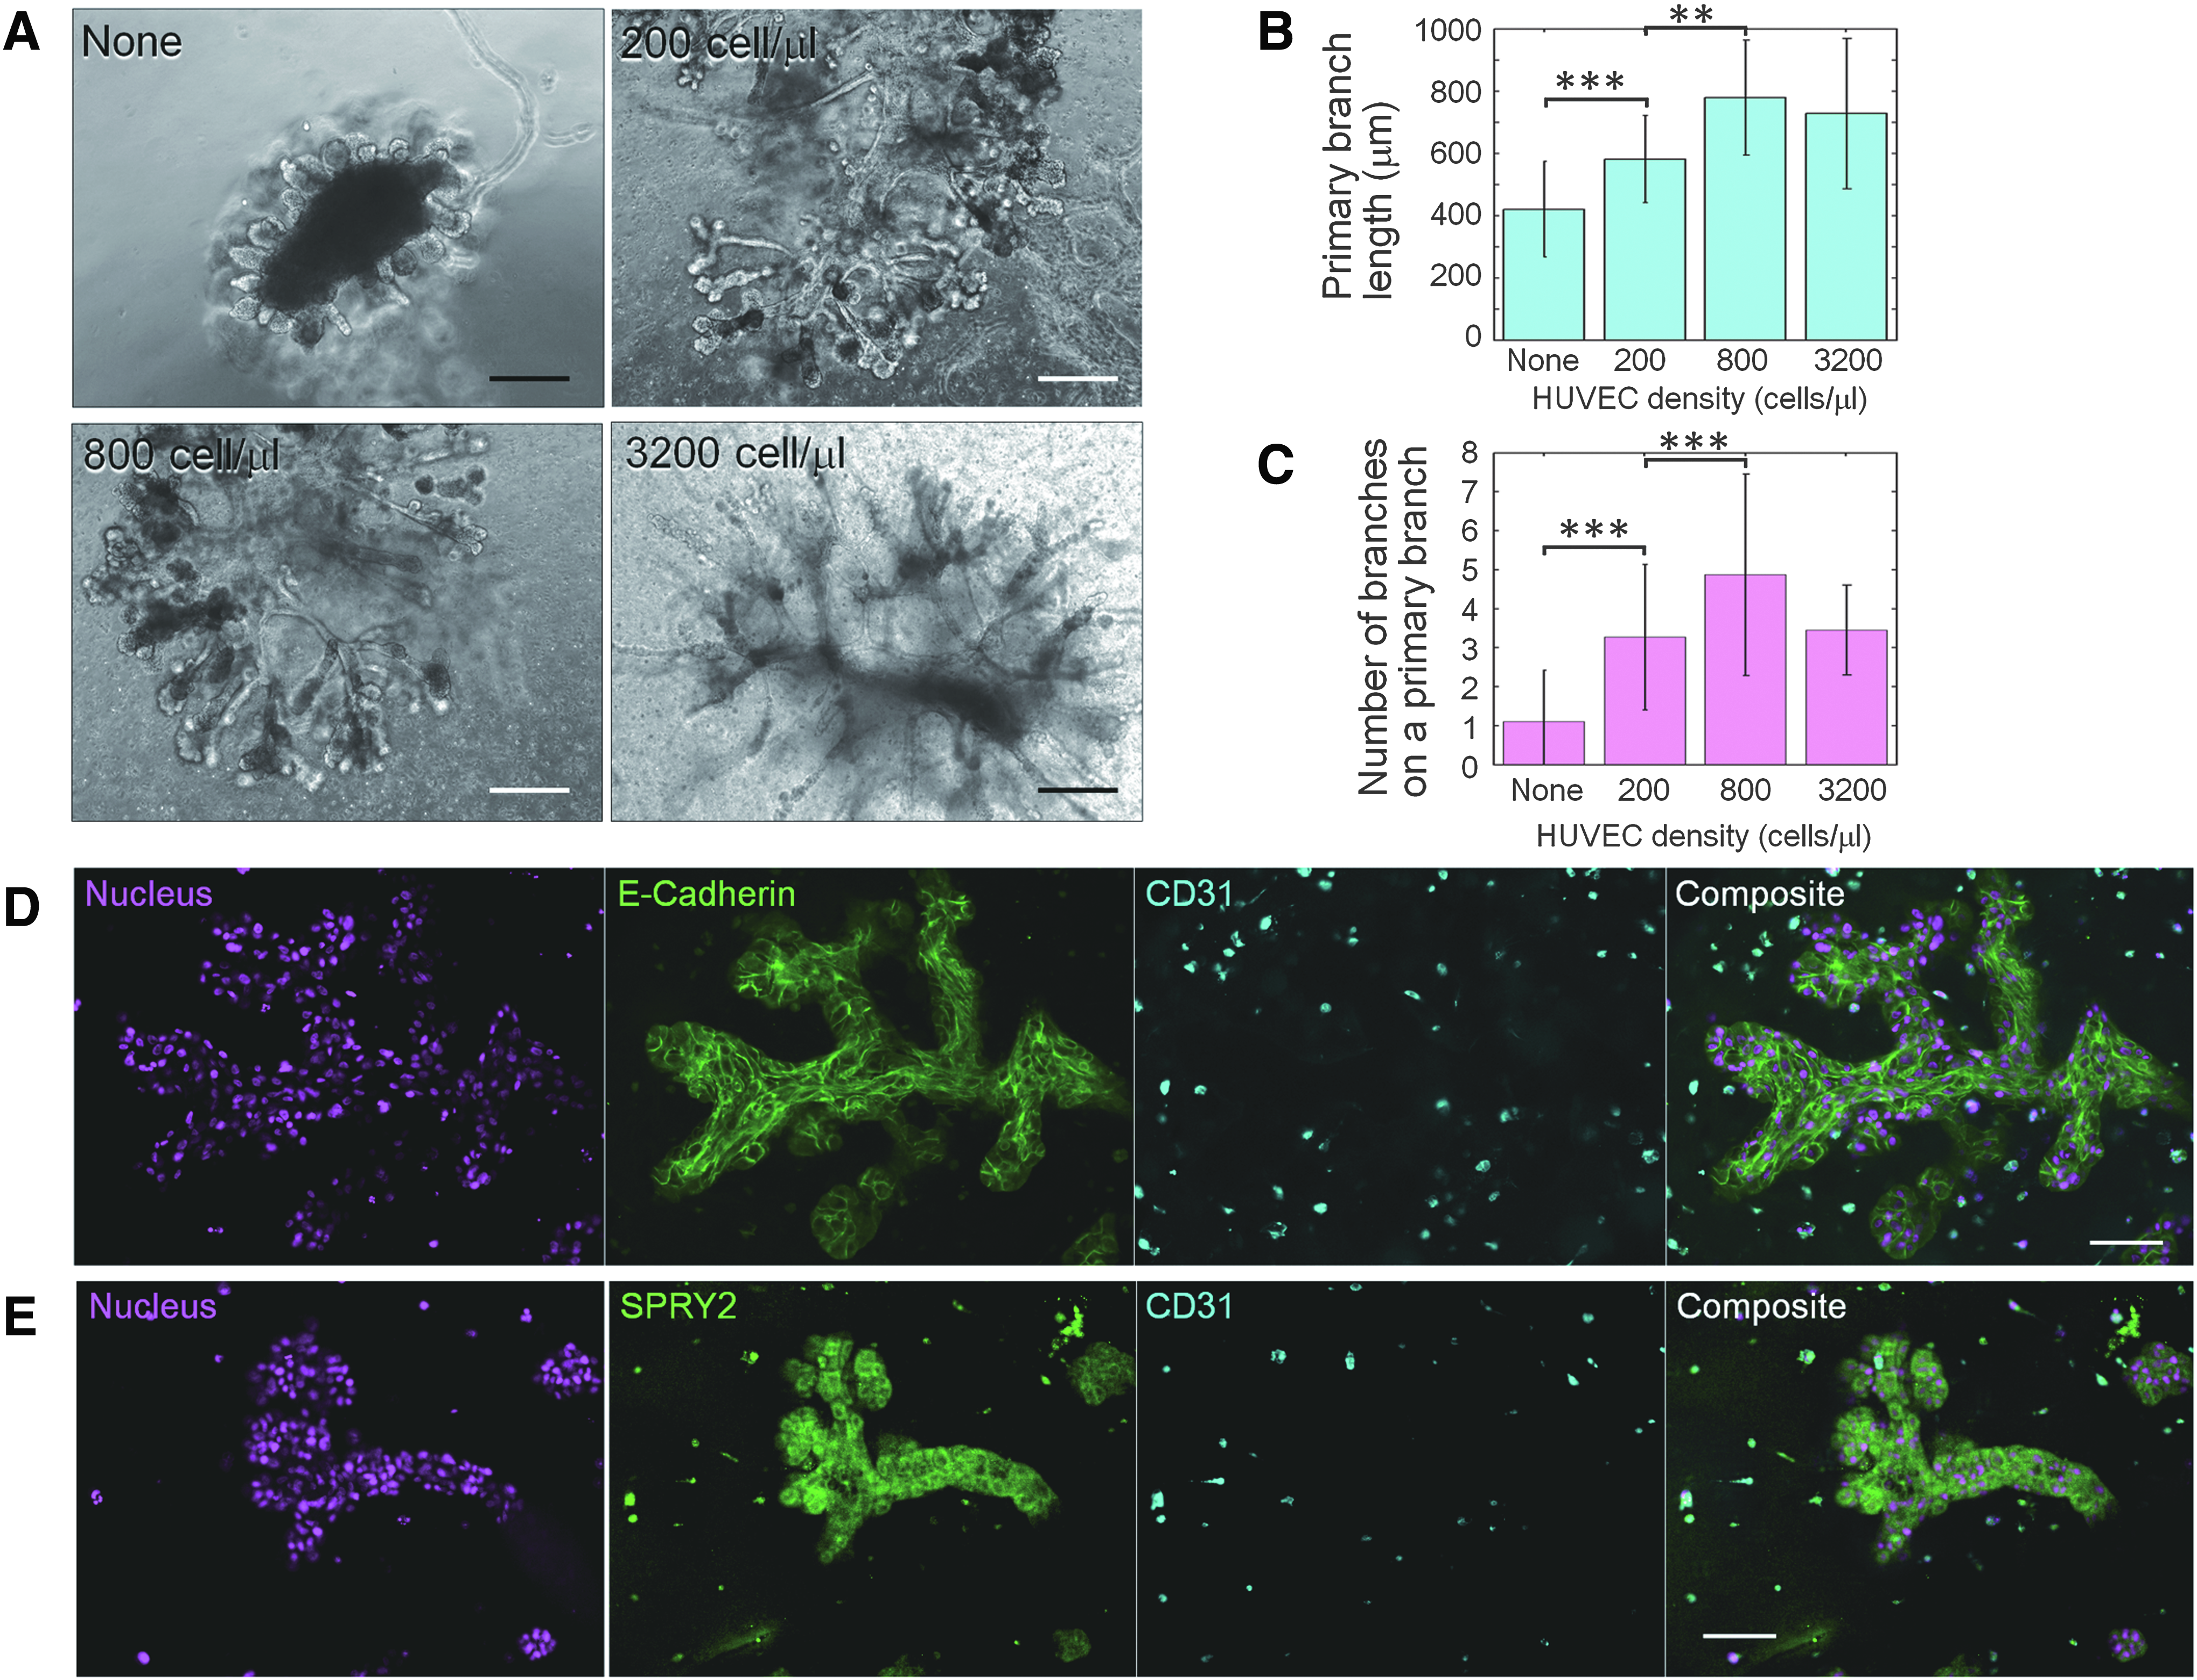
Interactions between HUVECs and bronchial epithelial cells.
The epithelial–endothelial interactions in the developed branch sections were analyzed by immunofluorescence. Figure 2D shows the physical interactions between epithelial cells and HUVECs stained by E-cadherin and CD31 antibody, respectively. The developed branches had almost no contact with HUVECs and HUVECs did not elongate at all. This result and the result presented in Figure 1D suggest that physical contact between epithelial and endothelial cells is not the key factor that induces bronchial tree formation. On the other hand, Figure 2E shows that the surrounding HUVECs expressed SPRY2, which is known to be one of the key regulators of branching morphogenesis. 20 SPRY2 leads to localized fibroblast growth factor 10 expression, 14 which is essential for successive bifurcations.5,21 NHBE cells also expressed SPRY2 uniformly. The result indicates a possibility that dotted SPRY2 derived from HUVECs enhanced SPRY2 localization on branches.
Figure 3A and B shows the expression of FGFR2 and SHH based on immunofluorescence images. The tip of the branches showed higher FGFR2 and SHH expression (Fig. 3C, D). These results are consistent with those of many previous reports of lung development obtained in vivo or in tissue cultures.2,4,21,22 Our in vitro model can facilitate the studies of molecular interactions in lung branching morphogenesis since it minimizes the number of cell–cell interactions required to form successive branches.
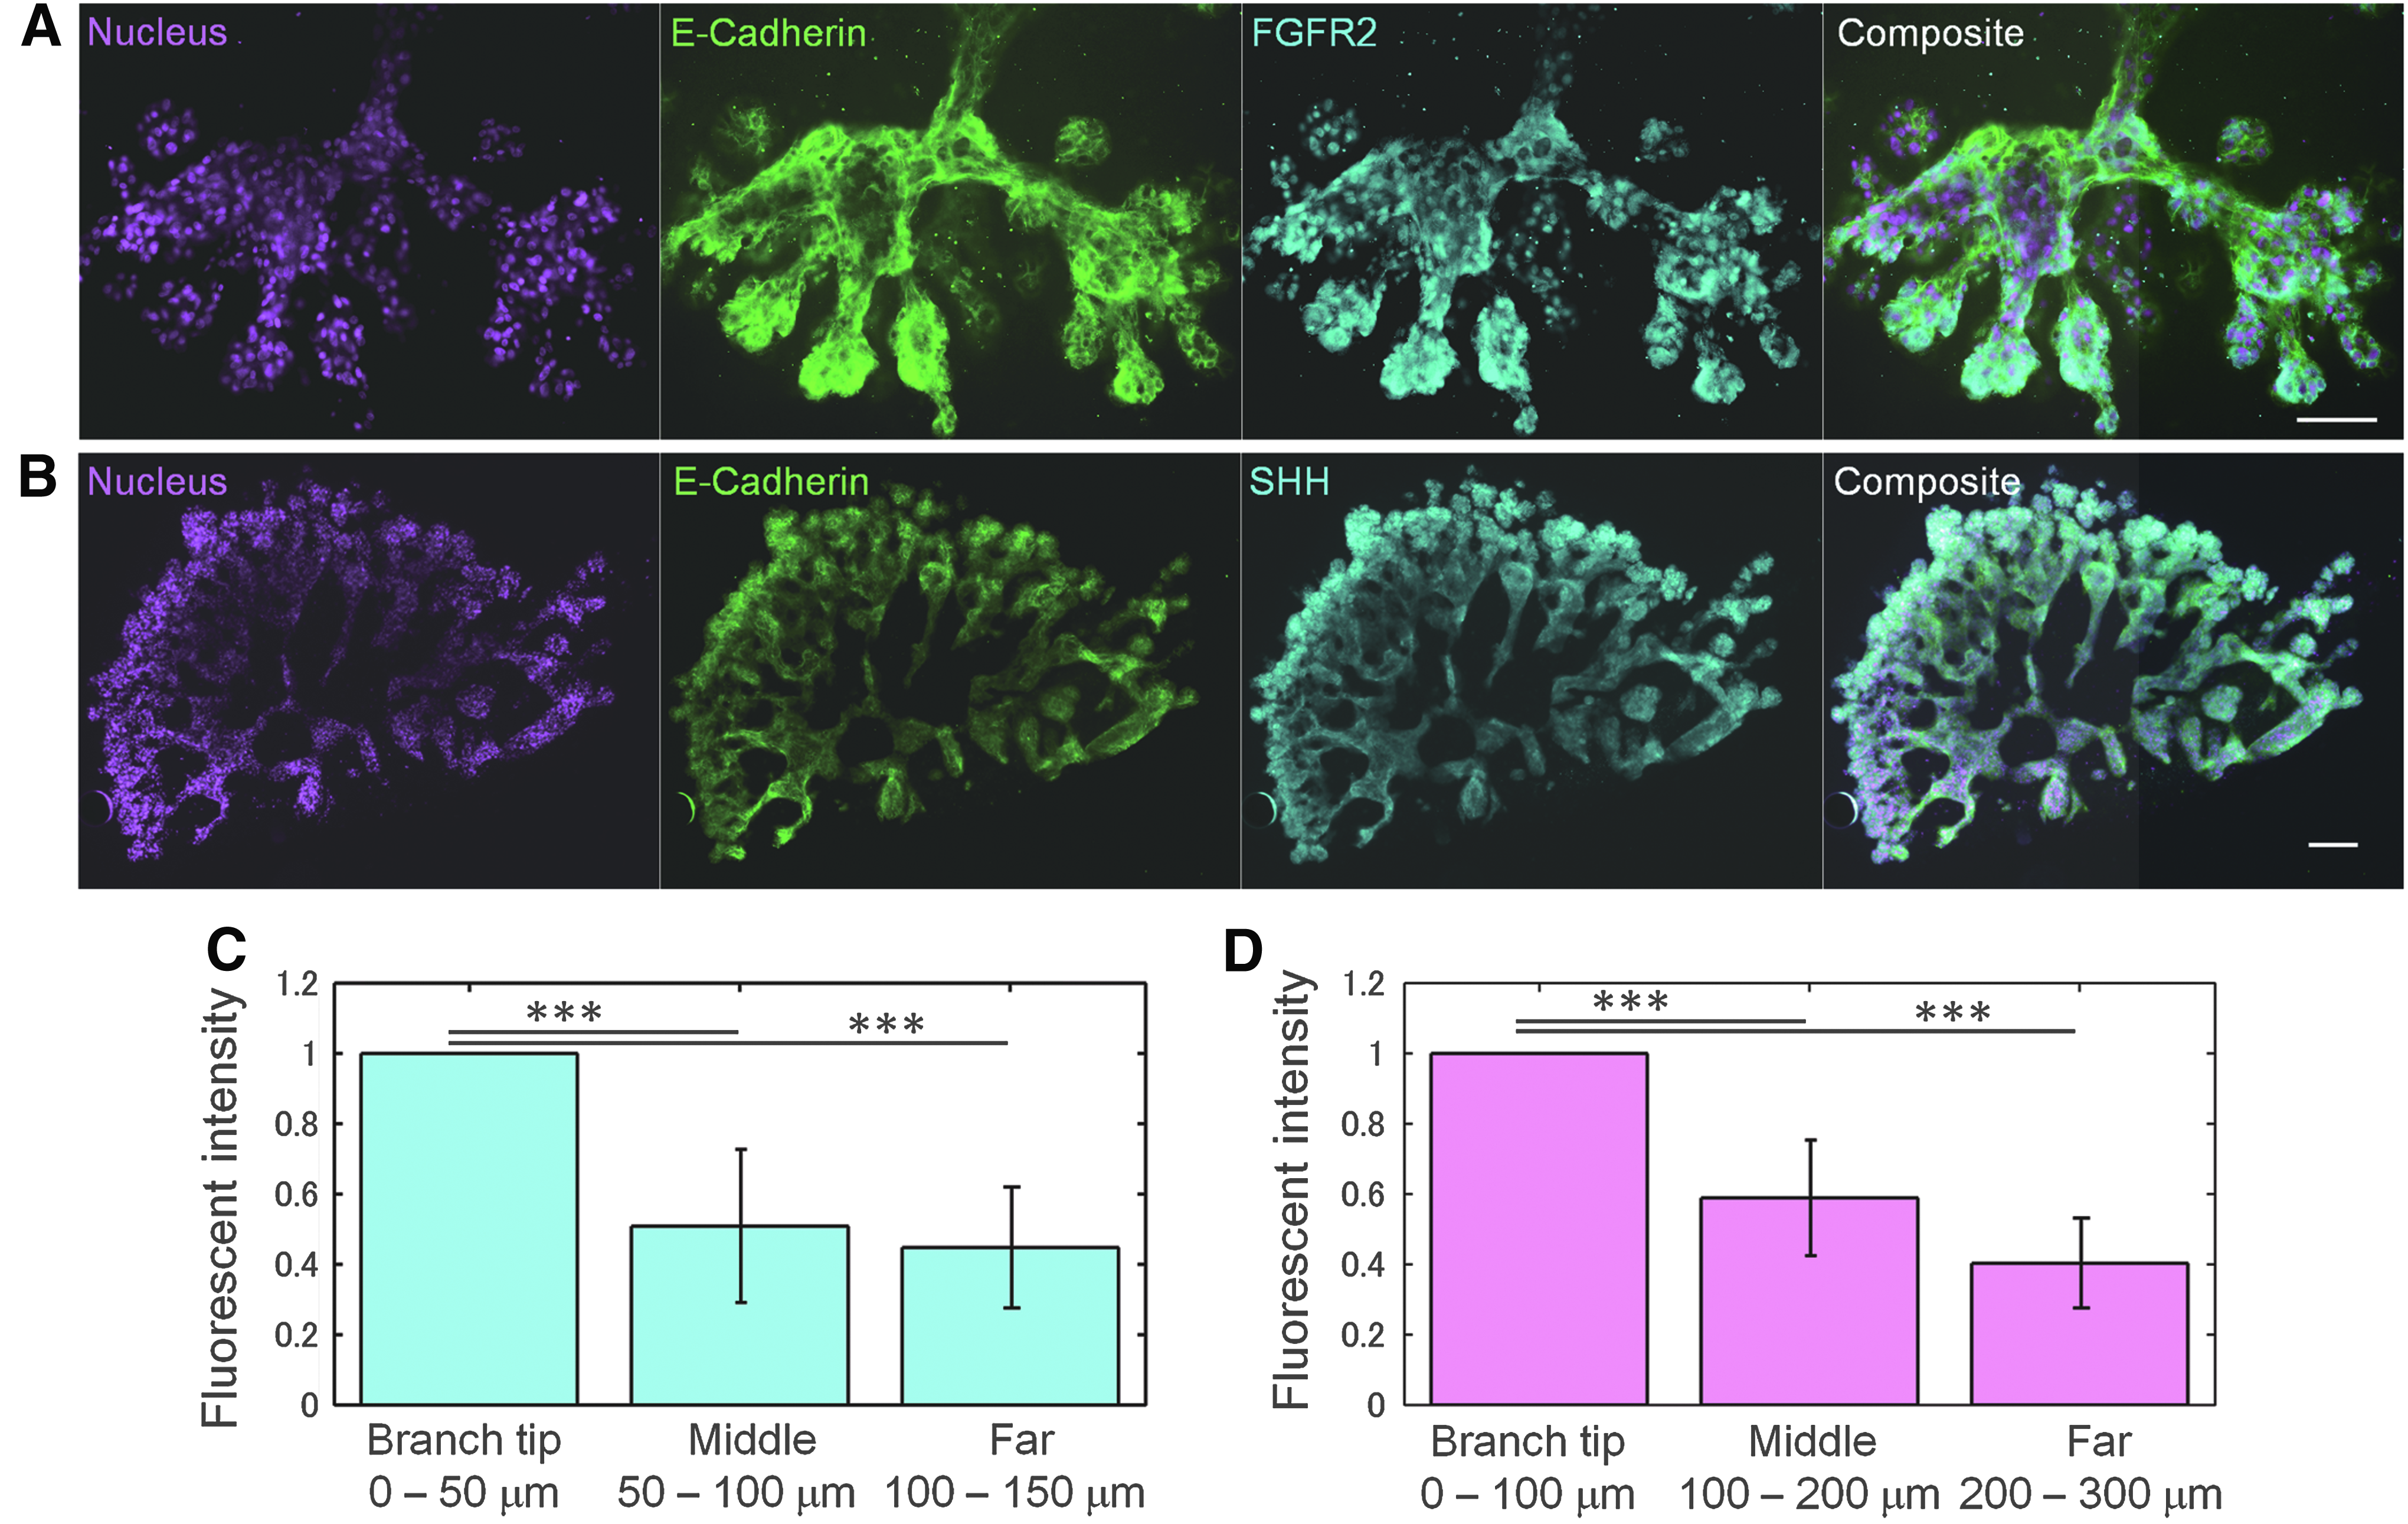
Immunostaining of SHH and FGFR2 on developed branches.
Epithelial cell dynamics during branch generation
Epithelial cell dynamics is a very important aspect of tissue formation, which is, however, quite difficult to observe in long-term time-lapse videos in vivo or in embryonic tissue culture. Since our system requires only epithelial cells, which are the target of observation, and endothelial cells, which do not migrate during the branching process, the long-term observation of cellar dynamics during the branching process becomes much easier; moreover, it does not require staining. By taking full advantage of the developed experimental model, various epithelial cell dynamics during bronchial tree formation were uncovered.
Step 1: Self-assembly
Immediately after culturing highly dense NHBE cells in Matrigel with uniformly distributed HUVECs, the epithelial cells migrated to the center of the cell distributed area (Fig. 4A and Supplementary Video S5). The cell movements leading to epithelial cell aggregation continued for ∼5 h, and the radius of the cell area was reduced by 380 μm, on an average (Fig. 4A). The dot colors in Figure 4B show the direction of migration of each epithelial cell. From the very beginning, cells moved directly to the center of the cell distribution area as if they knew where to go. Figure 4C shows the distribution of cell migration speed. Cell speed depended on the cell distance from the center, and cells in the outer area are showing lower speeds than cells in the inner area (Fig. 4D).
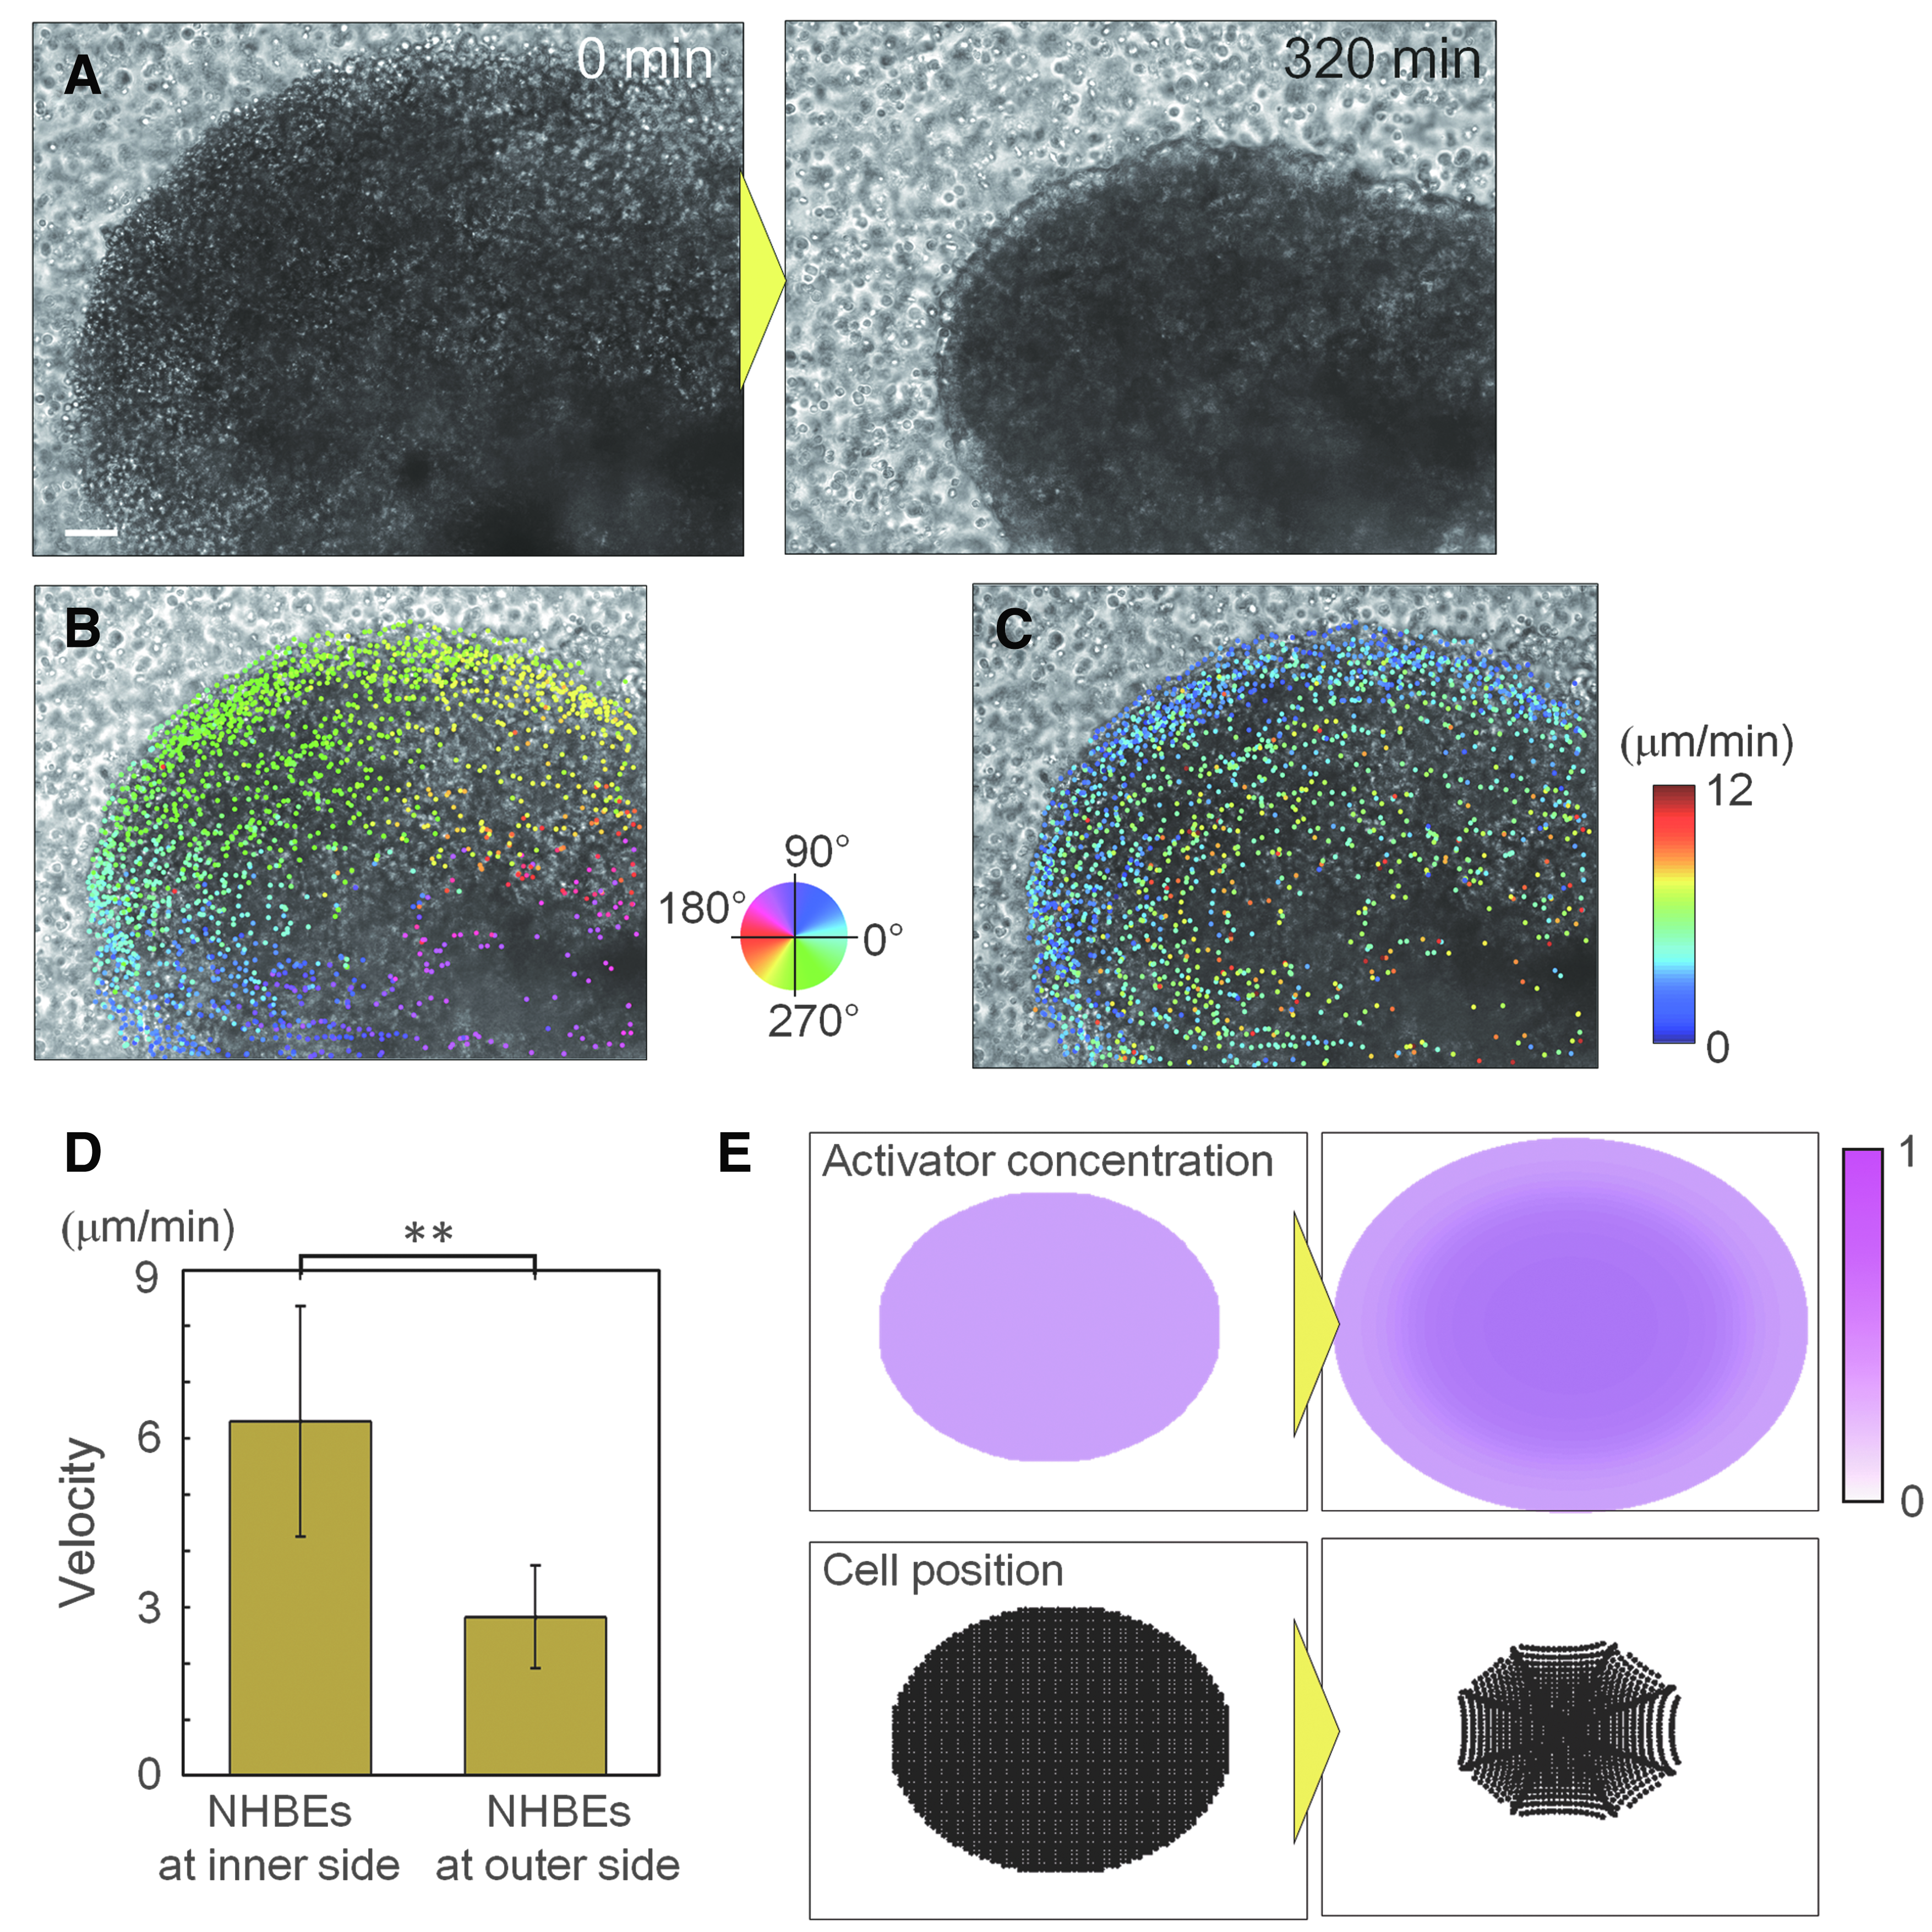
Analysis of cellular dynamics during the self-assembly process.
From these results, supposing epithelial cells secreted activator and they move toward areas with higher activator concentrations with a concentration-dependent velocity, the observed dynamics of cell aggregation can be explained. We conducted a simple computational simulation based on particle modeling, whose results agreed well with the experimental results. The activator secreted from cells diffused to a lower concentration area and it became higher at the center of the cell distributing area than the edge of the area because the number of surrounding cells was higher at the center. Consequently, cells migrated toward the center area and started aggregating (Fig. 4E and Supplementary Video S6).
Step 2: Migration with leader cells and rotational motion
After epithelial cells aggregated and formed a cell clot, leader cells followed by collective cells emerged to form long finger-like structures (Fig. 5A and Supplementary Video S7). Immediately after formation of the cell clot, a small group of epithelial cells (1–4 cells) appeared to explore the area surrounding the clot as leader cells, followed by a collective cell. Within a few hours, the elongated collective cells reached a length of 100 μm. These results are consistent with those of a previous study, in which a Drosophila embryo was used to study lung development. 13 Subsequently, the leader cells suddenly disappeared and the growth direction was reversed to its point of origin (blue asterisk in Fig. 5A). After a certain time period, most of the leader cells no longer existed and the branches were shortened. Then, the cells on the branches performed a rotational motion, with cells at the branch tip continuously changing, forming a 3D branch. Branches without leader cells were stably growing over a longer period of time and cells performed a continuous rotational motion. The cells seemed to have no preference of rotational direction.
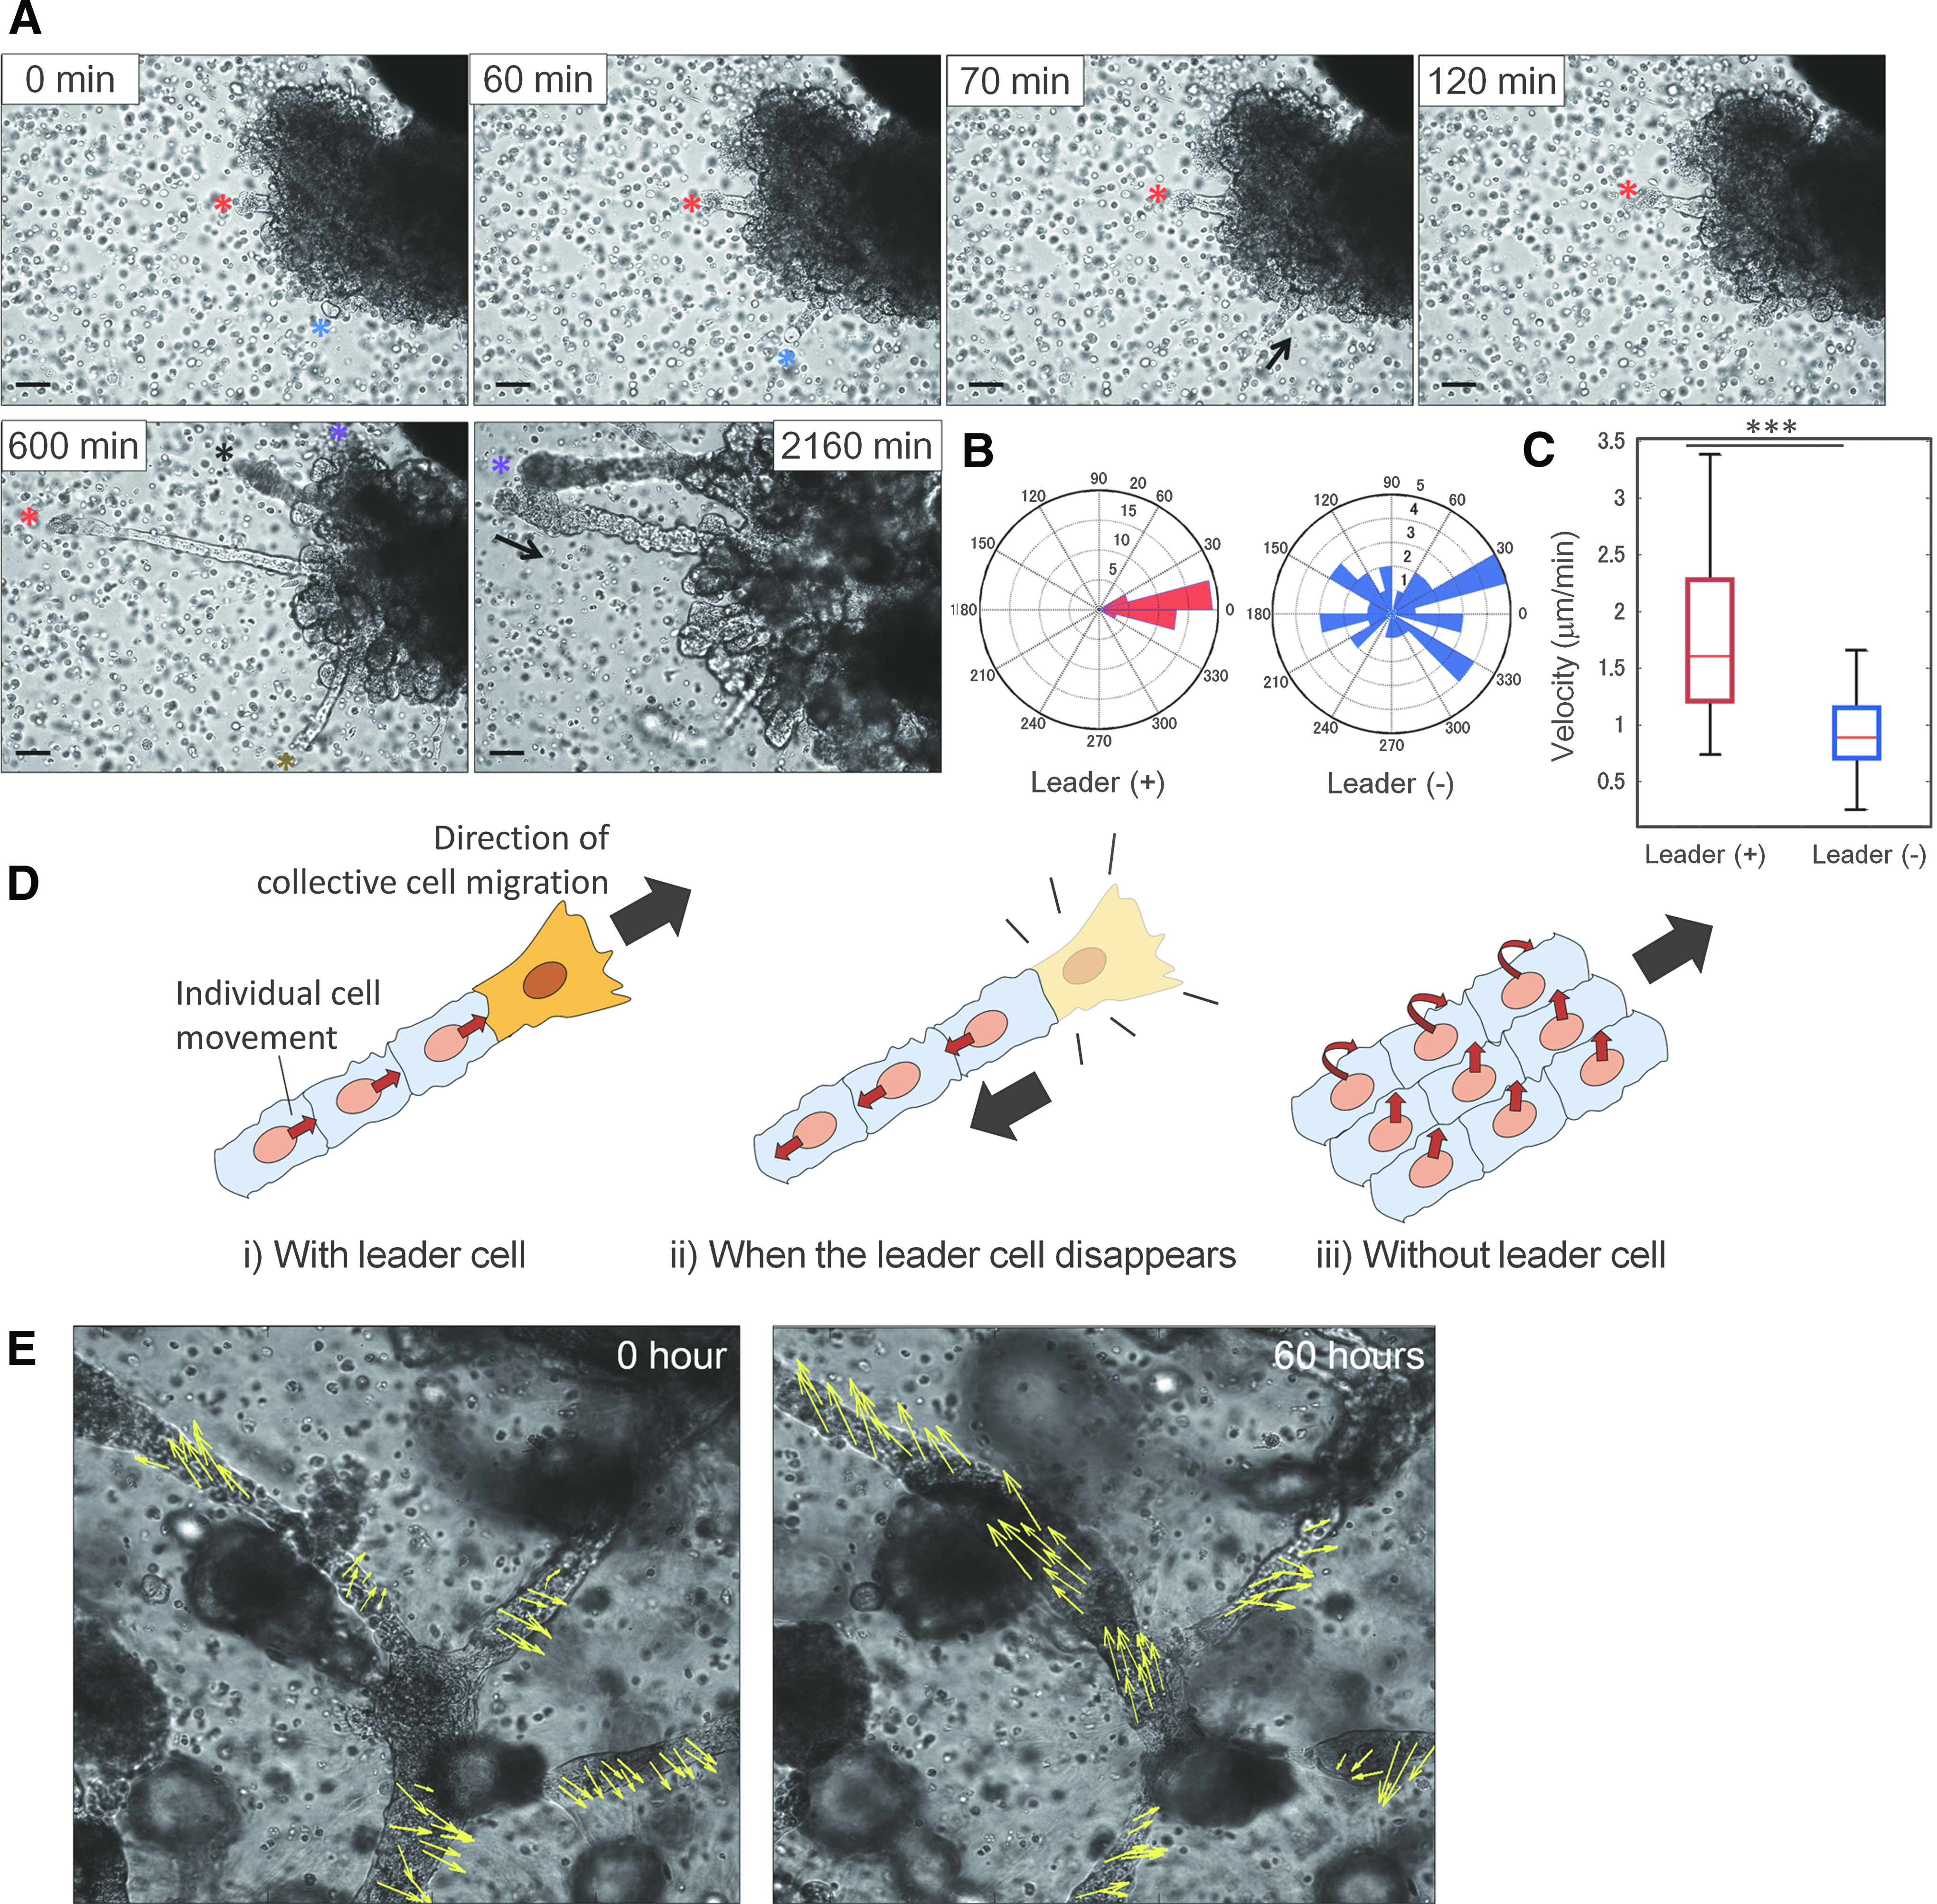
Epithelial cell dynamics during branching morphogenesis.
The leader cells can be identified by their large size at the leading edge of branch tip as well as the presence of follower cells caused by strong traction force from leader cells.23,24 When leader cells were present, the direction of cell movement corresponded to that of branch elongation, whereas it varied in the absence of leader cells (Fig. 5B). Furthermore, cell migration speeds were higher in the presence of leader cells (average speed = 1.8 μm·min−1) than in the absence of leader cells (average speed = 0.9 μm·min−1) (Fig. 5C). A schematic diagram of cell migration is shown in Figure 5D. At the beginning, a leader cell emerged, generating a longitudinal force that pulled the follower cells in a straight line to form a finger-like structure. 28 Once the leader cell disappeared, the tensile force acting on the follower cells resulted in a reversal in the direction of movement and the cells returned to their original position. Subsequently, 3D cell migration ensued to further elongate the branches. To date, many studies have reported two-dimensional collective cell migration of Madin–Darby canine kidney leader cells23–27 ; the result shows that cellular dynamics depending on leader cells are also present in 3D during lung development.
Step 3: Spiral motion
After the primary branches were formed, the cellular dynamics changed over a long period of time, resulting in the formation and maintenance of successive branches. In successive branches, we observed both planar and spiral epithelial cell motions (Supplementary Video S8). Figure 5E shows the projected direction of cellular movement in each branch and the dynamic changes that occurred over time. The arrows show the results of tracking each cell for 1 h, with the arrow length corresponding to the three times amplified projected migration length. All cells moved continuously in developed branches and no leader cells were observed to explore the area outside the branches, unlike the case of primary branch formation. Cellular dynamics involving right-handed spiral motions, left-handed spiral motions, and planar movements against the branch axis were observed, but cells collectively moved with their neighbor in each branch. Interestingly, as the branch shape gradually changed, the direction of cell motion in the branch also gradually changed. Some branches containing left-handed spiral cell movement changed to a right-handed spiral, while others containing right-handed spiral movement changed to planar motions in the opposite direction. To elucidate the mechanisms of collective directional cell movement during successive branch formation in the lung, a mathematical model based on our experimental model may be a suitable tool.
Discussion
In summary, we have achieved reconstruction of a bronchial tree in vitro using primary human epithelial cells. A high density of epithelial cells was required to initiate self-assembly events and primary branch formation. Subsequently, homogeneously distributed HUVECs supplied key morphogens to epithelial cells to generate successive branch formation. The branches grew longer than 1 mm, and secondary and tertiary branches were generated. It can be considered that HUVEC-derived molecules such as SPRY2 rather than direct cell–cell interactions are the key factors in bronchial tree generation because of the fact that enhancing physical epithelial–endothelial contacts does not encourage bifurcations.
The developed experimental model has the capability to facilitate the study of lung development and disease. The model requires only two types of cells, and it supports long-term visualization of cellular dynamics, which is quite difficult in tissue culture or in vivo experiments. To illustrate the capability of our experimental model, time-lapse measurements over a week were conducted. A total of 2880 images were taken with 5-min intervals for 10 days of culture to analyze rapid collective cell migration during branch formation. They revealed that cellular movements dynamically changed during branching events; self-assembly, collective cell migration with leader cells, rotational motion, and spiral motions of epithelial cells were observed during the development of the bronchial tree. The branches kept growing and developed parts were maintained for 10 days and then saturated. In each event, cells seemed to know where to go to organize branch formation. It should have rules to govern such cellular dynamics and a mathematical model can be a suitable tool to elucidate the underlying system. Indeed, the results from a simple molecular diffusion simulation matched the experimental self-assembly process we observed in vitro. This simulation shows only a small part of the system of cellular dynamics and many undefined mechanisms still exist; however, our experimental platform can be a powerful tool for further insight.
Unlike in vivo experiments, the controllability of 3D microenvironment is another great advantage of the in vitro experimental model.28–30 Bioengineering approaches to control culture environments enhance the agreements with theoretical model 31 and they help to uncover the underlying complex system of morphogenesis. The technologies can be installed in the developed experimental model to advance the understanding of cellular dynamics and branching mechanisms of lungs.
Footnotes
Acknowledgments
This work was financially supported by JSPS KAKENHI (15H05512), a Grant for Basic Science Research Projects from the Sumitomo Foundation (140848), JGC-S Scholarship Foundation (1630), and the Program to Disseminate Tenure Track System, MEXT, Japan.
Disclosure Statement
No competing financial interests exist.
References
Supplementary Material
Please find the following supplemental material available below.
For Open Access articles published under a Creative Commons License, all supplemental material carries the same license as the article it is associated with.
For non-Open Access articles published, all supplemental material carries a non-exclusive license, and permission requests for re-use of supplemental material or any part of supplemental material shall be sent directly to the copyright owner as specified in the copyright notice associated with the article.