
Abstract
Methods for the lineage identification of cell or tissue-engineered therapeutics must provide a high degree of performance to confidently distinguish the intended cell type from other lineages that could be present in the finished product. For many applications, these methods also require rapid, high-throughput capability. In this work, methods for the identification of autologous cultured chondrocytes for implantation were investigated. A histological analysis confirmed that fibrous tissue occasionally present in biopsies procured for autologous chondrocyte implantation production comprised synovium. Chondrocyte and synovial cell cultures were then examined using a full transcriptome microarray analysis, which revealed cartilage link protein and microfibril-associated glycoprotein-2 (MAGP2) as the most differentially expressed transcripts between the culture types. Performance characteristics of gene expression assays formed by the analysis of cartilage link protein with normalization to either standard reference genes or to MAGP2 were evaluated. The results demonstrate that the MAGP2-based assay provided superior performance for the purpose of cell culture identification compared to assays using standard reference genes. The selectivity against synovial and heterogeneous samples provided by the novel assay suggests it as an appropriate lineage identification method for cell cultures derived from cartilage.
Introduction
Once removed from the cartilage matrix, chondrocytes quickly dedifferentiate,1,2 a process that includes downregulation of expression of cartilage genes and conversion to a fibroblastic phenotype. Cultured chondrocytes therefore become less distinguishable from fibroblastic cells that could potentially contaminate the final product. In this regard, synovial cells are of particular interest since it is believed that these cells may be present in the cartilage biopsies procured as starting material for ACI production. This belief stems from previous observations of fibrous tissue in some ACI biopsies. 3 It is also well understood from studies of the transition between articular cartilage and joint capsule that the synovial membrane merges into the cartilage surface in a continuous manner at the cartilage–synovium junction, and there is some degree of overlap between the tissues in this region.4–6 Other potential sources of synovial contamination to ACI biopsies are tissue fragments 7 and individual cells 8 present in the synovial fluid of the knee. In a previous report we described the development of a DNA methylation analysis capable of discriminating chondrocyte cultures from synovial cultures with a high degree of certainty. 3 However, cultures derived from fibrous tissue dissected from the cartilage junction could not be confidently classified as either chondrocytic or synovial, and may have contained a mixture of cell types. Therefore, an acceptable lot release identity assay for cultured chondrocytes must not only detect chondrocytes, but also discriminate against synovial and heterogeneous cell cultures. In addition, the assay must be rapid to accommodate production and shipping schedules for cell therapies, which typically have a shelf life of a few days.
Our initial efforts in this area were focused on evaluating expression of various candidate chondrocyte markers in both cell types; however, assays based on known genes did not provide an acceptable level of performance for this purpose. We then conducted full transcriptome microarray analysis of human chondrocyte and synovial cell cultures (Rapko et al., unpublished data). From this work we identified a previously unknown synovial marker, microfibril-associated glycoprotein-2 (MAGP2), and also determined that cartilage link protein (CRTL1) is the most highly expressed gene in chondrocyte cultures relative to synovial cultures. In the present report we demonstrate that a quantitative reverse transcription-polymerase chain reaction (RT-PCR) assay based on MAGP2 and CRTL1 distinguishes chondrocyte from synovial cultures, and has superior resolving power against mixed cultures when compared to assays based on standard markers. The assay is also rapid and robust, and therefore suitable as a product release assay for ACI and MACI products.
Materials and Methods
Tissue analysis
Fibrous tissues present in two human biopsies submitted for ACI were analyzed histologically. The samples were fixed in 10% neutral buffered formalin for at least 24 h at 4°C for subsequent histological analysis. Study of gene expression in porcine tissues was performed using stifle joints from skeletally mature domestic pigs obtained from a local farm. Porcine tissues were analyzed in this work because of limited access to human tissue. Tissue processing occurred within 24 h of slaughter, with the tissue stored at 4°C in the meantime. Articular cartilage was obtained from the lateral femoral condyle. Fibrocartilage was sampled from the lateral meniscus. Synovium was dissected from the joint capsule near the junction with the trochlea. Samples of articular cartilage and synovium were taken from three separate animals. Fibrocartilage was taken from two of the animals. Each sample was divided into two pieces: one was rinsed four times in phosphate-buffered saline and used for RNA isolation, and the other piece was fixed for histology as described above.
For histological analysis, fixed tissues were dehydrated through an ethanol series, paraffin embedded, sectioned to 5 μm, and mounted on glass slides. Sections were stained with hematoxylin and eosin, and photographed on a Nikon DXM1200F digital camera and ACT-1 imaging software (Nikon). Human and porcine tissue samples were evaluated for the presence of synovial and fibrous connective tissue by a board certified pathologist.
Human cell culture
Human articular cartilage was obtained from either the National Disease Research Interchange (NDRI) or from excess material from biopsies submitted for ACI production (Carticel®; Genzyme Biosurgery). Human chondrocyte cultures were isolated and cultured using the Carticel production method as previously described. 3 Briefly, chondrocytes from articular cartilage were isolated using sequential digestion with collagenase and trypsin, or with pronase and collagenase, and then plated in tissue culture flasks with the medium consisting of Dulbecco's modified Eagle's medium supplemented with 9.1% fetal bovine serum and gentamicin. Cultures were maintained in 10% carbon dioxide at 36.5°C with medium changes occurring every 2 to 4 days. Chondrocyte cultures were trypsinized upon reaching 50% to 100% confluence, with the primary or secondary cultures cryopreserved before subsequent passaging. Cell cultures were also derived from fibrous tissues dissected from the cartilage junction, which were previously described as “apparent synovium present in cartilage biopsies.” 3 These tissues were present in three biopsies submitted for ACI, and cell cultures were established as described previously. 3 In the present work, these cultures are referred to as “junction cultures.” Briefly, fibrous tissue dissected from the cartilage junction was subjected to sequential digestion with collagenase and trypsin. Cells isolated from the enzymatic digest were cultured as described above. Human synovial tissue was obtained from NDRI and cultures were established as described previously. 3 Briefly, synovium was subjected to sequential digestions with trypsin, collagenase, DNase, or a combination of any of the three. Cells isolated from the enzymatic digest were cultured as described above. Additional synovial and dermal fibroblast cultures were purchased (Cell Applications Inc.). The donor age range for the chondrocyte cultures, where known, was 14 to 56 years (mean 30 years). The range for the synovial cell cultures, where known, was 20 to 82 years (mean 59 years). The range for the dermal fibroblast cultures, where known, was 36 to 77 years (mean 55 years).
Gene expression in human cell cultures
To evaluate gene expression levels in a representative number of human samples, 34 chondrocyte, 18 synovial, and 10 dermal fibroblast strains were cultured. For this work, primary cultures were considered the first passage and denoted as P1. The subsequent passages were denoted incrementally. Chondrocyte and dermal fibroblast cultures tested in this evaluation were third passage (P3), and the synovial cultures were P3 or P4. Gene expression levels of the three junction cultures were also tested at P3. These three cultures had previously undergone characterization of tissue-specific differentially methylated regions of the genomic DNA, which discriminated synovial cells from chondrocytes, 3 and were referred to as strains V-42, V-67, and V-71.
RNA preparation and RT-PCR
RNA was isolated from cell culture samples using the RNeasy Mini Kit (Qiagen). Complimentary DNA (cDNA) was synthesized using the High Capacity cDNA Kit (Applied Biosystems Inc.). Quantitative real-time PCR (QPCR) of the human cDNAs was performed on an ABI 7500 Fast System in Fast mode using TaqMan Fast Universal mix (Applied Biosystems Inc.). Primers and probes used for QPCR were designed using Primer Express 3.0 (Applied Biosystems Inc.).
Human primer and probe (Applied Biosystems Inc.) sequences indicated by symbol and GenBank accession and given in the 5′ to 3′ direction were as follows:
CRTL1 (official symbol HAPLN1, NM_001884.2) Forward TGAAGGATTAGAAGATGATACTGTTGTG Reverse GCCCCAGTCGTGGAAAGTAA Probe VIC-TACAAGGTGTGGTATTCC-MGBNFQ MAGP2 (official symbol MFAP5, NM_003480.2) Forward CGAGGAGACGATGTGACTCAAG Reverse AGCGGGATCATTCACCAGAT Probe 6FAM-ACATTCACAGAAGATCC-MGBNFQ Glyceraldehyde-3-phosphate dehydrogenase (GAPDH) (NM_002046.3) Forward ATGGGGAAGGTGAAGGTCG Reverse TAAAAGCAGCCCTGGTGACC Probe 6FAM-CGCCCAATACGACCAAATCCGTTGAC-MGBNFQ.
For COL1A1 (NM_000088.3) we used TaqMan gene expression assay Hs00164004_m1 (Applied Biosystems Inc.).
RNA was prepared from porcine tissues by first grinding the tissue to a fine powder in a liquid-nitrogen-cooled mortar. RNA was then isolated using TRIzol (Invitrogen), digested with Turbo DNase (Applied Biosystems Inc.), and purified with the RNeasy Mini Kit. Porcine cDNA was prepared as described above. QPCR of the porcine cDNAs was performed on an ABI 7500 Fast System in Standard mode using Power SYBR Green mix (Applied Biosystems Inc.).
The porcine primer sequences indicated by symbol and GenBank accession and given in the 5′ to 3′ direction were as follows:
CRTL1 (NM_001004028.1) Forward TGAGGTGATTGAAGGATTAGAAGATG Reverse GCCCCAGTCGTGGAAAATAG MAGP2 (AY610418.1) Forward CGAGGAGATGATGTGACTCCAGTA Reverse AGCAGGTTCATCGACCAGATTAG GAPDH (AF017079.1) Forward GTCACCAGGGCTGCTTTTAACT Reverse ACCATGTAGTGGAGGTCAATGAAG
A melting curve analysis was performed after the PCR to confirm specificity of the SYBR green amplifications. For both the TaqMan and SYBR green methods, quantification of gene expression was performed by subtracting the reference gene Ct from the gene of interest Ct to obtain the ΔCt. The gene expression level was then calculated as 2−ΔCt.
Titration experiments
Mixtures of cells were prepared with freshly harvested second- or third-passage chondrocyte and synovial cell cultures. These cell strains (strains V-07, V-09, V-18, V-20, V-24, and V-27) were previously characterized using DNA methylation analysis. 2 For experiment 1, P3 cultures were used. P2 cultures were used in experiments 2 and 3. The concentrations of the cell suspensions were determined by taking the average of two hemacytometer counts. Mixtures of cultured cells were prepared containing 0%, 25%, 50%, 75%, and 100% chondrocytes, with the balance synovial cells. The samples were then analyzed for CRTL1 gene expression with various reference genes (GAPDH, COL1A1, and MAGP2) for normalization, and the results plotted versus the percent chondrocytes in each sample. For each experiment, the minimum percent chondrocytes required to be classified as the chondrocyte lineage were estimated by interpolating the two data points flanking the classification threshold, and calculating the intercept of the resulting line with the threshold.
Statistical analysis
Grouped data are expressed as the mean or the mean ± standard deviation. Mann–Whitney U-tests were performed on the data from the human cell cultures with JMP 7.0 software (SAS Institute Inc.). For the U-tests, differences between sample sets were considered significant when p-values were <0.025. To test whether the gene expression of human chondrocyte cultures followed a normal distribution, data were examined before and after log10 transformation using the Shapiro–Wilk W-test (JMP 7.0). For the W-test, p-values <0.05 were considered a significant departure from normality. Classification thresholds for each gene expression assay were then established as the chondrocyte culture mean minus 2 standard deviations. Student's t-tests (paired, two-tailed) were performed on the data from the titration experiments using Excel software (Microsoft Corp.). For the t-tests, differences between sample sets were considered significant when p-values were <0.025.
Results
Human tissue investigation
Samples of fibrous tissues present in two human cartilage biopsies submitted for ACI were examined histologically to identify the tissue. On the basis of an initial visual and tactile inspection, the sample from biopsy 1 was considered to be fibrous tissue. This sample had a membranous appearance and lacked the rigidity of typical articular cartilage. Upon initial inspection, the sample from biopsy 2 appeared to contain fibrous tissue attached to cartilage. The hematoxylin and eosin–stained slides prepared from these samples were evaluated by a board-certified pathologist (E.H.), and both samples were found to contain normal synovium (Fig. 1A, B). These results confirmed that synovium was present in some cartilage biopsies submitted for ACI. Interestingly, the synovium in the biopsy 1 sample was attached to a thin piece of cartilage (Fig. 1A), which was not apparent during the initial inspection. For the sample from biopsy 2, a region of cartilage (not shown) was found attached to the synovium, confirming the initial inspection results for this sample.
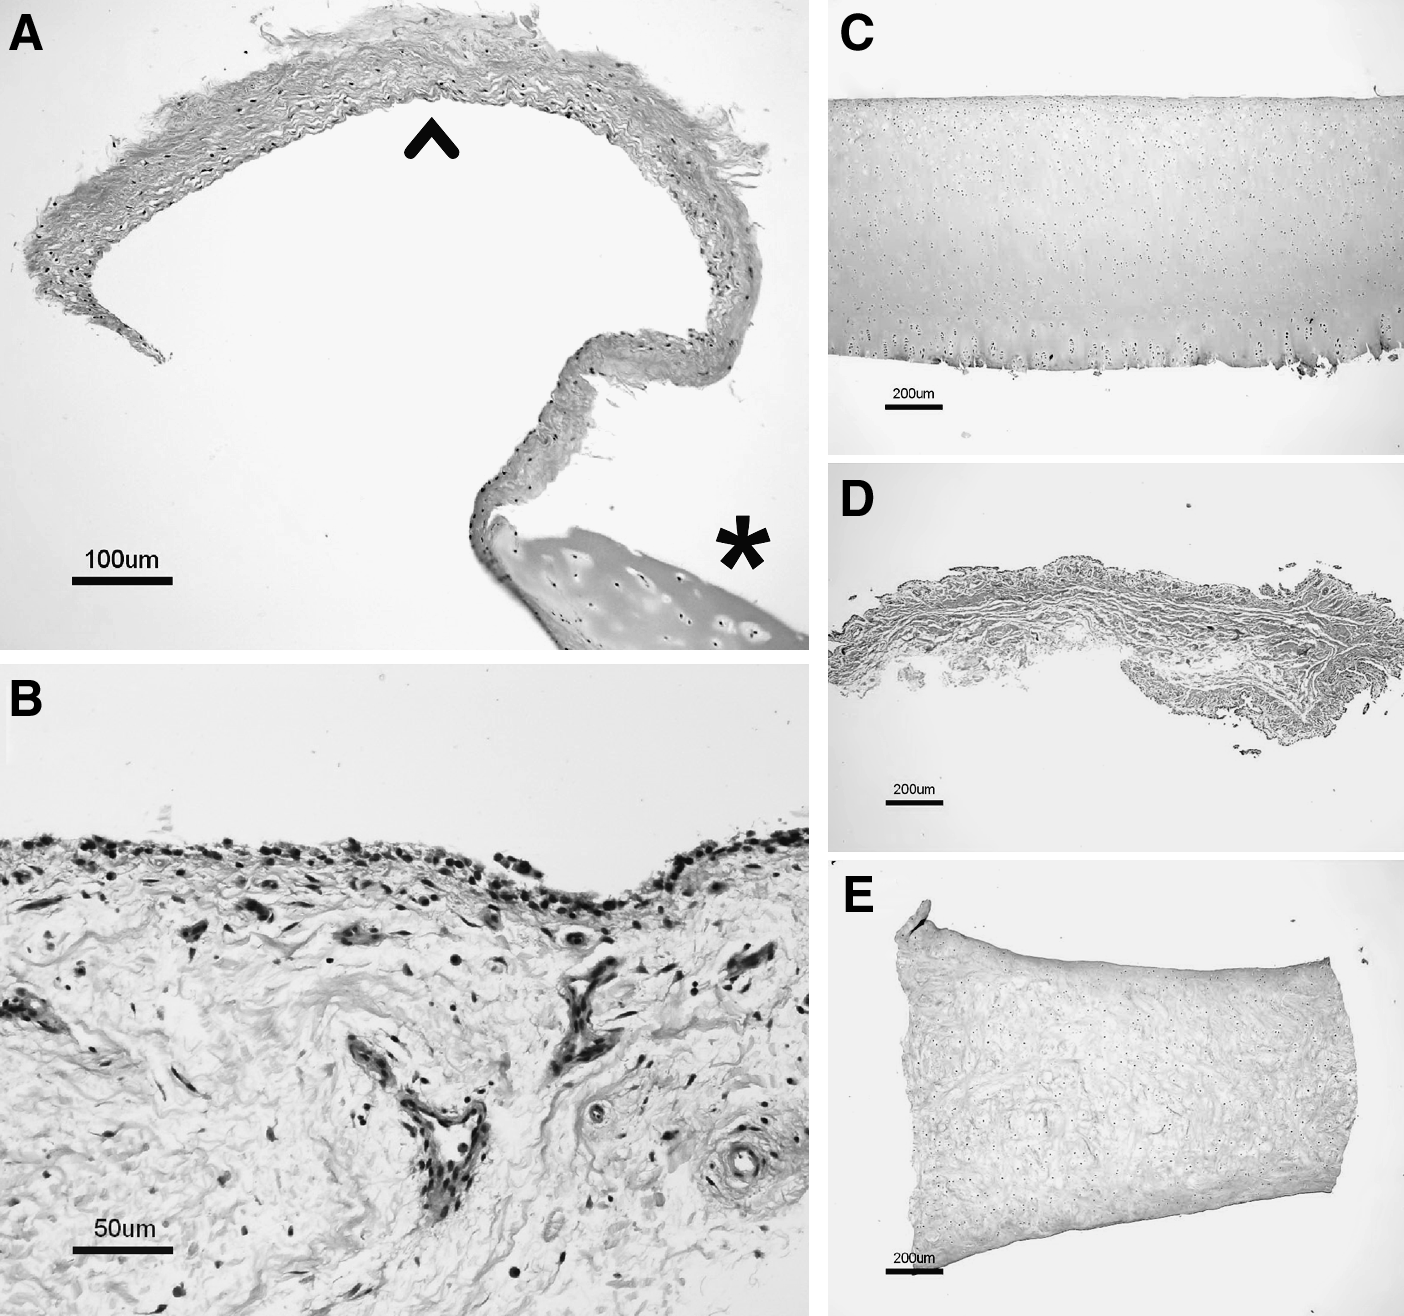
Histology micrographs of tissue samples used for study. All samples were stained with hematoxylin and eosin. (
Porcine tissue study
To determine whether MAGP2 expression, originally discovered in synovial cell cultures, was also present in synovium, porcine tissues were tested. CRTL1 gene expression in these samples was also analyzed. To confirm that the appropriate tissues were tested, histology samples of condylar cartilage, synovium, and meniscal fibrocartilage were first examined by a board-certified pathologist (E.H.). Representative micrographs are shown in Figure 1C–E. To investigate the individual levels of CRTL1 and MAGP2 gene expression in the various tissues, we referenced these to GAPDH, a commonly used housekeeping gene.9–13 On the basis of the observed results, the use of GAPDH normalization for these samples appeared to be acceptable. The average GAPDH cycle times for the condyle, synovium, and meniscus samples were 21.3, 20.7, and 20.8 cycles, with the average RNA input amounts of 7.1, 13.6, and 4.8 ng/μL cDNA reaction, respectively. We also referenced CRTL1 directly to MAGP2, which provides a single parameter describing relative expression of these two genes without the requirement for normalization to housekeeping genes or RNA input levels. The results are shown in Figure 2. As observed in the microarray hybridization experiments that tested chondrocyte and synovial cell cultures (data not shown), differential MAGP2 expression was seen between cartilage and synovium tissues. Examination of the average MAGP2:GAPDH levels showed gene expression at least 4.5 logs lower in either cartilage type compared to synovium. Also consistent with the previous cell culture results, CRTL1 expression was observed higher in cartilage than in synovium. Both condylar cartilage and meniscal cartilage had CRTL1:GAPDH levels that were at least 2.3 logs greater than that of synovium. The average CRTL1:MAGP2 levels were over 6.1 logs higher in either cartilage type compared to synovium. Levels of the various gene expression indices were similar between condylar and meniscal cartilage samples (within 0.5 logs, all indices).
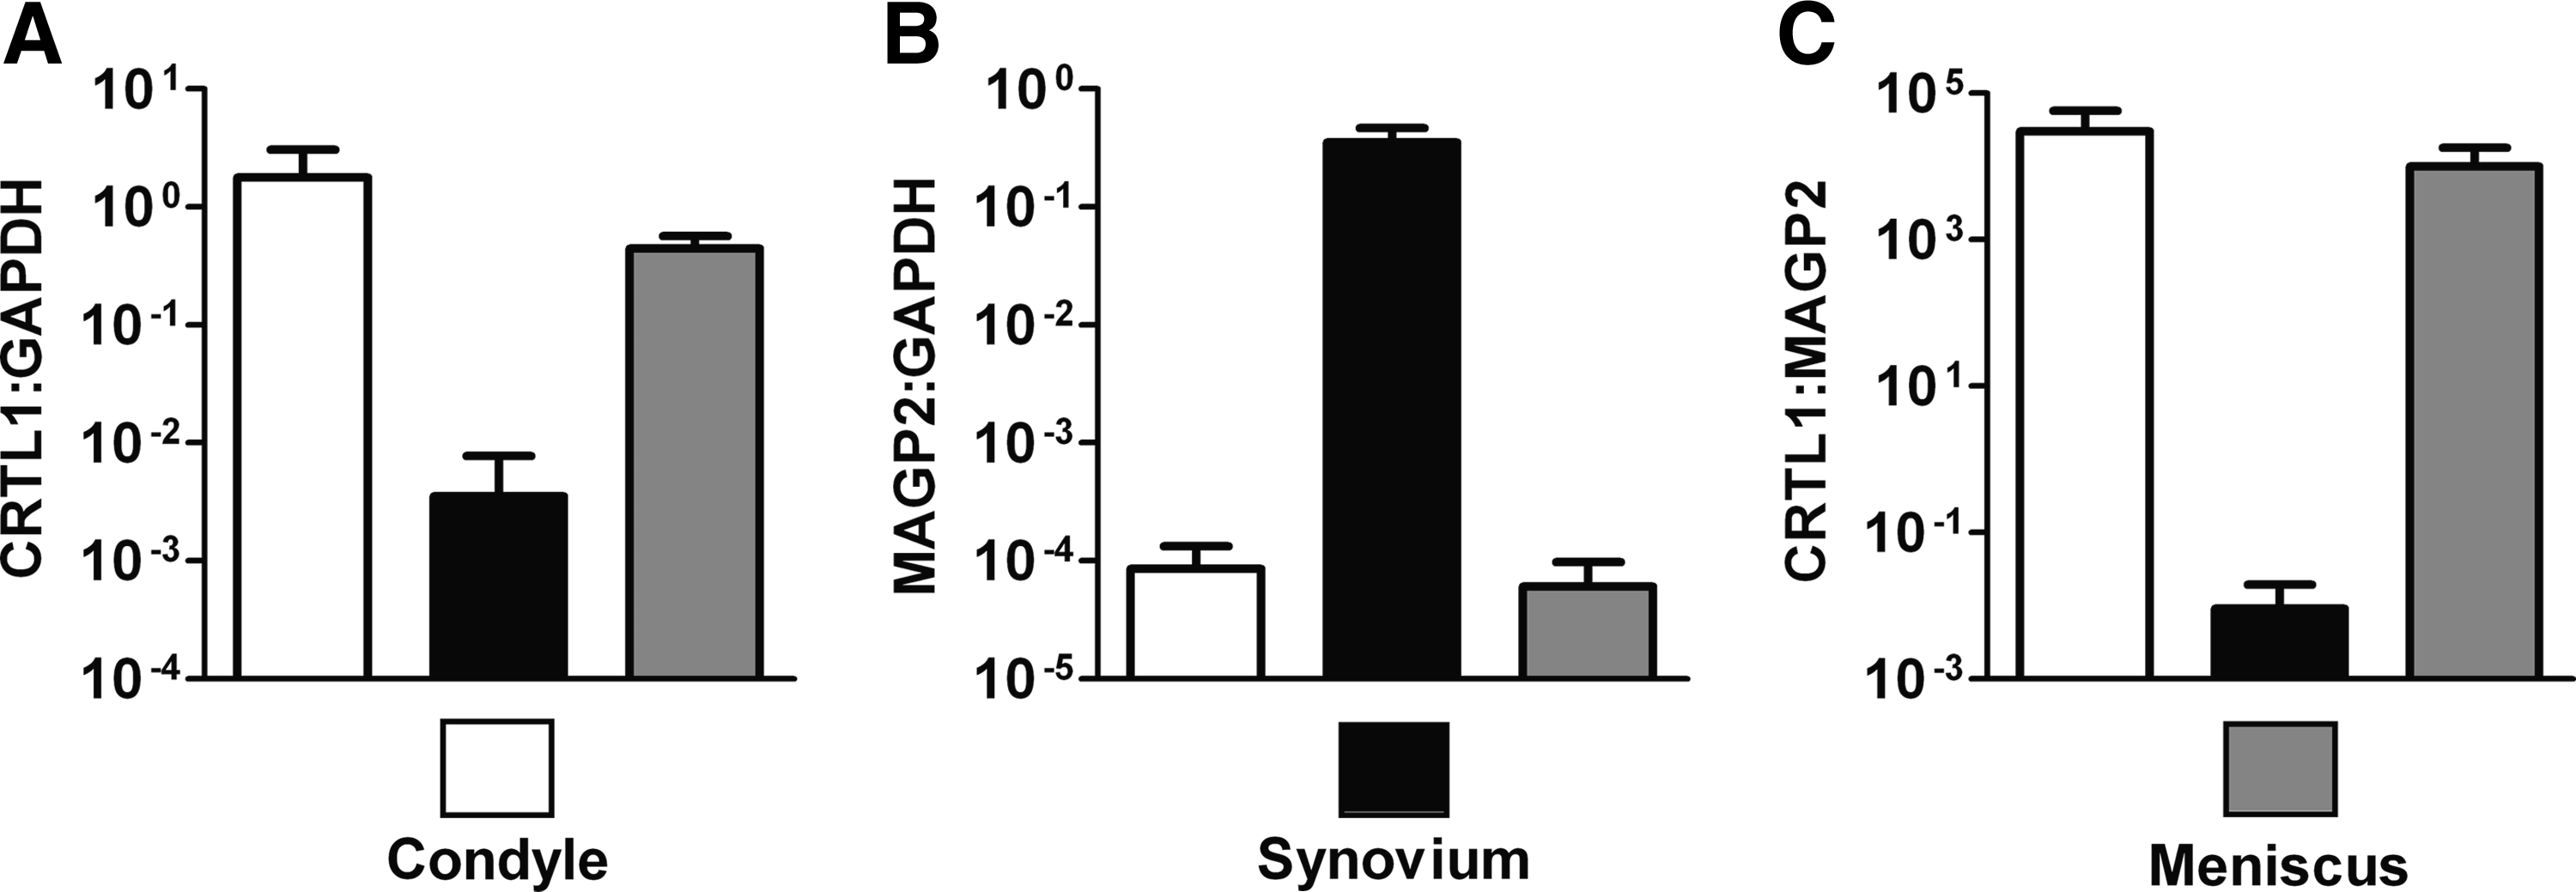
Gene expression of CRTL1 and MAGP2 in porcine condylar cartilage (n = 3), synovium (n = 3), and meniscal fibrocartilage (n = 2) using SYBR green real-time quantitative RT-PCR. (
Gene expression in human cell cultures
To assess gene expression of CRTL1, COL1A1, and MAGP2 in chondrocyte, synovial, and dermal fibroblast cultures, levels were normalized to GAPDH. For this analysis, a representative number of donor strains of human chondrocytes (n = 34) and synovial cells (n = 18) were tested. Dermal fibroblasts (n = 10 strains), a widely studied fibroblastic cell type, were also included for comparative purposes. The results of the analysis are shown in Figure 3. The average expression levels of COL1A1:GAPDH were similar between the three cell types (within 0.15 logs). The average level of CRTL1:GAPDH in chondrocyte cultures was found to be higher than that of synovial or dermal fibroblast cultures (by 2.1 and 2.4 logs, respectively; p < 0.0001 for either comparison, Mann–Whitney test). Conversely, the average level of MAGP2:GAPDH in chondrocyte cultures was lower than that of synovial or dermal fibroblast cultures (by 2.0 and 1.2 logs, respectively; p < 0.0001 for either comparison, Mann–Whitney test). The average level of MAGP2:GAPDH was somewhat higher in synovial cell cultures compared to dermal fibroblast cultures (by 0.78 logs, p = 0.0001, Mann–Whitney test).
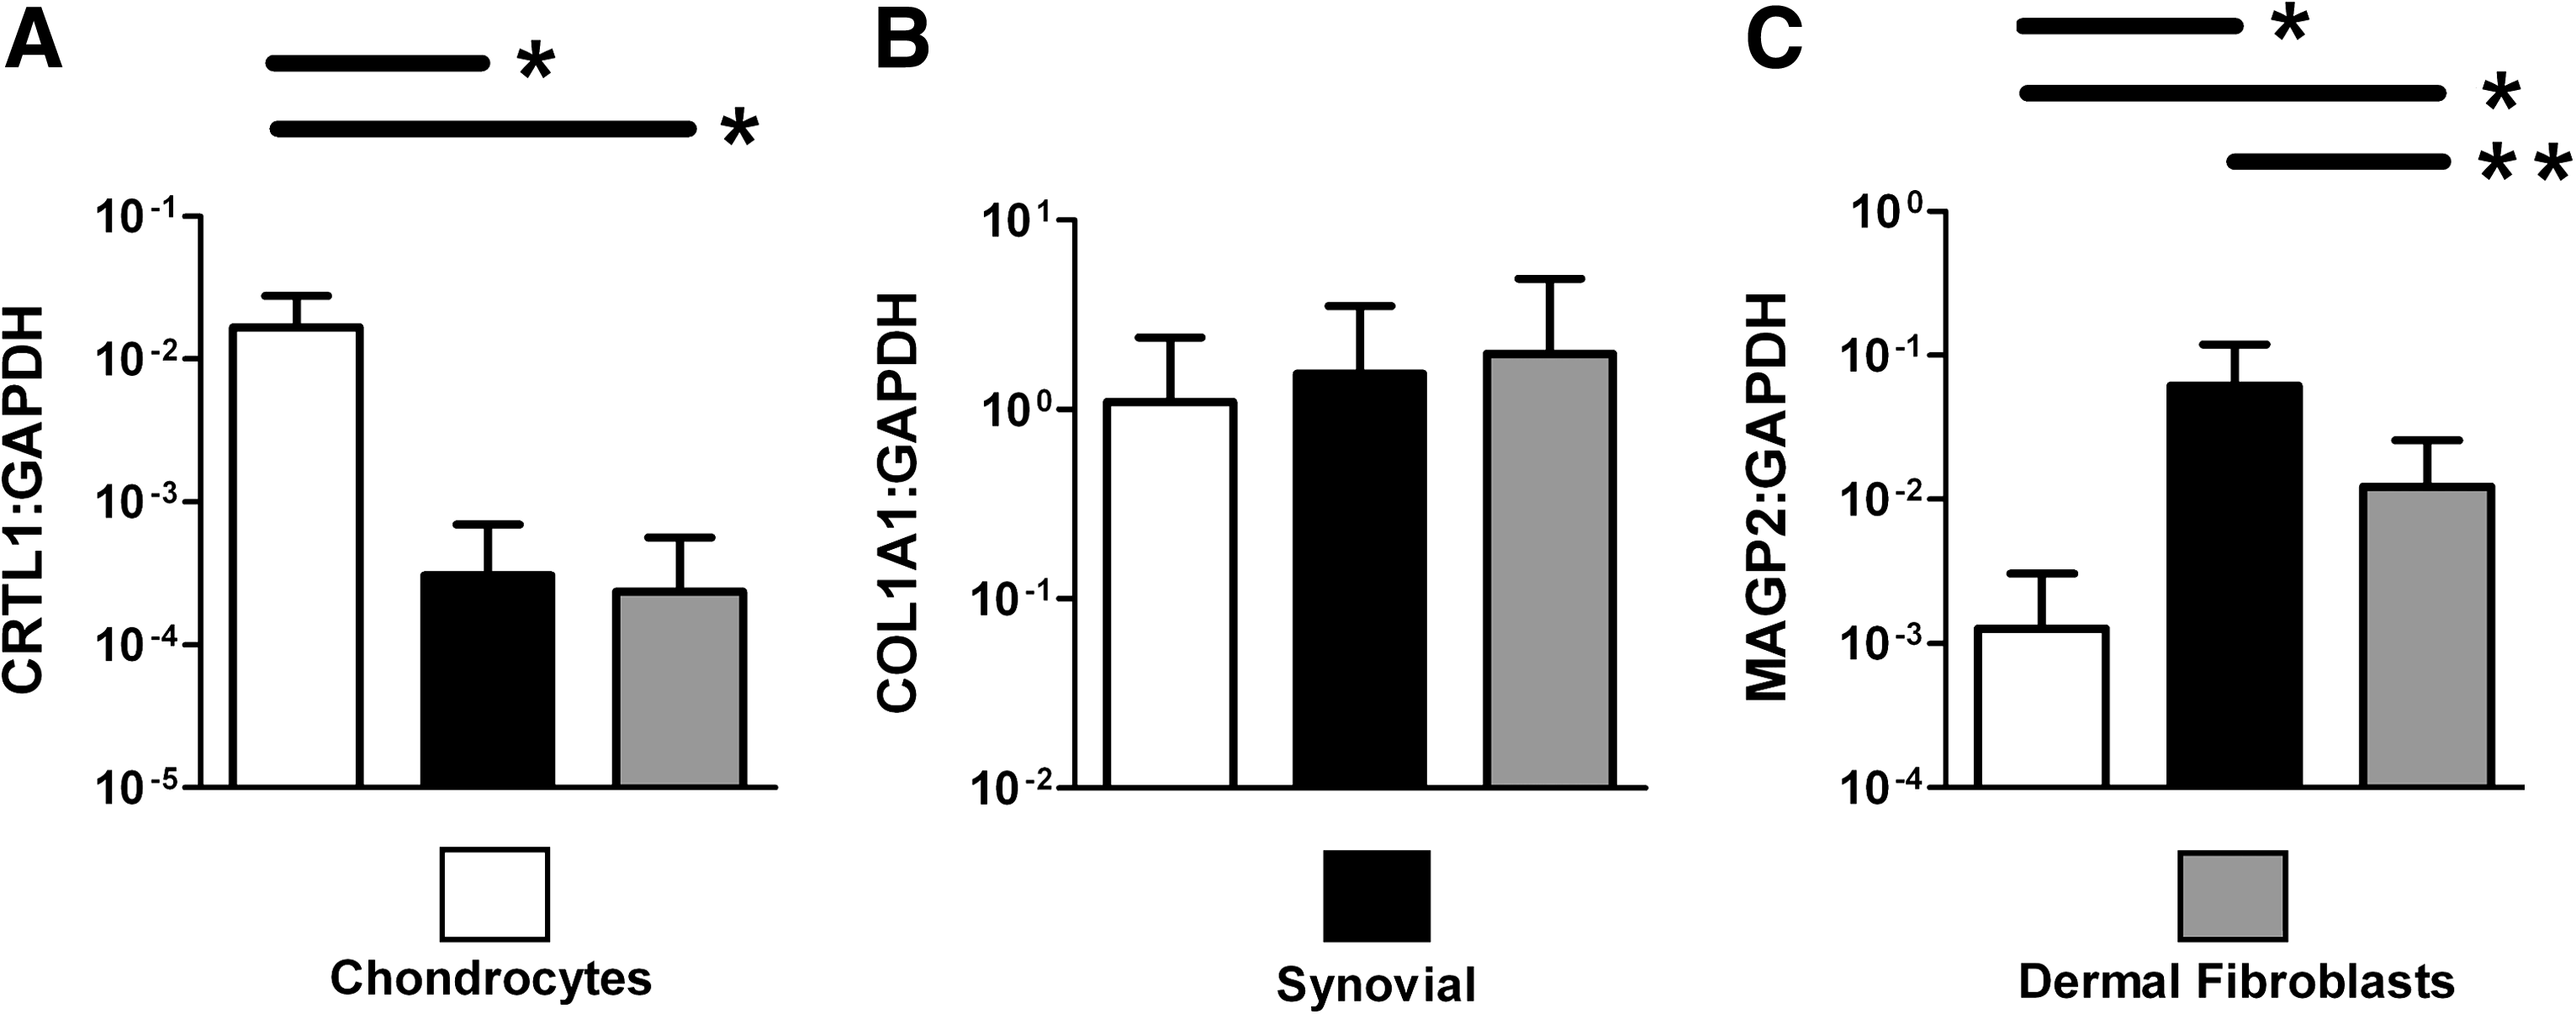
Gene expression of CRTL1, COL1A1, and MAGP2 with GAPDH normalization in monolayer-expanded adult human cell cultures using TaqMan real-time quantitative RT-PCR. Third-passage chondrocytes (n = 34 strains), third/fourth-passage synovial cell cultures (n = 18 strains), and third-passage dermal fibroblasts (n = 10 strains) were tested. (
We developed assays based on the levels of CRTL1:GAPDH, CRTL1:COL1A1, and CRTL1:MAGP2 in an attempt to clearly distinguish chondrocyte cultures from synovial cultures. Classification thresholds for each assay were calculated after a statistical analysis of the chondrocyte culture data. Examination of the untransformed CRTL1:GAPDH, CRTL1:COL1A1, and CRTL1:MAGP2 data revealed that these were not normally distributed (data not shown). After log transformation, however, the data from each assay were adequately normally distributed (Table 1). The means and standard deviations from the log-transformed data were then calculated for each assay, and the classification threshold for each assay was defined as the chondrocyte mean minus two standard deviations, as shown in Table 1. Scatter dot plots of the log-transformed gene expression data for chondrocyte cultures, synovial cultures, and junction cultures are shown in Figure 4, with the classification thresholds drawn on each plot. As can be seen from the figure, in terms of testing outcomes, two out of three of the junction cultures were classified as chondrocytes with the log(CRTL1:GAPDH) assay, and all three were classified as chondrocytes with the log(CRTL1:COL1A1) assay. When examined with the log(CRTL1:MAGP2) assay, however, none of the junction cultures were classified as chondrocytes. The results also showed that the log(CRTL1:MAGP2) assay provided better resolution of synovial cultures from chondrocyte cultures than the assays that used GAPDH or COL1A1 as reference genes.
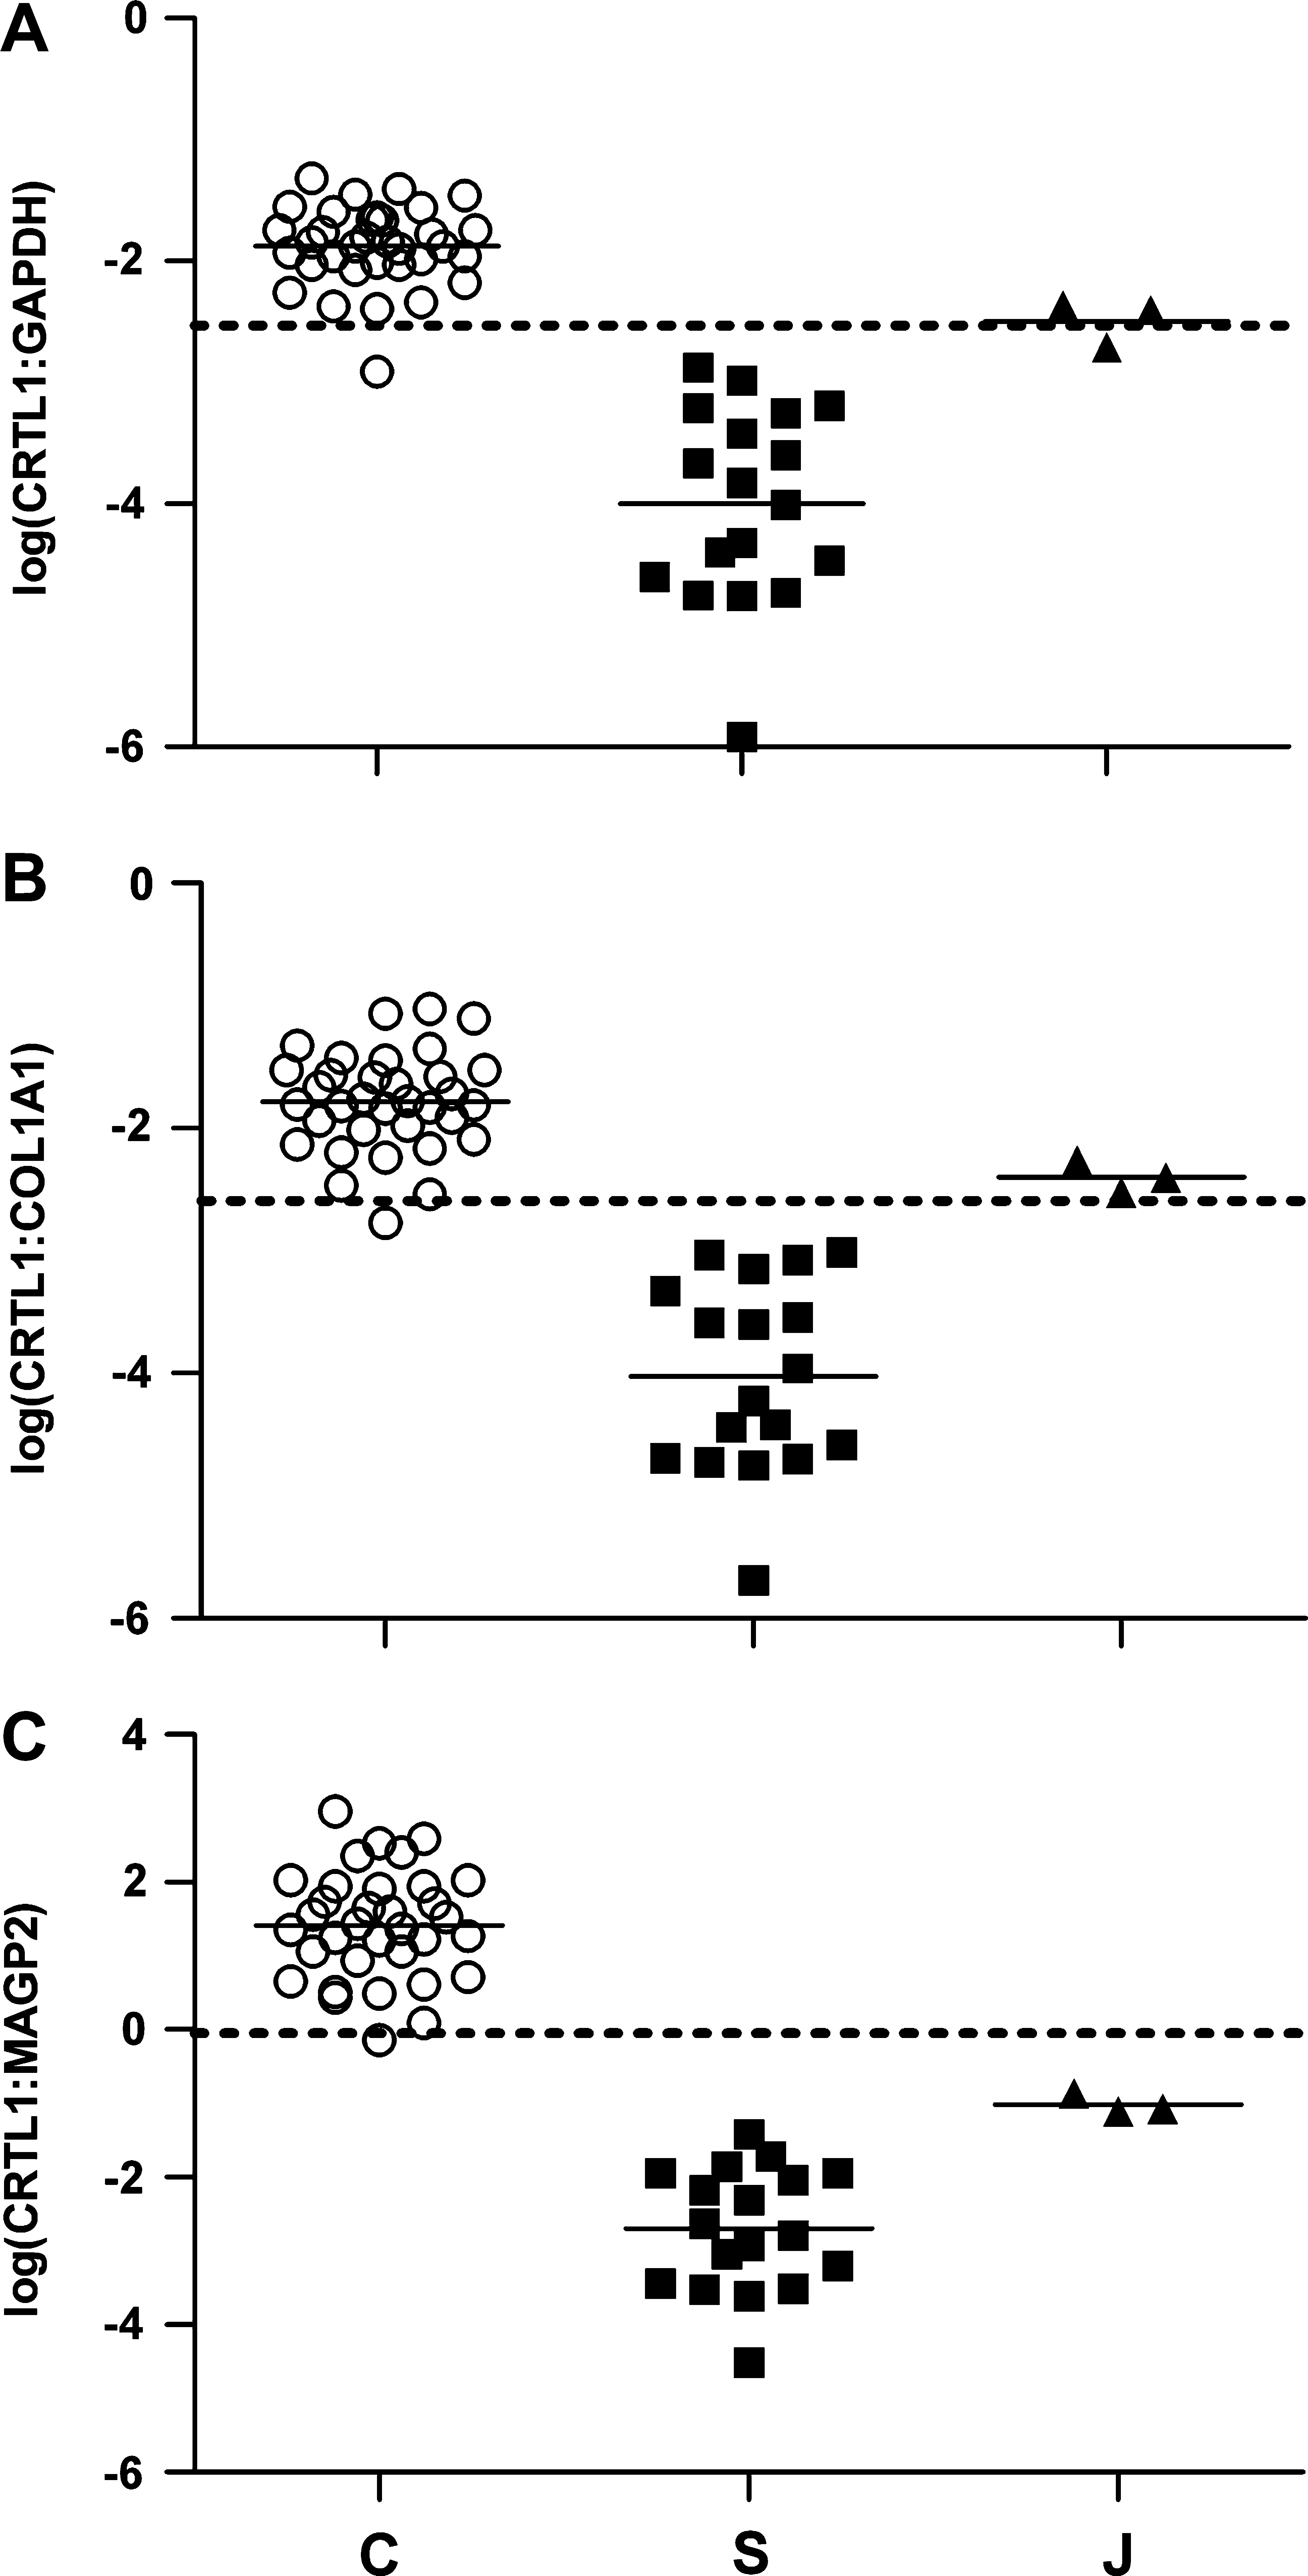
CRTL1 gene expression levels in human chondrocyte (n = 34), synovial (n = 18), and junction cultures (n = 3) using TaqMan real-time quantitative RT-PCR. (
GAPDH, glyceraldehyde-3-phosphate dehydrogenase; CRTL, cartilage link protein; MAGP2, microfibril-associated glycoprotein-2.
Titration experiments
To evaluate the specificity of the various assays against heterogeneous samples of a defined composition, titration experiments were performed. Figure 5 shows the results obtained when a graded series of prepared mixtures containing cultured chondrocytes and synovial cells were tested with the various gene expression assays. For each assay, the bars are drawn starting from the respective assay classification thresholds. The percent chondrocytes in each experiment corresponding to the threshold (minimum positive classification level) was estimated by interpolation. The average minimum positive classification levels from the three experiments were then calculated for each assay, and recorded in Table 2. The average minimum levels of chondrocytes required to yield a positive classification as chondrocytes with the log(CRTL1:GAPDH), log(CRTL1:COL1A1), and log(CRTL1:MAGP2) assays were 26.8%, 20.0%, and 65.2%, respectively. The average minimum levels of chondrocytes required to yield a positive classification with the log(CRTL1:MAGP2) assay were significantly higher than the average levels required for the log(CRTL1:GAPDH) assay (p = 0.0068, paired t-test) or the log(CRTL1:COL1A1) assay (p = 0.013, paired t-test), indicating that the log(CRTL1:MAGP2) assay provided significantly better selectivity against the heterogeneous samples.
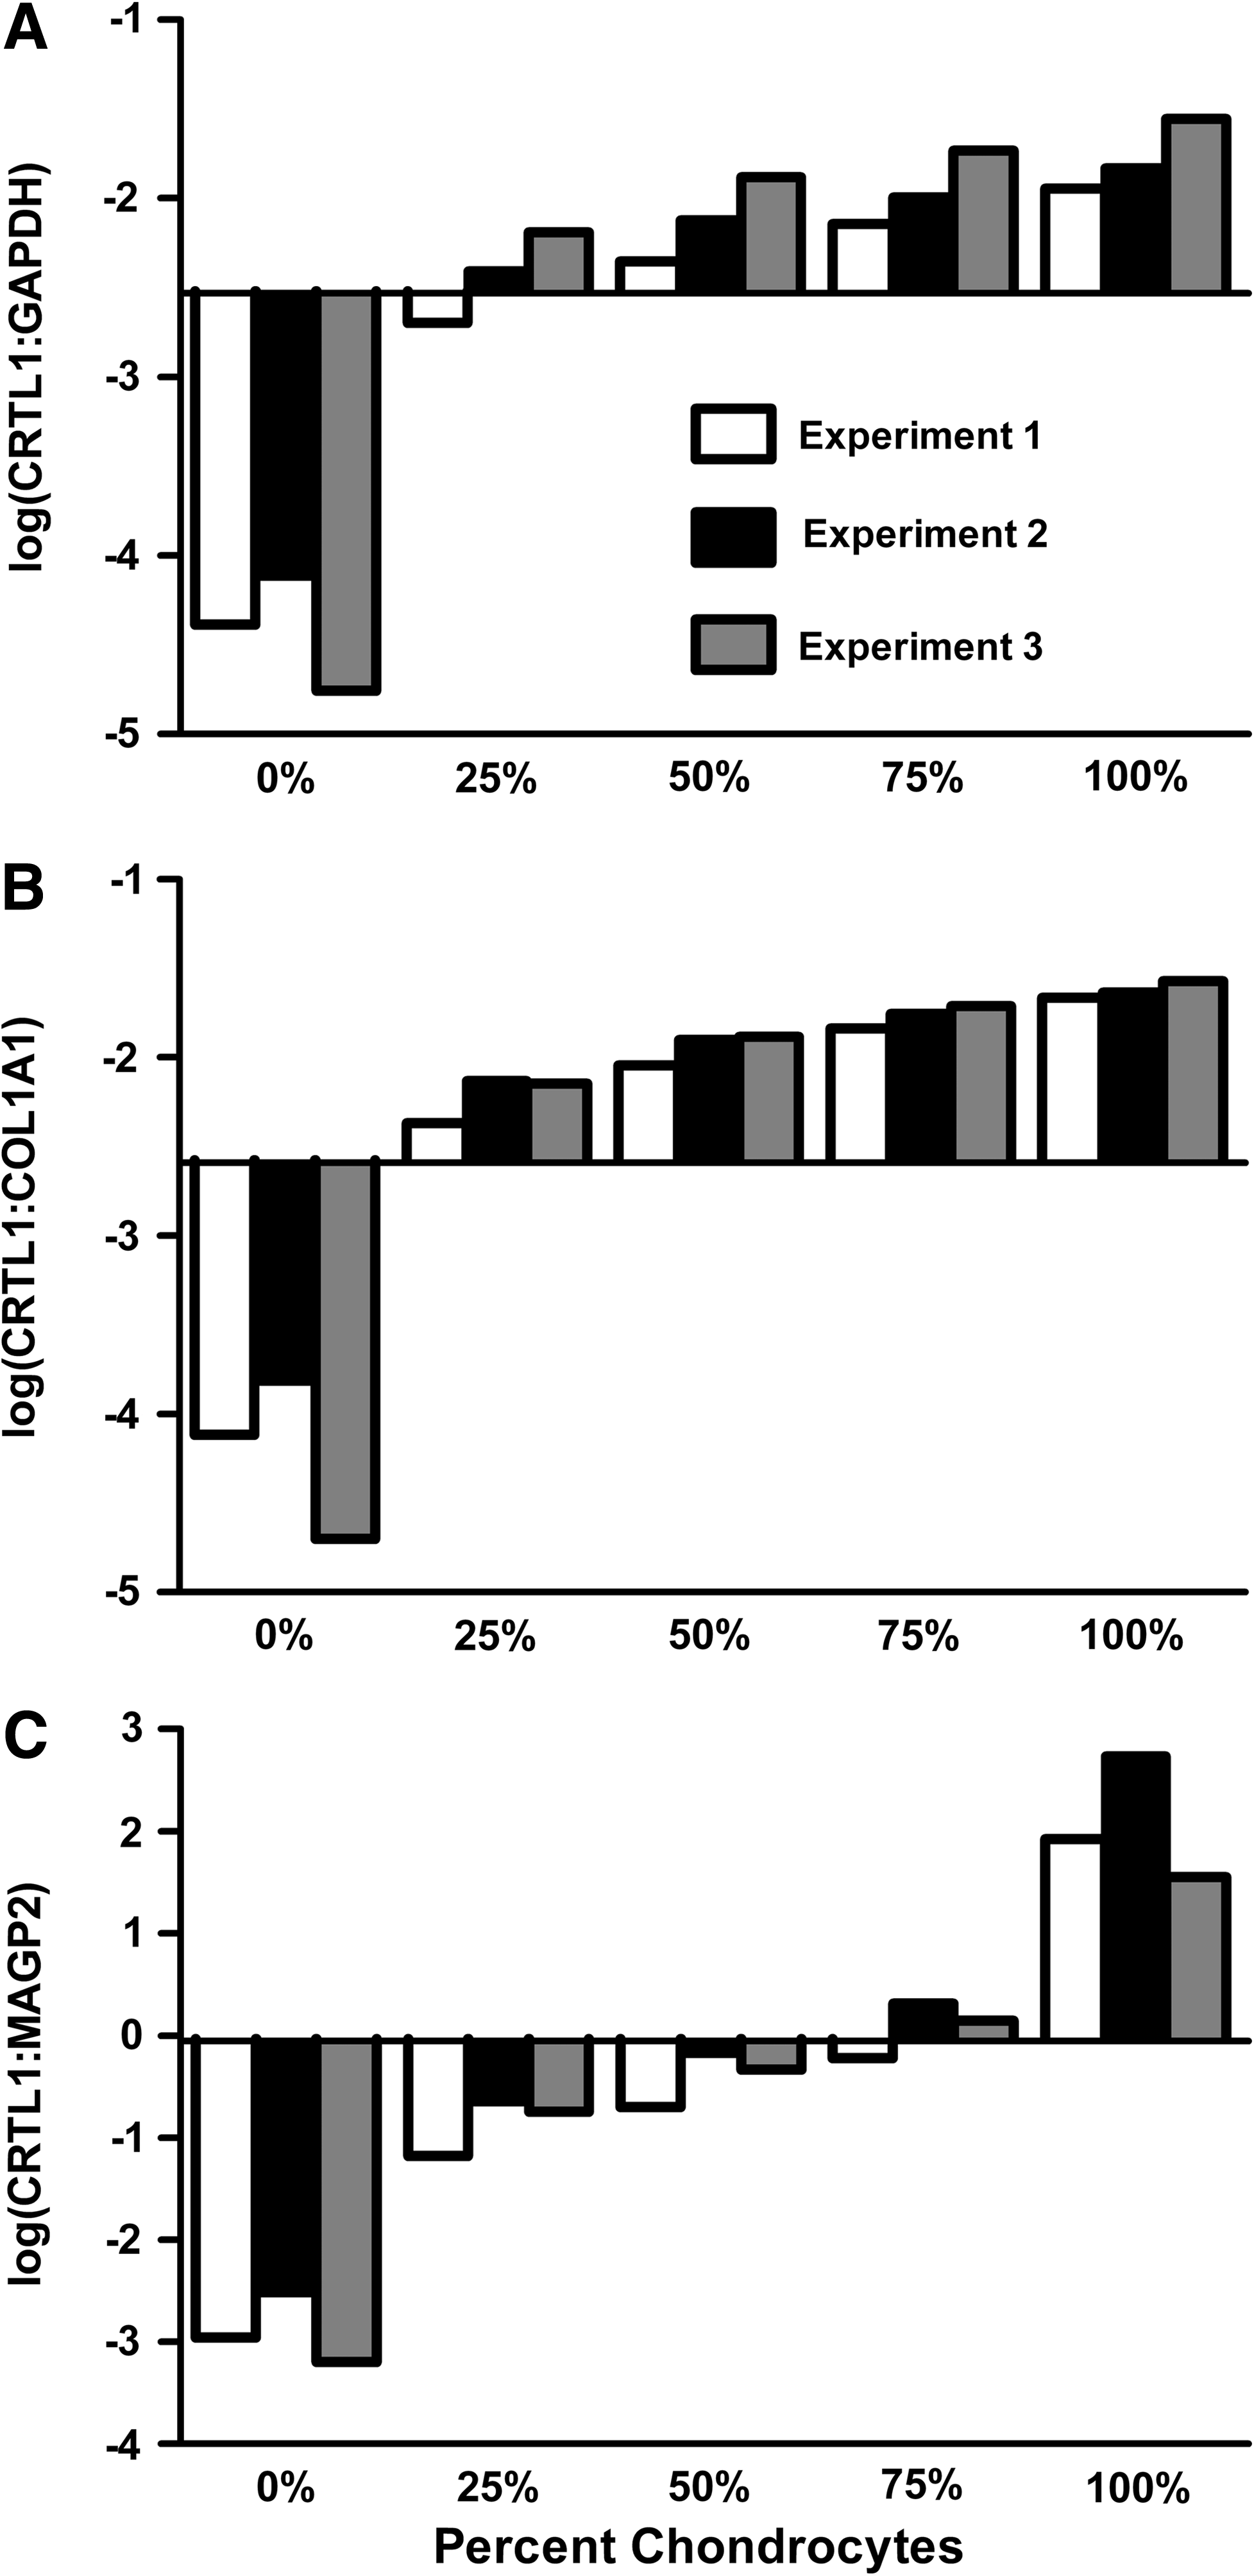
Titration of assay selectivity against heterogeneous samples. (
Discussion
Chondral injuries occur frequently and are treated with a number of articular cartilage repair procedures, including cell-based therapies. Evidence suggests that ACI and MACI procedures can result in a hyaline-like repair tissue and significantly reduce pain and improve mobility in patients with large symptomatic chondral lesions.14–16 There are many challenges associated with the manufacture and quality control of human cells for clinical use, which have necessitated the development of novel process controls and analytical methods to ensure product quality and consistency. 17 Among these challenges, the development of assays that provide an unambiguous assessment of product identity had been found to be particularly difficult.
Evaluation of histological samples from ACI biopsies indicated that synovial tissue can be a contaminant of these biopsies. Therefore, we developed quantitative gene expression assays capable of discriminating chondrocyte from synovial cell cultures, using the cartilage-specific marker CRTL1 referenced to GAPDH, COL1A1, and MAGP2. To prospectively compare the performance characteristics of the variously normalized assays, we tested two types of samples: actual cell cultures derived from fibrous tissues dissected from the cartilage junction (junction cultures), and prepared mixtures containing known proportions of cultured chondrocytes and synovial cells. Although the exact compositions of the junction cultures are currently unknown, the results of the current work suggest that these contain a mixture of chondrocytes and synovial cells. Regardless of the composition of the junction cultures, they constitute an example of cultures that could arise from an inappropriate tissue source for ACI production, that is, fibrous or junction tissue. Using classification thresholds set to include most chondrocyte cultures, the selectivities of the GAPDH, COL1A1, and MAGP2 normalized assays against the junction cultures were evaluated by comparing classification outcomes. The results showed that the log(CRTL1:MAGP2) assay did not classify any of these cultures as chondrocytes, while two out of three were classified as chondrocytes with the log(CRTL1:GAPDH) assay, and all three were classified as chondrocytes with the log(CRTL1:COL1A1) assay. For the purpose of preventing such cultures from being released for clinical use, the log(CRTL1:MAGP2) assay exhibited superior performance.
Due to the undefined nature of the junction cultures, it was not possible to compare the performance characteristics of the various assays with regard to the levels of chondrocytes present. Therefore, we conducted titration experiments using a graded series of defined mixtures of separately cultured chondrocytes and synovial cells to test the performance capabilities. The results showed that the log(CRTL1:MAGP2) assay provided significantly better selectivity against the mixtures than either the log(CRTL1:GAPDH) or the log(CRTL1:COL1A1) assay. These data, along with those from the junction culture testing, confirmed our hypothesis that referencing gene expression to a synovial marker, in this case MAGP2, would result in improved assay selectivity.
The indexing of positive (abundantly expressed) markers to negative (inabundantly expressed) markers for the characterization of the differentiated chondrocyte phenotype is highly precedented, with the COL2A1/COL1A1 and the aggrecan/versican ratios commonly used for this purpose.9–13 We employed this normalization strategy with the most differentially expressed positive and negative mRNA markers expressed in our chondrocyte and synovial cell cultures, as determined by full transcriptome microarray analysis. For this reason, we believe that the CRTL1:MAGP2 index is the optimal single parameter for discriminating between chondrocytes and synovial cells cultured using our procedures. The CRTL1 and MAGP2 expression patterns in porcine tissues also indicated that these markers were differentially expressed between cartilage and synovium, suggesting the CRTL1:MAGP2 index as a versatile descriptor of the chondrocyte lineage because it may identify chondrocytes in both tissue and in cell culture.
Limitations of the described method for the purpose of chondrocyte identification include those associated with the selected markers, and the use of an RT-PCR assay format. While CRTL1 is a well-characterized chondrocyte marker,18–21 the widespread expression of CRTL1 in developing tissues may preclude its use in such samples. MAGP2 expression patterns in tissue22–24 have not been as thoroughly investigated, and we believe that this is the first report of MAGP2 expression in synovium or synovial cell cultures. In the context of identifying the cultures intended for ACI procedures, the primary limitation of the described method is that it only classifies cell cultures, not individual cells, making uncertain exactly what level of chondrocytes an assay result represents. While we used prepared mixtures of separately cultured chondrocytes and synovial cells for the purpose of demonstration, cells in actual cocultures derived from cartilage and synovium could potentially exhibit different expression profiles. For this reason, it will not be possible to gauge the exact percentage level of chondrocytes corresponding to a log(CRTL1:MAGP2) assay result until an assay format that identifies individual cells in cocultures is developed.
The results presented in this work describe the comparison of assays that were assigned arbitrary acceptance thresholds for the purpose of testing our hypothesis regarding gene expression normalization. The application of the log(CRTL1:MAGP2) assay to the identification of cultures intended for ACI procedures, however, will require a rationally determined acceptance threshold. For this determination, statistical methods can be used to fit distributions to the data and calculate the frequencies of correctly and incorrectly classifying the culture types with different acceptance thresholds. As the current data illustrate, the log(CRTL1:MAGP2) assay provides a high degree of resolution between the cell types. This resolution will allow for the establishment of an acceptance threshold that provides a high degree of confidence that cultures are correctly classified.
The results of this work illustrate the general benefits of biomarker optimization for lineage identification assay development. While the genes we selected are specific to our cultures, the development strategy is generally applicable to other culture processes and cell types. Using this approach, we were able to develop a novel gene expression assay capable of identifying chondrocyte cultures with much greater confidence than previous assays. The improved performance characteristics of this assay were a direct result of the employment of a discriminatory reference gene, the novel synovial marker MAGP2. The resulting assay provides a high level of performance that may allow its acceptance for use as a quality control release test for the identification of autologous cultured human chondrocytes for implantation.
Footnotes
Acknowledgments
This work was sponsored by Genzyme Corporation. We thank Amy Parker, Dhurata Dono, Dawn Riley, and Christina Mortelliti for their technical assistance. We also thank Dr. Michael O'Callaghan for providing guidance, and Prudence Roaf for helpful comments on the article.
Disclosure Statement
The authors of this article are employees and shareholders of Genzyme Corporation.