
Abstract
The most valuable property of stem cells (SCs) is their potential to differentiate into many or all cell types of the body. So far, monitoring SC differentiation has only been possible after cells were fixed or destroyed during sample preparation. It is, however, important to develop nondestructive methods of monitoring SCs. Scanning ion conductance microscopy (SICM) is a unique imaging technique that uses similar principles to the atomic force microscope, but with a pipette for the probe. This allows scanning of the surface of living cells noninvasively and enables measurement of cellular activities under more physiological conditions than is possible with other high-resolution microscopy techniques. We report here the novel use of the SICM for studying SCs to assess and monitor the status of SCs and various cell types differentiated from SCs.
Introduction
The culture of human embryonic stem cells (hESCs) is also still challenging and involves manual dissection and elimination of differentiated cells. Current methods are based on the observation of cultures under phase contrast microscope, and these can lead to errors in interpretation. Further, unless cells have been genetically modified to include a reporter gene driven by a pluripotency gene promoter (e.g., Oct-4-green fluorescent protein [GFP]), it is sometimes difficult to assess the cultures. 5
Moreover, it is often necessary to derive differentiated cells from ESCs, and in most cases cell differentiation in culture does not occur simultaneously, leaving a heterogeneous mixture of differentiated cell types. 6 The determination of the state of differentiation of ES-derived cells is thus also challenging. Although methods such as polymerase chain reaction (PCR) and proteomics are used with mixed cell populations, 7 there is a shortage of methods that can determine the phenotype and functional activity of individual cells within these populations, especially live cells as they grow and differentiate.
More non-invasive methods for monitoring ESC differentiation are required, preferably rapid ones and which are applicable to live cells. We present here a method to monitor both undifferentiated and differentiated states of individual SCs in live cultures using the scanning ion conductance microscopy (SICM).8,9 This is a unique imaging technique that uses similar principles to the atomic force microscope, but in contrast to physically tapping the preparation with a sharp tip, the SICM uses a noncontact nanopipette for the probe.9,10 This allows high-resolution, non-invasive probing of the surface of unfixed cells. Fixed pipette–sample distance is maintained by reduction in ion flow as the pipette approaches the sample. SICM has been used to image living cell surfaces and their dynamics down to the level of individual protein complexes, 11 and determine the dynamics of microvilli of epithelial cells and how they assemble to produce more complex structures. 12 In this paper SICM is used to study individual SCs to monitor their status in time and identify the various cell types differentiated from SCs.
Materials and Methods
Growth of hESCs
Two different hESC lines were used: hES-NCL1 and H7.
hES-NCL1 cells were grown as described previously
13
on mouse embryonic fibroblasts (MEFs) until passages 43 and 47, respectively, and then transferred onto tissue culture plates (
To study the distribution of specific cell-surface marker of undifferentiated hESCs on the cell surface, we performed live immunocytochemical staining of the hESCs cell-surface markers SSEA-4 (1:100) and TRA-1-60 (
For Nanog, staining cells were fixed with 4% paraformaldehyde for 10 min and then permeabilized/blocked with 0.1% Triton X-100 and 5% fetal calf serum (FCS) in phosphate-buffered saline (PBS) at room temperature for 45 min. After blocking, the cells were incubated at room temperature for 1 h with Nanog (1:20; R&D Systems, Abingdon, United Kingdom) antibody. The cells were washed with 5% FCS and PBS before addition of the secondary antibody: rhodamine-conjugated anti-goat immunoglobulin G (1:100;
Spontaneous differentiation of hES-NCL1 cells
Colonies of hES-NCL1 cells grown on HS and in the presence of hES-dF–conditioned medium were re-plated on new HS-coated plates in hES-dF–conditioned medium as previously described. 13 After 5–12 days without passaging, spontaneous differentiation was observed, and differentiated cells were re-plated and cultured under the same conditions.
Neuron-like cells were loaded by fluorescent dye N-(3-triethylammoniumpropyl)-4(4-(dibutylamino)styryl) pyridinium dibromide (FM1-43) with incubation of 20 μM FM1-43 in a solution containing an additional 50 mM potassium chloride (KCl) for 90 s. After washing cells, they were incubated at 37°C for 15 min. Experiments were then performed at room temperature (25–28°C).
All samples were imaged by surface confocal microscopy. Other neuron-like cells were fixed in 4% paraformaldehyde in PBS (Sigma) for 30 min and then permeabilized for an additional 10 min with 0.1% Triton X (Sigma). The blocking step was 30 min with 2% FCS in PBS. Differentiated cells were incubated with antibody against tubulin III (1:100; Chemicon) antibody was detected using corresponding secondary antibodies conjugated to fluorescein-iso-thiocyanate (FITC).
Reverse transcription–PCR analysis
Reverse transcription (RT)–PCR was done using the cells to cDNA II kit (
Maintenance, propagation, and differentiation of human H7 ESCs
All tissue culture reagents were purchased from Gibco–Invitrogen (Paisley, Scotland) unless otherwise stated. Plastic consumables were from Fisher Scientific (Loughborough, United Kingdom,
All procedures for producing MEF-CM in the presence of 4 ng/mL bFGF, the subculturing of the H7 cells, and their differentiation via embryo bodies (EBs) were as described by Geron (
Before either splitting or differentiation into cardiomyocytes, cultures of H7 cells were subjected to 5–10 min of treatment with collagenase IV (200 U/mL; 1 mL/well) at 37°C, followed by mechanical dislodgement. To induce differentiation via EBs, colonies of undifferentiated H7 cells were broken up mechanically into smaller clusters by scraping the well with the tip of a 5-mL pipette, followed by pipetting and culture in suspension in low adherence plates. The differentiation medium was ES cell medium in which 20% KOSR was replaced by 20% nonheat-inactivated FCS. After 4 days, EBs of varying sizes were plated out onto 0.5% gelatin-coated glass or plastic and studied at time periods from day 9 to day 12 of differentiation onward.
Neural crest–like SCs
We used neural crest–like SCs obtained from neonatal mouse epidermis. These cells resemble neural crest SCs in their apparent capacity to differentiate into several cell types normally derived from the neural crest. They can produce Schwann precursor cells, functional melanocytes, and functional neurons (Sviderskaya et al., submitted to FASEB J).
We used one of the three independently established lines called neural crest–like cells-misty, line 6 (nc-m6). The undifferentiated cells were grown in RPMI 1640 medium supplemented with penicillin, streptomycin, glutamine (2 mM), newborn-calf serum (10%), and 12-O-tetradecanoyl phorbol acetate (TPA, 2 nM). Incubation was with 10% v/v CO2 at 37°C. For the experiments described, the cells were plated at 4 × 10⁴ cells/mL and grown in RPMI medium supplemented with penicillin, streptomycin, glutamine (2 mM), FCS (10%), TPA (2 nM), transforming growth factor β1 (120 pM), endothelin-1 (10 nM), fibroblast growth factor-2 (40 pM), and neuregulin1-β1 (10 nM) for 2 weeks.
Neural crest–like SCs were loaded by FM1-43 with incubation of 20 μM FM1-43 in a solution containing an additional 50 mM KCl for 90 s. After washing cells, they were incubated at 37°C for 15 min. Experiments were then performed at room temperature (25–28°C).
Outside out voltage-clamp recording from neural crest–like SCs
Outside out patch-clamp recordings were conducted at room temperature (21°C) using a MultiClamp 700B amplifier and the Clampex 9.2 program (both by Molecular Devices, Sunnyvale, CA). Fire-polished electrodes (2.5–2.7 Mohm) were fabricated from 1.0-mm borosilicate glass capillaries (Intracel, Herts, United Kingdom) using a P-2000 Puller (Sutter Instrument, Novato, CA). The pipette solution contained (in mM) the following: 140 CsF, 1 ethylene glycol-bis (2-amino-ethyl)-N,N,N′,N′-tetraacetic acid (EGTA), 10 sodium chloride, and 10 HEPES, pH 7.3. The standard bathing solution was (in mM) 140 sodium chloride, 3 KCl, 1 magnesium chloride, 1 calcium chloride, and 10 HEPES, pH 7.3.
The use of internal fluoride facilitates inhibition of high voltage–activated Ca2+ currents16–18 and helps to reveal tetrodotoxin-resistant (TTX-R) currents.19,20 The pipette potential was zeroed before seal formation, and voltages were not corrected for liquid junction potential. Extracellular media were exchanged using a gravity-fed bath perfusion system at a flow rate of 10 mL/min, while bath solution was removed by continuous suction. The volume of fluid in the recording chamber was 1 mL, allowing the exchange of bathing solution within 6–8 s.
Data analysis
The electrophysiological data were analyzed using the Clampfit 9.2 (Molecular Devices) and ORIGIN 5.0 (Microcal Software, Northampton, MA) software programs.
SICM
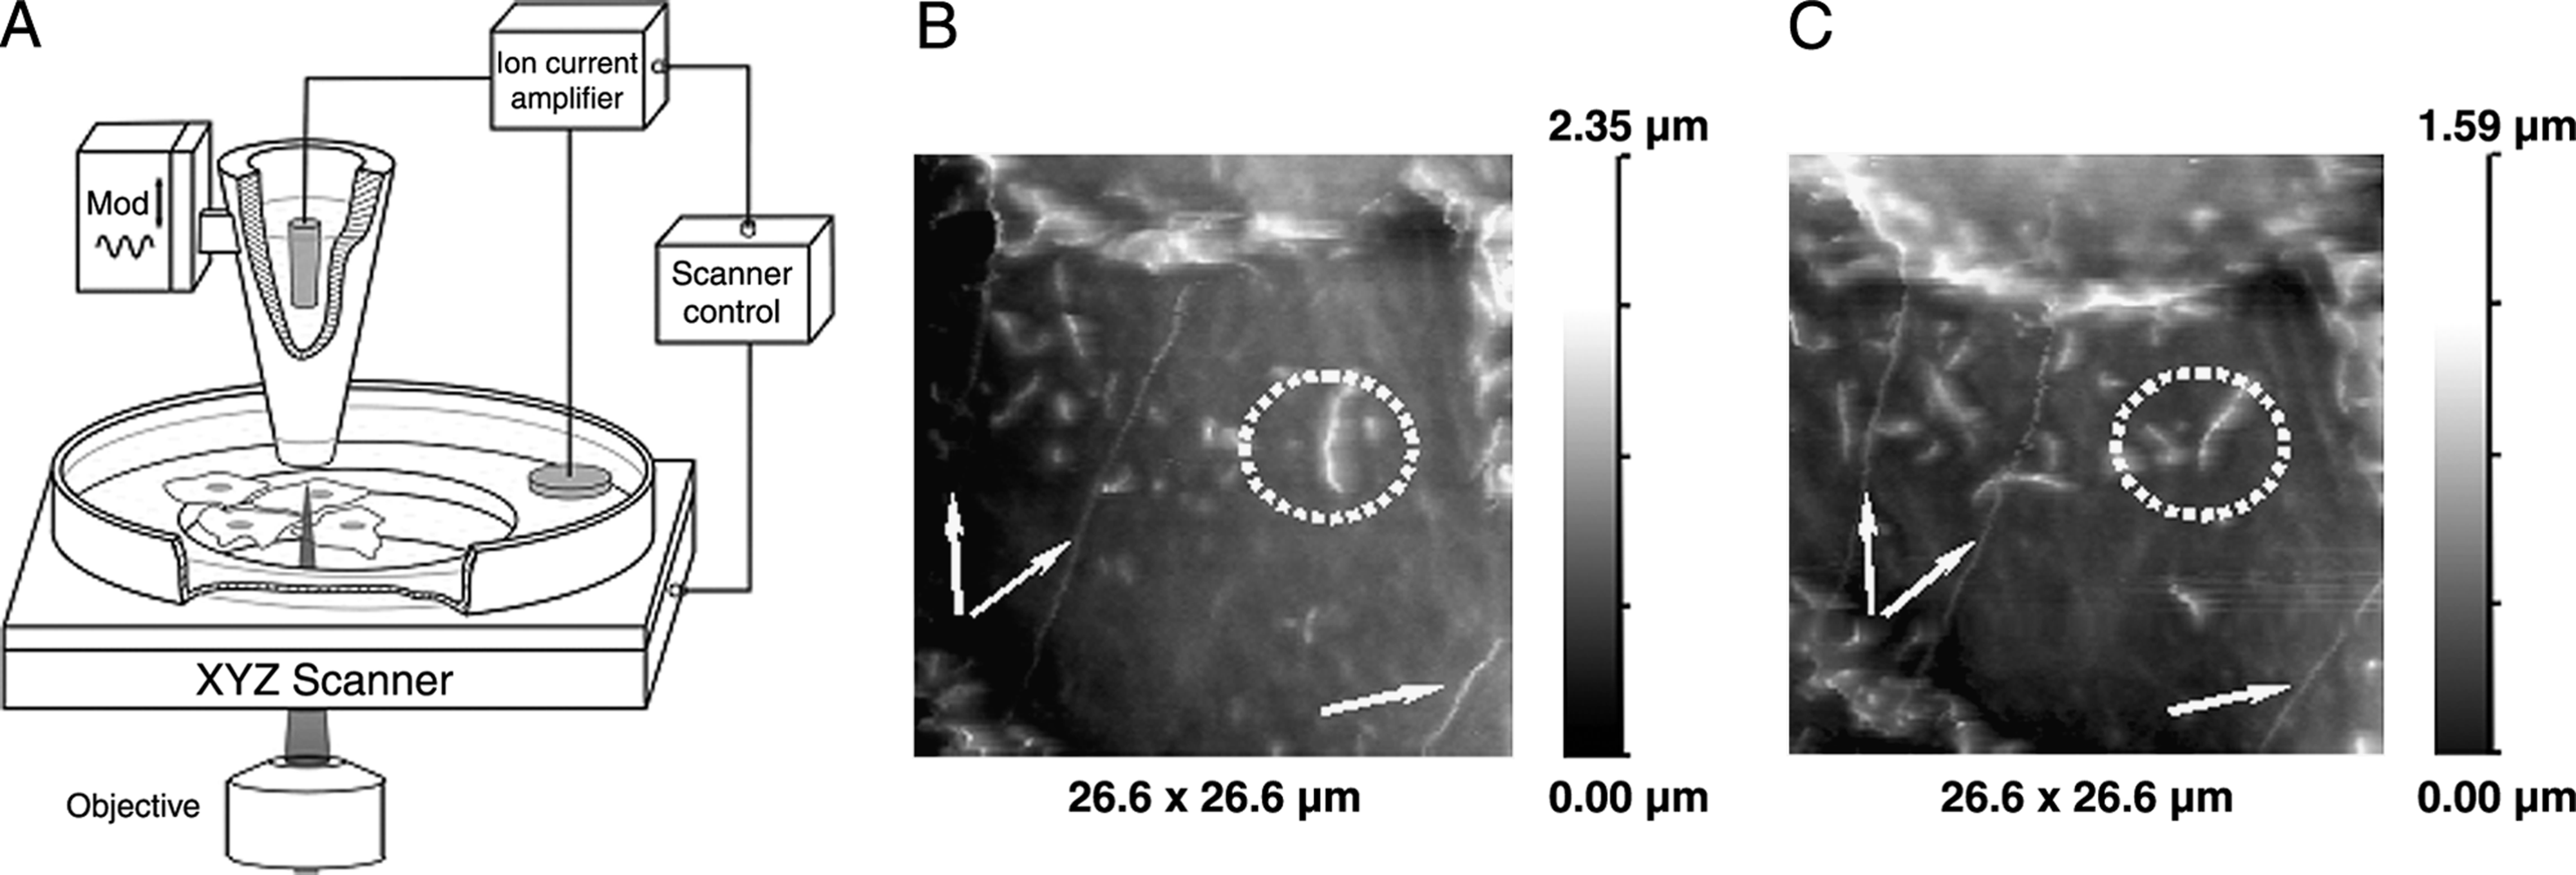
Topographic imaging of the cell was performed using SICM methods. 9 Briefly, the pipette mounted on a piezo stage is moved over the cell while maintaining a fixed distance from the surface (Fig. 1A). This is achieved by a feedback control keeping the ion current flowing through the pipette to the cell surface constant. Scanning surface confocal microscopy (SSCM) is based on a combination of scanning confocal microscope and SICM. In SSCM the cell is moved up and down in the z direction while scanned in the x and y directions, so its surface is always the same distance from the nanopipette (typically, 25–75 nm). A laser beam is passed up a high numerical aperture objective to focus just at the tip of the nanopipette, and a pinhole is positioned at the image plane so that the confocal volume is just below the pipette (Fig. 1A). 21 Thus, fluorescence image of the cell surface is obtained in a single scan, as well as simultaneously captured image of the cell topography. 22
(
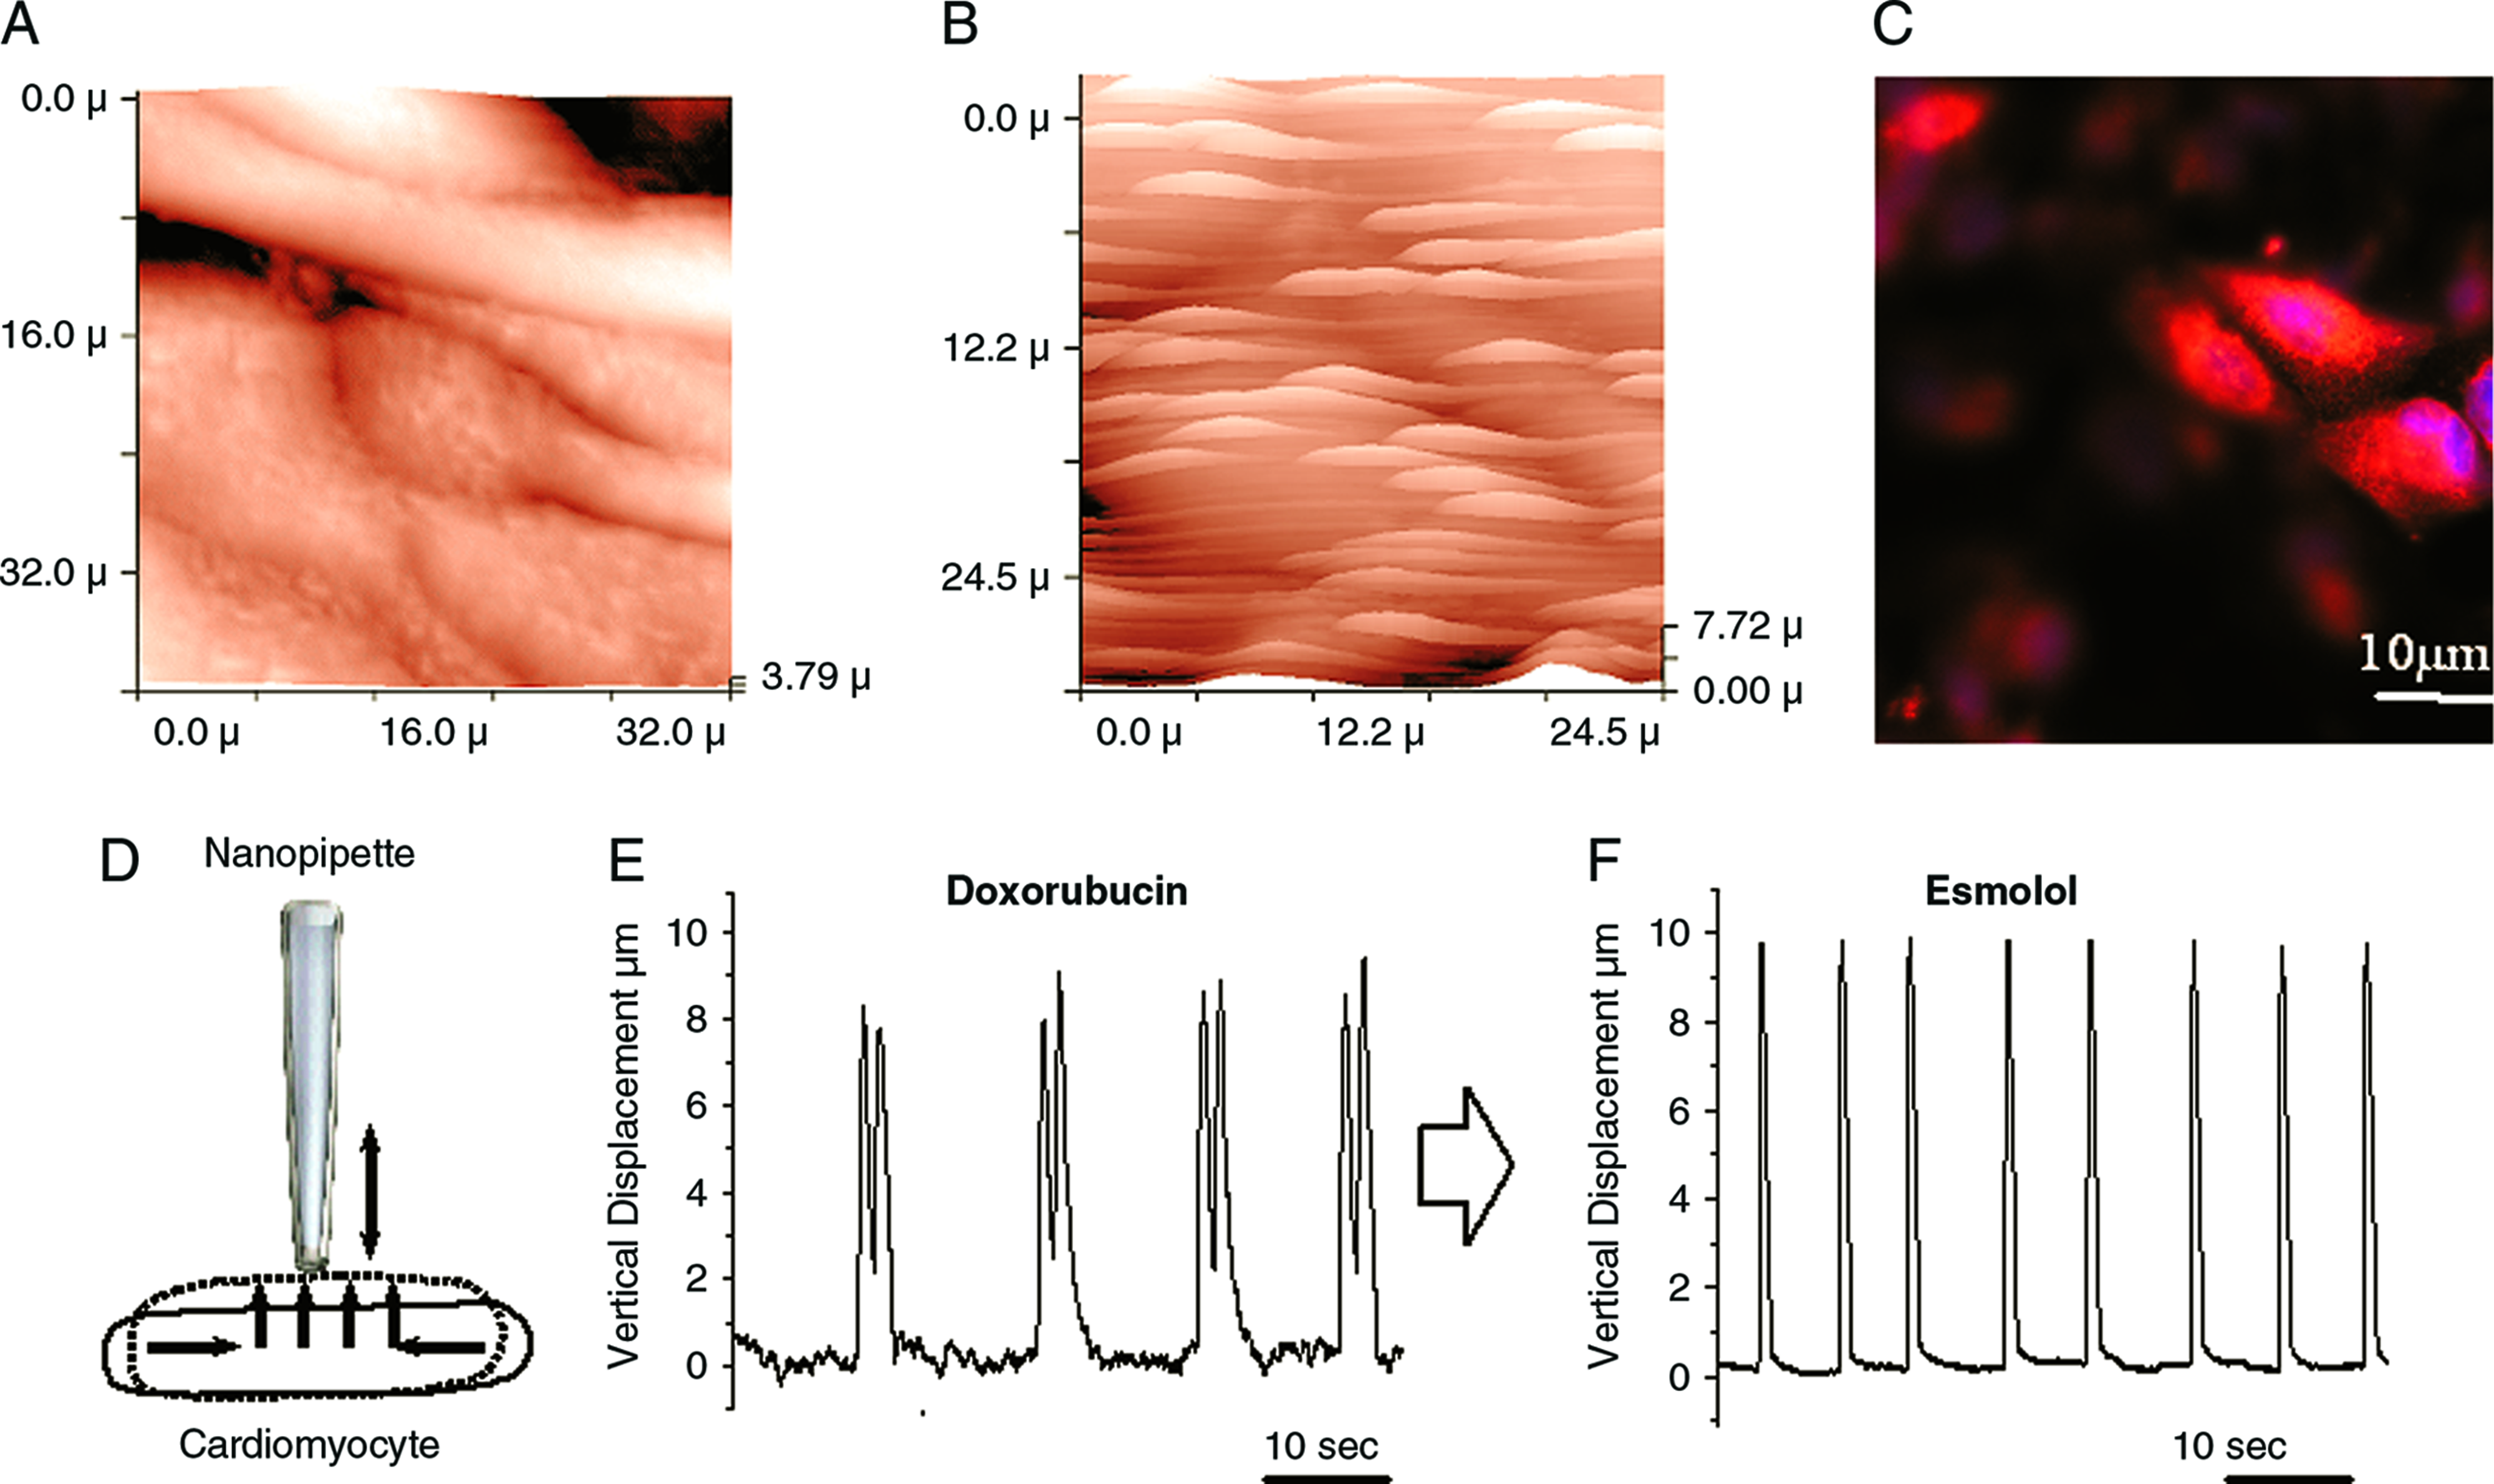
For study of hESC-derived cardiomyocytes (ESCMs), we performed imaging of various ESCM layer zones and identified contracting cardiomyocytes. 23 To investigate the changes in rate and rhythm of cardiomyocyte contraction, we recorded the vertical cell displacement of individual cells using the SICM as described previously. 21 As the cell surface rises during contraction, the micropipette is displaced vertically. This measurement allows alterations in contraction to be recorded (Fig. 3D).
Identification of ESCMs in mixed cultures using SICM. Three-dimensional reconstruction of the SICM image of the surface of a noncontracting cell from the same culture. Three-dimensional reconstruction of the SICM image of the surface of a contracting ESCMs (H7 line) after 18 days in culture. (
For patch clamping (after imaging the surface if required), the pipette is vertically lowered under piezo control until contact with the cell surface is made, usually after moving down by one tip radius (100 nm). The gigaseal is made using conventional methodology (pipette suction).24,25
Results and Discussion
Study of undifferentiated ESCs: quality control of hESC cultures
We imaged the surface of undifferentiated cells from the hES-NCL1 line (Fig. 1). Figure 1B and 1C shows an image selected from a time-lapse observation of undifferentiated cells from the hES-NCL1 line growing on HS (each scan took 17 min). We also present a movie from a 9 h scanning (Supplemental Movie S1, available online at
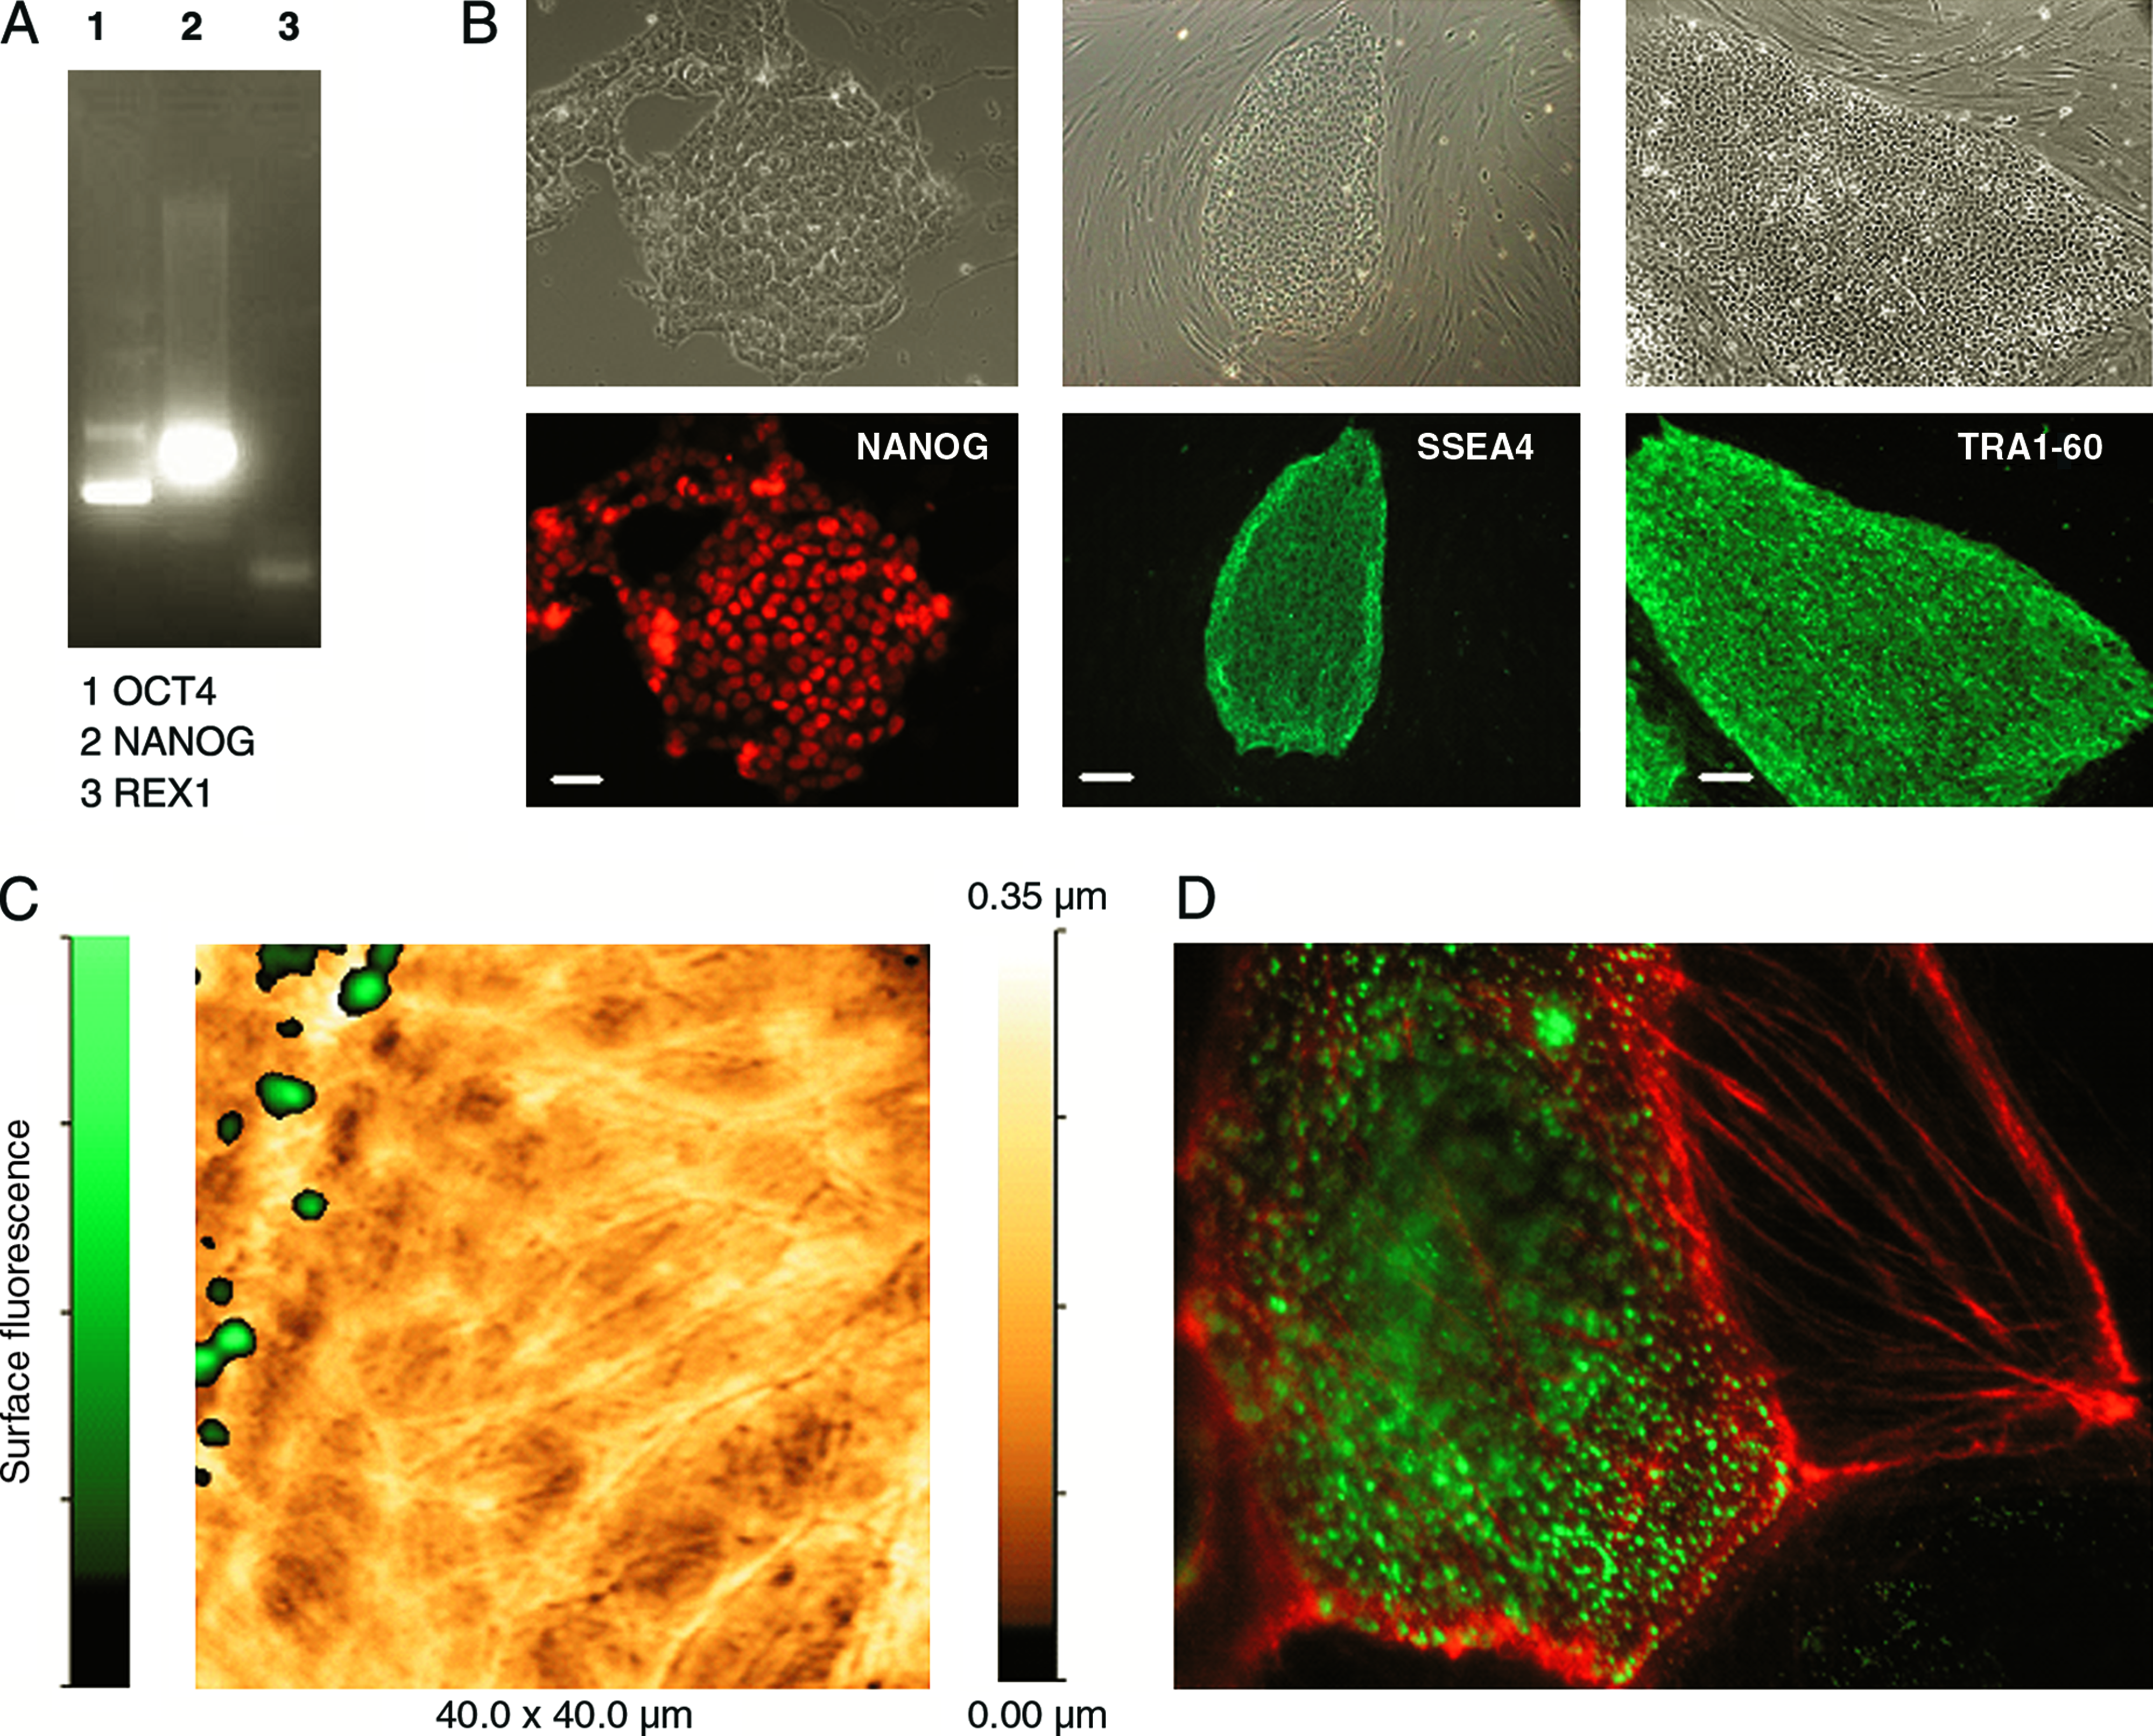
Undifferentiated cells expressed Oct-4, Nanog, and Rex-1 as revealed by RT-PCR analysis (Fig. 2A). They also were positive for several known markers of SCs, namely, TRA-1-60, SSEA-4, and Nanog, when stained with corresponding antibodies (Fig. 2B).
Quality control of undifferentiated hES-NCL1 cells. (
Using the combination of SICM with confocal microscopy, we mapped specific cell-surface marker for undifferentiated hESCs, after staining with appropriate antibodies (e.g., SSEA-4) and localized these markers on specific cell structures. We monitored hESCs in culture as they grew and found cells that started to differentiate also lost their characteristic microvillar structures. Figure 2C shows overlay of simultaneously obtained topographic and surface-confocal fluorescence images for SSEA-4 of hESCs from NCL1 line growing on HS. The figure shows two cells. The cell on the right has elongated structures on the surface, perhaps reflecting underlying actin bundles, and is SSEA-4 negative. The cell on the left has microvilli that colocalized with SSEA-4. Figure 2A represents the cells on the same coverslip after fixation and double staining with anti-SSEA-4 and rhodamine phalloidin. The cell with actin bundles is SSEA-4 negative. Immunostaining confirmed that hESCs that had lost microvilli and attained prominent cytoskeletal structures are indeed the cells that have differentiated. Using immunohistochemistry and immunoscanning electron microscopy, Cui et al. showed that SSEA-1 was located preferentially on the edge of low protuberances and microvilli in mouse ESCs. 26 Also immunostaining confirmed that hESCs that had lost microvilli and attained prominent cytoskeletal structures are indeed the cells that have differentiated. Our observations are in agreement with previous findings of Krtolica et al., who have seen the disappearance of microvilli on hESCs that underwent differentiation by confocal microscopy and electron microscopy. 27
We can scan live hESCs for several days and monitor how the surface features change as the cells differentiate.
Study of ESCMs
Using SICM, we can identify individual ESCMs in a beating cluster among mixed population of differentiating cells and make measurements of contractile activity from those ESCMs. 23 We produced a scan of a layer of differentiating hESCs, and were able to locate individual beating ESCMs (Fig. 3). Figure 3A shows a three-dimensional reconstruction of the SICM image of the surface of noncontracting cells from the H7 line after 18 days in culture. Figure 3B shows a three-dimensional reconstruction of the SICM image of the surface of a contracting ESCM from the same culture. Figure 3C confirms staining of these beating areas after fixation with anticardiac myosin heavy chain (MHC) marker.
We can study the contractile properties of a single cell by measuring the vertical displacement of the SICM pipette (depicted in Fig. 3D), as described previously.21,23 We monitored the contraction of an individual cardiomyocyte noninvasively before and after the exposure to a number of agents that either modulate contraction or cause arrhythmias. Previously, we reported that the β-antagonist esmolol can restore rhythm in doxorubicin-treated cultures of neonatal rat cardiomyocytes 28 and mouse ESCMs. 23 Here, we studied the effect of esmolol on human embryonic stem cell-derived cardiomyocytes (hESCM) that have been made to beat arrhythmically by prior incubation with doxorubicin. Figure 3E and 3F shows recordings of the contraction of a single ESCM within a cluster. Adding acutely high dose of doxorubicin (100 μg/mL) induces arrhythmia (Fig. 3E), and subsequent addition of esmolol (1 μg/mL) restores rhythmic contractions (Fig. 3F). This assay allowed, within the same experiment, the identification of all ESCMs within the layer, and an accurate measure of the response of any single ESCM.
Loading the cells with the calcium indicator Fluo-4 and using a combination of SICM and confocal microscopy, we can measure the local concentration of calcium ions simultaneously with the cell motion. 21
Study of SC-derived neurons
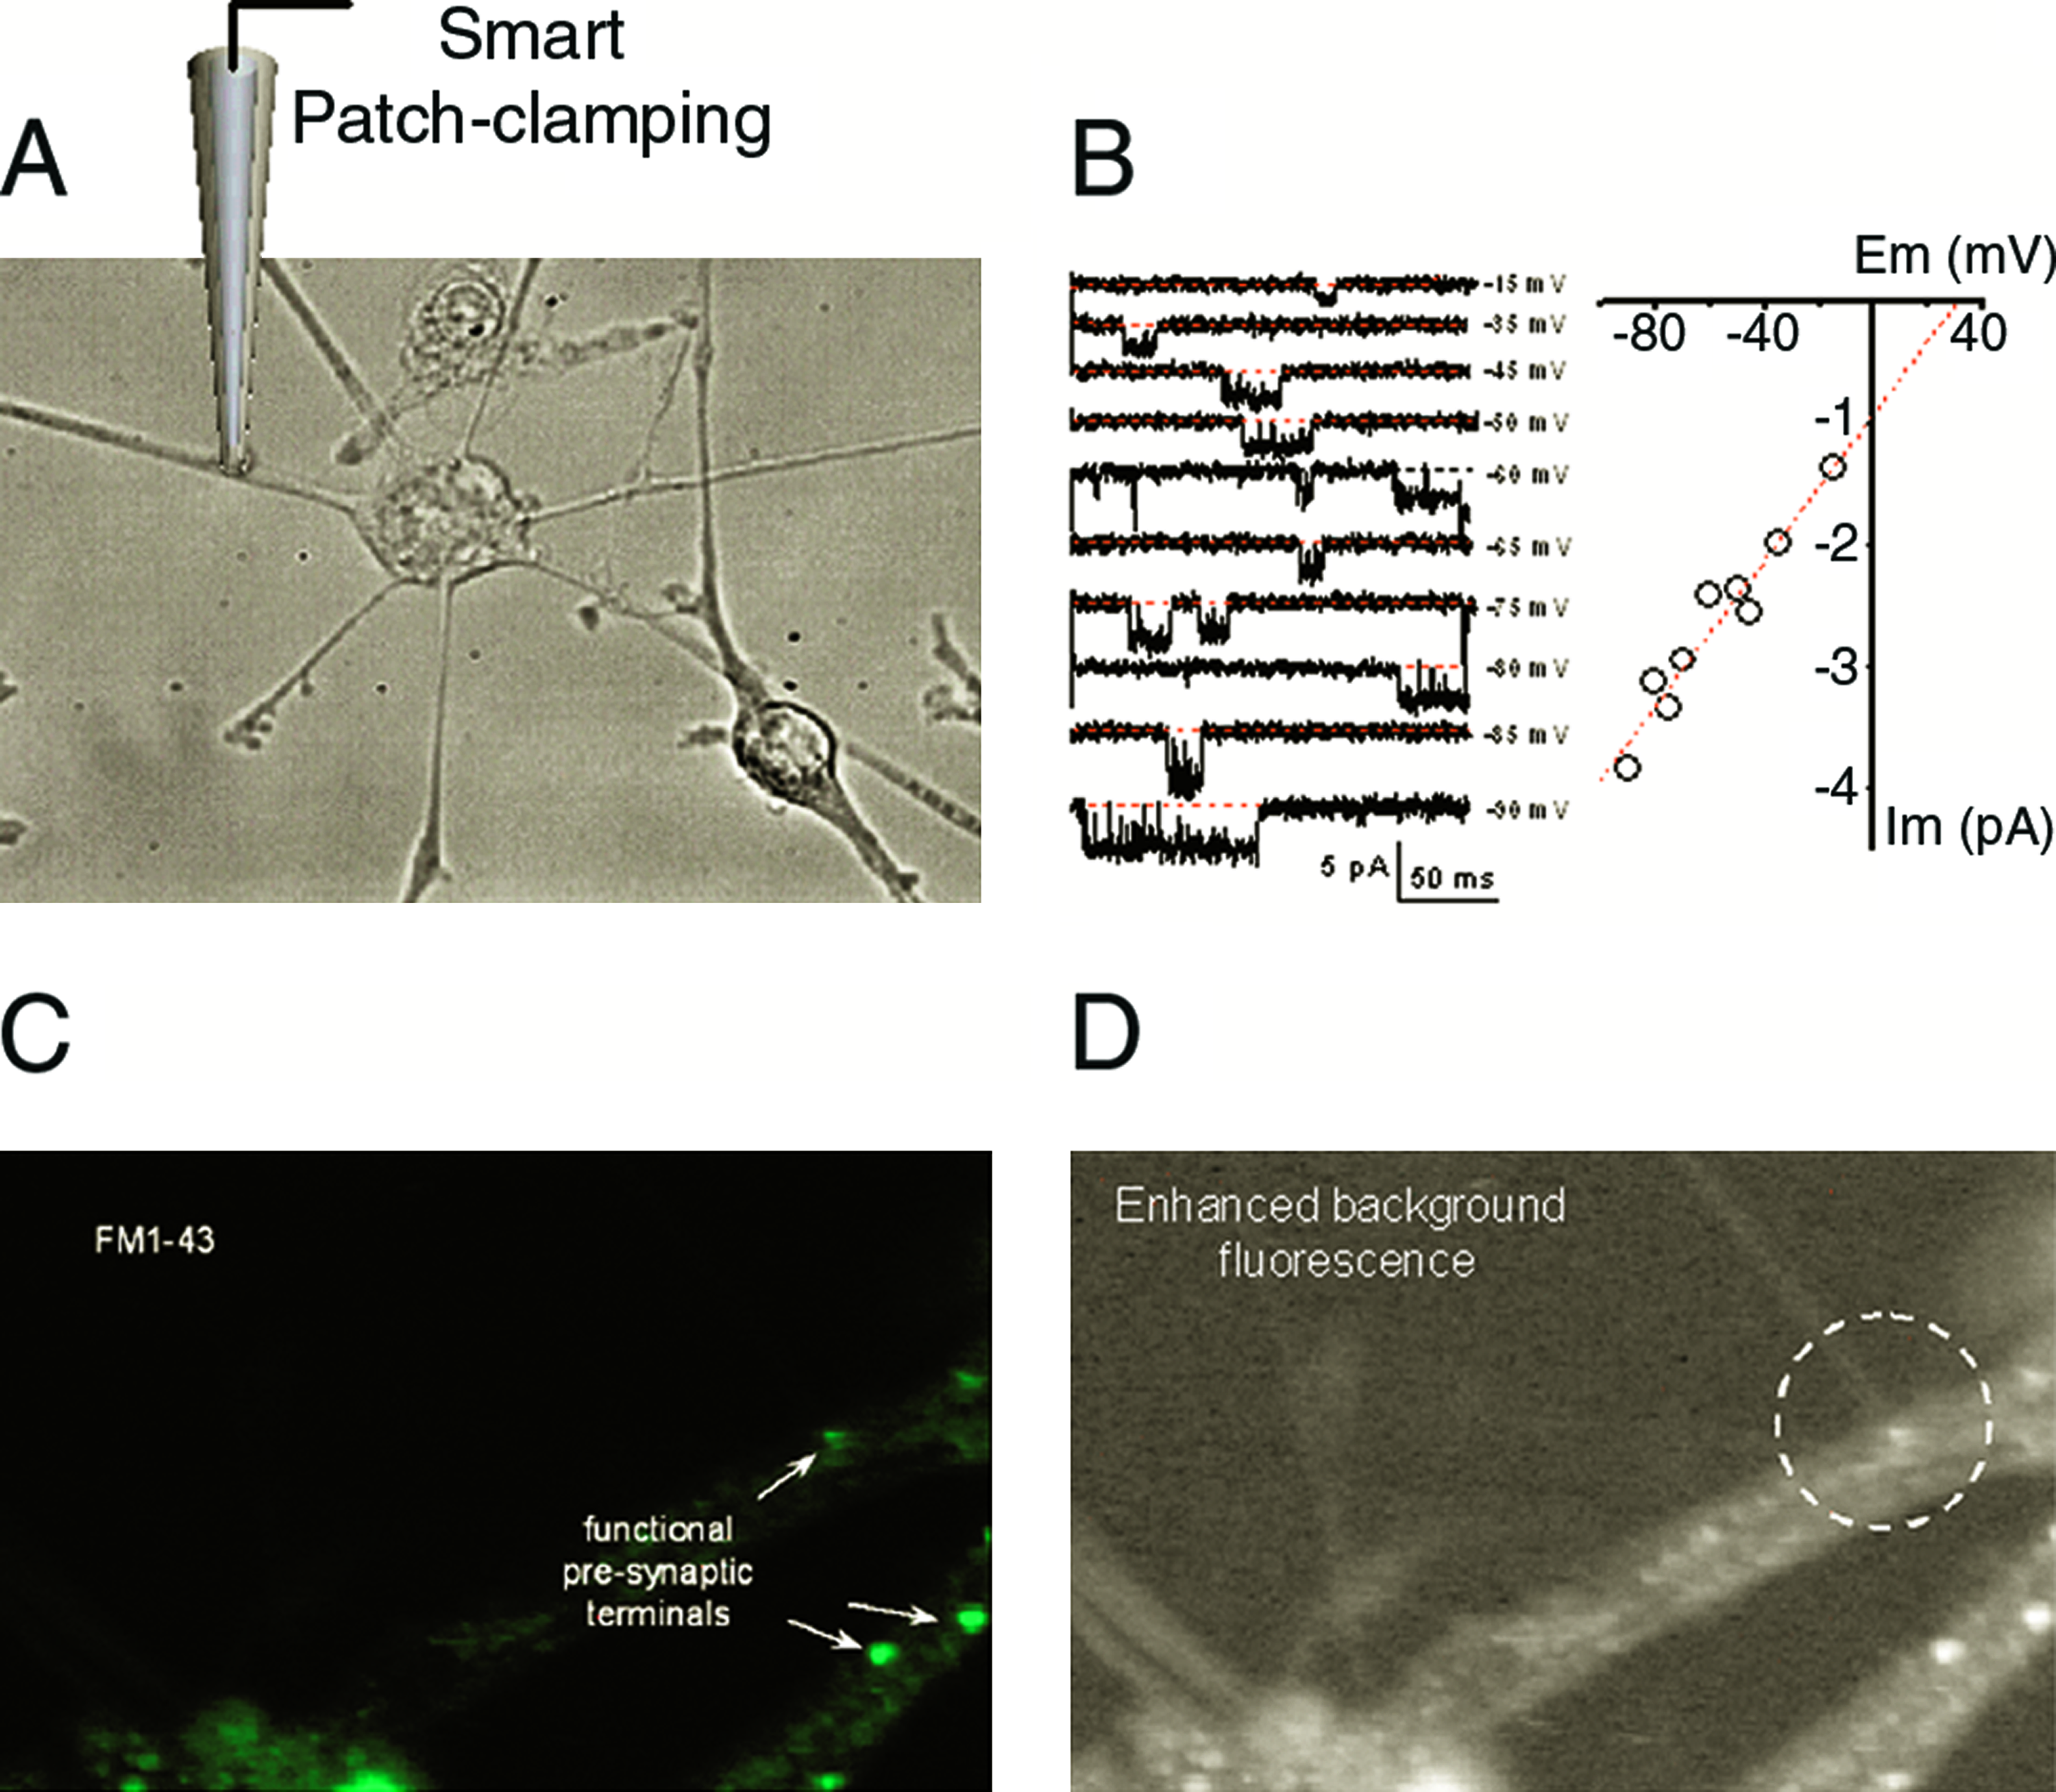
We can also evaluate the degree of neuronal differentiation of SC-derived neurons. In general, studying neurons is hampered by the difficulties of assessment of the maturity of SC-derived neuronal cells. Using our technique of combined SICM and confocal microscopy, we can identify synapses in primary cultures of neurons and in cultures of SC-derived neuronal cells. We can then establish the degree of maturity of these synapses by performing standard patch-clamp recording of ion channels in the different regions of the SC-derived neuronal cells. This is done using the same pipette that has been used to image the cells, as an electrophysiological patch pipette. The advantage here is that we combined high-resolution imaging with fluorescence microscopy and patch-clamp into a single set-up, thus enabling us to target the synapse and quickly assess the degree of differentiation of SCs into neurons.
Figure 4 shows possible evaluation of neuronal differentiation of neural crest–like SCs using SICM. Single-channel recording from neural crest–like SCs confirms the presence of a sodium-like channel (Fig. 4B). Staining with FM1-43 dye confirmed active synapses in sensory neurons derived from multipotent neural crest–like SCs (Fig. 4C, D). Thus, we can exploit our abilities to target synapses in fine dendrites, where major neuronal information processing occurs, and obtain detailed functional distribution of the key ion channels and receptors at the synapses. Further, we can probe how this distribution changes as SCs evolve in development and in the repair of nervous tissue.
Evaluation of neuronal differentiation of neural crest–like SCs using SICM. (
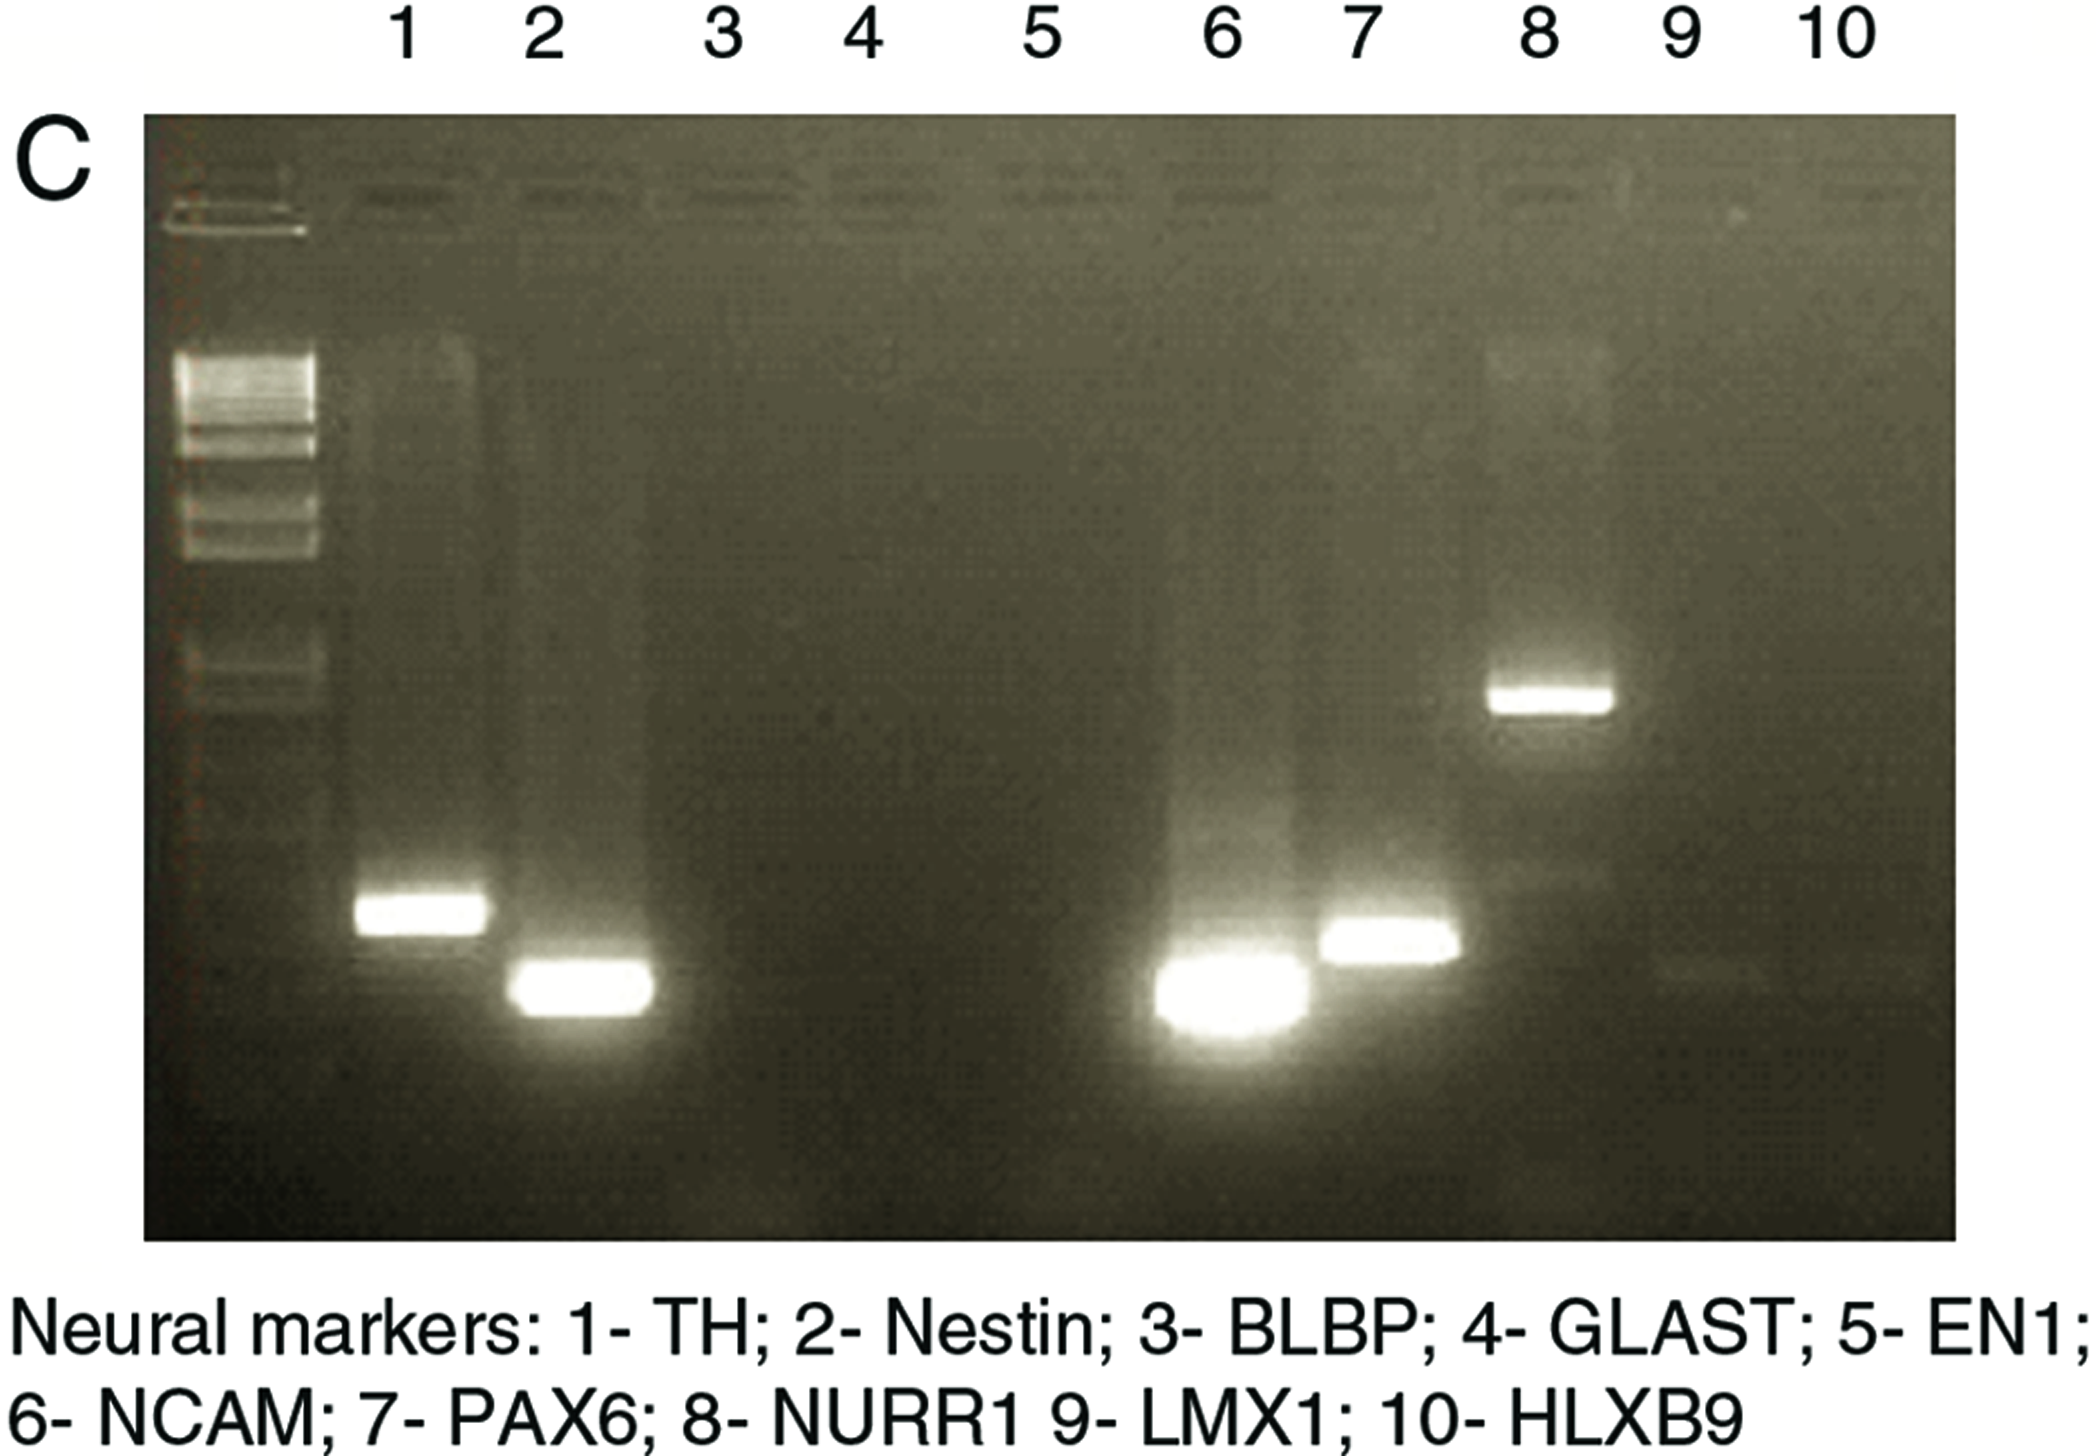
Neuron-like cells were obtained after spontaneous neural differentiation of undifferentiated cells from the hES-NCL1 line. These cells exhibited neural characteristics both morphologically and by the expression of several key neural markers. The neural cell shape was measured using scanning ion conductance microscope. Figure 5A shows a topographical image of a dendrite of a neuron-like cell. Fluorescence from FM1-43 dye that was delivered to the vesicles was recorded at the same time from this area and is also shown in Figure 5A. Neuron-like cells were also stained positive with anti-tubulin III antibodies (Fig. 5B). Several neuronal protein mRNAs were detected in these neuron-like cells by RT-PCR analysis (Fig. 5C).
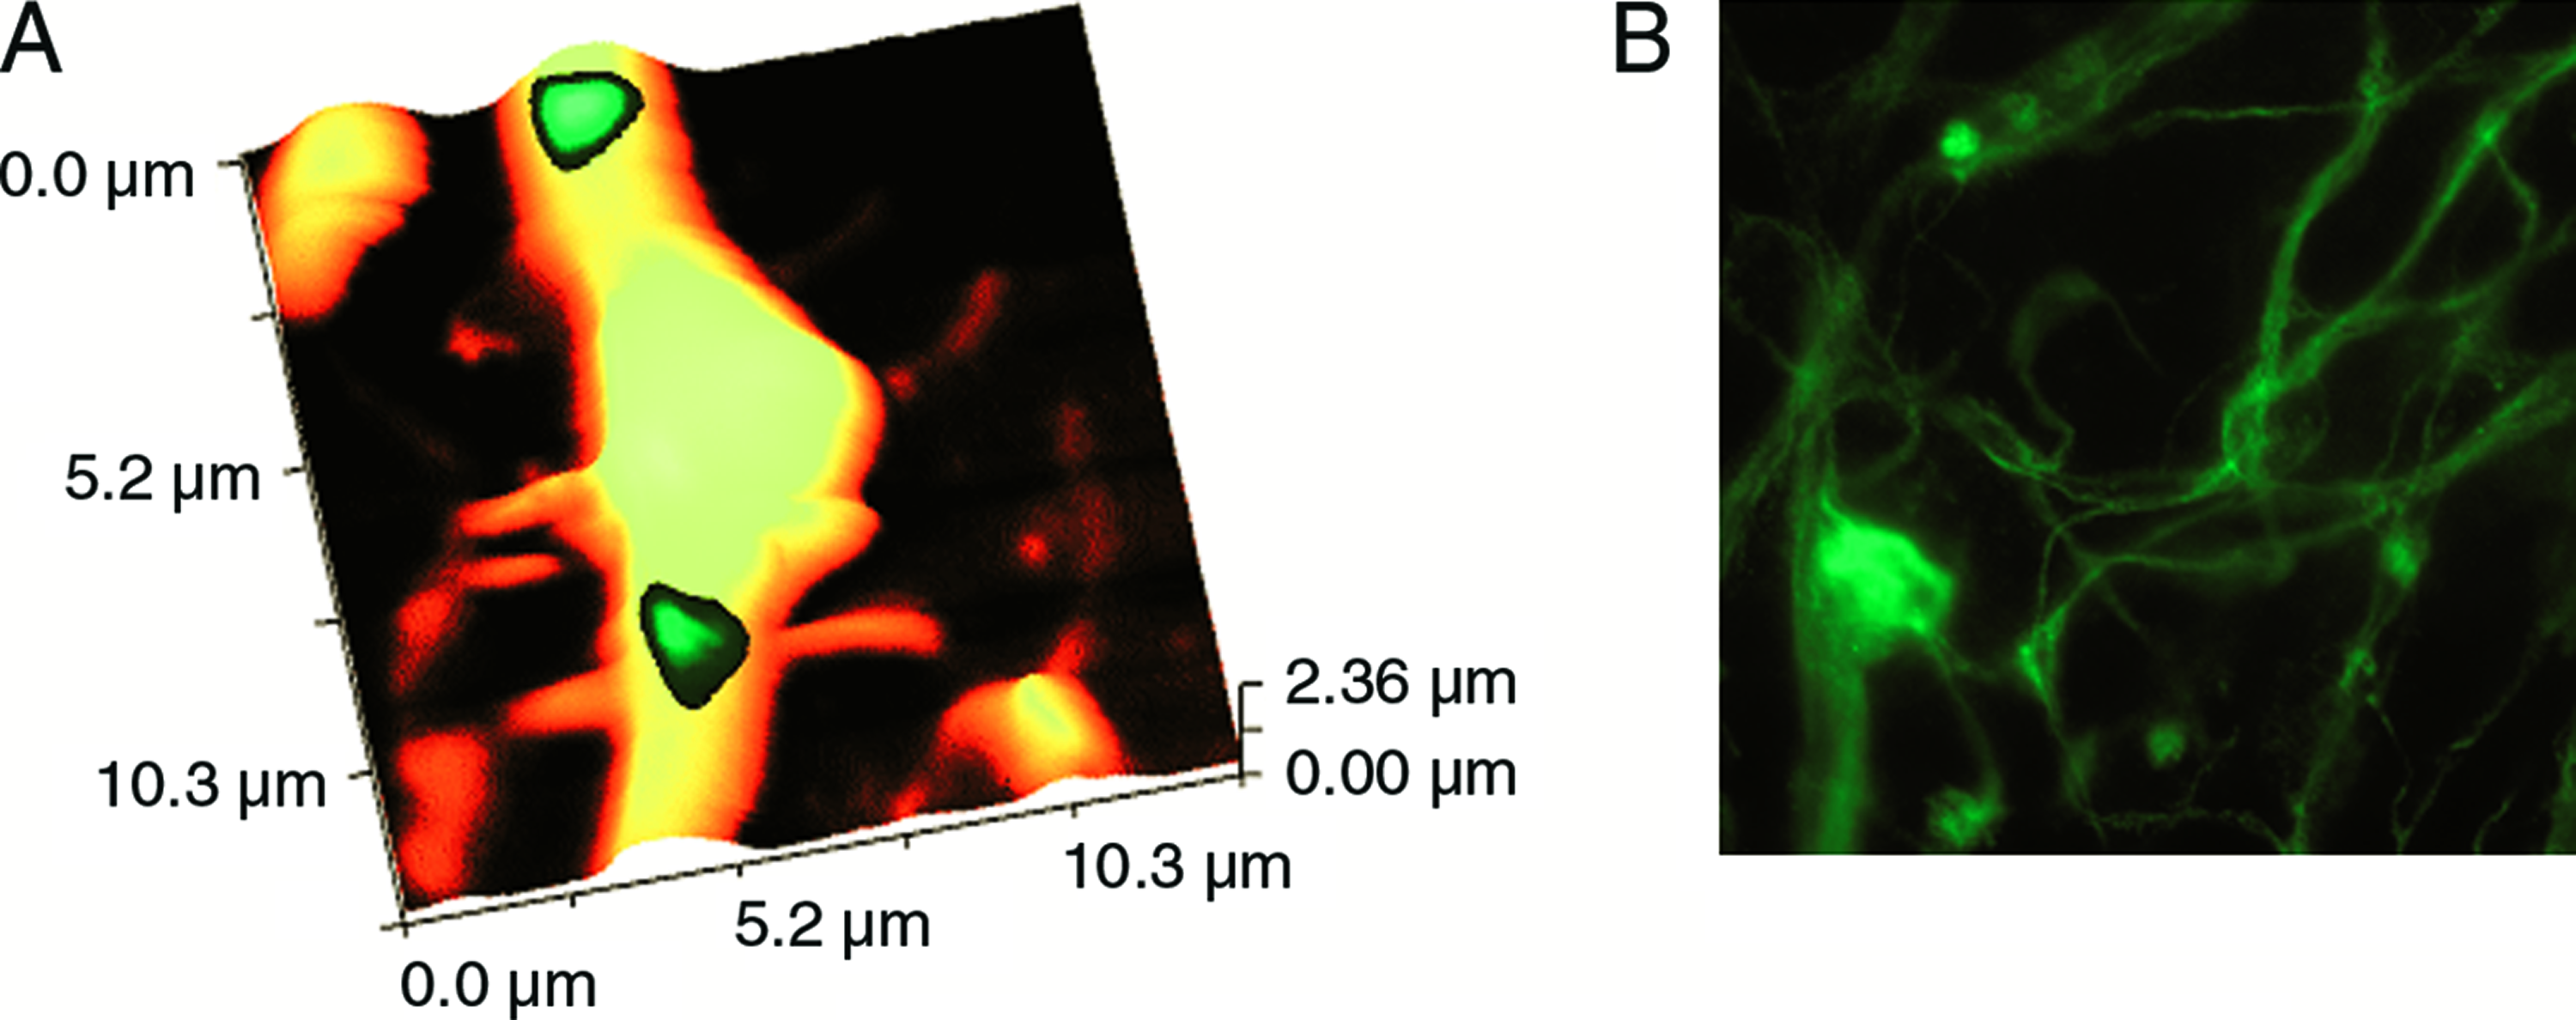
hESC-derived neuronal cells (NCL1 line). (
Summary
SICM and SICM-based techniques (SSCM and smart patch) are powerful tools to noninvasively characterize the physiology of undifferentiated and differentiated ESCs, including hESCs and non-ESCs.
Using these techniques, we can
Topographically image the surfaces of undifferentiated hESCs with high resolution (down to 20 nm) for long periods (up to 48–72 h) and study the surface as the cells differentiate. Resolve small surface structures (microvilli and cilia) and study their dynamics. Perform quality control of the hESC growth conditions. Using SSCM we can study the distribution of fluorescent-labeled differentiated markers on the surface of hESCs. Identify individual beating ESCMs among the mixed cell types that exist in culture. Nonintrusively measure the contraction and calcium dynamics of individual ESCM in situ at different stages of differentiation using a combination of SICM and confocal microscopy simultaneously. Identify synapses in SC-derived neuronal cells. Identify pre- and postsynaptic membrane. By positioning of the scanning pipette probe, obtain a gigaseal for patch clamping. Record single channels from different regions of the SC-derived cells using smartpatch clamp.
Taken together, SICM-based techniques can be applied to noninvasively characterize and study the differentiation of SCs.
Footnotes
Acknowledgments
Research was supported by the Biotechnology and Biological Sciences Research Council; The National Centre for the Replacement, Refinement and Reduction of Animals in Research; University Technology Mara in Malaysia; One North East Developmental Agency; Wellcome Trust and the Royal Society. E.V.S. was supported by the Wellcome Trust (Grant 078310). We are grateful to Dario Melguizo for technical support.
Disclosure Statement
No competing financial interests exist.
References
Supplementary Material
Please find the following supplemental material available below.
For Open Access articles published under a Creative Commons License, all supplemental material carries the same license as the article it is associated with.
For non-Open Access articles published, all supplemental material carries a non-exclusive license, and permission requests for re-use of supplemental material or any part of supplemental material shall be sent directly to the copyright owner as specified in the copyright notice associated with the article.