
Abstract
Endothelial cells (ECs) play a crucial role in maintaining tissue homeostasis and functionality. Depending on their tissue of origin, ECs can be highly heterogeneous regarding their morphology, gene and protein expression, functionality, and signaling pathways. Understanding the interaction between organ-specific ECs and their surrounding tissue is therefore critical when investigating tissue homeostasis, disease development, and progression. In vitro models often lack organ-specific ECs, potentially limiting the translatability and validity of the obtained results. The goal of this study was to assess the differences between commonly used EC sources in tissue engineering applications, including human umbilical vein ECs (HUVECs), human dermal microvascular ECs (hdmvECs), and human foreskin microvascular ECs (hfmvECs), and organ-specific human pancreatic microvascular ECs (hpmvECs), and test their impact on functionality within an in vitro pancreas test system used for diabetes research. Utilizing high-resolution Raman microspectroscopy and Raman imaging in combination with established protein and gene expression analyses and exposure to defined physical signals within microfluidic cultures, we identified that ECs exhibit significant differences in their biochemical composition, relevant protein expression, angiogenic potential, and response to the application of mechanical shear stress. Proof-of-concept results showed that the coculture of isolated human islets of Langerhans with hpmvECs significantly increased the functionality when compared with control islets and islets cocultured with HUVECs. Our study demonstrates that the choice of EC type significantly impacts the experimental results, which needs to be considered when implementing ECs into in vitro models.
Impact Statement
Endothelial cells (ECs) form the inner lining of our vascular system facilitating the supply of oxygen and nutrients to and removal of waste from surrounding tissues. ECs show significant heterogeneity depending on their tissue of origin and play a crucial role in tissue homeostasis and disease development. In this work, we investigate the differences between ECs from various tissues regarding their biochemical composition, angiogenic potential, adaptation to flow, and coculture properties in vitro in the context of diabetes research. Our results display that EC origin significantly impacts their biochemical and functional characteristics, which needs to be considered when developing in vitro test systems for disease modeling.
Introduction
The vascular system transports oxygenated blood from the heart and lungs to organs and peripheral tissues while simultaneously providing nutrients and removing waste products. The variety of tasks are performed by different types of vessel structures, including arteries and veins (macrovasculature) as well as arterioles and venules, and capillaries (microvasculature). 1 These vessel structures are composed of specialized cell types, such as endothelial cells (ECs), smooth muscle cells, pericytes, and fibroblasts. ECs play a major role in the integrity of the vasculature, as they form the inner lining of the blood vessels (endothelium) and regulate the nutrient and gas exchange between the blood and the surrounding tissue. 2 It is well established that ECs are highly contributing to tissue homeostasis by secreting several angiocrine factors, extracellular matrix (ECM) proteins, and other growth factors that can regulate cellular survival, proliferation, differentiation, and apoptosis.1,2 ECs are also involved in both innate and adaptive immune response and are considered to be key players in various diseases during onset and progression.2,3 The endothelium formed by ECs can be classified into three different groups: continuous, fenestrated, and discontinuous. The categorization depends on the location within the vascular system and organs, its required degree of membrane trafficking, and its morphological appearance. 3 The continuous endothelium forms a tight homogenous layer with adherens junctions and limited membrane trafficking potential. It can be found, for example, in large vessels, the endocardium as well as the brain and lungs.3,4 Fenestrated endothelium expresses higher levels of fenestrae, a round subcellular structure covered by nonmembranous diaphragms which connects the apical and basal sides of the cell. 1 Hence, compared with the continuous endothelium, the fenestrated endothelium facilitates exchange between blood and peripheral tissues. It can be found, for example, in the microvasculature of endocrine glands and the digestive system.5,6 The discontinuous endothelium is characterized by lack of basement membrane accompanied by sinusoidal gaps, which enhances permeability compared with the other two types of endothelium.1,7 It is mainly present in hepatic sinusoidal vascular beds but can also be found in bone marrow and the spleen.1,6 There is a large body of literature, by the group of William C. Aird, among others, that comprehensively outlines EC heterogeneity regarding structure, function, and mechanisms, and why these differences are important to be acknowledged.1,2,5,6,8–10
The pancreas is a highly vascularized organ consisting of an exocrine and endocrine part. 11 The endocrine pancreas, also known as islets of Langerhans, only account for 1–2% of the organ volume; however, they receive ∼10–15% of the blood in order to sense and tightly control blood glucose levels. 12 This vascularization results in a natural proximity of ECs with cells of the islets of Langerhans, including glucagon-secreting α-cells and insulin-secreting β-cells. 13 Islet cells and ECs contribute to tissue homeostasis by secreting growth factors (such as vascular endothelial growth factor A (VEGF-A), transforming growth factor β (TGF-β), as well as basement membrane proteins (including collagen type 4 and laminins) creating a feedback loop which maintains their functionality and survival. 3 Diabetes mellitus type 1 is characterized by the autoimmune reduction in β-cell mass accompanied by dysregulation of blood glucose due to lack of insulin. One potential treatment in severe cases is the transplantation of donor islets 14 ; however, the removal of existing vascularization during the isolation process in combination with lack of vascularization at the transplant site results in a loss of up to 60% of transplanted islets. 15 Reestablishing vascularization and understanding the interaction between ECs and islets of Langerhans is therefore crucial to overcome this limitation. Recent advances have created a powerful platform to create vascularized organoids to study this interaction in vitro. Bender et al. developed a vascularized 3D model composed of colony-forming ECs and donor islets on a microfluidic platform which showed perfusable blood vessels that prolonged the functionality and survival of donor islets. 16 In another study, Wassmer et al. established bio-engineered prevascularized islet organoids consisting of amniotic epithelial cells, human umbilical vein ECs (HUVECs) and endocrine islet cells. 12 These organoids showed improved functionality compared with donor islets in vitro and, more importantly, improved engraftment and vascularization in mice posttransplantation. These studies show that prevascularization strategies can help to reduce the time to establish vascularization posttransplantation and underline the important role of ECs on the functionality of the endocrine pancreas; however, many studies do not yet take into account the heterogeneity of ECs from different tissues. 3 ECs are a vital contributor to tissue homeostasis and functionality via paracrine and angiocrine signaling, and the secretion of growth factors and ECM proteins. 17 Hence, understanding the interaction between the organ-specific ECs and the surrounding tissue is critical when investigating disease development, progression, and possible treatment options, specifically when recapitulating disease models in an in vitro system. Over the last years, advancements in analysis techniques, such as single cell sequencing, have advanced our understanding of organ-specific EC heterogeneity. 17 These findings highlighted that ECs differ significantly regarding morphology, pathway enrichment, and secretory proteins. Consequently, choosing the most representative EC type for in vitro models can significantly affect the experimental outcome and improve the translatability of results, especially regarding the differences in the secretory profile and specific EC markers that influence organ homeostasis and functionality. Furthermore, organ-specific modeling could increase the relevance of in vitro models in drug screening approaches to discover pathway-specific agents for disease treatment.3,17
Considering that a PubMed search for “HUVECs” and “in vitro“ has over 9,000 results, the impact of using a more organ-specific EC as opposed to a commonly used EC could have a significant impact on the overall body of science. In addition to HUVECs, microvascular ECs have been established in in vitro experiments since the 1970s, as they play a significant role in inflammatory responses, wound healing, and tumor progression. The two major tissues of origins for microvascular ECs are human adult skin as well as neonatal foreskin. 18 Hence, in this study, we investigated differences between EC types commonly used for in vitro research and compared them to pancreas-specific ECs to improve current pancreatic in vitro models. We employed Raman microspectroscopy and imaging which allowed the identification of differences between HUVECs, human dermal microvascular ECs (hdmvECs), human foreskin microvascular ECs (hfmvECs) and human pancreatic microvascular ECs (hpmvECs) in their native environment as well as postisolation. As ECs are the main cells reestablishing vasculature after injury or posttransplantation, we investigated the angiogenic potential of all four EC types and found significant differences between HUVECs and hpmvECs compared with hdmvECs and hfmvECs regarding their efficiencies in establishing a stable network. We then characterized the behavior of HUVECs and hpmvECs under different flow and found significant differences in their reaction to flow application. Finally, we cocultured ECs with isolated human donor islets and found that islets cocultured with hpmvECs showed significantly higher insulin secretion upon glucose stimulation. The results of this study demonstrate that the choice of EC type significantly influences the experimental outcome in vitro and highlight the importance of EC origin for in vitro organ and disease modeling.
Materials and Methods
Ethics information
Human islets for research were provided by the Alberta Diabetes Institute IsletCore at the University of Alberta in Edmonton (http://www.bcell.org/adi-isletcore.html) with the assistance of the Human Organ Procurement and Exchange program, Trillium Gift of Life Network, and other Canadian organ procurement organizations. Islet isolation was approved by the Human Research Ethics Board at the University of Alberta (Pro00013094). All donors’ families gave informed consent for the use of pancreatic tissue in research. The human islets for research were used according to the permission of the local research ethics committee of the Eberhard Karls University Tübingen (168/2021BO2). ECs were isolated according to the permission of Landesärztekammer Baden-Württemberg (IRB#F-2020–166, IRB#190/2005V) and the research ethics committee of the Eberhard Karls University Tübingen (253/2023BO2).
EC culture
All ECs were passaged at a confluency of 90% under standard humidified conditions (37°C, 20% O2, 5% CO2) and used for experiments up to passage 6. HUVECs (C-12205, PromoCell) were cultured in complete EC growth medium (C-22010, PromoCell) with 1% penicillin/streptomycin (15070–063, Gibco) according to the manufacturer’s protocol and as described earlier. 15 For subculturing, HUVECs were washed with phosphate-buffered saline (PBS) (14200075, Gibco), detached using 0.25% trypsin-ethylenediaminetetraacetic acid (EDTA) (25200072, Gibco) for 3 min at room temperature (RT) before stopping the reaction with neutralization solution consisting of PBS with 1% fetal bovine serum (FBS) (16000044, Gibco) and 1% bovine serum albumin (BSA) (A94118, Sigma-Aldrich). Cells were centrifuged at 200 ×g for 3 min at RT, resuspended, and counted with an automated cell counter (Countess3, Invitrogen).
hdmvECs and hfmvECs were isolated using enzymatic digestion with dispase and trypsin as described earlier.19,20 Briefly, human dermis was incubated for 40 min in 0.05% trypsin-EDTA (25300054, Gibco) at 37°C and 5% CO2 before rinsing with PBS. ECs were mechanically scraped from the dermis, filtered, and centrifuged at 200 ×g for 5 min. ECs were resuspended and cultured in EC growth medium MV2 (C-22011, PromoCell) and subcultured following the HUVEC protocol.
hpmvECs (P10473, Innoprot) were cultured according to manufacturer’s instructions in flasks coated with bovine plasma fibronectin (P8248; Innoprot) at a concentration of 2 µg/mL in complete EC medium (P60104, Innoprot) with 5% FBS and 1% penicillin/streptomycin. For subculturing, hpmvECs were washed with PBS and detached using Primary Cells Detach Kit (P60305, Innoprot) according to the manufacturer’s protocol. Briefly, hpmvECs were detached by adding PBS and trypsin-EDTA solution to the flask in a 10:1 ratio and incubated for 2 min under standard humidified conditions. The solution was transferred to a falcon tube containing FBS to stop the reaction. The flask was placed again in the incubator for 1 min before the flask was gently tapped from the side to ensure cell detachment. The flask was washed using neutralization solution and transferred to the falcon tube. Detached hpmvECs were centrifuged at 200 ×g for 5 min, resuspended, and counted with an automated cell counter (Countess3, Invitrogen).
A summary of the culture conditions of the different experiments can be found in Supplementary Table S1.
Angiogenesis assay
Angiogenesis assays were performed using the µ-Slide 15 Well 3D (81506, ibidi). Wells were coated with 10 µL of growth factor reduced Matrigel (356231, Corning) and incubated for 30 min until gelation. ECs were seeded at a density of 80’000 cells/cm2 (10’000 cells per well) according to the manufacturer’s application note and incubated for 24 h. All ECs were seeded in EC growth medium MV2 to provide the same growth factors for all EC types. Three brightfield (BF) images per well were obtained after 0.5, 6, 12, and 24 h with 10× magnification on a Zeiss Axio Observer Z1 (Carl Zeiss). The network formation was automatically analyzed using the FIJI’s AngiogenesisAnalyzer plugin (V1.53c, NIH). Medium controls were performed in parallel seeding 31,250 cells/cm2 (10,000 cells per well) in tissue culture treated 96-well plates using their corresponding medium or EC growth medium MV2. BF images of medium controls were obtained after 24 h with 10× magnification on a Zeiss Axio Observer Z1 (Carl Zeiss).
Bioreactor experiments
Bioreactor experiments were performed using the ibidi pump system (10902, ibidi) and μ-Slide I Luer 3D (87176, ibidi). A collagen type 1 (COL1) hydrogel (MS280111; Fraunhofer IGB) was used as described earlier. 21 Briefly, COL1 was mixed with a gel neutralization solution in a 2:1 ratio prior to adding 16 µL of the hydrogel into each well of the slide before sealing the channel with a coverslip. The slide was then placed in the incubator for 30 min for COL1 gel crosslinking. ECs were seeded on top of the hydrogel by adding 250 µL of cell suspension into the channel. A seeding density of 0.09 × 10⁶ cells/cm2 (1.5 × 10⁶ cells/mL) was used for HUVECs to obtain a confluent monolayer before starting the flow experiment according to the manufacturer’s application note. To achieve a confluent monolayer of hpmvECs before application of flow, the seeding density had to be doubled (Supplementary Fig. S1). The seeding densities required for cell culture under flow (0.09 × 10⁶ cells/cm2 for HUVECs and 0.18 × 10⁶ cells/cm2 for hpmvECs) were also used for the static controls. After 24 h, BF images were obtained at 10× magnification on a Zeiss Axio Observer Z1 (Carl Zeiss) and slides were connected to the fluidic unit of the ibidi pump system following the manufacturer’s instruction for shear stress application. The ECs were studied under static conditions (0 dyne/cm2), 5 dyne/cm2, and 10 dyne/cm2. For ECs at 5 dyne/cm2, a shear stress of 2 dyne/cm2 was applied for 1 h (preconditioning period) before changing to 5 dyne/cm2. For ECs at 10 dyne/cm2, ECs were subjected to 2 and 5 dyne/cm2 shear stress for 1 h, respectively (preconditioning period), before applying 10 dyne/cm2. Flow conditions were maintained for 72 h. For static conditions, medium was changed every 24 h. Both EC types were cultured in their corresponding medium.
Quantitative RT-PCR
RNA of HUVECs and hpmvECs was harvested after 72 h of static or flow culture using the RNeasy micro kit according to the manufacturer’s protocol. Briefly, cells were washed twice in the chips with PBS before gently removing the coverslip and lysing the cells. RNA content postisolation was quantified using the NanoQuant plate for the Infinite 200 PRO (Tecan). cDNA was reverse transcribed using the QuantiNova Reverse Transcription kit (205411, Qiagen) according to the manufacturer’s protocol. Quantitative RT-PCR (qPCR) was performed using a CFX96 system (Bio-Rad) and the QuantiNova Probe RT-PCR kit (208352, Qiagen) with primers for plasmalemma vesicle-associated protein (PLVAP, PPH11052A, Qiagen) and caveolin-1 (Cav-1, PPH00739A, Qiagen). qPCR data was quantified using the 2-ΔΔCt method.
Human islet cell culture
Human donor islets from three donors were purchased from the MacDonald Laboratory (Alberta, Canada). Donor information can be found in Supplementary Table S2. After arrival, donor islets of similar size were handpicked into wells of 96-well low-attachment U-bottom plates (65970, Greiner Bio-One) with one islet per well and cultured for 24 h in CMRL1066 without glutamine (21530-027, Gibco), 0.5% fatty acid-free-BSA (A9576, Sigma-Aldrich), 1 g/L glucose (A24940-01, Gibco), 4 mM Glutamax (35050-061, Gibco), 1% penicillin/streptomycin, and 100 µg/mL Normocin (ant-nr-1, InvivoGen). At timepoint 0 h, 1000 ECs suspended in human islet medium were added to each islet and cultured for another 72 h. BF images for size tracking analysis were taken at 0, 24, 48, and 72 h with 10× magnification on a Zeiss Axio Observer Z1 (Carl Zeiss). Area of human islets was measured using FIJI (V1.53c, NIH, Supplementary Fig. S2). Diameter was calculated under the approximation of circularity by applying formula:
1
Medium controls were performed in parallel seeding 31,250 cells/cm2 (10,000 cells per well) in tissue culture treated 96-well plates using their corresponding medium or human islet medium (Supplementary Fig. S3). BF images of medium controls were obtained after 24, 48, and 72 h with 10× magnification on a Zeiss Axio Observer Z1 (Carl Zeiss).
Glucose-stimulated insulin secretion assays
Glucose-stimulated insulin secretion (GSIS) assays were performed as described earlier.15,22 Briefly, human islets with or without ECs were washed twice with KREBS-buffer containing 2 mM glucose (low glucose) and subsequently incubated for 1 h in low glucose. The KREBS-buffer recipe can be found in Supplementary Table S3. After the incubation, islets were washed twice in either low glucose or KREBS-buffer containing 20 mM glucose (high glucose) and subsequently incubated in parallel in low or high glucose conditions for 1 h. At the end of the incubation, supernatant was collected and stored at −20°C. Human islets were dissolved in acid ethanol at 4°C overnight and vortexed before storing at −20°C. Insulin contents of supernatant and dissolved human islets were analyzed using the ultrasensitive human insulin ELISA kit (10-1132-01, Mercodia). Insulin secretion was normalized by overall insulin content. GSIS index was calculated by dividing the mean insulin secretion normalized by insulin content at 20 mM glucose by the mean insulin secretion normalized by insulin content at 2 mM glucose. Standard deviation was calculated using the formula for propagation of error.
Sample preparation for histological analysis and immunofluorescence staining
At the end of the 72 h culture period under flow, ECs in the µ-Slides were washed twice with PBS before fixing in 4% paraformaldehyde (PFA) for 30 min at RT for immunofluorescence (IF) staining. Adult human umbilical cord (NBP2-30208, female, 26 y/o), adult pancreatic tissue (NBP2-3019, male, 64 y/o), and adult dermal skin (NBP2-77817, male, 77 y/o) were all purchased from Novus Biologicals. Fresh human foreskin tissue (CTISB.1.11, male, 3 y/o) was purchased from Biotrend, fixed in 4% PFA, embedded in paraffin (Shandon Citadel 1000, Thermo Fisher Scientific), and cut into 4 µm sections (Microtome R2145, Leica) as described earlier. All donor tissues were obtained from healthy donors. IF staining on all paraffin sections was performed as previously described. 21 Briefly, paraffin sections were deparaffinized using xylene and graded ethanol (96%−50%) and demineralized water. Antigen retrieval was performed using Tris-EDTA (pH 9.0) and citrate (pH 6.0) buffer. After paraffin removal, paraffin sections and freshly fixed cells were incubated for 20 min in 1% Triton-X buffer at RT before goat block was applied for 30 min at RT. Primary antibodies were incubated according to the manufacturer’s instructions overnight at 4°C. Antibody dilutions can be found in Supplementary Table S4. Following 30 min of secondary antibody incubation, nuclei were stained with 2 µg/mL 4ʹ,6-daimidin-2-phenylindol solution (DAPI, Sigma-Aldrich) or green nuclei dye AlexaFluor 488 (1:1000) for 10 min at RT, and then mounted with Prolong Gold Antifade Mountant (Thermo Fisher Scientific). BF images were acquired on a Zeiss Axio Observer Z1 (Carl Zeiss). IF staining images were obtained with 20× magnification on a Zeiss Axio Observer Z1, or with 20× and 63× magnification on a Zeiss laser scanning microscope 780 (Carl Zeiss) (Supplementary Fig. S4). Semiquantitative gray value intensity (GVI) analysis normalized by DAPI count of IF-stained sections was performed using FIJI (V1.53c, NIH). F-actin alignment was quantified using FIJI’s directionality plugin (V1.53c, NIH). At least five different regions of interest were analyzed for each tissue.
Raman microspectroscopy
Raman measurements of the four EC types in vitro were performed on glass bottom dishes (81158, ibidi) coated with bovine plasma fibronectin at 2 µg/mL to avoid background differences. ECs were seeded at 50,000 cells/cm2 and cultured in their corresponding medium until 90% confluency before fixing with 4% PFA for 30 min at RT. Tissue sections were deparaffinized as described above. Fixed cells and tissues were maintained in PBS after fixing and deparaffinization and during the measurements. All Raman measurements were performed using a Raman microspectroscope (alpha 300R, WITec) with a charge-coupled device camera (WITec) and a 63× objective (W Plan-Apochromat 63×/1.0 M27, Carl Zeiss). Spectral map acquisition was performed with a 532 nm green diode laser at 50 mW with a grating of 600 g/mm and with a resolution of 1 × 1 µm per pixel. After comparing signal-to-noise ratio to the required time per scan (Supplementary Fig. S5), an integration time of 0.2 s per pixel was used for all measurements. Preprocessing of spectral data and analysis was conducted using the Project Five 5.2 software (WITec) as previously described. 23 Briefly, spectral datasets of each measurement were cropped to the wavenumbers of 1000–1800 cm−1. Cosmic rays were removed, spectral background was subtracted and the spectra were normalized to its area. True component analysis (TCA) was utilized to create images containing signal intensity distributions of components of interest. Before measuring the GVI of each component, a minimum threshold of 0 was applied to the images. Principal component analysis (PCA), a multivariate data analysis tool was utilized for further in-depth analysis using Unscrambler X (CAMO Software AS). Principal component (PC)-scores and loadings identified significant differences in the molecular compositions of components of interest.
Statistical analysis
Statistical analysis was performed using Origin (Version 2023 b, OriginLab). The results are presented throughout the article as mean ± standard deviation. Data sets have been tested for normal distribution using Shapiro–Wilk and Kolmogorov–Smirnov tests. Outliers have been removed using Grubb’s outlier test with a confidence interval of 0.05. Statistical significance was defined for p ≤ 0.05 and the corresponding tests and significances for each figure are described in the figure legends. For ANOVA, Tukey-test was performed as a post hoc test to analyze differences between samples. All experiments were performed at least three times, each with at least three replicates.
Results
ECs of four tissues express differences in cytoplasmic and DNA composition
Identification of ECs was performed via IF staining for CD31 and nuclei on tissue sections from umbilical cord, dermal skin, foreskin, and pancreas (Fig. 1A–D, Supplementary Fig. S2). Raman imaging, which has been shown to provide untargeted spatiomolecular information of cells and tissues at a high resolution, 24 was employed to obtain the spectral map of regions of interests with CD31+ staining. Cytoplasm (red) as well as DNA (green) components were identified (Fig. 1E–H) with TCA, which corresponded with the spatial distribution of the IF staining. The average spectra of the cytoplasm and DNA component are depicted in Figure 1I. PCA of the cytoplasm component (Fig. 1J–N) identified significant differences between ECs of the four different tissues. Firstly, ECs from dermal skin showed significant differences in PC-4 compared with ECs from umbilical cord and pancreas tissues (Fig. 1K). The explained variance for PC-4 in the negative range is mainly dominated by spectral data assigned to ECs from dermal skin characterized by negative peaks at 1342, 1457, and 1668 cm−1, while ECs of the umbilical cord, specifically, are described by the explained variance in the positive range with peaks at 1169 and 1633 cm−1 (Fig. 1L). Secondly, ECs from umbilical cord and dermal skin showed significant differences compared with ECs from foreskin and pancreatic tissue in PC-5 of the cytoplasm component (Fig. 1M). The explained variance is dominated by negative peaks at 1448 and 1656 cm−1 for ECs from the umbilical cord and dermis, while ECs from foreskin and pancreas contribute to the positive range with peaks at 1127, 1371, and 1585 cm−1 (Fig. 1N). PCA of the DNA component also showed significant difference between the ECs (Fig. 1O–S). Firstly, PC-3 showed a significantly lower mean loading score for ECs in the umbilical cord compared with all the other tissues (Fig. 1P). The explained variance showed that ECs from the umbilical cord are mainly described with negative peaks at 1064 and 1600 cm−1, while the other three EC types are described by positive peaks at 1255, 1343, 1456, and 1614 cm−1 (Fig. 1Q). Additionally, PC-4 shows significant differences of ECs from dermal skin compared with ECs from foreskin and pancreatic tissue (Fig. 1R). Here, the explained variance showed that the negative range is dominated by ECs from dermal skin tissue with negative peaks for 1090, 1337, 1457, and 1612 cm−1 (Fig. 1S). The peaks and corresponding biological assignments are listed in Supplementary Table S5.
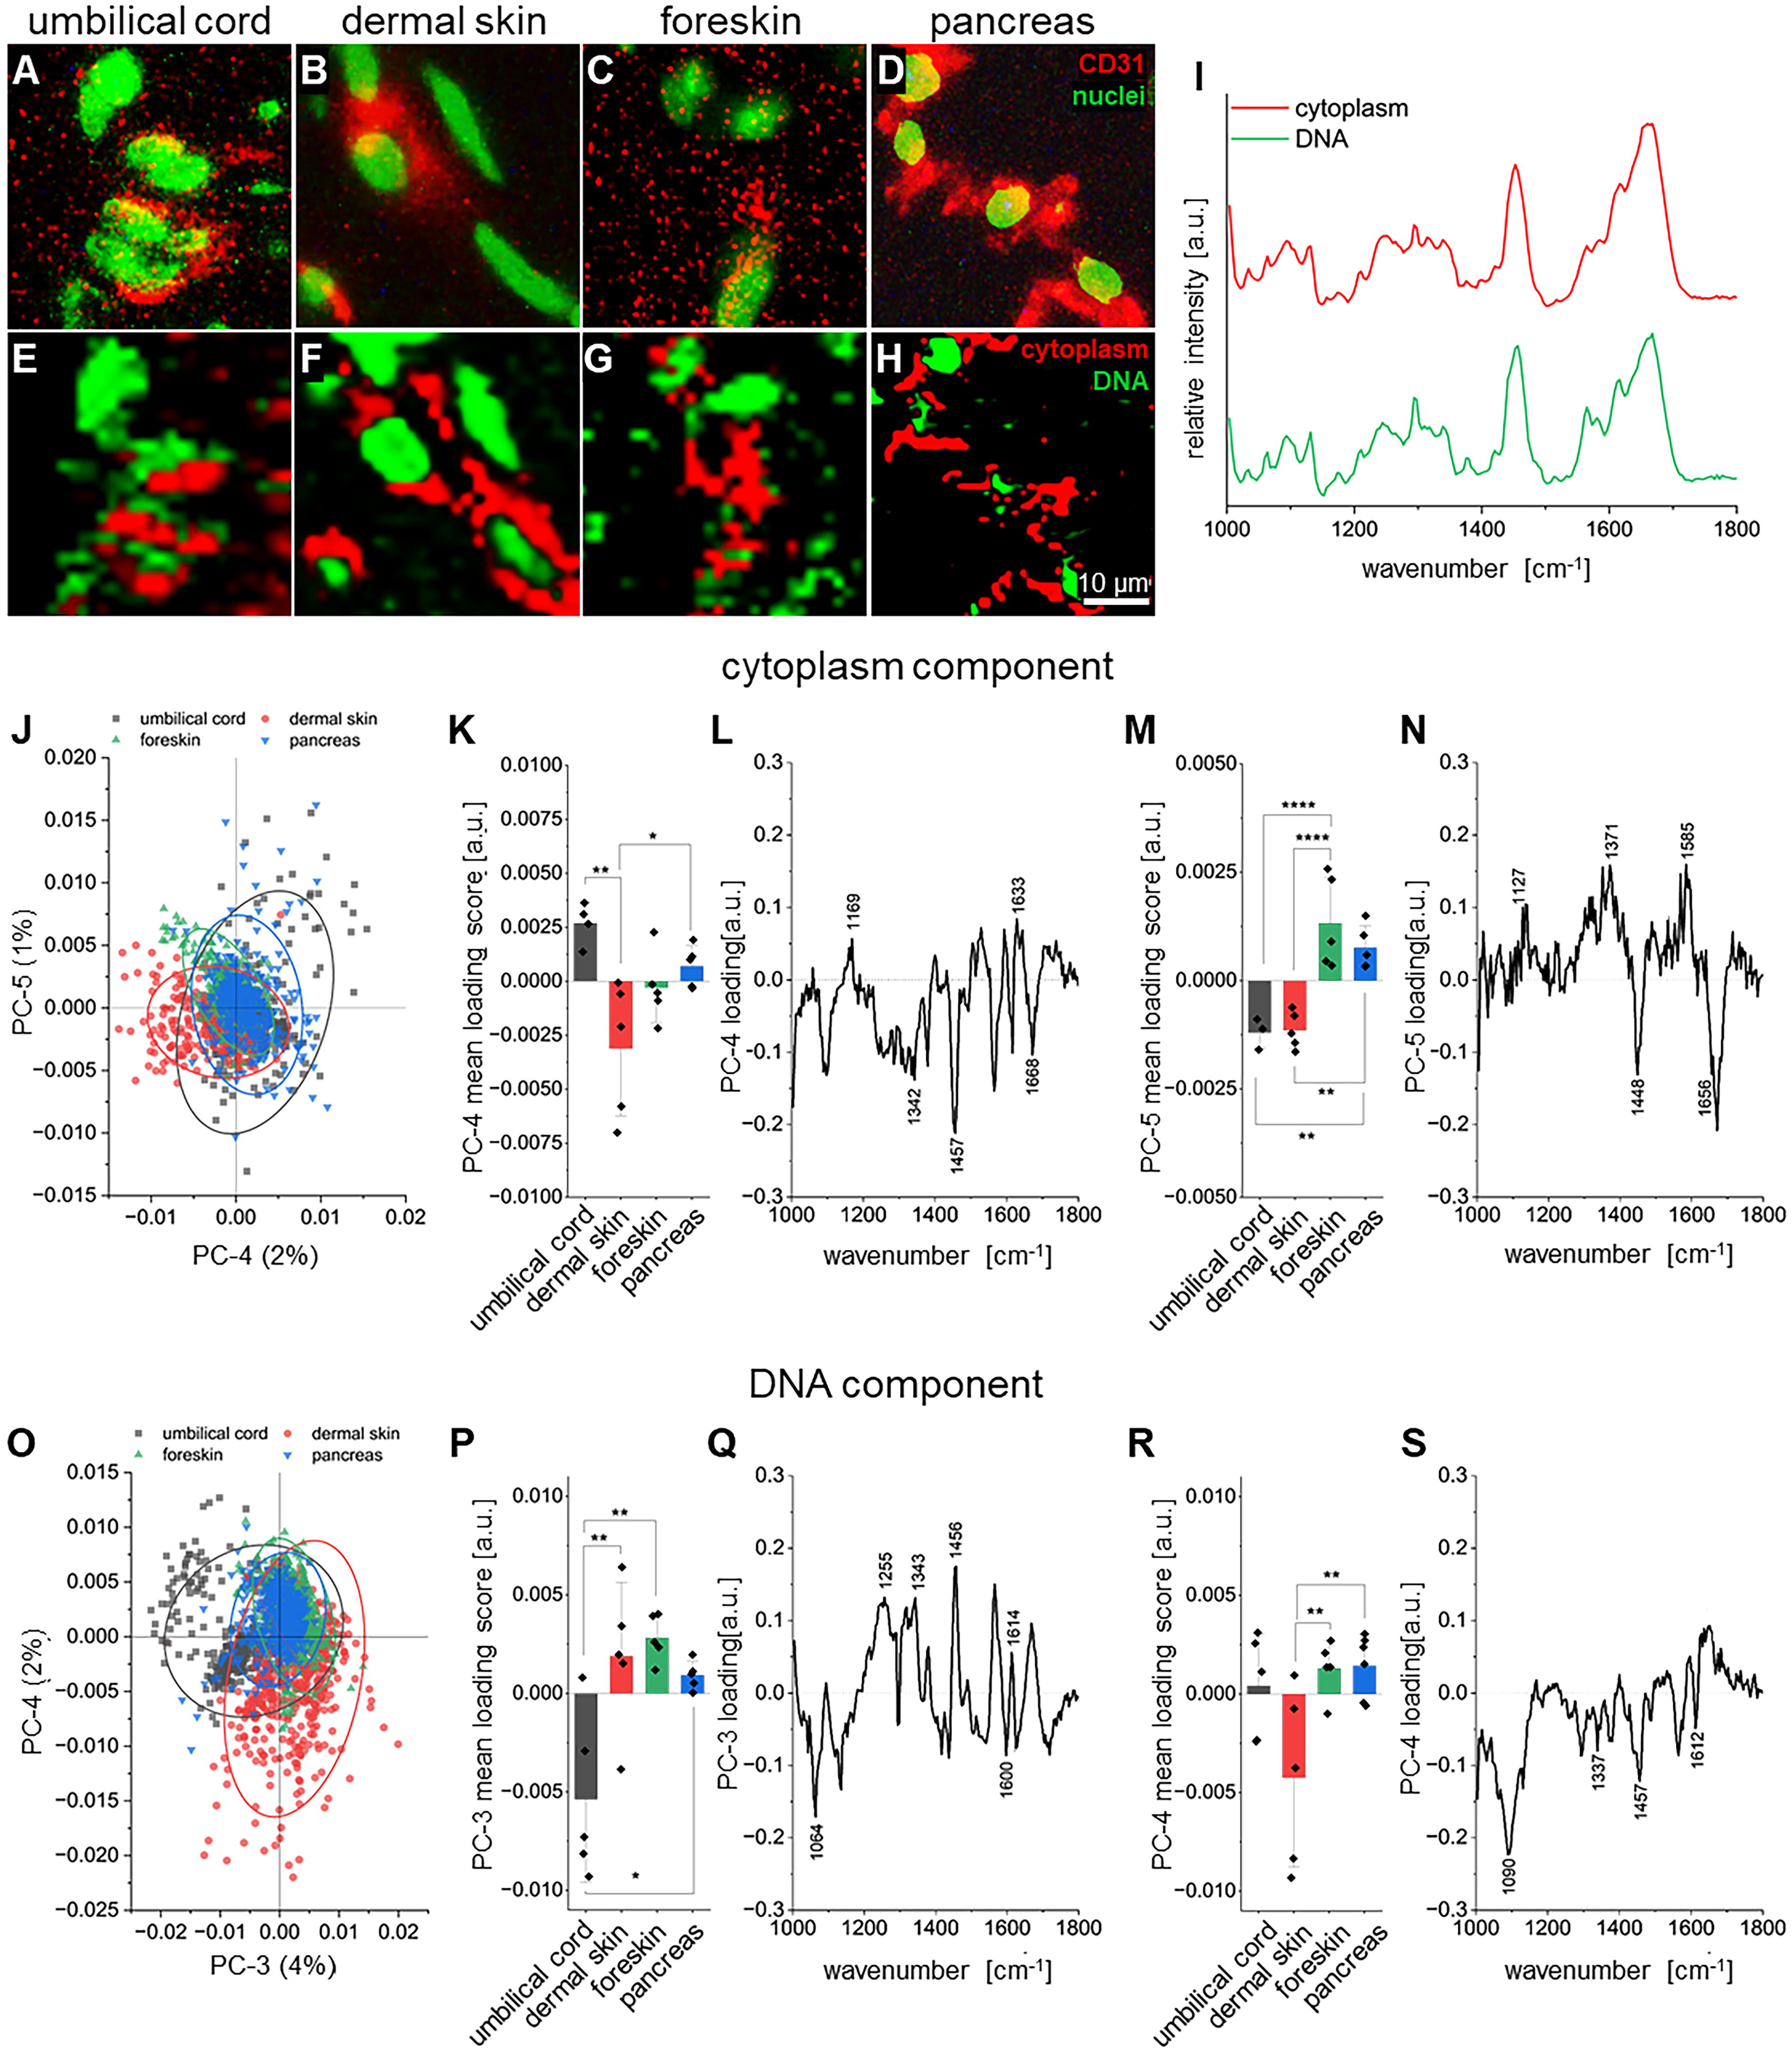
Raman microspectroscopy on human tissues.
Isolated ECs from four tissues show differences in protein and lipid composition in vitro
IF staining confirmed that the isolated cells in vitro were CD31+ ECs (Fig. 2A–D). Prior to IF staining, spectral maps were obtained using Raman microspectroscopy that show three main components identified by TCA: proteins (green), lipids (yellow), and DNA (blue) (Fig. 2E–H), with the average spectra of each component being depicted in Figure 2I, as well as their GVI semiquantification (Supplementary Fig. S6).
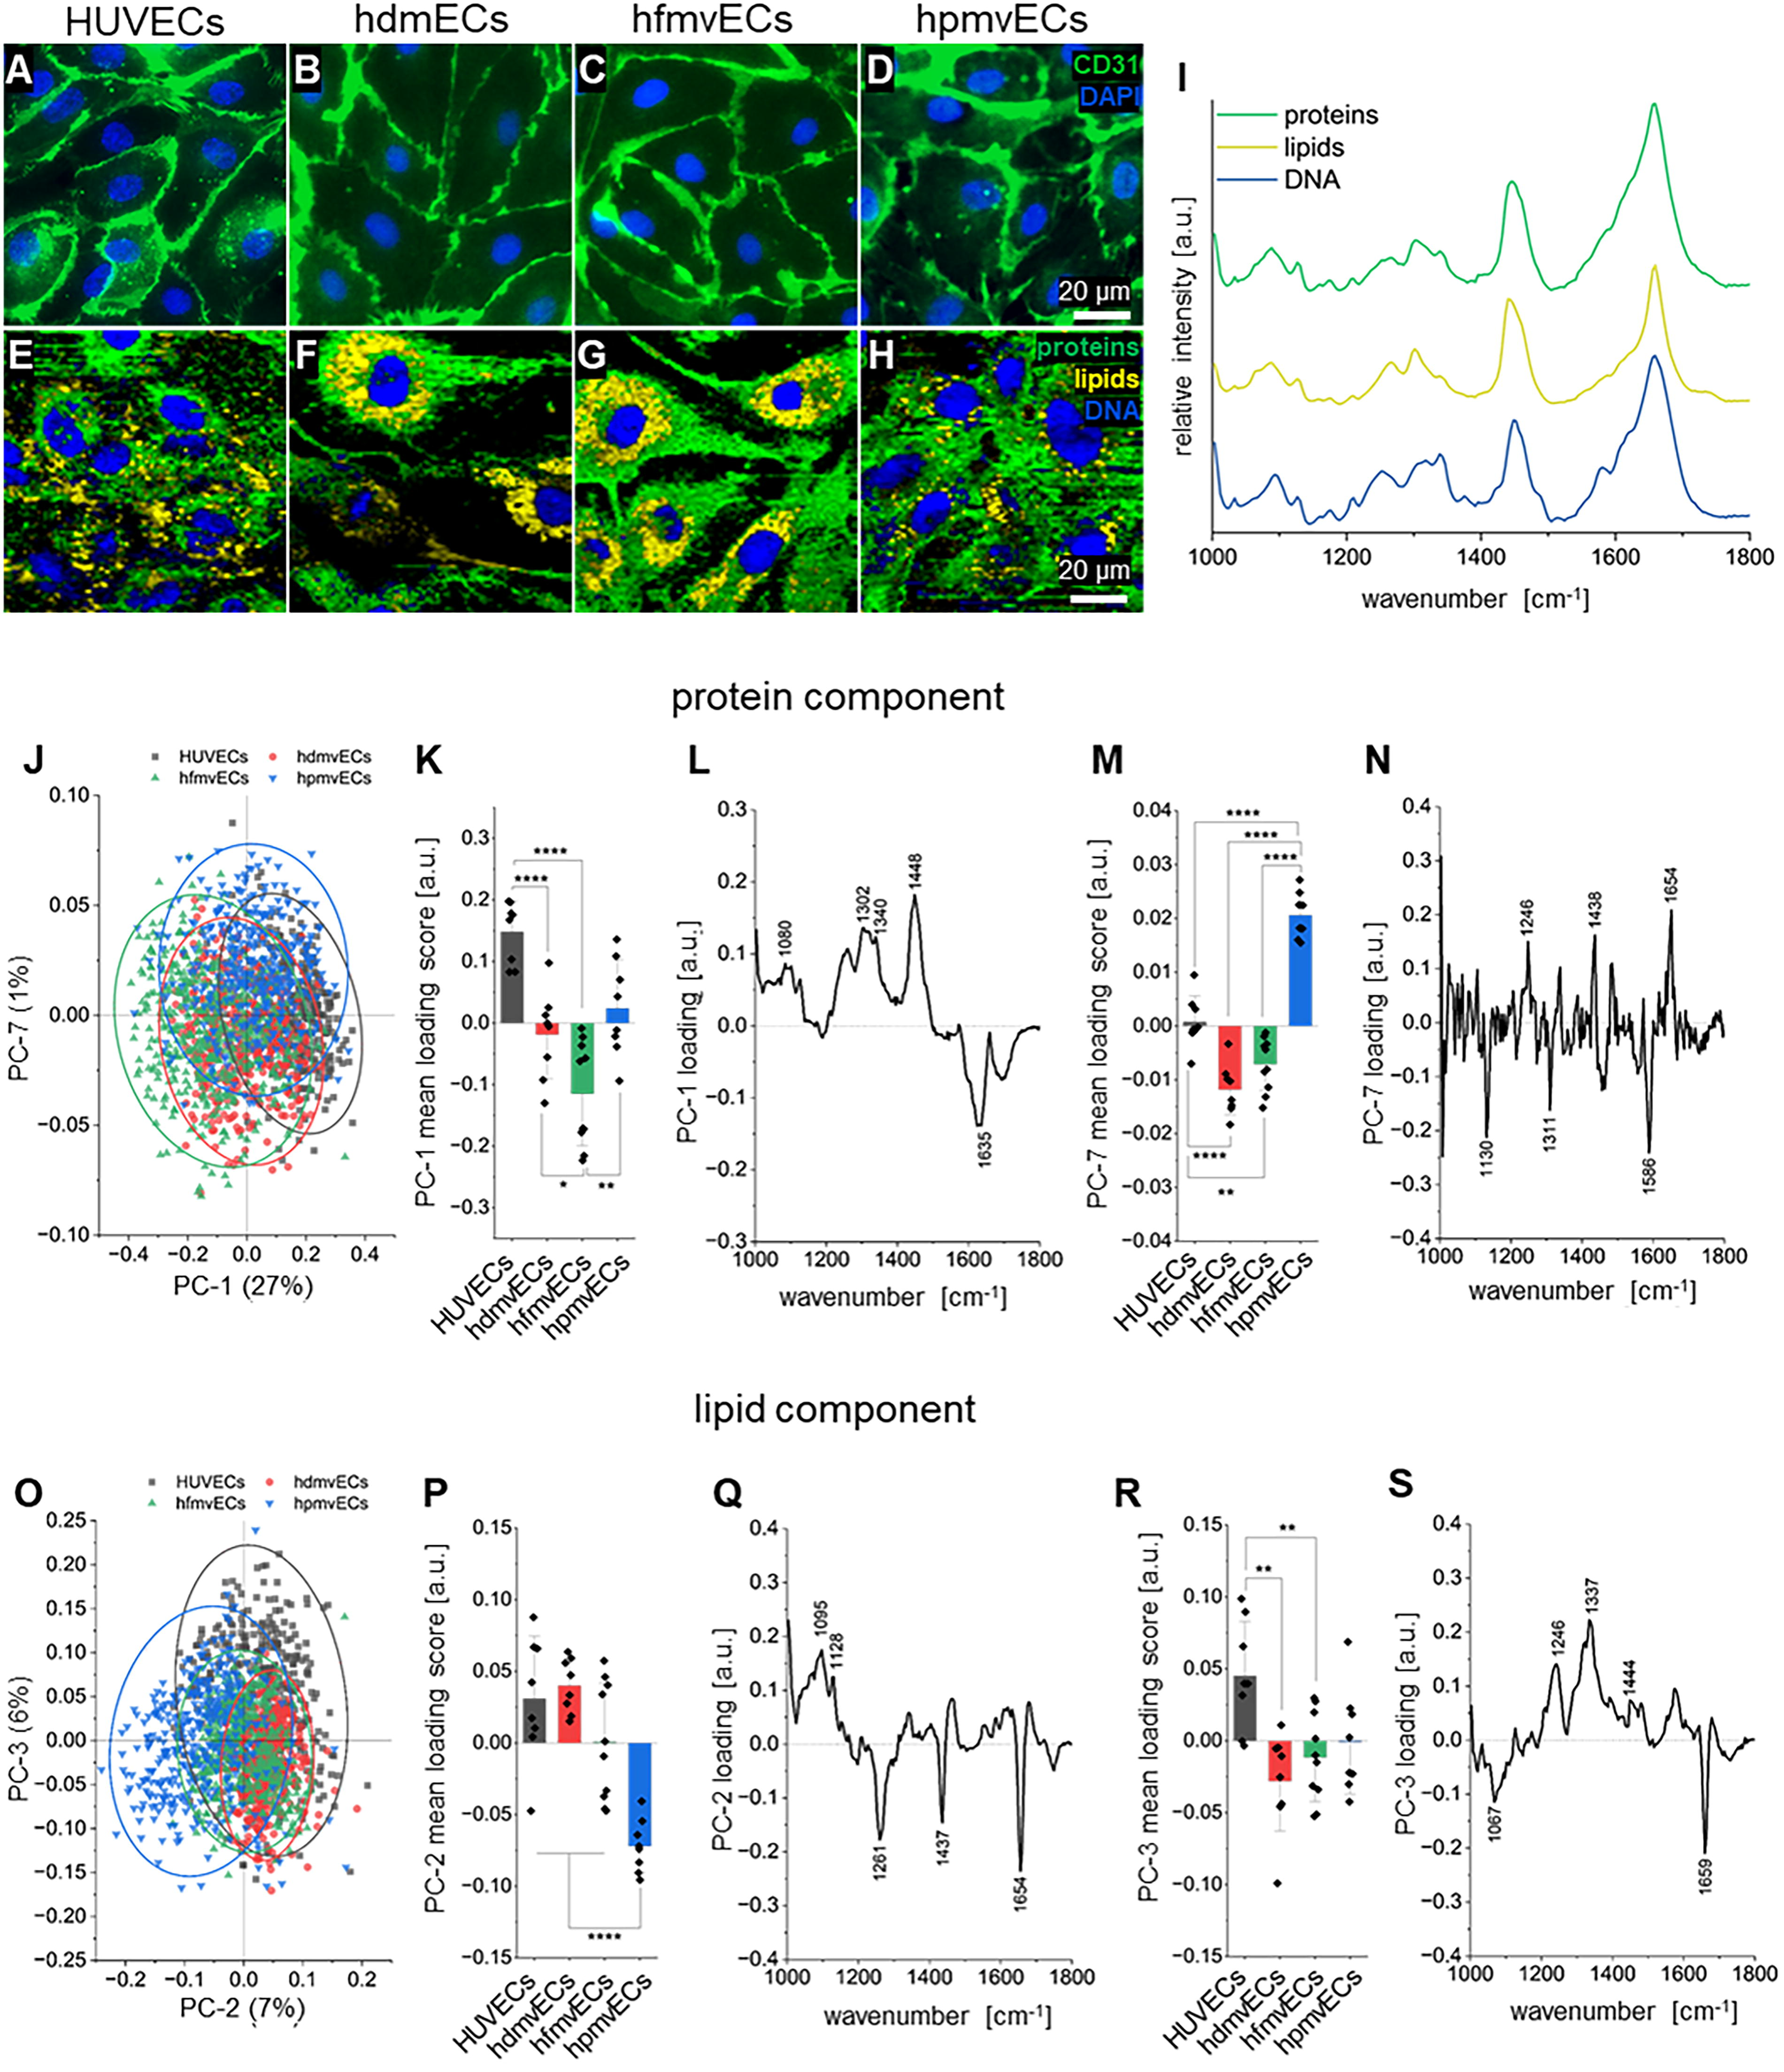
Raman microspectroscopy on isolated human EC monolayers from four different tissues in vitro.
PCA of the protein component (Fig. 2J–N) of ECs in vitro showed a significant difference attributable to PC-1 and PC-7. Firstly, PC-1 shows a significantly higher mean loading score for HUVECs compared with hdmvECs and hfmvECs, while hfmvECs also exhibit significant differences to hdmvECs and hpmvECs (Fig. 2K). The explained variance in the negative range is mainly influenced by hfmvECs with a negative peak at 1635 cm−1, while the positive range is highly influenced by HUVECs with positive peaks at 1080, 1302, 1340, and 1448 cm−1 (Fig. 2L). Mean loading scores of PC-7 show significant differences between HUVECs and hdmvECs and hfmvECs as well as between hpmvECs and all other three cell types (Fig. 2M). The negative explained variance is mainly impacted by hdmvECs and hfmvECs with negative at 1130, 1311 and 1586 cm−1, while positive explained variance is influenced by hpmvECs with peaks at 1246, 1438, and 1654 cm−1 (Fig. 2N). The lipid component identifies significant differences within ECs by PC-2, PC-3, and PC-5 (Fig. 2O–S, Supplementary Fig. S7 A–C). PC-2 shows a significant difference in mean loading scores between hpmvECs compared with all three other ECs (Fig. 2Q), where the negative explained variance is solely influenced by hpmvECs with negative peaks at 1261, 1437, and 1654 cm−1, while the positive range is influenced by the other EC types with peaks at 1095 and 1126 cm−1 (Fig. 2Q). PC-3 identifies significant differences in the mean loading score comparing HUVECs to hdmvECs and hfmvECs (Fig. 2R). The positive range of the explained variance is hereby only influenced by HUVECs with peaks at 1246, 1337, and 1444 cm−1, whereas the negative range is influenced by hdmvECs and hfmvECs with negative peaks at 1067 and 1659 cm−1 (Fig. 2S). Further differences between ECs can be found in the DNA component at PC-2, PC-3, and PC-4 (Supplementary Fig. S7 D–K). The biological assignments of the relevant peaks are summarized in Supplementary Table S6.
HUVECs and hpmvECs form stable networks after 24 h
ECs play a crucial role in reestablishing the vasculature after injury via sprouting angiogenesis or re-endothelialisation. 25 In this study, we compared the tube formation capabilities of HUVECs, hdmvECs, hfmvECs, and hpmvECs quantified by seven different network features (Supplementary Fig. S8) over 24 h, where total network length is defined as sum of branches length and segments length. ECs were seeded at the same seeding density as there was no significant difference in cell size among the four types (Supplementary Fig. S9), and in the same medium to supplement the same growth factors to each EC type (Supplementary Fig. S10). Although there was no obvious difference in the BF images in the early phase after 0.5 and 6 h, quantification indicated significant differences between the four cell types (Supplementary Fig. S11). These differences were obvious after 12 and 24 h, as both hdmvECs and hfmvECs were less successful in establishing a stable tube network (Fig. 3A) compared with HUVECs and hpmvECs. The number of isolated segments was significantly lower for HUVECs and hpmvECs compared with hdmvECs and hfmvECs after both 12 and 24 h (Fig. 3B). After 12 h, there were significant differences between hfmvECs and hpmvECs in number of junctions (Fig. 3C) and number of branches (Fig. 3D), which were lost at the 24 h timepoint. The number of segments was significantly higher for hpmvECs after 12 h compared with hfmvECs (Fig. 3E). At the 24 h timepoint, the number of segments was significantly higher in hpmvECs compared with HUVECs and hdmvECs. The overall network length was significantly higher after 12 and 24 h for hpmvECs compared with hfmvECs (Fig. 3F). The total number of meshes at 12 h was also significantly higher for hpmvECs compared with hfmvECs (Fig. 3G); however, this significance was lost after 24 h. After 12 h, the mean mesh size was significantly higher for HUVECs and hpmvECs compared with hfmvECs and hdmvECs (Fig. 3H). After 24 h, while the significant differences were preserved, HUVECs additionally showed a significantly higher mean mesh size compared with hpmvECs. Our data indicates that HUVECs and hpmvECs have an overall higher network formation capability when compared with hdmvECs and hfmvECs. Due to the fact that revascularization is a major factor for the successful transplantation of donor islets, the subsequent experiments focused on HUVECs and hpmvECs.
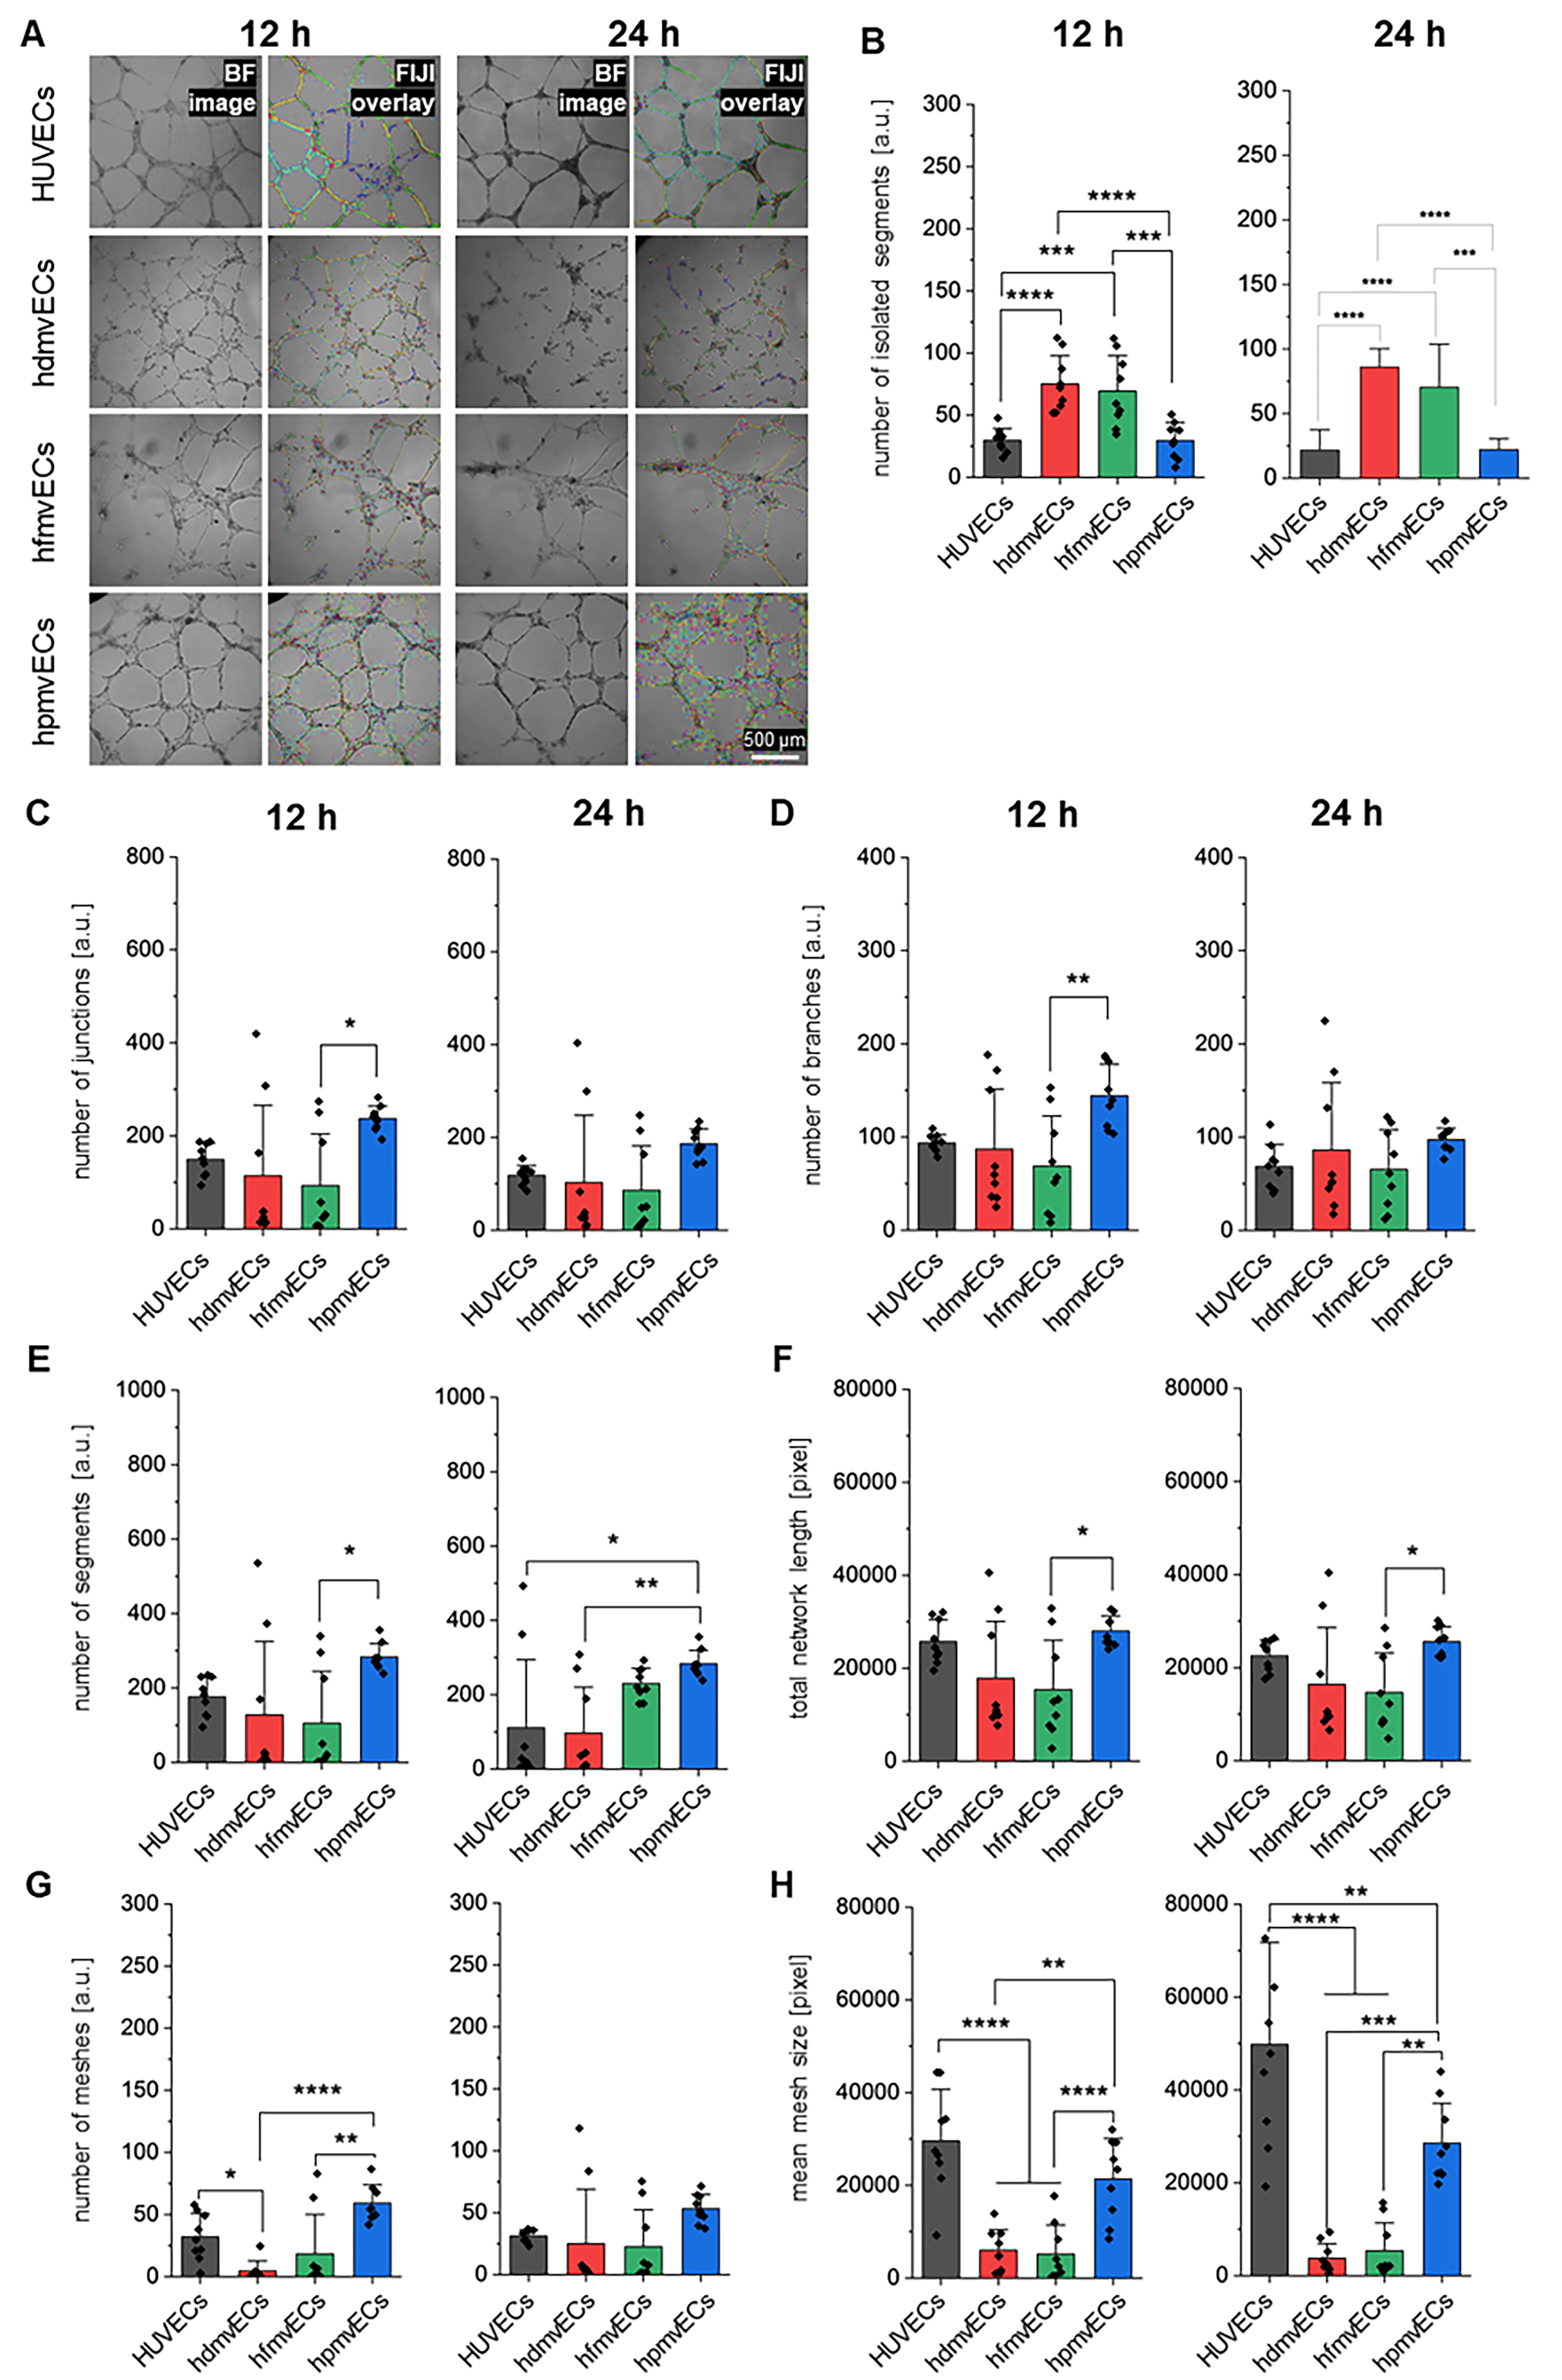
Angiogenic potential of different ECs in vitro at 12 h and 24 h.
HUVECs and hpmvECs react differently to application of flow
As ECs experience blood flow and are exposed to shear stress, 26 we investigated HUVECs and hpmvECs under static and flow conditions to investigate differences in functional responses to biomechanical stress (Fig. 4, Supplementary Fig. S1). IF staining for the EC marker CD31 and F-actin revealed a stable monolayer formation for HUVECs expressing the characteristic cobble stone pattern under static conditions (0 dyne/cm2) as well as under flow at 5 and 10 dyne/cm2 (Fig. 4A–C). In contrast, hpmvECs were not able to form a stable monolayer under static conditions in the chip setup (Fig. 4D). When exposed to flow, hpmvECs formed a stable monolayer, which expressed stronger alignment to the direction of flow with increasing shear stress (Fig. 4E, F). While quantification of cell nuclei showed an overall significant difference between both cell types, there were no differences within the HUVEC groups; however, hpmvECs showed a significant increase in cell count with increasing shear stress (Fig. 4G). Quantification of CD31 GVI showed a significant upregulation for both cell types at 10 dyne/cm2 (Fig. 4H). Cytoskeleton remodeling was analyzed by F-actin GVI quantification and analysis of alignment to the direction of flow. While F-actin GVI was highest at 0 dyne/cm2 in HUVECs, hpmvECs expressed the highest F-actin GVI at 10 dyne/cm2 with an overall significant difference between both cell types (Fig. 4I). Additionally, F-actin filaments within hpmvECs show a significantly higher alignment with the direction of flow at 10 dyne/cm2, specifically in the angle range between −10° and 10° (Fig. 4J). Nuclear elongation was not observed (Supplementary Fig. S12 A). hpmvECs express a high level of fenestration and caveolae which is vital for the exchange of nutrients, glucose, and hormones such as insulin and glucagon between blood and peripheral tissues. 27 Hence, we analyzed the expression of Cav-1 in HUVECs and hpmvECs at 10 dyne/cm2 (Fig. 4K–M). In HUVECs, only very few cells were Cav-1+ (Fig. 4K), whereas the majority of hpmvECs were Cav-1+ (Fig. 4L). Quantification of GVI showed significantly higher Cav-1 expression in hpmvECs compared with HUVECs (Fig. 4M). Gene expression quantification further showed significantly higher levels of Cav-1 and PLVAP under static conditions in hpmvECs compared with HUVECs (Supplementary Fig. S12 B, C), while only PLVAP was significantly increased in hpmvECs compared with HUVECs under flow (Supplementary Fig. S12 D, E).
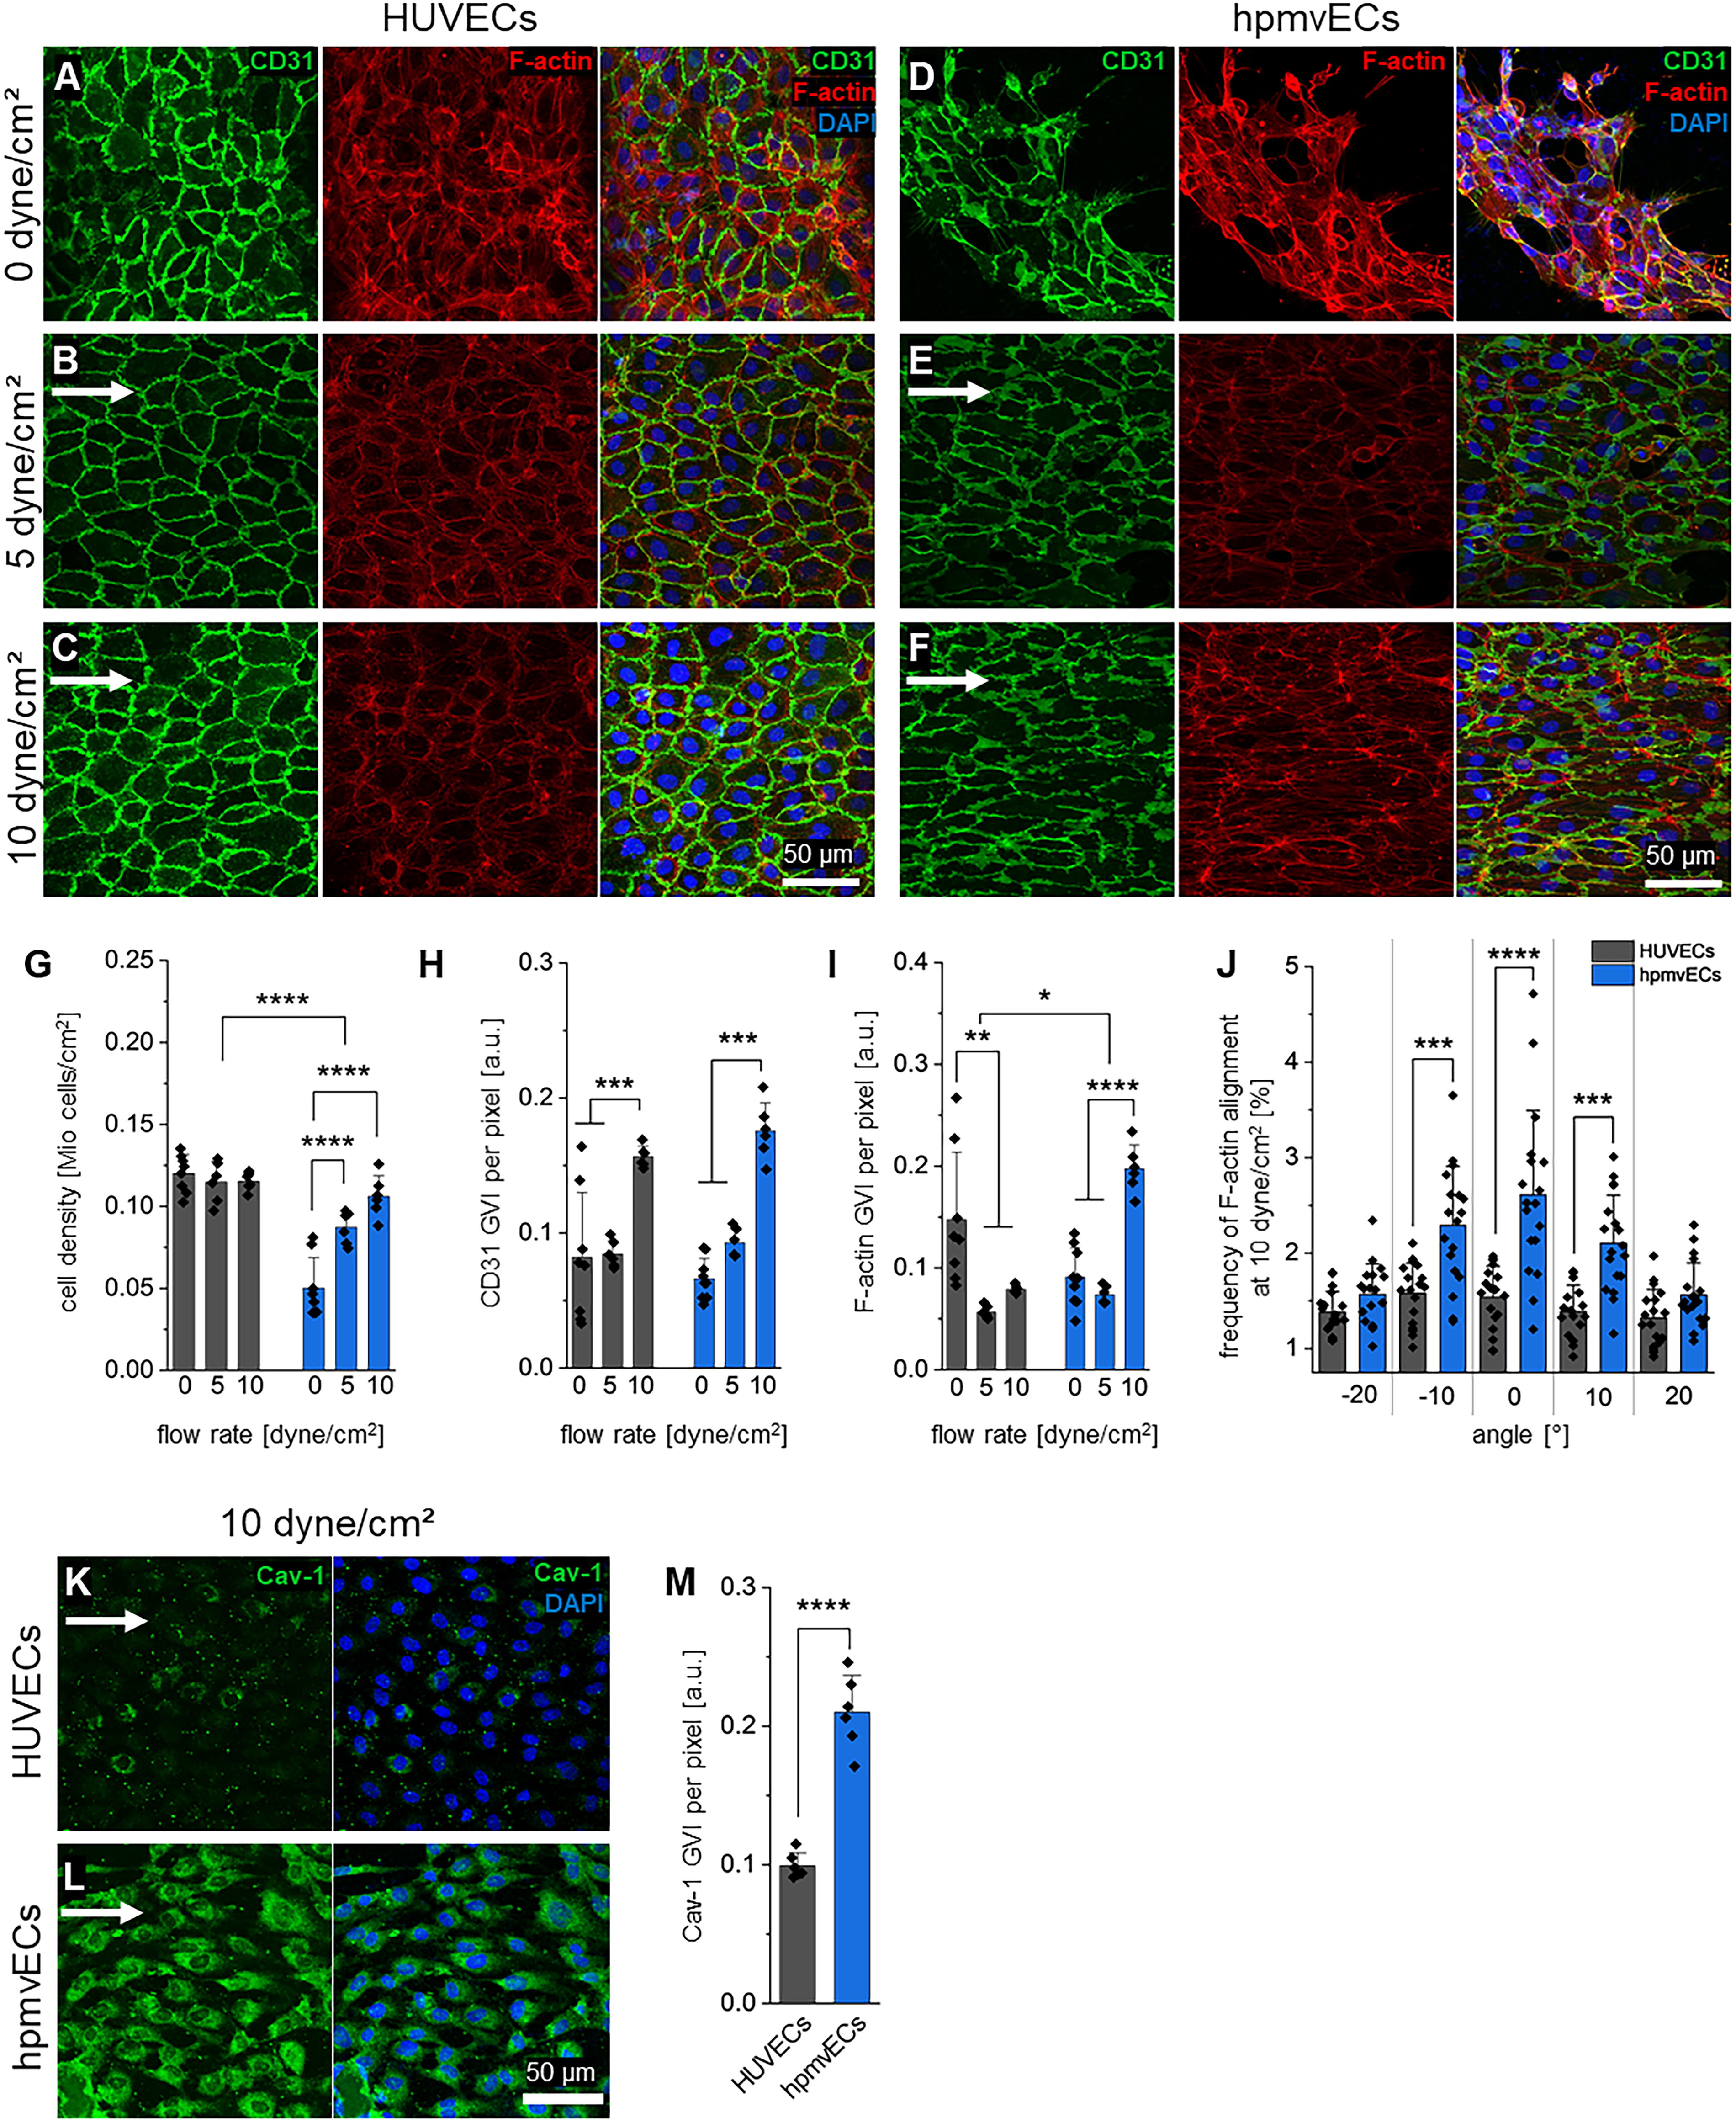
HUVECs and hpmvECs under static and flow conditions.
Isolated islets of Langerhans secrete significantly more insulin upon coculture with hpmvECs
In order to investigate whether these phenotype differences observed under flow have an impact on human islets in vitro, we cocultured isolated human islets of Langerhans with HUVECs and hpmvECs for 72 h (Fig. 5, Supplementary Figs. S13, Figs. S14). BF images of cocultures were obtained before (0 h) and during the coculture experiment to track the islets size and attachment of ECs to the donor islets (Fig. 5A–C). Size tracking of control and cocultured donor islets showed no difference in diameter between the groups at the beginning of the experiment prior to addition of the HUVECs (+HUVECs) and hpmvECs (+hpmvECs) (Fig. 5D). After 24 and 48 h, donor islets +HUVECs and +hpmvECs showed a significantly larger diameter compared with the control group; however, after 72 h, donor islets +hpmvECs showed a larger diameter compared with the control group and to islets +HUVECs. After 72 h of culture, control and cocultured donor islets were subjected to a GSIS assay to evaluate their functionality. At 2 mM glucose concentration, there was no significant difference in secreted insulin/insulin content between the groups (Fig. 5E). When subjected to 20 mM glucose, donor islets +hpmvECs secreted significantly more insulin compared with the other two groups. The GSIS index represents the fold change of insulin secretion from low to high glucose, 15 with a GSIS index is >1 suggesting functional response of the human islets; however, there was no statistically significant difference between the groups (Fig. 5F), which could also be attributed to the high donor variability (Supplementary Fig. S13). When cocultured with hdmvECs (+hdmvECs) or hfmvECs (+hfmvECs), there was no difference in donor islet size, insulin secretion or GSIS index between the coculture groups and control (Supplementary Fig. S14).
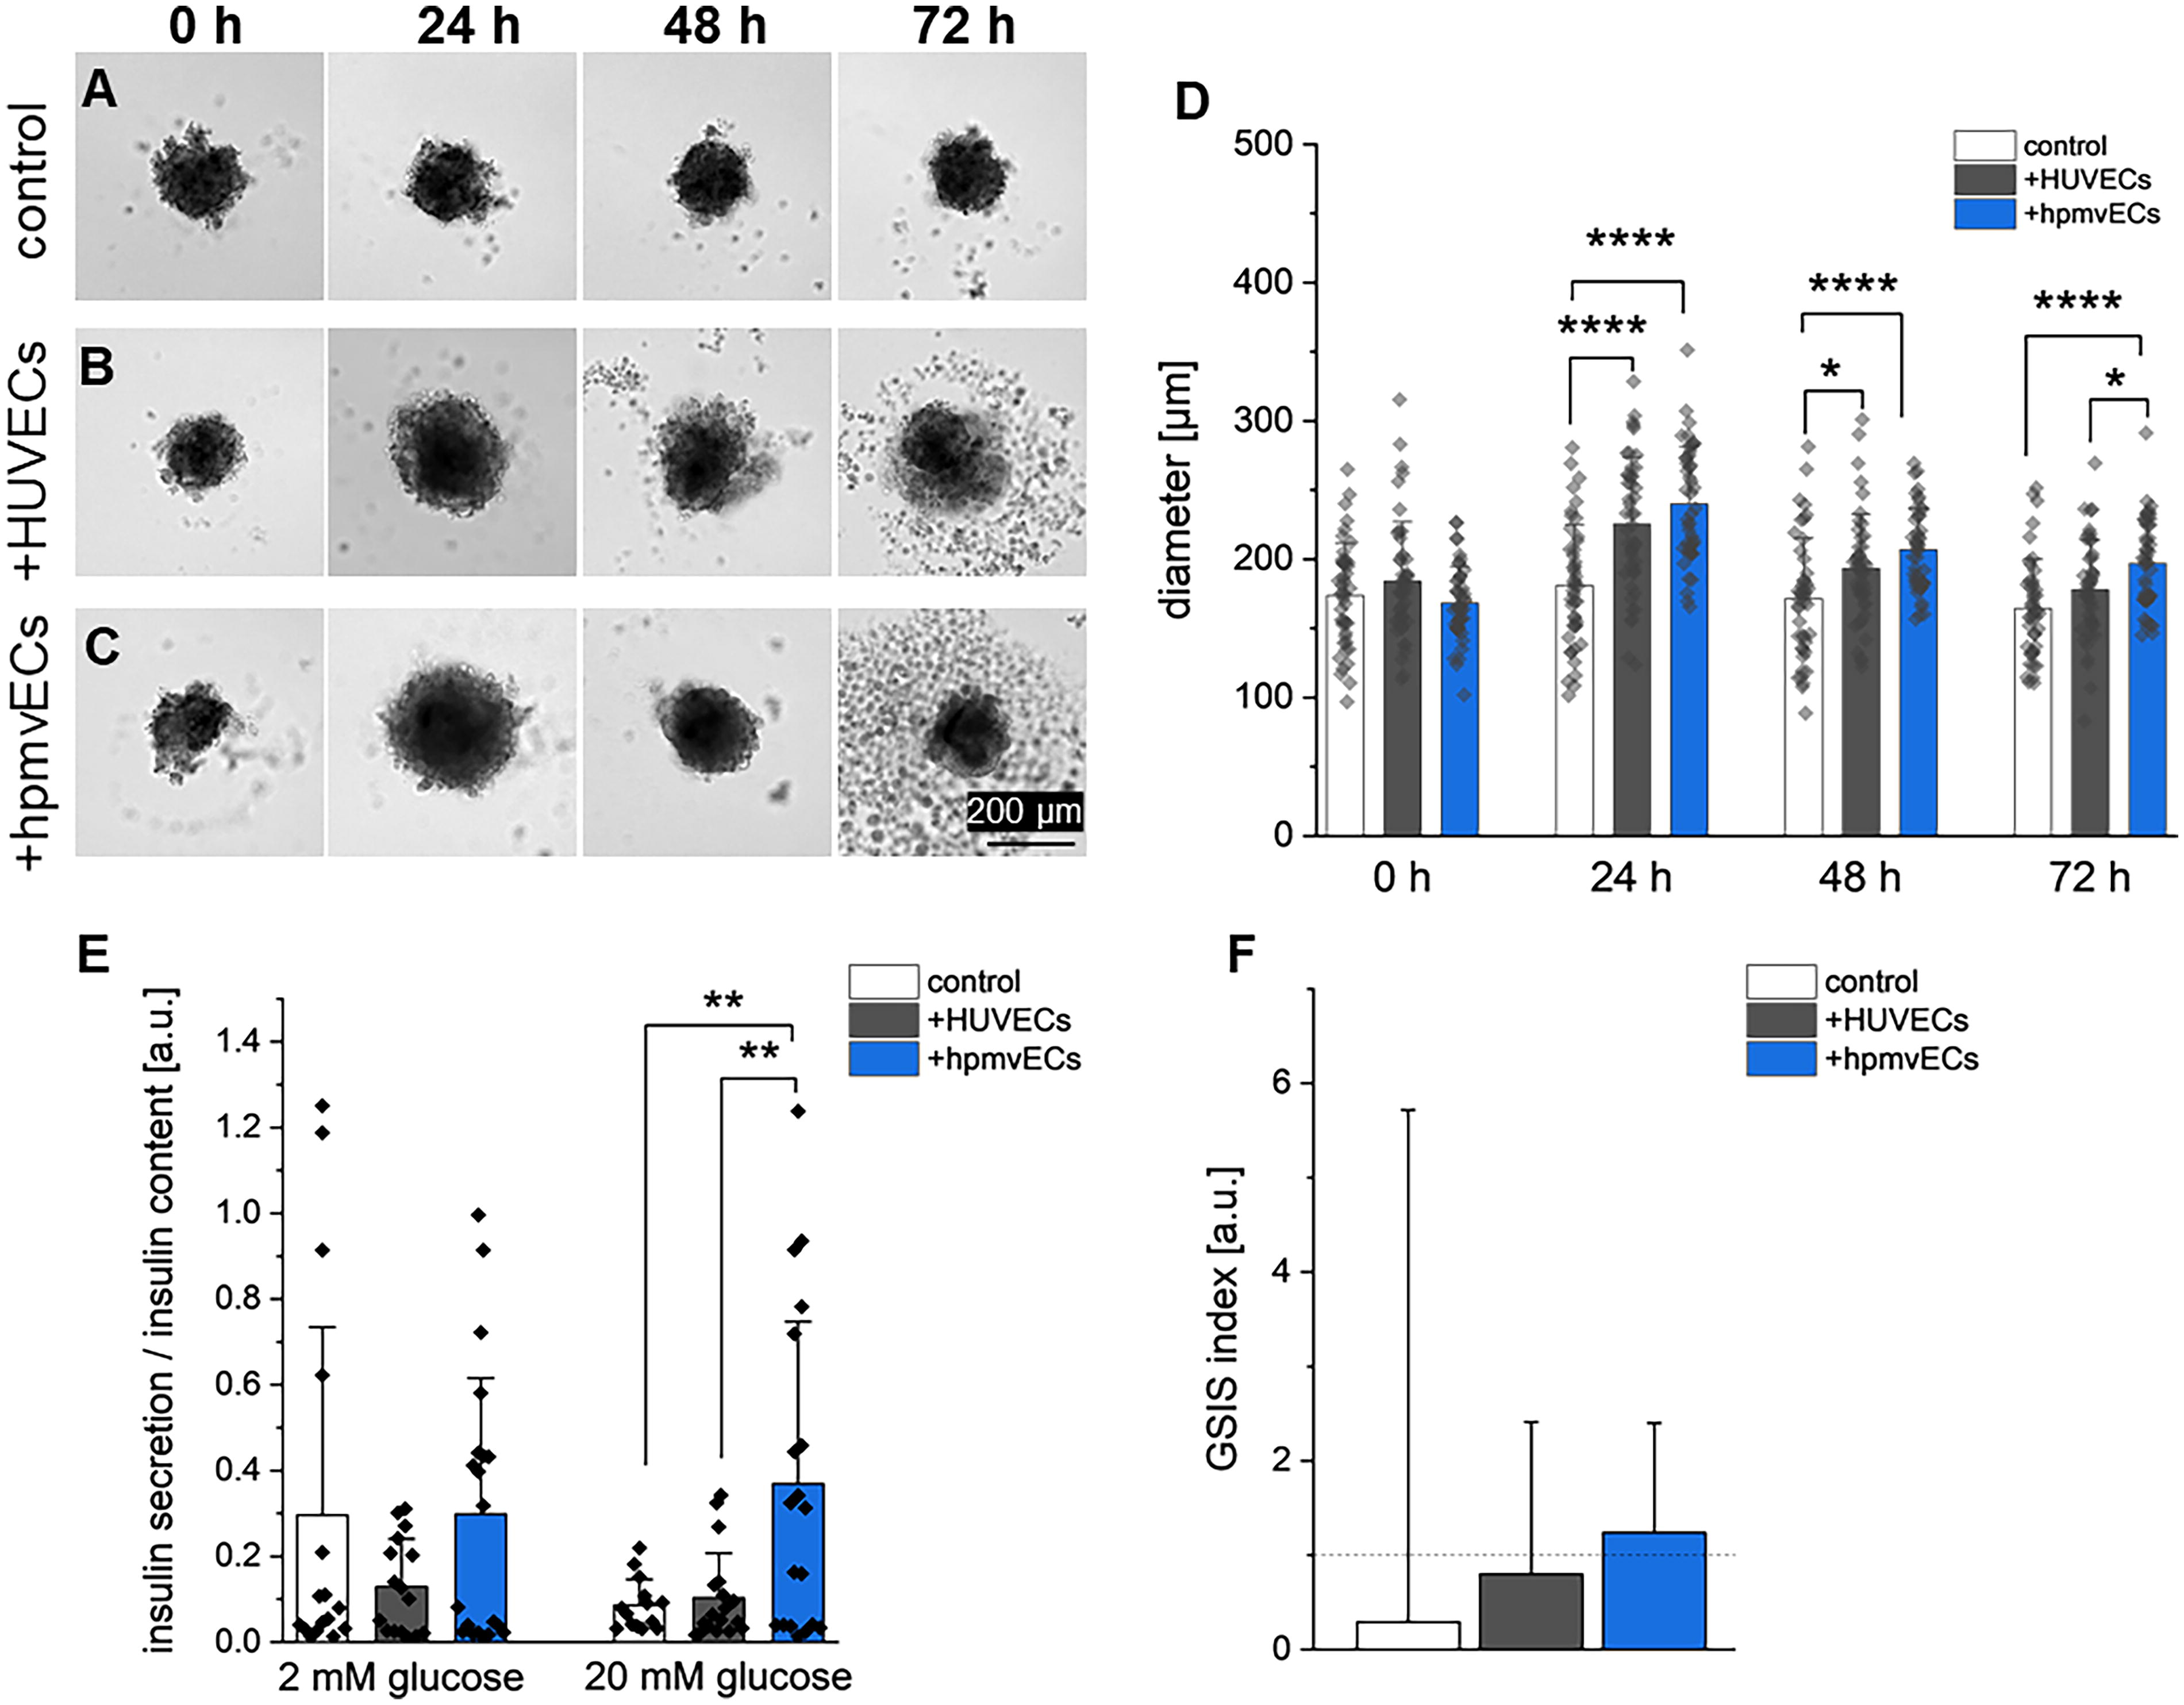
Human pancreatic islets suspension cocultures with HUVECs or hpmvECs. BF images
Discussion
ECs are a highly heterogeneous cell population that differ not only between organ systems but also within a single vascular branch. 8 Depending on their location and their environment, ECs show morphological differences regarding size, shape, thickness, as well as expression of tight and gap junctions. Additionally, ECs are highly heterogeneous regarding the expression of surface glycoproteins, lectin binding patterns and protein and mRNA expression.8,17 Hence, investigation of organ-specific ECs is required to understand their roles in tissue homeostasis and disease development, which are not fully understood up to date. 11 In this work, we studied the characteristics and the differences of different EC types, namely HUVECs, hfmvECs, and hdmvECs and compared them to organ-specific hpmvECs in the context of in vitro diabetes research.
In the first step, we performed Raman microspectroscopy to obtain unbiased characterization of ECs in situ as well as postisolation in vitro. In situ Raman microspectroscopy and PCA of ECs in stained tissue sections identified significant differences between the four EC types focusing on their cytoplasm as well as DNA components. The lipid component in the tissue could not to be reliably identified due to the nature of the paraffin embedded sections. A lipid specific staining, such as Sudan black and Oil red O staining would have been able to identify the presence and quantity of lipids; however, it would have provided limited information about specific membrane lipid content and composition. Future experiments will focus on using fresh tissue samples to avoid this limitation. Concerning the cytoplasm component in situ, ECs in the umbilical cord were characterized by peaks at 1169 and 1633 cm−1, while ECs of the dermal skin, foreskin, and pancreas were characterized by peaks at 1342, 1457, and 1668 cm−1. These peaks were previously defined to describe differences in collagen expression and content.28–31 ECs from the umbilical cord have been shown to express genes related to interstitial matrix synthesis, including fibrillar collagens and fibronectin. 32 Vessels of the macrovasculature with a diameter >150 µm are required to transport large blood volumes to peripheral microvasculature for blood–tissue exchange of nutrients and waste. In order to withstand large pressure differences while limiting blood–tissue exchange, macrovasculature expresses a significantly thicker and stiffer ECM compared with microvascular vessels. 33
Further differences were observable between ECs of dermal skin and from the umbilical cord compared with ECs of the foreskin and pancreas. The former show peaks for fatty acids (1448, 1656 cm−1), while the latter showed peaks for hydroxyproline (1585 cm−1) as well as membrane and phospholipids (1127, 1371 cm−1).28,31,34,35 Membrane and phospholipids play a specific role in metabolic activity and membrane trafficking. 36 Fenestration in pancreatic ECs enables a rapid exchange between blood and peripheral tissues and has been shown to be significantly greater in the pancreas compared with other organs and tissues. 1 Increased metabolic activity can explain the increased peak expression of lipids in ECs of foreskin, as prepubescent children have generally a higher lipid metabolism and lipid storages rates to support healthy growth. 37 Furthermore, differences in plasma membrane composition have been linked to mitochondrial oxidative phosphorylation in ECs. 38 Interestingly, the aforementioned peaks could also be attributed to cytochrome c, 39 the terminal complex of mitochondrial activity and oxidative phosphorylation. 40 In order to precisely differentiate between hydroxyproline and cytochrome c, the Raman shift below 1000 cm−1 needs to be considered; however, in this study the biological signal was overshadowed by glass signal and had to be removed. Another significant difference between the macrovascular ECs from the umbilical cord compared with the other ECs manifests in the DNA composition. Microvascular ECs show peaks which are attributed to DNA-related differences including DNA (1090 cm−1), adenine-tyrosine ring breathing modes (1255 cm−1), adenine-guanine ring breathing modes (1337 cm−1), guanine (1343 cm−1), deoxyribose (1456 cm−1), and adenine (1614 cm−1),41–44 while macrovascular umbilical cord ECs show peaks for acyl chains (1064 cm−1) and phenylalanine (1600 cm−1).45,46 Single cell sequencing of ECs from different tissues showed significant heterogeneity and organ-specificity for EC types, which can be reflected in their DNA composition. 17 Further, acyl chains in rat liver has been shown to regulate gene expression and cell division. 47 ECs of large vessels mainly undergo proliferation during re-endothelialization after larger injuries; 25 in contrast, ECs of the microvasculature also adjust to changing functional and structural adaptions resulting in continuous remodeling. 48 In vitro, the DNA component showed significant differences when comparing HUVECs an hpmvECs to hdmvECs and hfmvECs; however, no consistencies between in vitro and in situ were observable. It needs to be stated, that the evaluation of the cytoplasmic component was guided by CD31-staining and contribution of other cell types to the cytoplasmic component cannot be entirely excluded. Taken together, the DNA composition varies among different EC types, giving rise to heterogeneous subpopulations.
The differences observed between tissue-specific ECs are partially conserved postisolation and culturing of the corresponding ECs in vitro as observed using Raman microspectroscopy on monolayers of HUVECs, hdmvECs, hfmvECs, and hpmvECs in vitro. Specifically, HUVECs can be distinguished from microvascular ECs using peaks related to collagen expression and content (1080, 1302, 1340, and 1448 cm−1),30,31,42,46,49 suggesting that HUVECs maintain macrovascular genetic profile during in vitro culture. Furthermore, hpmvECs are significantly different to skin and foreskin microvascular ECs regarding collagen (1246, 1311, 1438, 1635, 1654 cm−1)28–30,44,50 and hydroxyproline (1130, 1586 cm−1) 28 expression, indicating that ECs of the pancreas secrete different types and proportions of ECM proteins compared with dermal skin and foreskin ECs. Although both ECMs are mainly composed of COL1,51,52 the elastic modulus differs significantly: skin has an elastic modulus ranging from 2.9 to 150 MPa, 53 while that of the pancreas ranges below 10 kPa. 23 ECs sense the stiffness of the perivascular matrix by integrin-mediated signaling which in turn controls the secretion of ECM proteins and angiocrine factors to remodel the ECM, potentially explaining the observed differences. 3 Semiquantification of the GVI of cytoplasm component further showed significantly higher values for HUVECs compared with hdmvECs and hfmvECs, which might be attributed in matrix protein expression, as stated. 32 Future studies will focus on identifying, whether ECs from different origins secrete different ECM proteins to directly alter their environment. Alternatively, these peaks can also be assigned to membrane lipids and cytochrome c,34,39 indicating increased metabolic activity of hpmvECs compared with dermal and foreskin ECs. It has previously been reported that metabolic activity is a driver in angiogenic potential and drives vessel sprouting. The higher metabolic activity could therefore be an explanation, why hpmvECs display significantly more angiogenic potential compared with the other microvascular ECs. 54 However, more experiments will be required to confirm this hypothesis. Besides differences in protein expression, Raman microspectroscopy showed a significant separation between hpmvECs and all other EC types in PC-2 with peaks for cholesterol (1261 cm−1) and membrane lipids (1437, 1654 cm−1). 34 Additionally, microvascular ECs are characterized by peaks for cholesterol and sphingolipids (1067, 1659 cm−1), 34 which is consistent with the findings obtained from tissue sections. Microvascular ECs facilitate the reciprocal exchange from blood to the peripheral tissues via membrane trafficking structures, such as caveolae or vesiculo-vacuolar organelles. 1 It has been described that the density of such membrane trafficking structures is significantly higher in microvascular ECs compared with macrovascular ECs and can cover up to 1/3 of the cell membrane. 55 Additionally, these protein- and lipid-rich structures have several functions in signal transduction and lipid regulation. 56 Caveolae are of specific interest to understand the interaction between islets of Langerhans and pancreatic ECs, as caveolae and the associated protein Cav-1 is involved in insulin secretion as well as insulin-mediated signaling. 55 The significant difference between hpmvECs and the other EC types is therefore a first indicator that organ-specific ECs express properties important for in vitro modeling. Generally, the low PC percentages presented in our Raman imaging results need to be considered. Past studies comparing healthy and diseased murine ECs using Raman microspectroscopy identified differences in the main components PC-1 and PC-2. 57 In our study, we used healthy ECs from human donors where the major PCs did not identify a clustering between the cell types. More in-depth analysis of PCs with low explained variance was able to identify differences between the ECs, while also making our results potentially more susceptible to noise.
Tube formation assays are an established method to quantify the angiogenic potential of ECs. 58 Quick revascularization is highly important posttransplantation to overcome hypoxic conditions which contributes to graft impairment.15,59 The angiogenic potential of ECs used for prevascularization is critical to overcome hypoxia posttransplantation. In our study, hdmvECs and hfmvECs were not able to form stable networks, while HUVECs and hpmvECs did form notable and stable networks already at as early as 0.5 h for up to 24 h. It is important to note, that the protocol is originally established for HUVECs regarding seeding density and time; however, hpmvECs showed significantly faster network forming capabilities compared with all other EC types, especially within the first 6 h with the lowest number of isolated segments and highest numbers of junctions, branches, and segments. Macrovascular and microvascular ECs have been described to react differently to angiogenesis-inducing growth factors (such as VEGF-A), although the same ligand-receptor system is activated.25,60 Jackson et al. 61 have showed that genes involved in angiogenesis in vivo, including matrix metalloproteinases and tissue inhibitors of metalloproteinases, are expressed differently between microvascular and macrovascular ECs, suggesting that the angiogenic potential of ECs varies among tissues and vessels. Therefore, revascularization of organoids for treatment of diabetes with highly angiogenic ECs, such as hpmvECs as shown in this study, might be superior compared with ECs with reduced angiogenic potential. Furthermore, hpmvECs formed networks with increased number of meshes and an overall smaller mesh size, reflecting their microvascular origin in contrast to the macrovascular HUVECs, which form larger and fewer meshes.
In vivo, ECs are exposed to different hemodynamic shear stress depending on their location within the vascular system. ECs in large veins are subjected and adapt to shear stresses that range from 1 to 6 dyne/cm2, while microvasculature ECs experience shear stresses from 3 to 95 dyne/cm2.62–64 Under static conditions, HUVECs form a confluent monolayer on a COL1 gel expressing the characteristic cobblestone-like morphology. Upon exposure to shear stresses of 5 and 10 dyne/cm2, HUVECs slightly arrange toward the direction of flow compared with static conditions, confirming previously published results. 65 In contrast, hpmvECs were not able to form a confluent monolayer in static conditions, most likely due to limited nutrient availability; however, upon 5 and 10 dyne/cm2 shear stress exposure, hpmvECs form a confluent monolayer that is significantly stronger aligned with the direction of flow compared with HUVECs, accompanied by F-actin fiber alignment toward the direction of flow. Similar behavior of HUVECs under flow regarding their F-actin expression have previously been reported. Han et al. demonstrated in their study that applying a shear forces of 5 dyne/cm2 increased the expression of F-actin in HUVECs. 66 Bertani et al. showed increased expression of F-actin in HUVECs cultured when under flow compared with static conditions accompanied by alignment of HUVECs toward the direction of flow. 67 The cytoskeleton of ECs acts as a mechanoreceptor that activates intracellular signaling to reorganize F-actin.68,69 ECs from different vessel origins were previously reported to react toward mechanical stress, including hemodynamic shear stress,70,71 in order to protect themselves from hydrodynamic damage.72–74 As HUVECs naturally occur in larger vessels, their adaptive behavior might be limited to this range, while hpmvECs of microvascular origin can adapt to higher shear stresses by further reorganizing their cytoskeleton. Cytoskeleton remodeling can also affect other mechanoreceptors, such as CD31 as suggested by Fernández-Martín et al., 75 which was upregulated for both HUVECs and hpmvECs at 10 dyne/cm2. CD31 is a homophilic and heterophilic cell–cell adhesion protein containing two intracytoplasmic immunoreceptor tyrosine-based inhibitory motifs (Tyr-663 and Tyr-686).76–78 Following shear stress-induced tyrosine-phosphorylation, CD31 downstream signaling includes the upregulation of signaling molecules that play essential roles in, for example, vascular remodeling, such as extracellular signal regulated kinase, endothelial nitric oxide synthase, and Akt.79–81 Our results of shear stress-induced increase in CD31 expression are supported by findings of other groups. Wang et al. showed in their study on murine embryonic mesenchymal progenitor cells that shear stress significantly increased the expression of CD31 on both mRNA and protein levels. 82 Cui et al. demonstrated that the expression of CD31 in late endothelial progenitor cells is directly correlated to higher levels of shear stress. 83
Additionally, we were able to confirm the results obtained by Raman imaging suggesting that microvascular ECs express significant differences in membrane lipid structure, such as caveolae. After exposure to 10 dyne/cm2, hpmvECs expressed significantly higher levels of Cav-1 than HUVECs, consistently with previously reported results. 55 Cav-1 has been shown to be an important mechanoreceptor of ECs which can activate the ERK-1/2 pathway to regulate proliferation and migration. 84 Sun et al. demonstrated that increasing flow rates accompanied with higher shear forces resulted in higher expression of Cav-1 in ECs. 85 Furthermore, qPCR under static and flow conditions confirmed significantly higher levels of PLVAP, a protein colocalizing with caveolae and other microdomains in ECs, which majorly controls their permeability. 86 Cav-1 is also involved in insulin-related mechanisms. In VEGF-A knockout mice, which is accompanied by a dramatic loss in fenestrae, ECs compensate by increased expression of caveolae to mediate the transendothelial insulin release. 87 These findings suggest that using organ-specific hpmvECs might have positive influences on cocultures with donor islets, as Cav-1 is involved in insulin-related mechanisms.
In a proof-of-principle experiment, we cultured human donor islets in suspension alone or with either HUVECs or hpmvECs. In the BF images, the dark core represents the compact human islets, which was the decisive structure for the size tracking analysis. ECs added in suspension culture initially attached to the human islet after 24 h; however, the majority of ECs later detached and formed a secondary zone around the islets. Similar behavior was shown by our group in a previous study using controlled aggregation of cocultured spheroids consisting of the human β-cell line EndoC-βH3 and HUVECs, where unattached HUVECs formed a secondary zone around the initially formed β-cell spheroid over the timespan of 25 days. 15 Still, we were able to show a significantly higher attachment rate of hpmvECs compared with HUVECs reflected by an increase in donor islet size. The control donor islets did not show a functional glucose response, represented by a GSIS index <1. These results are not uncommon, as donor islets used for research face several impairments, including prolonged time between isolation date and experimental setup, variability in donor islet quality and composition, and loss of physiological features. 88 Therefore, experimental setup with small n-numbers can result in nonfunctional response of human donor islets. 89 The coculture with HUVECs slightly improved the glucose responsiveness, in line with previously reports on the stimulatory effect of HUVECs on insulin secretion;12,90 however, donor islets were still not functional (GSIS index <1). In contrast, donor islets cocultured with hpmvECs showed glucose responsiveness (GSIS index >1) accompanied by significantly higher insulin secretion at high glucose stimulation, effectively rescuing the otherwise nonfunctional human donor islets. These effects can be attributed to a variety of influences. One explanation could be the EC-specific expression of ECM proteins, as suggested by Raman microspectroscopy. The pancreatic basement membrane within and surrounding the islets of Langerhans differs from, for example, the skin basement membrane. The pancreatic endocrine basement membrane only contains laminin-511, to which islets cells strongly adhere via the Lutheran glycoprotein and integrin α3β1, positively contributing to β-cells proliferation and phenotype maintenance and therefore potentially supporting their functionality.15,91,92
Further, Cav-1 has been shown to interact with epidermal growth factor receptor (EGFR) as well as platelet-derived growth factor receptor A and B (PDGRF-A, PDGFR-B). 93 Song et al. demonstrated that EGFR is an important regulator of β-cell mass by controlling β-cell proliferation in adult mice. Specific deletion of EGFR resulted in significant reduction of proliferation through reduction in cyclin D1 and impaired suppression of p27. 94 Chen et al. presented in their study that PDGFR-levels in murine and human islets decrease with age. Targeted activation of PDGFR-A in mice resulted in upregulation of ERK-1/2-mediated and Ezh2-dependent proliferation of β-cells. 95 The interaction of human islets with ECs expressing higher levels of Cav-1 might therefore stimulate the proliferation in human donor islets, counteracting isolation-induced apoptosis. Further experiments will focus on the interaction between Cav-1 and PDGFR and/or EGFR to stimulate β-cell proliferation to maintain and improve glucose-simulated insulin expression.
The goal of this study was to investigate whether ECs from different organ tissues impact the outcomes of in vitro experiments. The presented results demonstrate that the choice of EC type can significantly influence the meaningfulness of the obtained data. Choosing organ-specific EC types can advance our understanding of the interaction between ECs and islet cells. The next steps will include the investigation of the potential interaction between Cav-1 of ECs with PDGFR-A and/or EGFR of β-cells and its impact on β-cell proliferation. Additionally, focus will be put on optimizing the coculture conditions to provide long-term cultures and integrate other supportive cell types, such as pericytes or mesenchymal stromal cells, and growth factors, such as VEGF-A. 9 Improving the specificity of in vitro test systems can improve the outcome of high-throughput genomic and proteomic studies to investigate organ-specific pathways to better model and understand disease development and progression.
Footnotes
Acknowledgment
The authors would like to thank Melanie Doorman and Kai Bernreuther for their technical support (both University Tübingen).
Authors’ Contributions
M.U., A.J., S.L.L., and K.S.-L.: Designed the experiments and wrote the article. M.U., A.A., M.K., A.J., E.K., and D.C.-B.: Performed experiments and analyzed data. J.M., P.L., and S.L.L.: Gave conceptual advice.
Disclosure Statement
The authors declare that they have no known competing financial interests or personal relationships that could have appeared to influence the work reported in this paper.
Funding Information
This work was financially supported by the
References
Supplementary Material
Please find the following supplemental material available below.
For Open Access articles published under a Creative Commons License, all supplemental material carries the same license as the article it is associated with.
For non-Open Access articles published, all supplemental material carries a non-exclusive license, and permission requests for re-use of supplemental material or any part of supplemental material shall be sent directly to the copyright owner as specified in the copyright notice associated with the article.