
Abstract
The junction between the epidermal and dermal layers of human skin undulates, the width and depth of the undulations varying with age and disease. We previously showed that when primary human epidermal keratinocytes are seeded on collagen-coated undulating static polydimethylsiloxane (PDMS) elastomer substrates, the stem cells, differentiated cells, and proliferating cells become patterned in response to cues from the underlying substrate. To investigate how patterning occurs over time, we have now created a dynamic model, in which a collagen-coated poly(
Impact Statement
In human skin the junction between the epidermis and dermis undulates. Epidermal stem cells pattern according to their position relative to those undulations. Here we describe a rig in which epidermal cells are cultured on a collagen-coated poly(
Introduction
M
Stem cells are located in the human epidermal basal layer9,10 and occupy specific locations relative to the epidermal–dermal junction, in most body sites clustering on the top of the dermal papillae.9,11,12 Expression of several cell surface markers is enriched in human epidermal stem cells, including β1-integrin receptors, Lrig1, CD46, MCSP, and Delta-like 1.
Previous studies have demonstrated that stem cell fate is regulated by a combination of intrinsic (genetic and epigenetic) and extrinsic signals,1,13 such as soluble factors, cell–cell contact, extracellular matrix (ECM) protein interactions, and tissue topography. To mimic different components of the extracellular environment, a number of approaches have been taken, such as coculture of keratinocytes and dermal fibroblasts on biomaterials, including collagen gels, 14 which act as scaffolds for cell growth and also facilitate cell–cell interactions. Other approaches include culture on de-epidermized acellular human dermal matrices, 15 self-assembled living sheets made with human fibroblasts and keratinocytes, 16 and bioprinted cell-laden hydrogels. 17 However, these models fail to mimic the undulating epidermal–dermal junction. To overcome this limitation several other models18–20 have been developed. Undulations have been created using static topographies through microfabrication of dermal–epidermal regeneration matrices, for example, through fabrication of patterned polydimethylsiloxane (PDMS) substrates or micro-topographies using photolithography followed by the production of collagen-GAG templates. 19
Using a panel of undulating collagen-coated PDMS substrates 18 that differ in diameter, height, and center-to-center spacing, we have previously shown that topography is sufficient to direct the formation of β1 integrin bright stem cell clusters on the top of the features. In addition, we found that separate topographical cues determine the locations of stem cells, involucrin-positive differentiated cells, and proliferating cells. This prompted us to develop a platform in which we could change topography from flat to undulating to measure dynamic cell responses. By simultaneously creating multiple topographies within a single device, we can begin to understand the effect of aging and other changes on stem cell behavior.
Materials and Methods
Membrane preparation
Poly(
The concentrations were chosen based on the lowest amount of polymer able to form an elastic thin membrane that will deform under vacuum without collapsing. The solution was made in a glass vial and gently agitated using a magnet stirrer for ∼1 h. After complete dissolution, 7 mL of the solution was placed on a 13.5 cm diameter glass Petri dish and covered with a lid to guarantee slow evaporation of the solvent at room temperature for 48 h inside the fume hood. Samples were then sterilized by covering the surface with 70% ethanol for 30 min at room temperature.
The melting point of the two membranes (PLGA and PLA) was measured using a Differential Scanning Calorimeter (DSC)-Mettler Toledo DSC822e Calorimeter. Three samples for each polymer were analyzed. Sample size was 10 ± 1 mg.
The tensile strength of the membranes was measured using uniaxial tensile test—ElectroForce Model 3200 testing machine (BOSE). The samples were cut according to the ASTM D882 Tensile Strength properties of thin plastic films (film less than 1 mm thick, in a ratio 2:1; 3:0.5 inch). The samples were 10 × 30 mm in dimension, tested with a maximum load of 22.2 N and a rate of 0.05 mm/s.
Collagen coating
PLGA membranes were coated with collagen type I (Ref 354236; Corning) in phosphate-buffered saline (PBS) for 2 h at 37°C. To evaluate collagen deposition membranes were labelled with anti-Collagen I antibody (1:500, ab34710; Abcam) followed by donkey anti-rabbit 488 Alexa Fluor secondary antibody (1:1000, A-21206; Thermo Fisher). Collagen coated and noncoated membranes were then imaged by confocal microscopy.
Template design
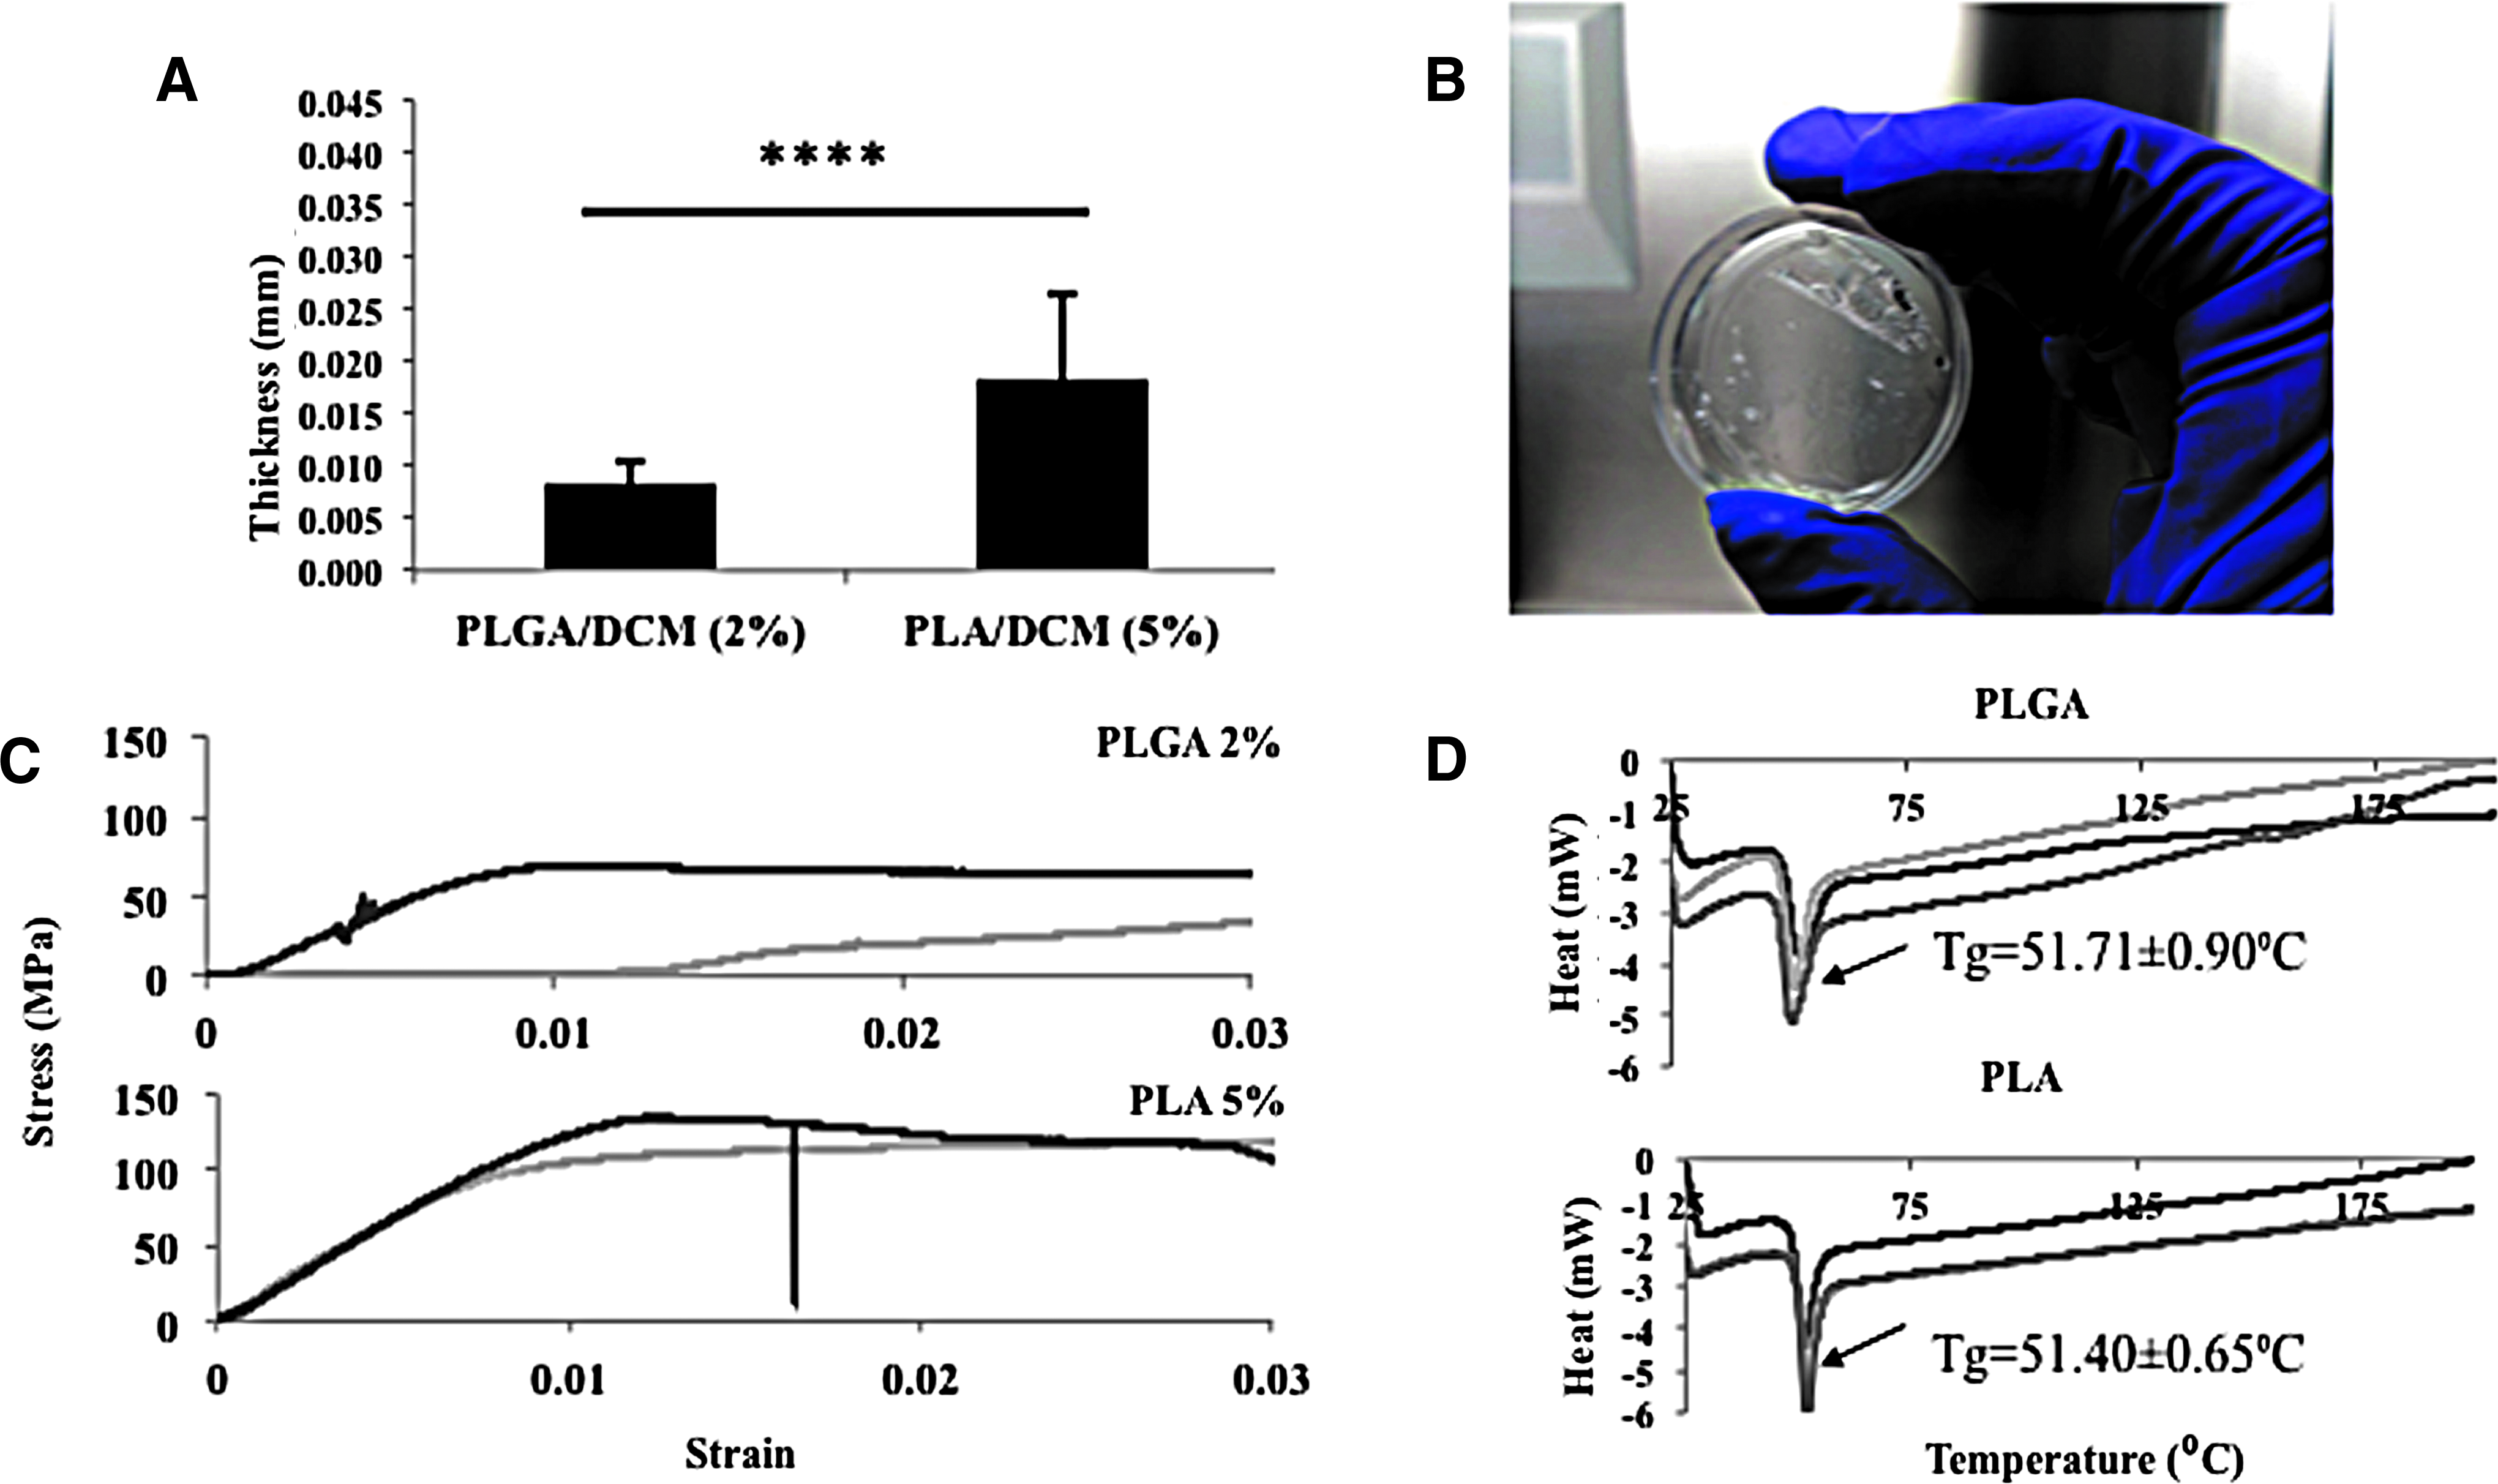
Three topographies were designed using the software AutoCAD Autodesk 2016. The topographies were distributed according to the shape of a 12-well cell culture plate to cover surfaces of 1 cm by 1 cm. Each of the three topographies and a flat control were arranged in triplicate. The dimensions that differed between topographies were the diameters of the drilled holes and the distance between holes. The first topography consisted of drilled holes with a diameter of 100 μm and a distance between holes of 150 μm. The second topography consisted of drilled holes with a diameter of 100 μm and interhole distance of 200 μm. The third topography had holes of 200 μm in diameter and a distance of 200 μm between holes.
The template material selected was a 500 μm thick polyimide sheet (Cirlex from Goodfellow), which has good mechanical properties and yet is thin enough for laser drilling. Laser drilling requires a small ratio diameter of drilling: sheet thickness, because the drilled holes become conical if the thickness is too high.
Rig design
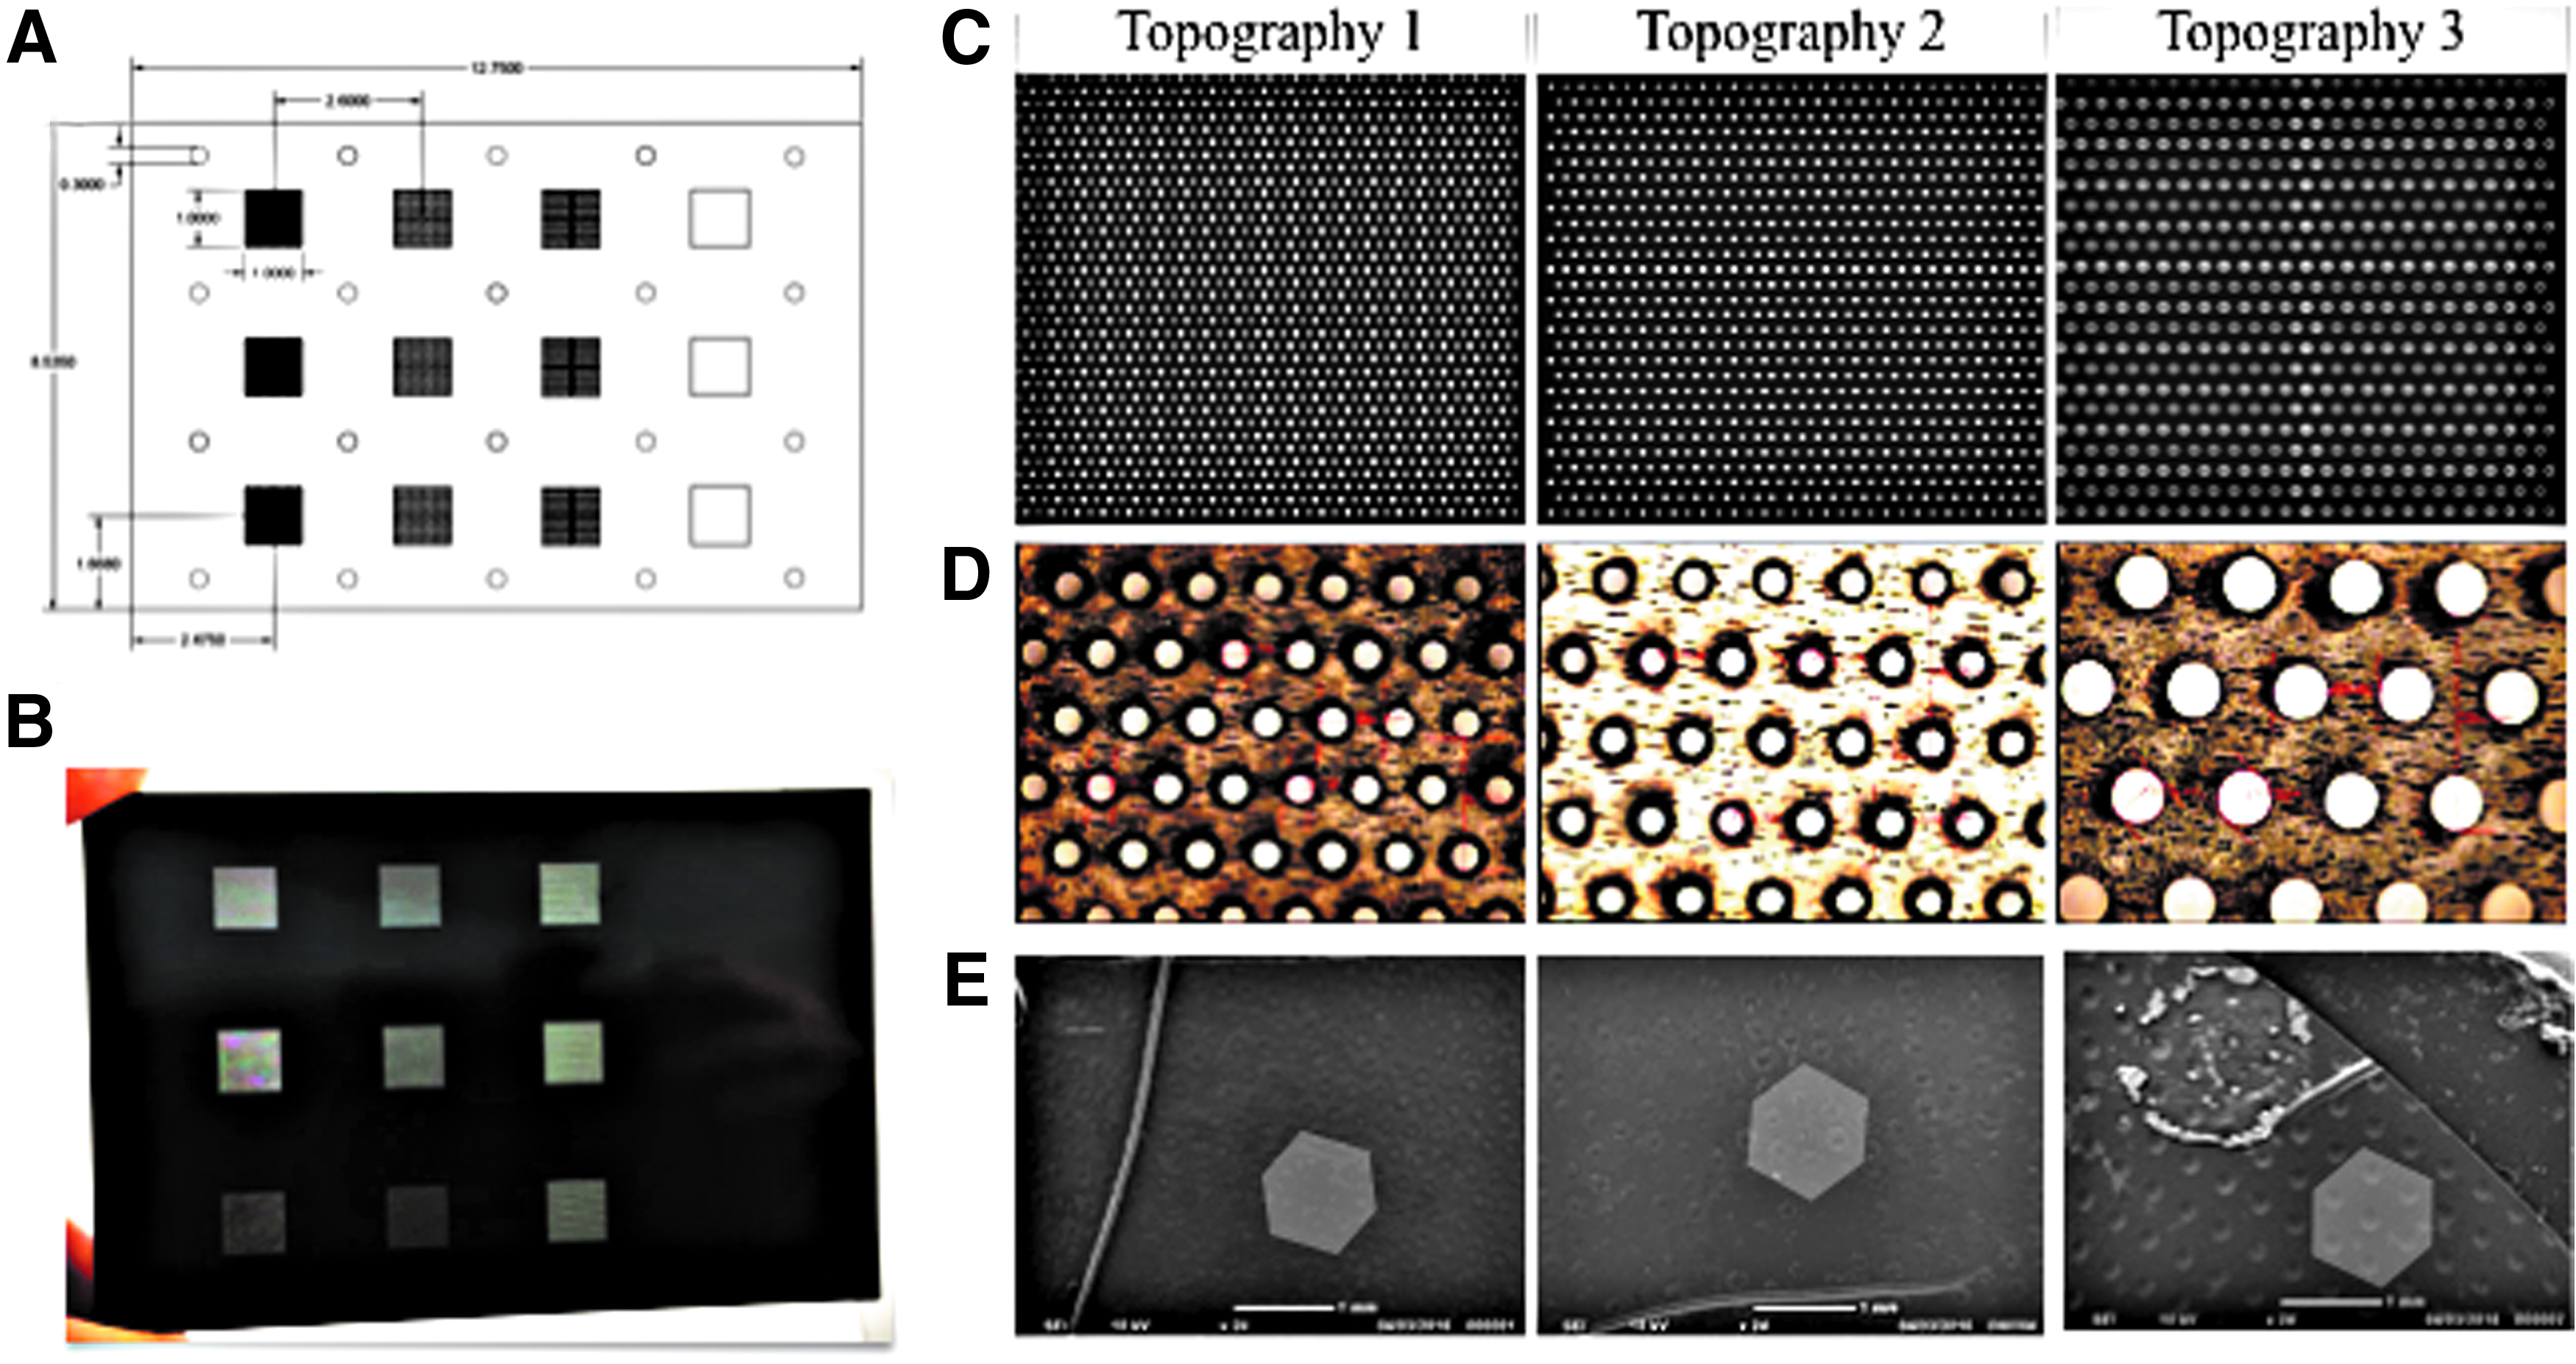
The rig was designed using AutoCAD Autodesk 2016 and fabricated with transparent acrylic. It was based on the dimensions of a 12-well cell culture plate and composed of three individual parts that are assembled together and secured with screws. The rig has two barbed fittings to connect the pipe that is attached to the vacuum pump (SAM 18, MGE) that generates the force to deform the culture membrane. The manufacturing process was carried out by the Department of Clinical Technology Mechanical Workshop Activity of the University Hospital of North Midlands NHS Trust.
Scanning electron microscopy
Scanning electron microscopy (SEM) was used to evaluate the deformation of membranes in the presence of a vacuum. To fabricate the samples for SEM, PDMS was added on the membrane while the vacuum was running. Following complete curing, PDMS was peeled from the membrane, creating a replica of the patterns of the membrane. Samples were coated with gold sputter (4 nm thickness) and imaged with SEM using a JEOL NeoScope JCM 6000Plus.
Culture of human keratinocytes
Neonatal human foreskin keratinocytes were cultured on a mitotically inactivated feeder layer comprising the J2 clone of 3T3 cells. As described previously 18 the medium comprised 1 part Ham's F12, 3 parts Dulbecco's modified Eagle's medium, 1.8 × 10⁻⁴ M adenine, 10% (v/v) fetal bovine serum (FBS), 0.5 μg/mL hydrocortisone, 5 μg/mL insulin, 10−10 M cholera toxin, and 10 ng/mL epidermal growth factor [complete F12, Adenine, and DMEM (FAD) medium]. Keratinocytes were seeded onto PLA and PLGA membranes at a density of 100,000 cells/cm2 overnight in complete Keratinocyte Serum Free Medium (KSFM; Gibco) and then transferred for 48 h to complete FAD medium at 37°C and 5% CO2. No vacuum pressure was applied to the rig during the first 20 min in FAD medium. Following this, constant vacuum pressure was applied through the rig, deforming the membrane on which keratinocytes were growing.
Immunolabeling and confocal microscopy
Cells were simultaneously fixed and permeabilized in 4% paraformaldehyde (PFA) and 0.2% Triton X-100 (Sigma) for 15 min, at room temperature. Afterwards they were blocked for 1 h in blocking buffer (10% FBS, 0.25% gelatin from cold water fish skin [Sigma] in PBS) at room temperature, incubated with primary antibodies diluted in blocking buffer for 1 h at room temperature or overnight at 4°C, and incubated with Alexa Fluor (488 and 555)-conjugated secondary antibodies diluted in PBS for 1 h at room temperature. Samples were mounted using mounting medium with DAPI (ProLong Gold antifade reagent with DAPI; Invitrogen). The following primary antibodies were used: P5D2 (mouse monoclonal anti-β1 integrin; dilution of 1:500; prepared in-house); SY7 (mouse monoclonal anti-involucrin; dilution of 1:1000; prepared in-house); HECD-1 (mouse monoclonal anti-E-cadherin; dilution of 1:1000; prepared in-house); and anti-YAP (rabbit; dilution of 1:200; Cell Signaling). Samples were visualized using a Nikon A1 Scanning Confocal Upright microscope.
Statistical analysis
All values are represented as mean ± standard deviation. Experiments were performed in triplicate. Additional information is provided in the figure legends. Statistical analysis was carried out using GraphPad Prism 7.0 (GraphPad Software, Inc.). All data were analyzed by one or two factor ANOVA tests. The statistical significance was set at *p < 0.05, **p < 0.01, ***p < 0.001, and ****p ≤ 0.0001.
Results
Membrane characterization
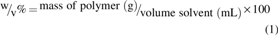
PLA and PLGA membranes have been used extensively to support the growth of cultured cells and are translucent, enabling cells to be visualized by light microscopy.21,22 The polymer concentration of each membrane was chosen based on the minimum concentration that could create an elastic thin membrane that would deform under vacuum pressure without collapsing: 2% (w/v) PLGA and 5% (w/v) PLA. We therefore compared their thickness and mechanical properties with a view to selecting one as the material for the dynamic substrate. The thickness of the membranes was measured using a digital micrometer (Fig. 1A, B). We also subjected the membranes to a uniaxial tensile test (Fig. 1C) to compare the elasticity and breaking strength of the materials. Finally, we measured crystallinity using DSC (Fig. 1D): PLGA and PLA had a similar melting point, which was higher than 37°C, allowing us to conclude that culturing cells would not affect the chemical properties of either polymer. Based on these results, PLGA was chosen over PLA because of its lower thickness and higher elasticity.
Membrane characterization.
Template design
The template for deforming the PLGA membrane was designed using AutoCAD software (Fig. 2A) and fabricated by laser drilling a 500 μm thick polyimide sheet (Fig. 2B). The dimensions of each feature were selected based upon previous studies elucidating epidermal–dermal junction topographies in young and aged skin. 5 Three topographies were designed, each of which covered the area of an individual well of a 12-well plate. We also included a fourth topography with no holes, to serve as a flat membrane control. Each topography was reproduced thrice in the template, so that within a single experimental run we could compare triplicate cultures exposed to each topography (Fig. 2B–E). As shown in Figure 2C–E, there was excellent uniformity in the size and patterning of the holes.
Template design and characterization.
Rig design and assembly
The PLGA membrane and template were assembled in a rig made from transparent acrylic (Fig. 3A–D and Supplementary Movie S1). Then a vacuum was applied through two tubes coming from both sides of the rig and connecting to a vacuum pump (Fig. 3E). The pressure from the vacuum drew the membrane through the template, creating invaginations varying in depth and spacing according to topography and applied vacuum pressure (Fig. 4).
Schematic diagram of rig-template-membrane assembly.
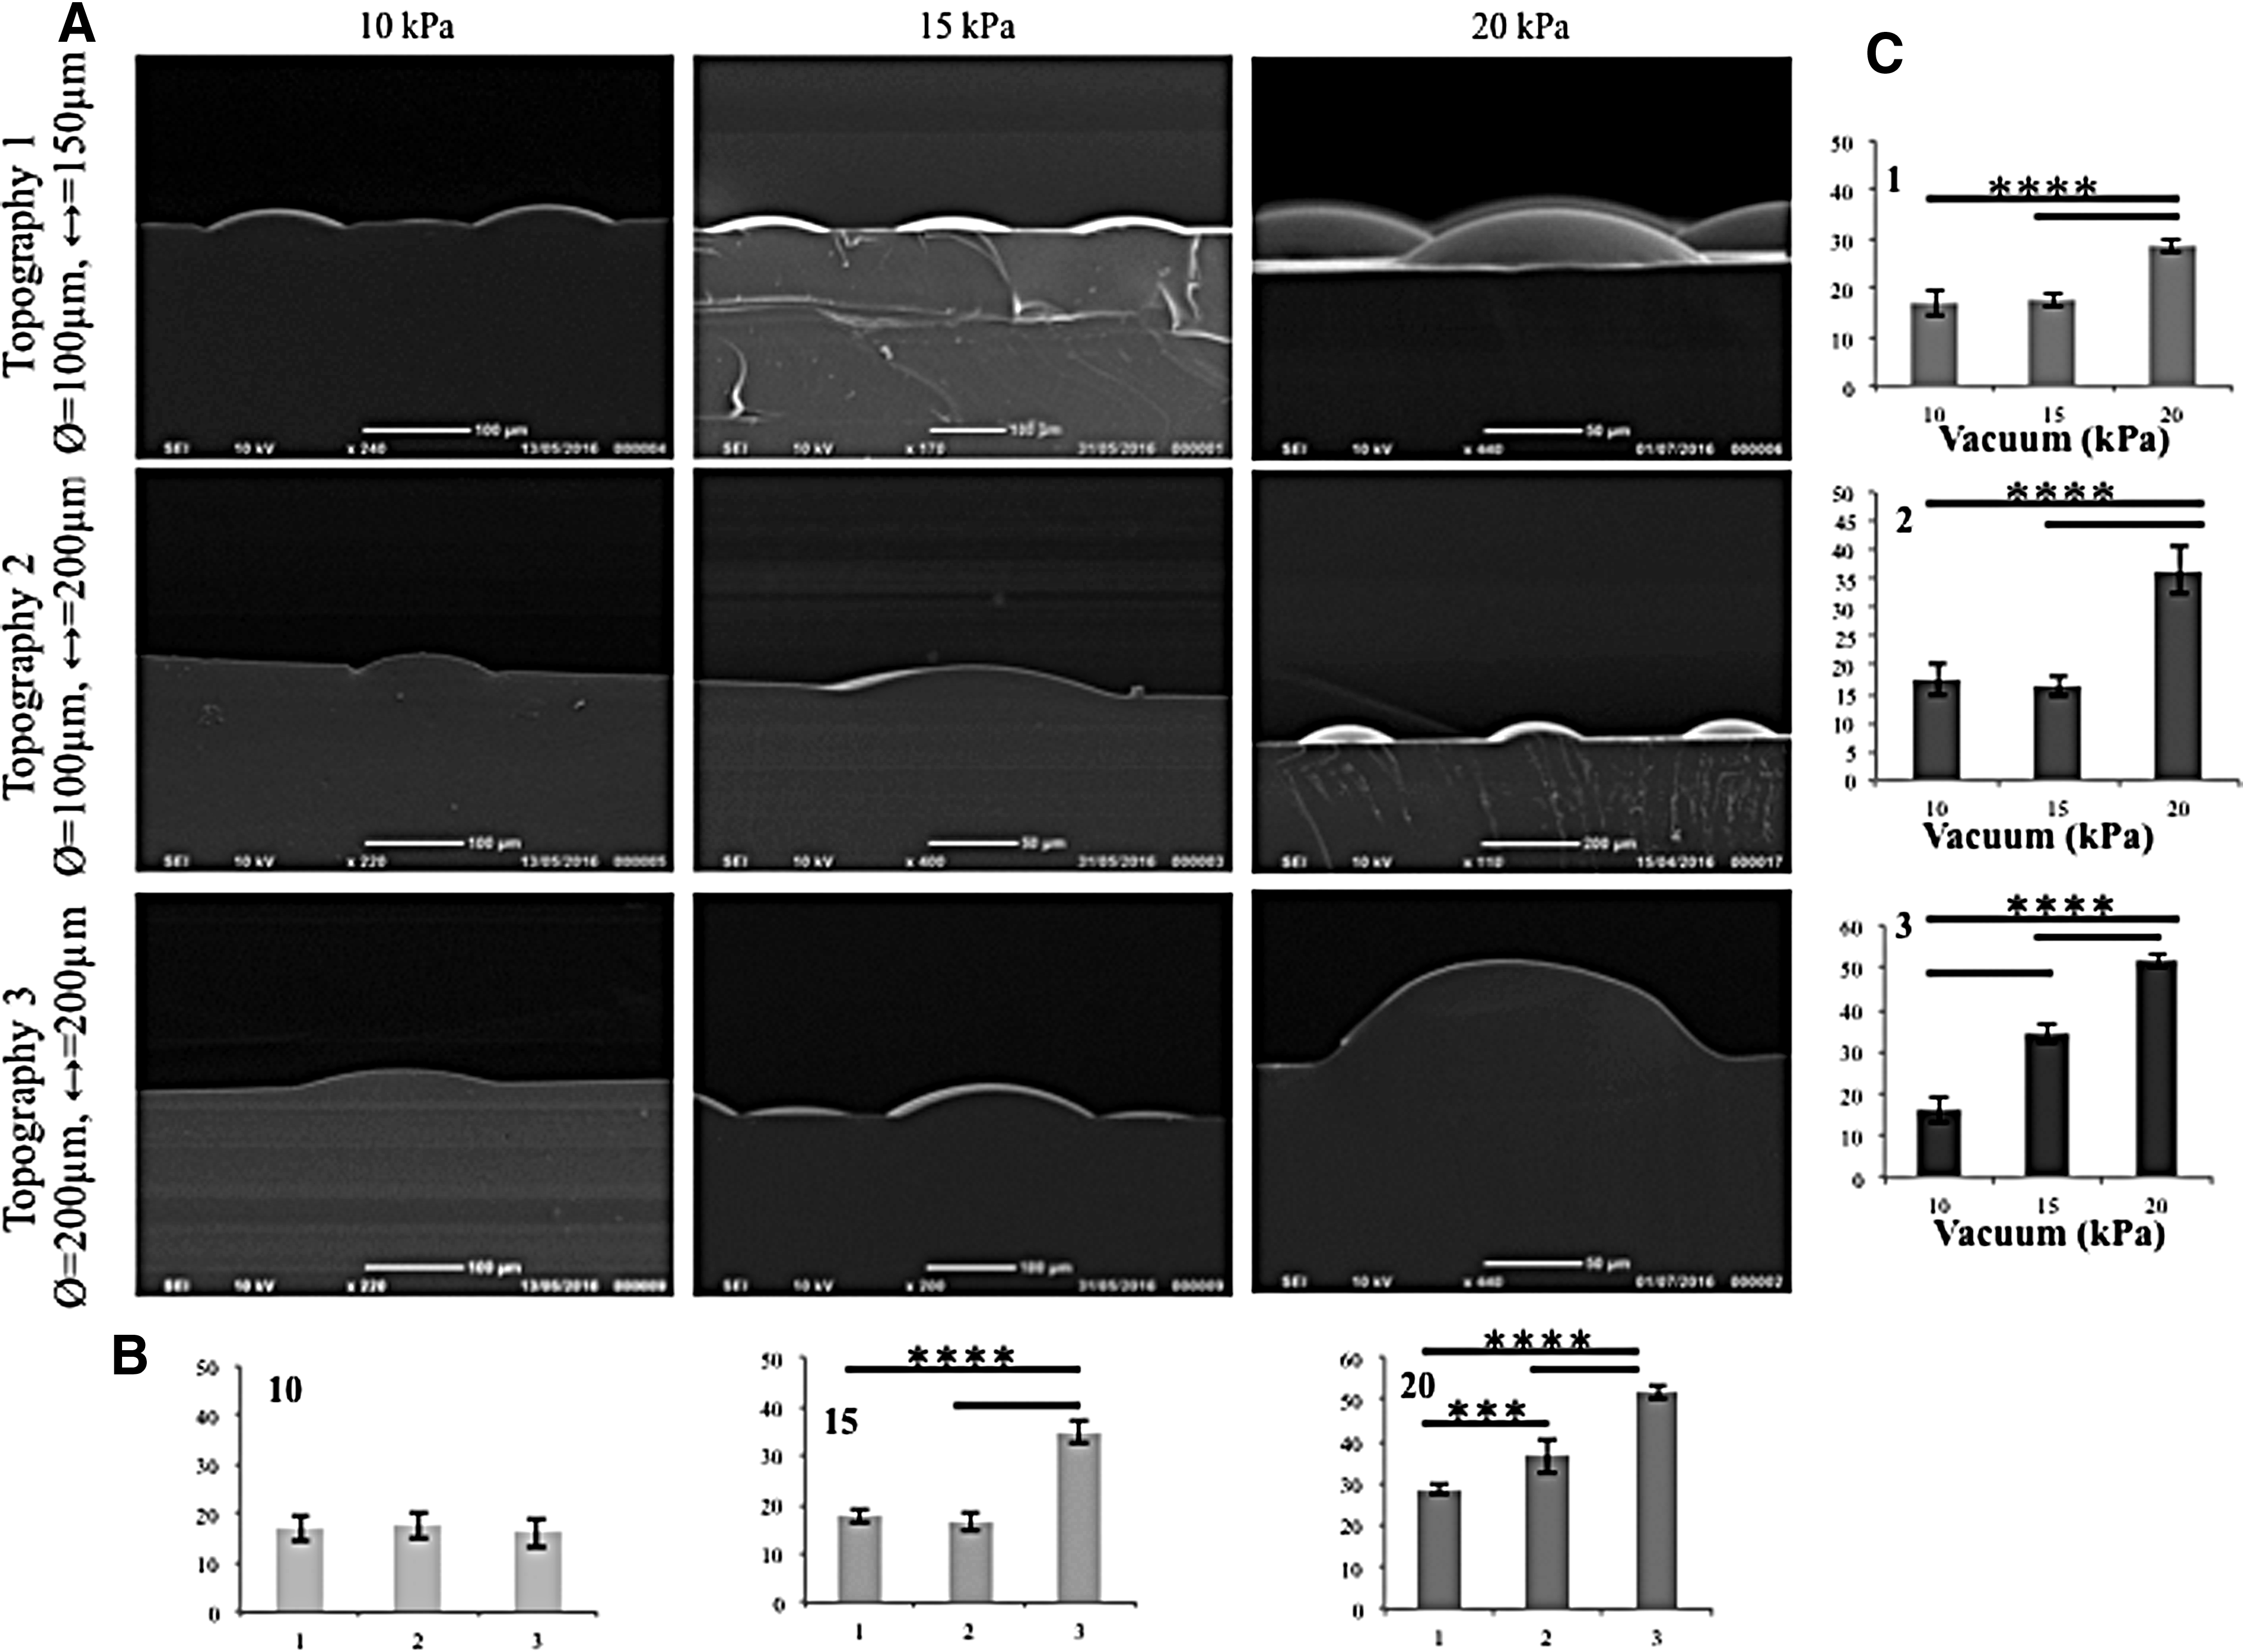
Vacuum-induced indentations.
To quantify the degree of membrane deformation achieved, PDMS was poured on top of the deformed membrane and then left to cure, as described previously, 18 creating an imprinted stamp of the deformed membrane. The PDMS stamps were imaged using SEM (Fig. 4A), and the images were analyzed using ImageJ. Vacuum pressures of 10, 15, and 20 kPa were used to deform the membrane. Quantitative analysis confirmed that an increase in vacuum pressure correlated with an increased depth of membrane topographies. Under 15 and 20 kPa (Fig. 4B, C) vacuum pressures, there was a statistically significant difference in the deformation of topography 3 compared to topographies 1 and 2. Regardless of topography there was a statistical difference between the deformation due to 20 kPa and the other two vacuum pressures (Fig. 4B, C). For subsequent experiments, a vacuum pressure of 20 kPa was selected because it gave the highest degree of deformation.
Optimizing keratinocyte adhesion to the PLGA membrane
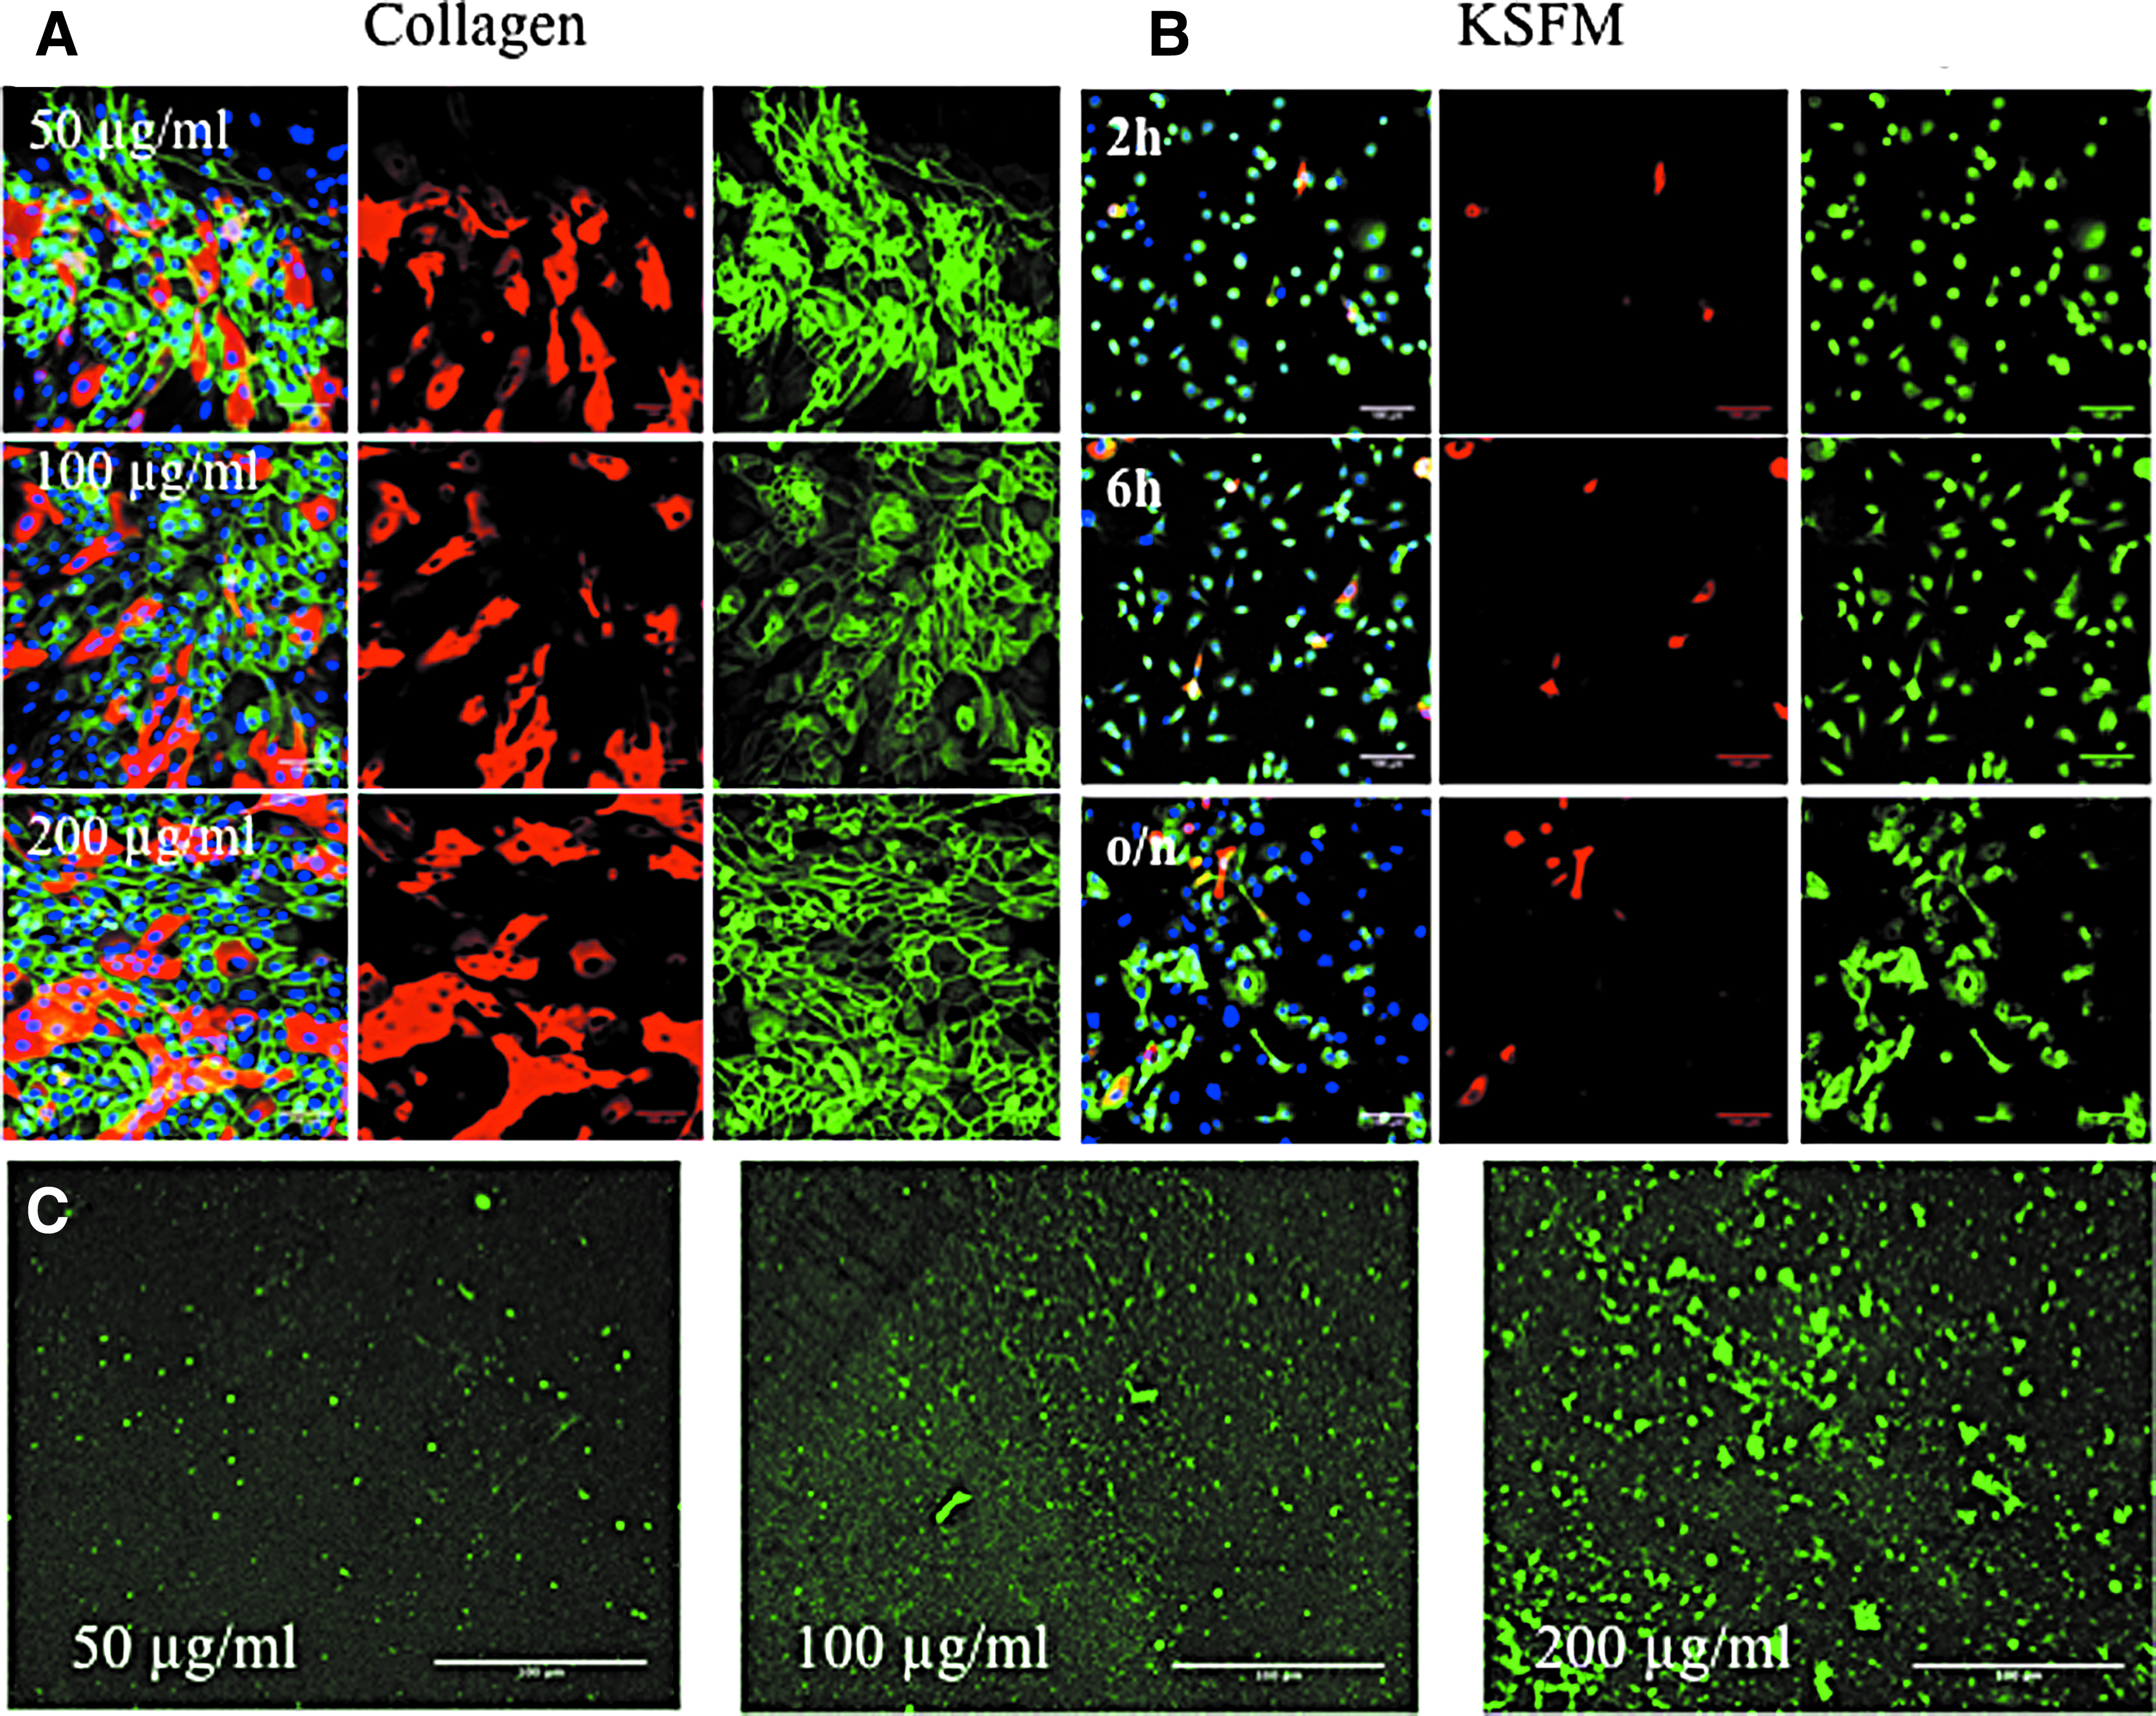
To determine the optimal collagen coating concentration for the PLGA membrane, keratinocytes were seeded at a density of 75,000 cells/cm2 on concentrations of 50, 100, or 200 μg/mL bovine type I collagen and cultured in complete FAD medium for 48 h. The cultures were then fixed and stained with antibodies to β1 integrin and involucrin with DAPI as a nuclear counterstain. As shown in Figure 5A, the cells formed stratified sheets of basal (β1 integrin-positive) and suprabasal, differentiating (involucrin-positive) cells on each collagen coating. Therefore, a concentration of 50 μg/mL was selected for subsequent experiments because it was sufficient to support keratinocyte attachment.
Cell adhesion on flat collagen-coated PLGA.
We also evaluated the optimal plating time to allow stratified sheet formation before applying the vacuum (Fig. 5B). Regardless of whether cells were seeded in complete KSFM (Fig. 5B) or complete FAD (data not shown), the cells that adhered up to 6 h were primarily β1 integrin-positive involucrin-negative cells, consistent with our previous studies. 18 However, by 24 h involucrin-positive cells were present, indicating that some cells had initiated terminal differentiation. For subsequent experiments, cells were seeded overnight in KSFM and then transferred to complete FAD medium at the time when the vacuum was applied. Figure 5C shows the deposition of collagen onto the PLGA membranes, as evaluated by immunofluorescence labelling.
Stem cell patterning on dynamic topographies
After 48 h of applying a constant 20 kPa vacuum pressure, PLGA membranes were recovered from the rig and the attached cells were fixed, immunostained, and examined by confocal microscopy. Although the pressure had been removed, the position of the indentations, corresponding to the holes in the template, was readily observed (Fig. 6A). By drawing a line through the center of each hole (Fig. 6A), we could quantitate integrin and involucrin expression relative to the topographies on the basis of pixel intensity (y-axis) per unit length (x-axis) (Fig. 6B). On all three topographies, β1 integrin bright cells clustered in the holes, but in contrast patterning of involucrin-positive cells was not observed. Topography 3 differed from topographies 1 and 2 in that there was a ring of integrin-bright cells at the periphery of each hole, rather than a uniform distribution of integrin-bright cells across the entire hole diameter (Fig. 6A, B). There was no clustering of β1 integrin bright or involucrin-positive cells on the flat membrane controls. To compare the total fluorescence signal in individual indented versus flat regions of the same topographical feature, pixel intensity per unit area was measured (Fig. 6C). We quantitated three indented and three flat regions per well in a total of three wells per topography. On all three topographies the fluorescence intensity in the indentations was significantly higher than in the flat regions (Fig. 6C).
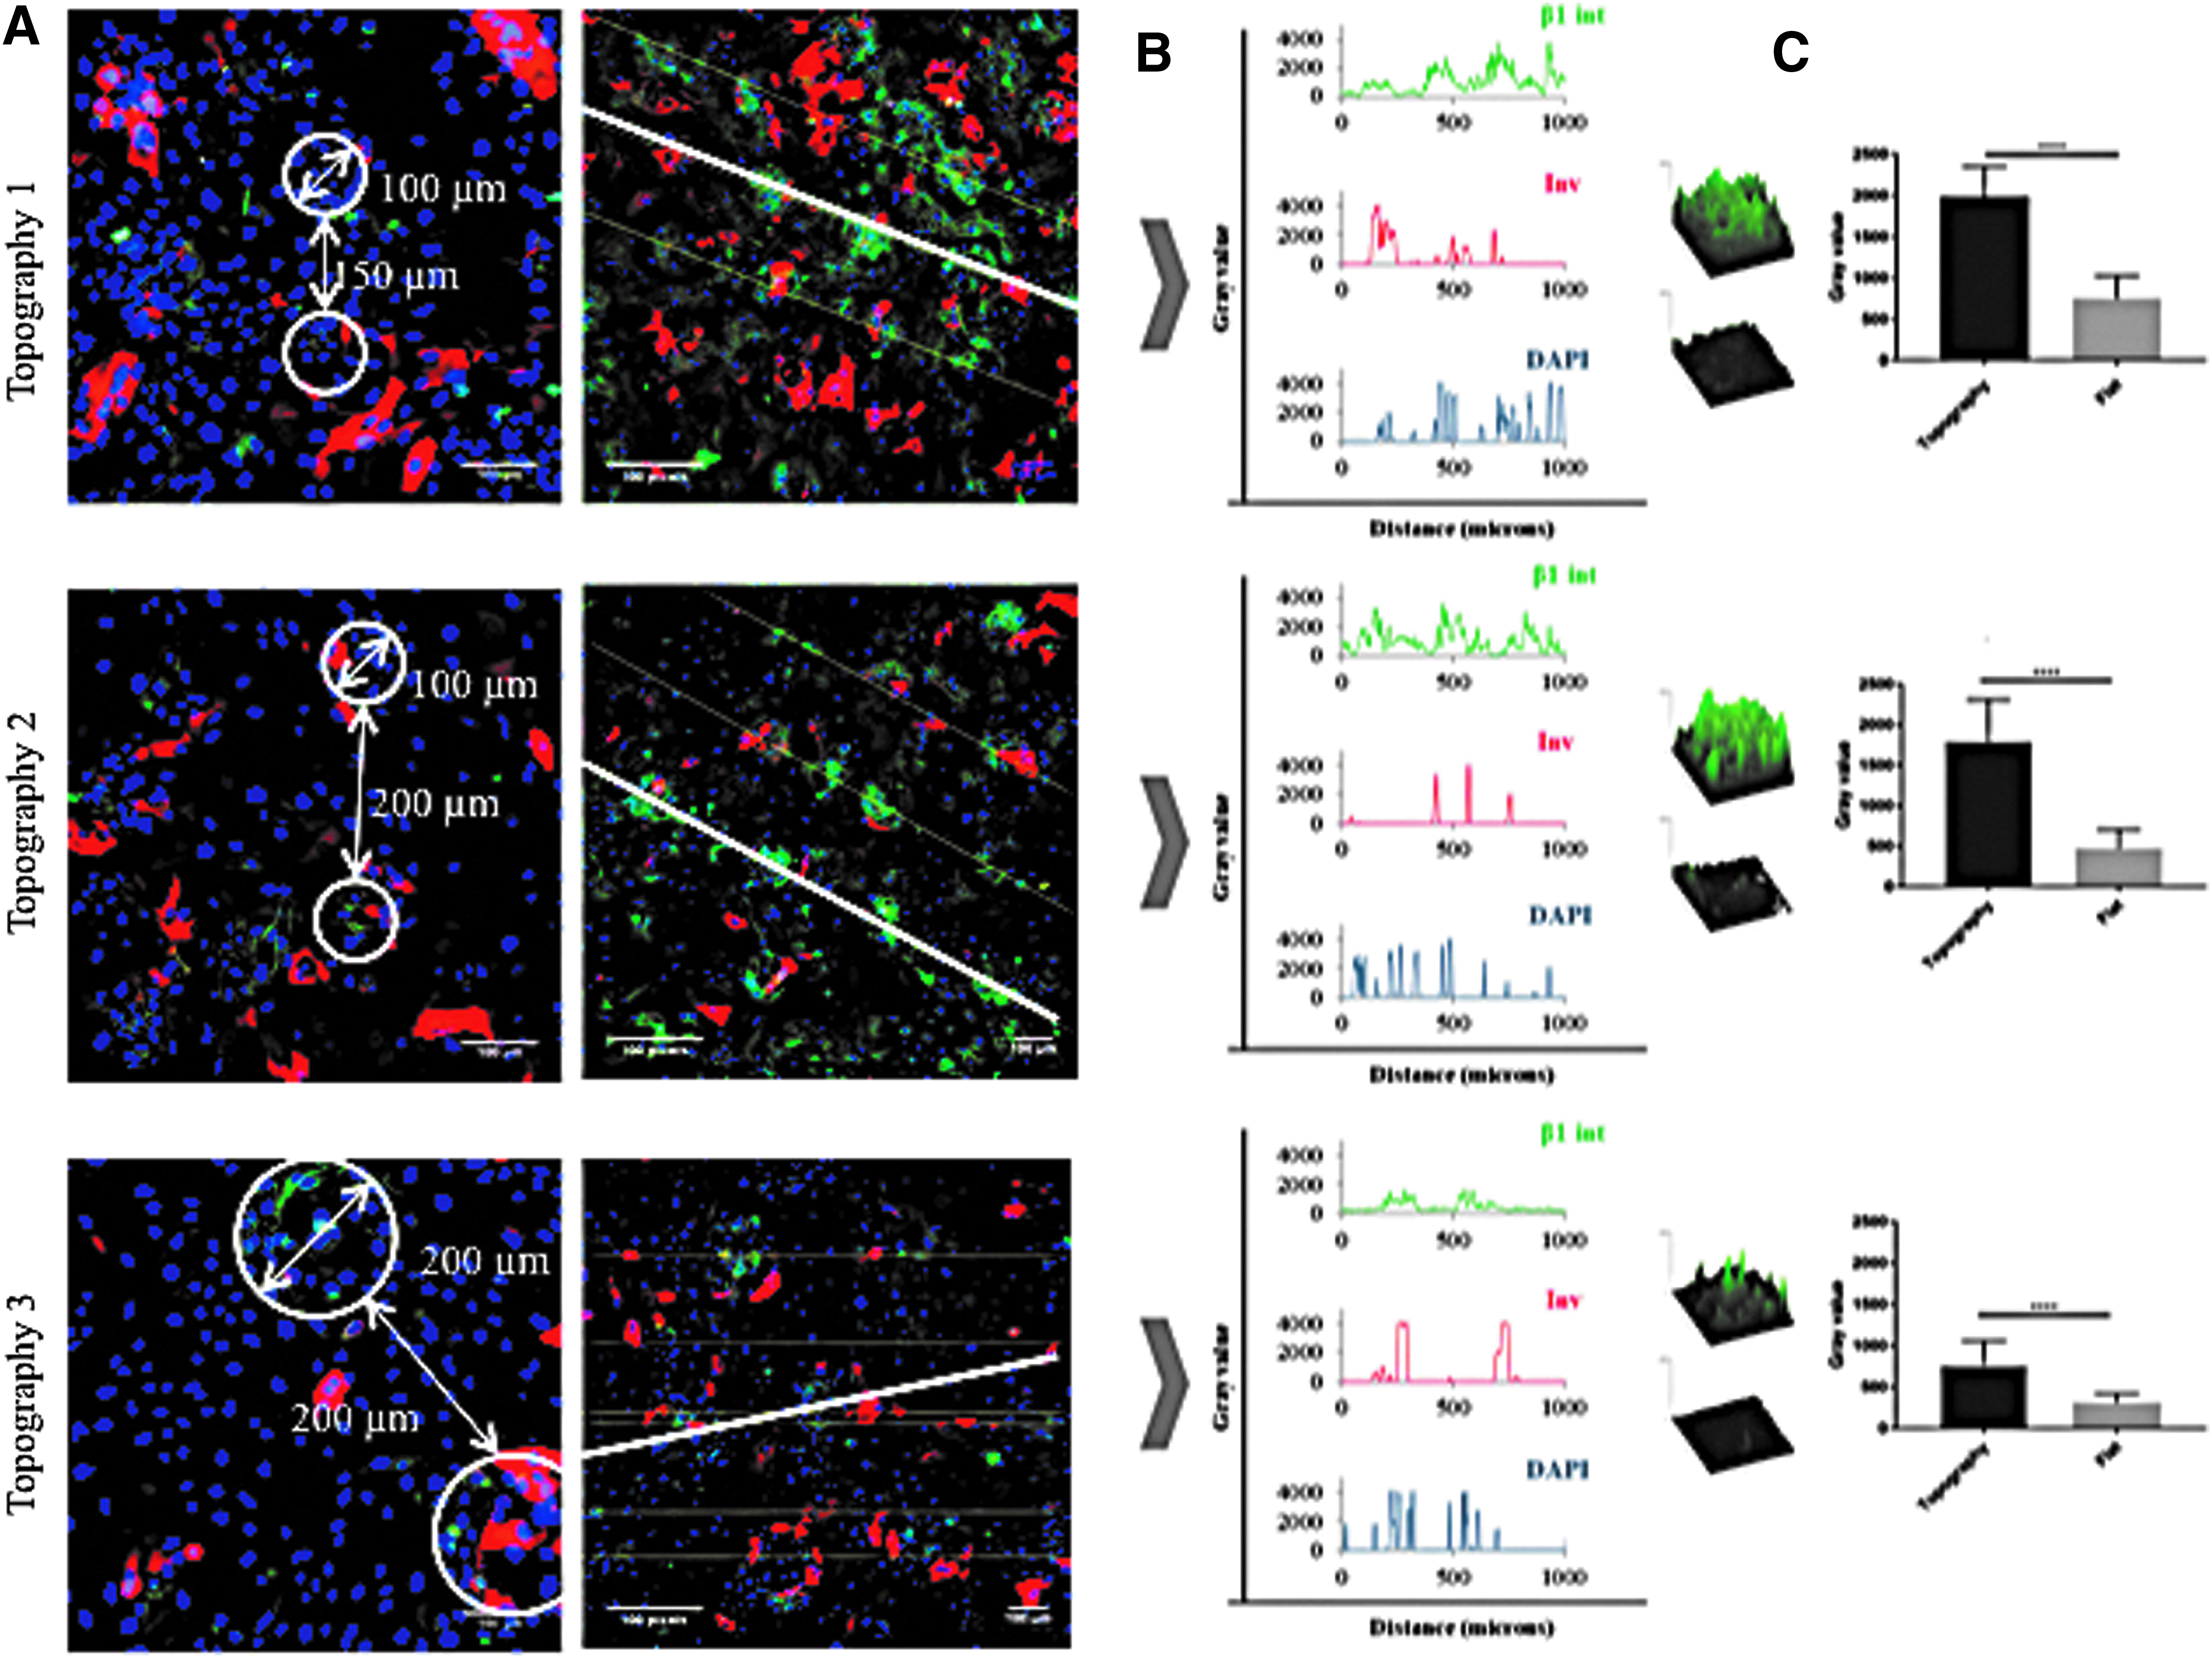
Effect of topographies on involucrin and β1 integrin expression after culture under vacuum for 48 h. Cells were fixed and labelled with antibodies to involucrin (red), β1 integrin (green), and DAPI as a nuclear counterstain (blue).
Role of intercellular adhesion in stem cell patterning
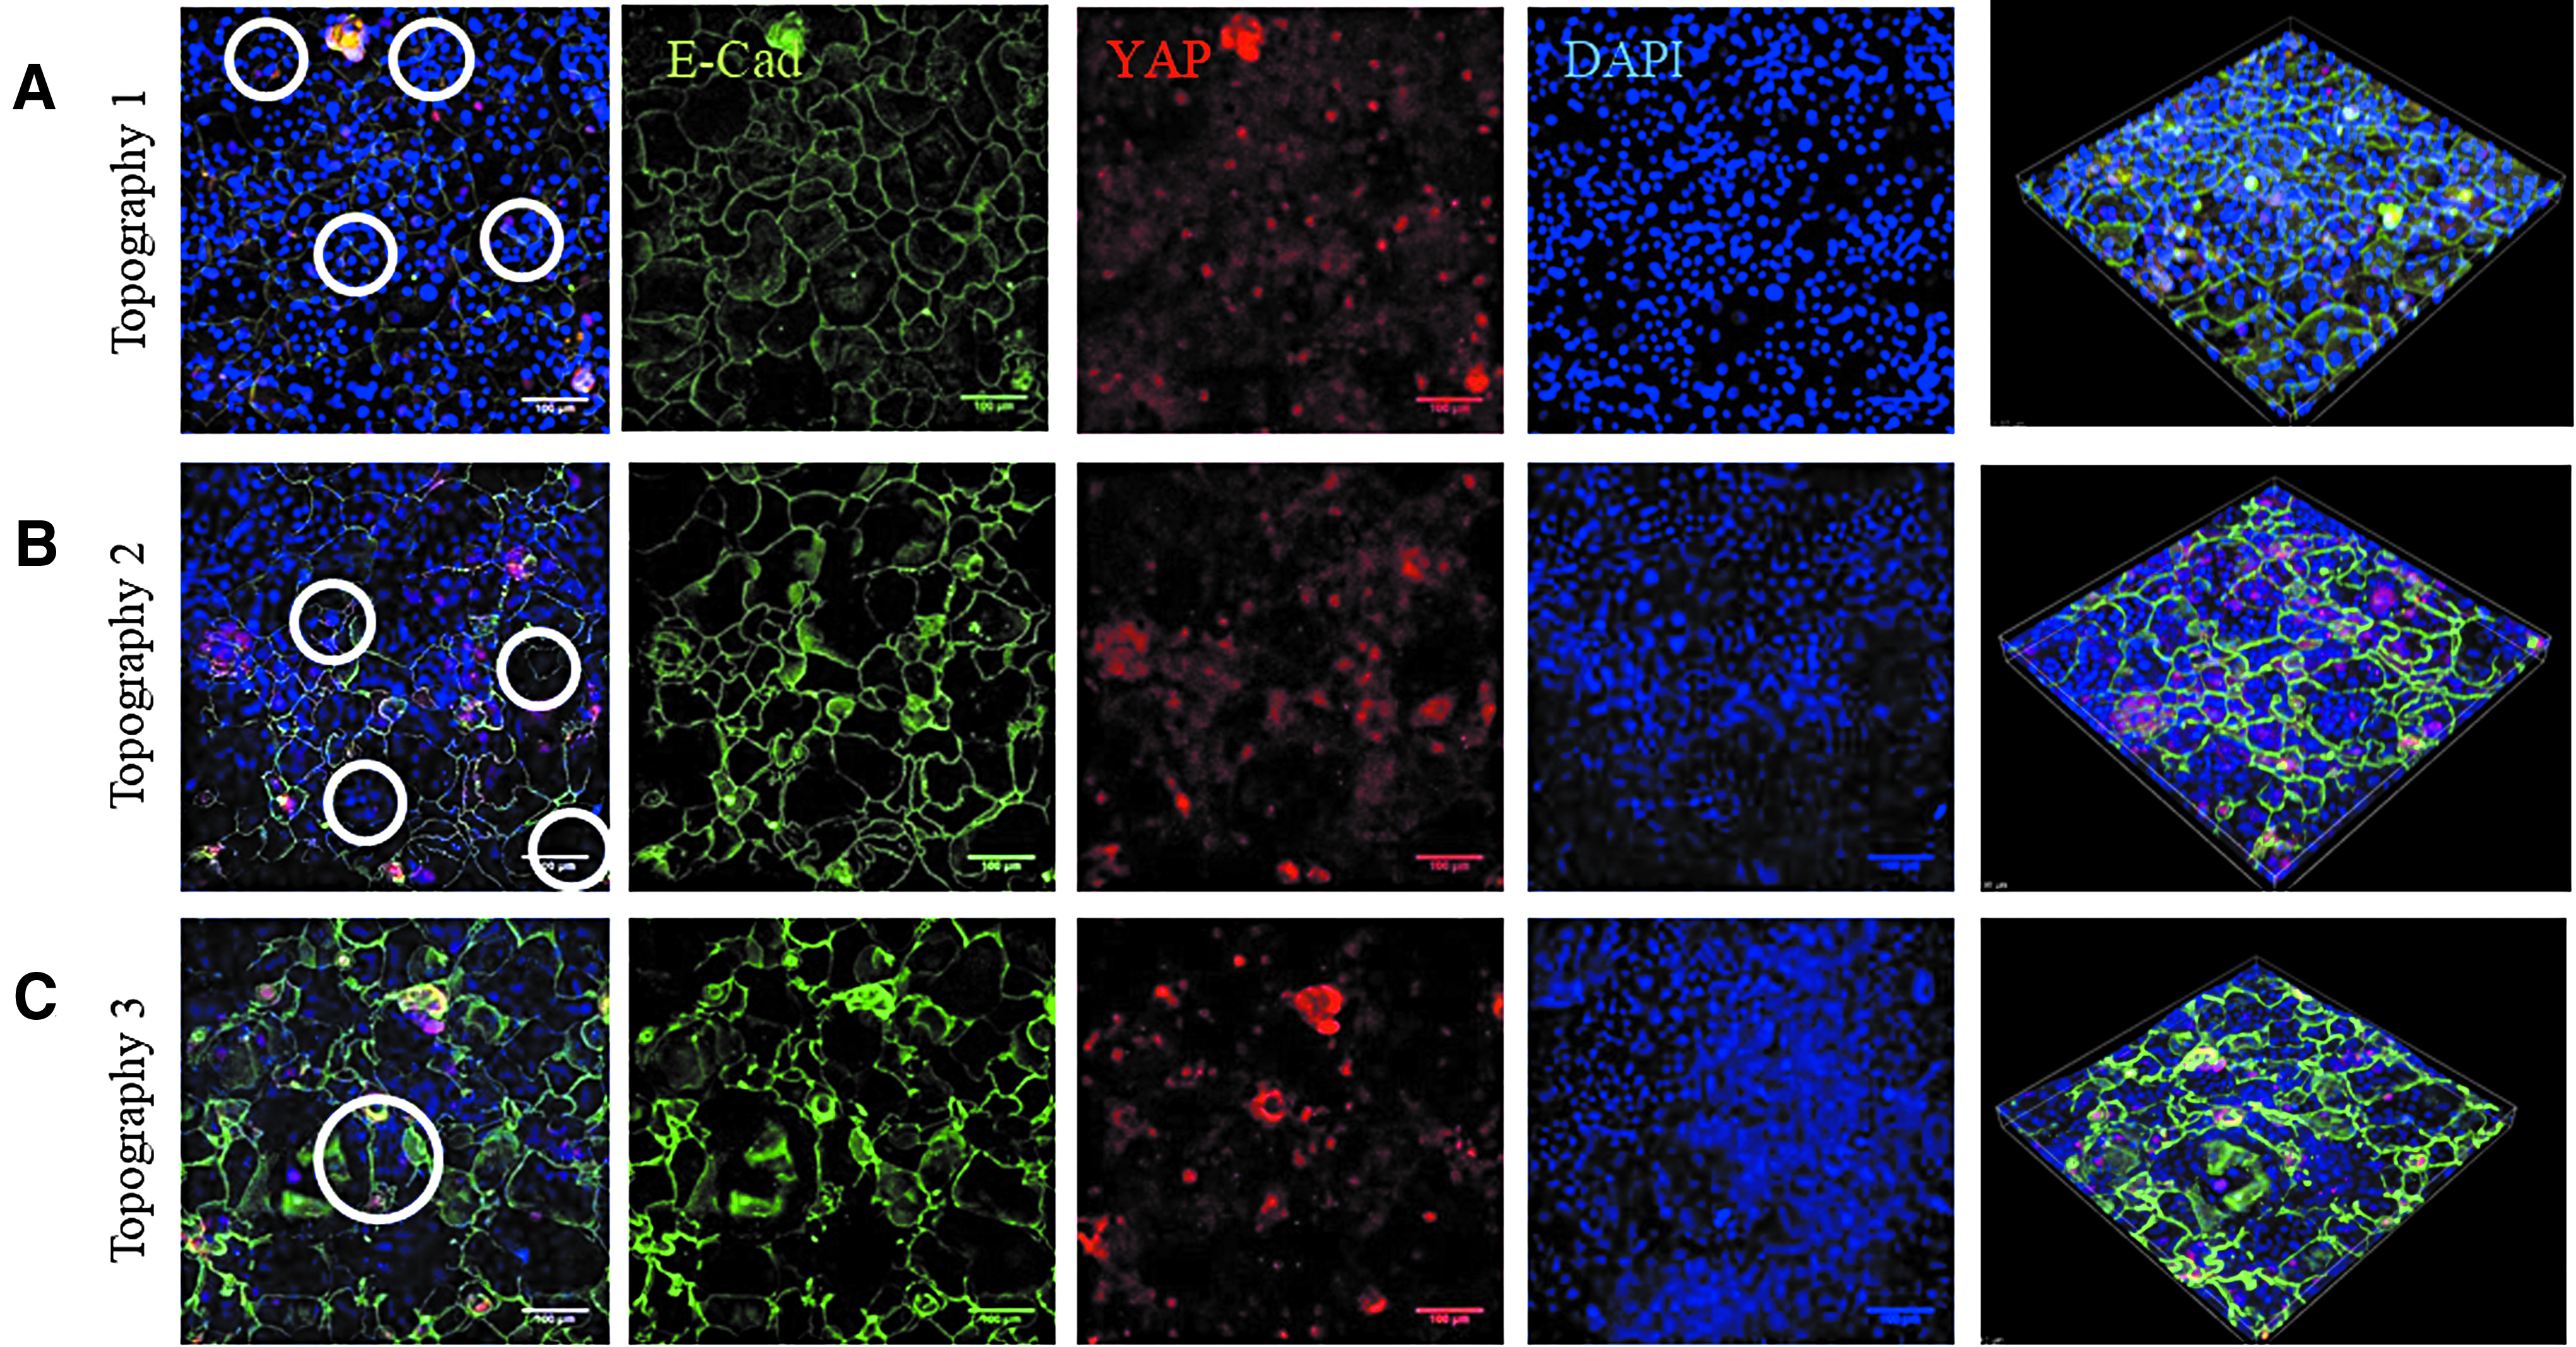
We have previously observed that the YAP/TAZ pathway is activated in stem cell clusters on undulating PDMS topographies, as evidenced by nuclear accumulation of YAP. 23 On the PDMS substrates, YAP activation is dependent on intercellular adhesion and can be prevented by pharmacological inhibition of Rho kinase. This prompted us to examine the localization of E-cadherin and YAP in cells on the dynamic substrates (Fig. 7).
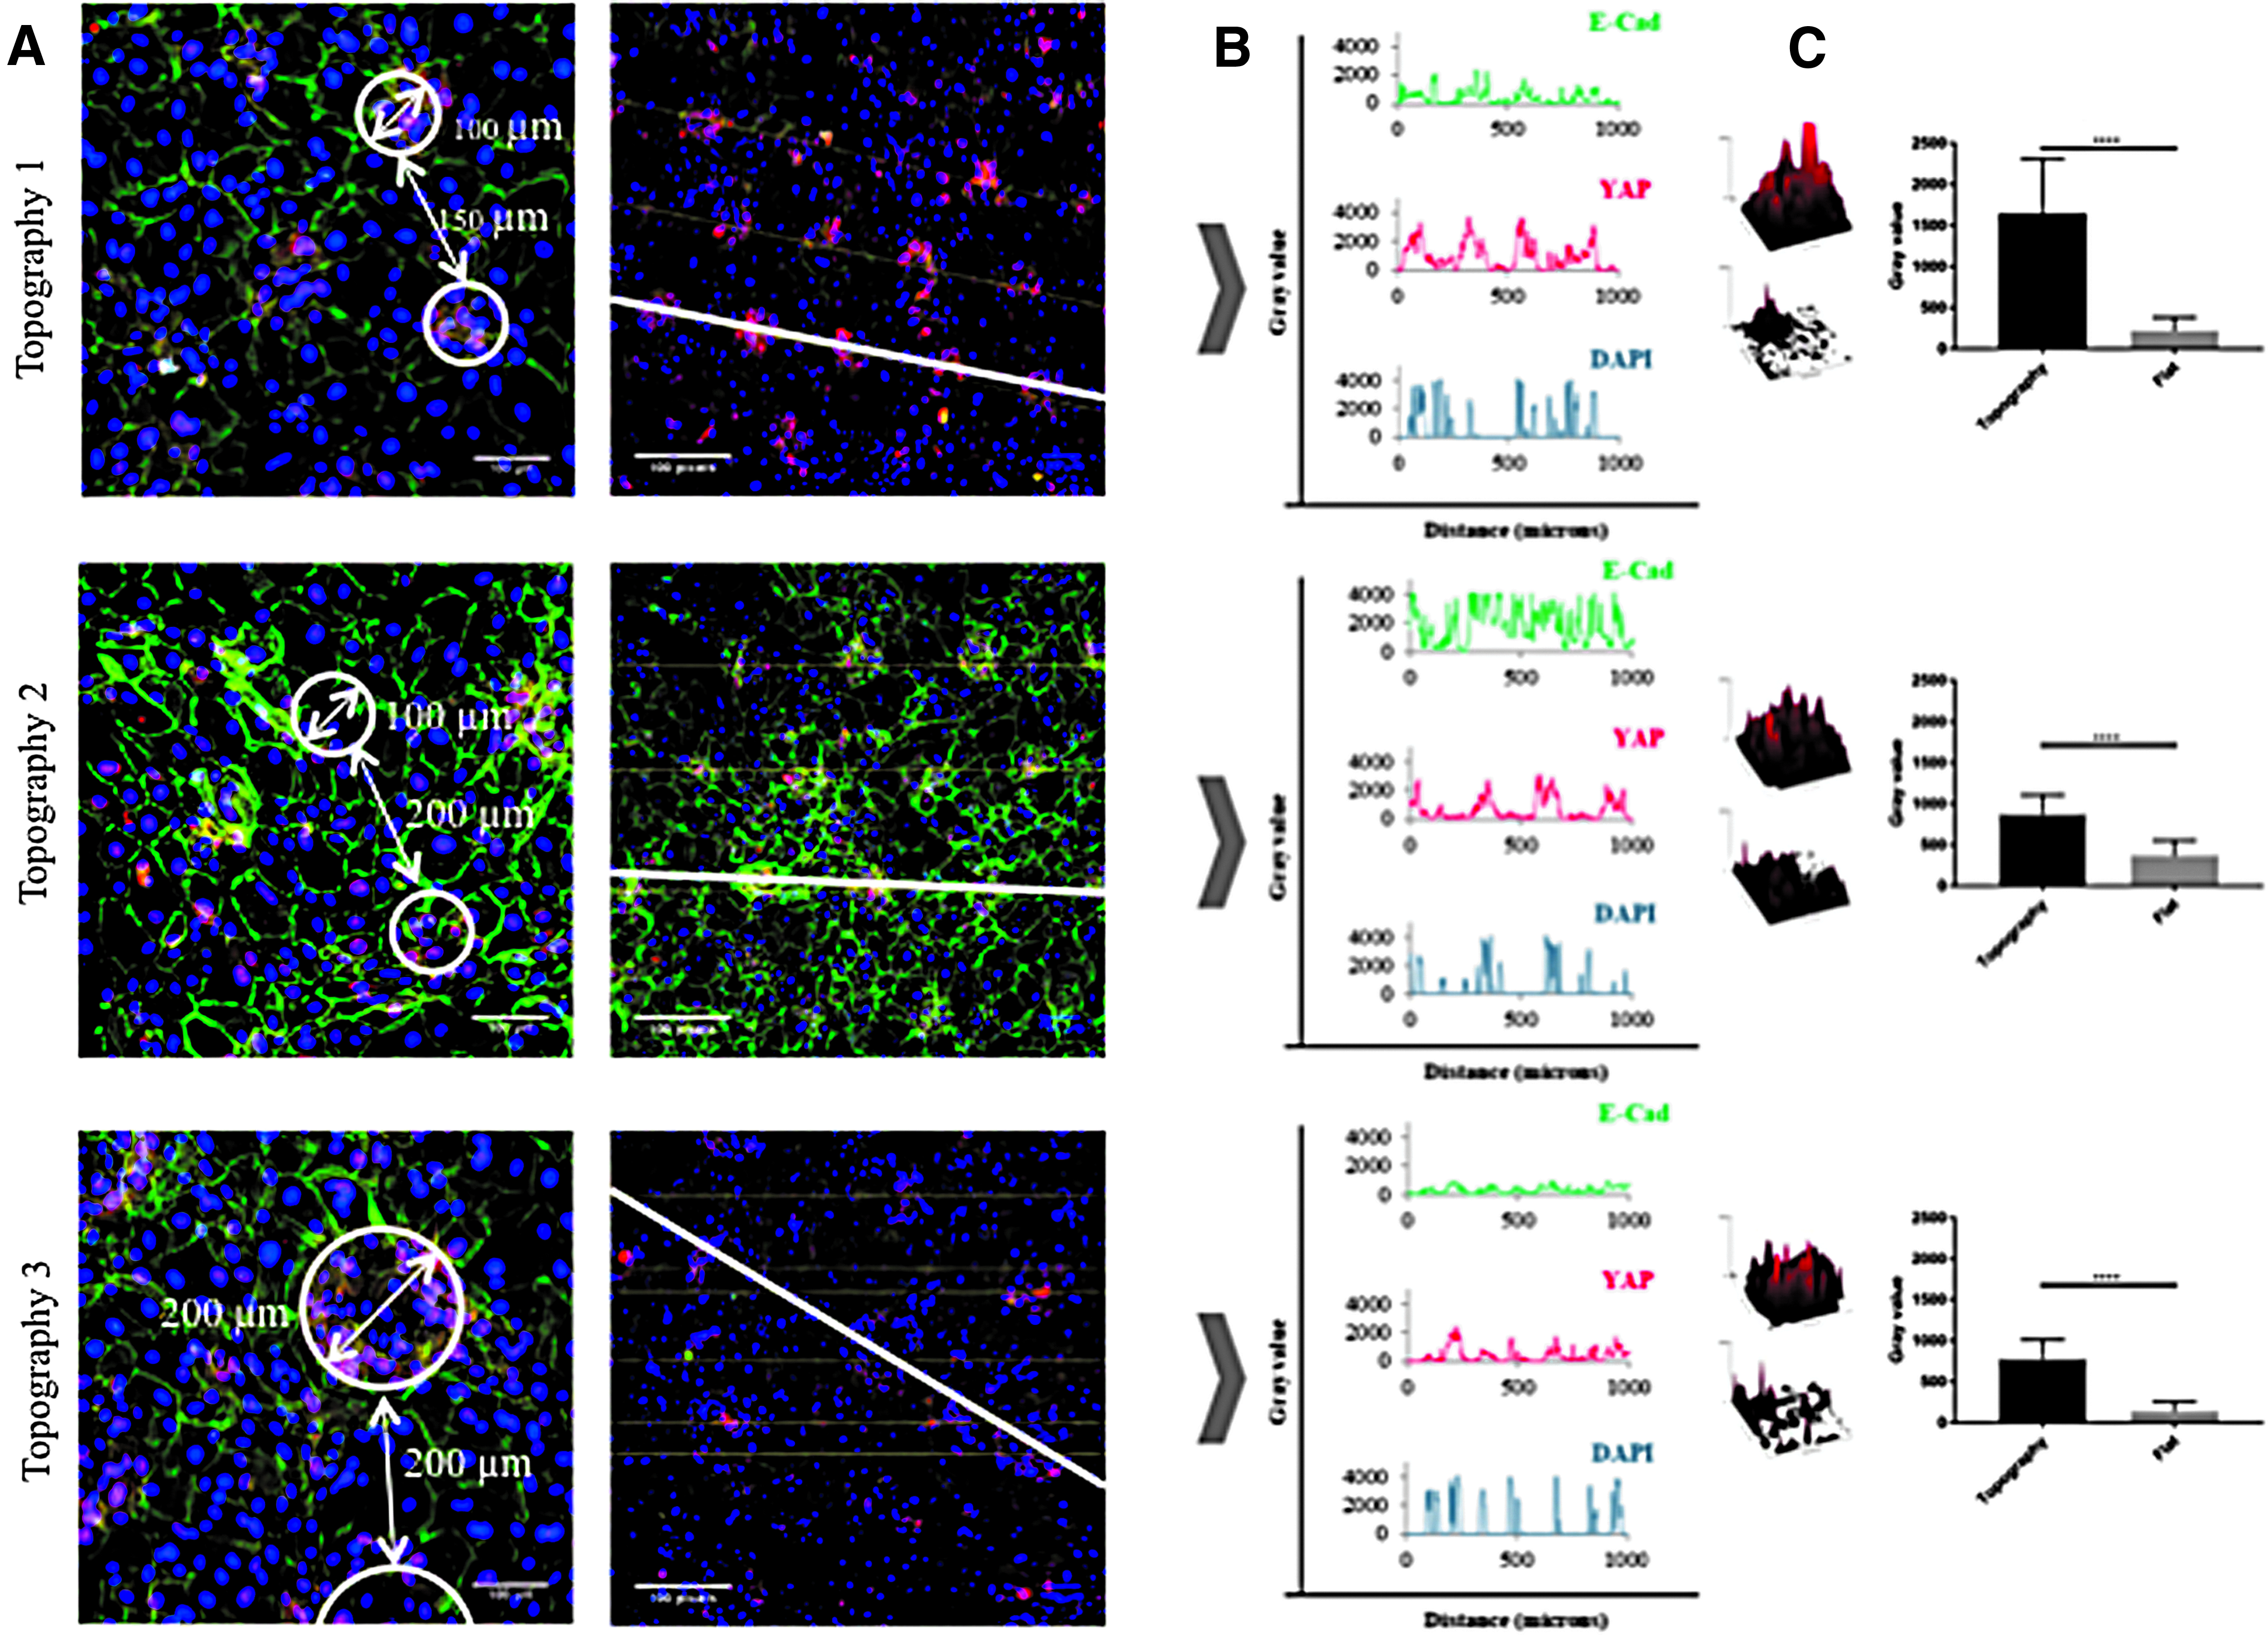
Effect of topographies on YAP and E-cadherin expression after culture under vacuum for 48 h. Cells were fixed and labelled with antibodies to YAP (red), E-cadherin (green), and DAPI as a nuclear counterstain (blue).
Immunostaining showed that in the indentations of all three topographies, YAP localized to the cell nucleus, whereas elsewhere most cells had cytoplasmic YAP (Fig. 7A). As in the case of β1 integrin-bright cells (Fig. 6), the cells with nuclear YAP on Topography 3 formed a ring at the periphery of each feature (Fig. 7A). E-Cadherin immunostaining was clustered in the invaginations on the topographies (Fig. 7A, B). On all three topographies the fluorescence intensity of YAP in the indentations was significantly higher than in the flat regions (Fig. 6C). Treatment with the Rho kinase inhibitor Y-27632 (Enzo ALX-270-333; 10 μM) at the start of application of vacuum pressure prevented the patterning of E-cadherin and nuclear YAP on all three topographies (Fig. 8).
Effect of Rho kinase inhibition on YAP and E-Cadherin expression. Representative images of topographies 1
Discussion
In this study we describe the creation of a rig in which dynamic undulations of the epidermal–dermal junction can be created as a platform to study changes in the skin with age and disease. It was first reported over 20 years ago that stem cells in adult human epidermis are patterned with respect to the undulations of the epidermal–dermal junction. 24 However, until recently the underlying mechanisms were unclear. The clustering of integrin-bright keratinocytes on the tips of PDMS substrates that mimic the topography of healthy young skin (feature diameter of 150 μm and center-to-center distance of 100 μm) 18 indicated that clustering is not dependent on the presence of other cell types, such as fibroblasts or vascular endothelial cells. This is also consistent with the finding that keratinocytes can spontaneously organize into clusters when cultured on a flat substrate. 24 We have also shown that clustering is dependent on intercellular adhesion and can be disrupted by inhibiting Rho kinase signaling or the nonmuscle myosin II inhibitor Blebbistatin. 23
Our observations with the dynamic rig are largely consistent with the earlier studies on static PDMS substrates, 18 specifically that clustering can be achieved based on topography and that it is dependent on Rho kinase activity. However, it also provides new insights into the process. First, we show that topographical features can impose patterning on a flat sheet of cells and that the reorganization occurs within 48 h. Second, although in vivo lineage tracing in mouse skin has established that differentiating cells tend to be the progeny of basal layer cells that lie directly beneath them, 25 we found that stem cell clustering can be induced independent of the location of differentiating involucrin-positive cells. This is consistent with the finding that differentiating cells can move relative to underlying basal cells, for example during wound healing.26–28
One surprising finding was that integrin-bright clusters formed in the indentations, rather than the tips, of the features of dynamic substrates. This is the opposite orientation to that found on static topographies. 18 However, it is in agreement with the observation that in some body sites stem cells are located in the rete ridges.24,29 While further work is required to uncover the underlying mechanisms, one interpretation of our findings is that it is the undulations rather than their direction that is important in determining stem cell patterning. Forces exerted through intercellular adhesion may differ according to the slope of the undulations. A further possibility is that patterning of stem cells depends on whether they are seeded directly onto an undulating surface 18 or whether undulations are imposed on a flat cell sheet. This is an interesting possibility in situations in which epidermal–dermal topology changes over time, for example, in the development of psoriatic lesions. 6
We observed that on Topography 3, which has the largest diameter holes, the integrin bright cells with nuclear YAP formed a rig at the edge of the holes rather than being uniformly distributed. This suggests that local forces at the edge of the features are most important and correlate with the organization of intercellular adhesions.30–32 Crowding in the epidermal basal layer is known to affect cell shape and play a role in triggering exit into the suprabasal layer through a decrease in cortical tension and increased cell–cell adhesion. 30 We envision that future modifications to the rig to allow live imaging may reveal whether or not the cells in the center of Topography 3 are more likely to differentiate than cells are the periphery. 23
In conclusion, we have designed, developed, and optimized a novel device that provides a better understanding of how stem cell behavior is influenced by the topography of the epidermal–dermal junction. The strength of the design is that it imposes dynamic changes in topography. The specific regions where stem cells are located can be controlled in a dynamic model that allows us to simultaneously mimic different topographical features by applying vacuum pressure through a rig.
Footnotes
Acknowledgments
The authors are very grateful to the following people for their assistance: Dr. Katie Bardsley from the Institute for Science and Technology in Medicine, Keele University; Dave Pearsall from the Workshop of the Royal Stoke University Hospital; Dr. Nadeem Rizvi from Laser Micromachining Ltd; and William Luckhurst and Luke Barton from the Physics Department of King's College London. F.M.W. is very grateful to the BBSRC (grant no. BB/M007219/1), MRC (MR/K026666/1), UKRMP (MR/K026666/1), and Wellcome Trust (096540/Z/11/Z) for funding.
Data Availability
The raw/processed data required to reproduce these findings cannot be shared at this time due to technical or time limitations.
Disclosure Statement
No competing financial interests exist.
References
Supplementary Material
Please find the following supplemental material available below.
For Open Access articles published under a Creative Commons License, all supplemental material carries the same license as the article it is associated with.
For non-Open Access articles published, all supplemental material carries a non-exclusive license, and permission requests for re-use of supplemental material or any part of supplemental material shall be sent directly to the copyright owner as specified in the copyright notice associated with the article.