
Abstract
Abstract
The main sources of information about climate change cited in this article are characterized by a close to unanimous agreement about their contents not only within the international scientific community but also within the community of the nations whose political representatives have to approve them together with scientists. These sources are accessible both by scientists who have a background in natural and applied science, and by policy makers—professionals whose expertise is in fields other than natural and applied sciences. These sources are a good starting point for everyone wishing to be reliably informed about the reported subjects. The main issues related to the changing climate system are summarized with comments that underline the known feedback, their consequences, and the growing discussions about them inside the international scientific community. Also discussed are scientists' efforts to properly and effectively inform policy makers and to help to design feasible mitigation strategies that make sense, could be accepted by the public, and could achieve results. The main sources of anthropogenic greenhouse gases emission are briefly described and the importance of the transition to an economy based on renewable energies and recycling is underlined. Two cases are included to show how the humanities, social sciences, and the arts could proactively work with natural and applied sciences, local communities, and society at large to imagine, plan, and build effective solutions. This article aims to be a primer on communication among different disciplines that have different competencies and roles and which could be an effective way to enlist citizen participation and commitment to build a sustainable future.
Introduction
This article, which reviews current research on climate change, is aimed at non-scientists, scholars, and students, as well as scientists whose fields are not directly involved in the study of climate change. This overview is meant to contribute to increasing environmental knowledge and awareness in as comprehensible a way as possible, with an eye toward filling the current gap between science and society, science and humanities, and science and the arts. The integration of these worlds of knowledge seems critically low; in the present period, however, it should be considered essential in the face of the environmental, demographic, social, and economical crises in the near future. Given the huge wealth of information, the overall consensus suggests a needed strategy for climate change mitigation. The strong connection between the fields of natural and applied sciences and social sciences, humanities, and the arts opens a dialogue for discussing the problems and issues across disciplines. Crossing the borders of one's field of knowledge and daring to approach the contents of another can lead to the creation of unexpected and sustainable ways to creatively work toward improving our uncertain future.
Reliable sources have been selected herein to offer the most useful tools to acquire and sift through the relevant information about the main known elements that comprise the big picture of our warming climate system as a whole. These sources can be used to enable critical reflection and autonomous judgment, increasing readers' capability for evaluating a broad range of information. The point of view is neither specialized nor generic; rather, it proposes an integrated approach to a complexity of subjects, none of which can be disregarded or undervalued in a field in which new issues are discovered every year.
The Climate Is Changing and the Atmosphere, the Land Surface, and the Oceans Are Warming
The main actors promoting studies, discussions, and agreements about climate can be considered the United Nations (UN), 1 the most internationally represented intergovernmental organization, and some of its affiliates like the World Meteorological Organization (WMO). 2 The WMO is a specialized agency that publishes and distributes the conclusions of the most authoritative studies on the state and behavior of the Earth's atmosphere and its interaction with land, oceans, weather, and climate. The United Nations Environment Programme (UNEP), 3 also an agency of United Nations, coordinates the environmental activities of the organization.
In 1988, UNEP and WMO established the Intergovernmental Panel on Climate Change (IPCC), 4 whose mission is to provide the world with a clear scientific view on the current state of knowledge regarding climate change and its potential environmental and socioeconomic impacts, and to provide rigorous and balanced scientific information to decision makers. It must be emphasized that “governments participate in the review process and the plenary sessions, where main decisions about the IPCC work programme are taken and reports are accepted, adopted and approved.” 5 The IPCC guarantees a very thorough assessment and a strong commitment to effective communication, especially between scientists and decision makers. Each one of the three organizations (WMO, UNEP, and IPCC) provides a webpage where its publications can be downloaded for free.6–8
The WMO Statement on the State of the Global Climate
9
is of special interest because it is very concise and readable. It is published annually, with updated information on climate summarized and presented in graphical and textual format, including clear commentary. The WMO annual reports are also a good starting point for foundational information about the subject. The 2017 report,
10
for example, explains the following:
The global temperature is increasing. This increase is consistent with other changes in the climate system. Carbon dioxide concentration in the atmosphere is increasing. The influence of human activities on the climate system is becoming more and more evident.
The IPCC reports are designed to be understood by both scientists and policy makers. The report content must be approved by all the members of the panel, and the organization's writing and review process is extremely complex and detailed. 11 In general, the reports are lengthy, but include summaries that allow a quick review of the main points, conclusions, and scientific findings, as well as a detailed study and discussion of the supporting research and its results. IPCC recently published its Fifth Assessment Report 12 in four volumes, one for each of the three Working Groups of the IPCC, plus a Synthesis Report. 13
The IPCC Working Group I (WG I) works on the physical scientific aspects of climate and climate change.
14
The WG II takes a global
15
and a regional
16
point of view to work on the vulnerability and needed adaptation of socioeconomic and natural systems to climate change and its consequences. The focus of WG III is on the options for mitigating climate change by limiting or preventing greenhouse gas emissions and by removing them from the atmosphere.
17
The
The IPCC Fifth Assessment Report as a whole13–17 offers an extremely concise, readable, and operational summary of a detailed report that assesses the most advanced research and its results. This report states that:
Global warming, since the 1950s, is unequivocal and unprecedented over decades to millennia and is characterized by the fact that almost the entire globe has experienced and is experiencing surface warming.
Anthropogenic greenhouse gas emissions have increased since the pre-industrial era—from 2000 to 2010 emissions were the highest in history.
The atmospheric concentrations of greenhouse gases are unprecedented in the last 800,000 years and are extremely likely to have been the dominant cause of the observed warming.
Between 1880 and 2012, the globally-averaged combined land and ocean surface temperature shows a warming trend of 0.85°C per decade.
The ocean temperatures are of special significance because they are strongly associated with the whole Earth's energy imbalance. Ocean warming accounts for more than 90 percent of the energy accumulated by the Earth's climate system between 1971 and 2010 (only about 1 percent is stored in the atmosphere). The upper 75 meters of the ocean has warmed by 0.11°C per decade over the same period.
Greenhouse Effect and Greenhouse Gases
A greenhouse is a heat trap that allows the temperature inside the greenhouse to be greater than that of the external environment:
Visible light enters the greenhouse and a fraction of it is absorbed by the internal environment, causing a rise in temperature.
A fraction of the absorbed energy is emitted again as thermal infrared radiation.
Infrared radiation cannot escape through the covering material and contributes to the further warming of the internal environment by radiative transfer.
The same covering material also prevents convective cooling.
Convective cooling can be controlled opening windows and/or doors, or removing the covering material.
The Earth's climate system is powered by the sun. Approximately 50 percent of the solar radiation reaching the Earth is visible light. About half of this energy is absorbed by the Earth's surface; approximately 30 percent is reflected to space by aerosols, clouds, and the Earth's surface; and about 20 percent is absorbed in the atmosphere. The Earth's surface emits an outgoing energy flux, mainly as infrared radiation, which is partially absorbed by clouds and by components of the atmosphere that are defined as greenhouse gases (GHGs) and consist of: water vapor (H2O), carbon dioxide (CO2), methane (CH4), nitrous oxide (N2O), and chlorofluorocarbons. In turn, these gases emit infrared radiation in all directions, adding heat to the lower layers of the atmosphere and to the Earth's surface. This is called greenhouse effect. 18
In 2011 the recorded atmospheric concentrations of carbon dioxide, methane, and nitrous oxide were all shown to have increased since the pre-industrial era (reference year 1750) by about 40 percent, 150 percent, and 20 percent, respectively. Their concentrations in 2011 were greater than the highest concentrations recorded in ice cores over the past 800,000 years. 19 In 2016, globally-averaged surface concentration of carbon dioxide, methane, and nitrous oxide reached 403.3 parts per million (ppm), 1,853 parts per billion (ppb), and 328.9 ppb, respectively, corresponding to 145 percent, 257 percent, and 122 percent of pre-industrial levels. 20 Radiative Forcing (RF) is the imbalance of energy flowing in and out of the Earth's atmosphere, and is measured in watt per square metre (W/m2). It is a useful measure for comparing the drivers of global mean surface temperature affecting the Earth's energy flux. Relative to 1750, industrial era RF for carbon dioxide alone 10 is 1.82 W/m2. The evolution of the total anthropogenic RF from the pre-industrial era to the present shows a nearly continuous increase, with a much greater rate of increase since 1960, corresponding to the increase in anthropogenic greenhouse gas concentrations, with carbon dioxide acting as the largest single contributor.
The Global Monitoring Division of the Earth System Research Laboratory of the National Oceanic and Atmospheric Administration (NOAA) publishes online, updated each spring, values of RF and of a related index called Annual Greenhouse Gas Index (AGGI). 21 AGGI is defined as the ratio between the total direct RF due to long-lived greenhouse gases for any year and the RF of 1990 (the baseline year for the Kyoto Protocol).
For 2016 the AGGI was 1.40, an increase in total direct RF of 40 percent since 1990, with nearly 54 percent due to CO2.
From 1990 to 2015, radiative forcing by long-lived greenhouse gases increased by 37 percent, with CO2 accounting for about 80 percent of this increase. For 2017, the AGGI was 1.41, with nearly 56 percent due to CO2.
To evaluate and compare the impact of the different substances on our climate system, metrics other than RF and AGGI are also widely used: Global Warming Potential (GWP) and Global Temperature change Potential (GTP). Global Warming Potential (GWP) takes into account not only the Radiative Forcing of a certain substance, but also its lifetime in the atmosphere, and can be considered a measure of its radiative efficiency with reference to a particular time horizon. GWP gives values relative to those for the reference gas CO2. Global Temperature change Potential (GTP) also considers the climate response to a certain substance. It is based on the change in Global Medium Surface Temperature at a chosen point in time, relative to that caused by the reference gas CO2.
According to the IPCC, the values shown in Table 1 can be used as an updated reference. 13 Among other things, they show that methane, over 100 years, has Global Warming Potential that is 28 times the GWP of CO2 and a Global Temperature change Potential that is four times the GTP of CO2.
Global Warming Potential (GWP) and Global Temperature Change Potential (GTP) of the More Relevant Greenhouse Gases *
(GHGs): Reported values are relative to CO2.
Greenhouse gases warm the troposphere (the region of the atmosphere from the Earth's surface to an altitude of about 9 km at high latitudes and to 16 km in the tropics), and cool the stratosphere (the region of the atmosphere above the troposphere, to an altitude of about 50 km). Ozone (O3) is a more complex actor in this process. In the troposphere—where it is created both naturally and by photochemical reactions of oxygen with methane, carbon monoxide, volatile organics, and nitrogen oxides—ozone acts as a greenhouse gas. It also has a detrimental impact on vegetation physiology and therefore on CO2 uptake of all plant life. In the stratosphere, where ozone is the product of interaction between solar ultraviolet radiation and molecular oxygen (O2), it plays a prominent role in warming the stratosphere itself. 22
Ozone concentrations are highest in the so-called ozone layer, which extends from about 12 to 40 km above the Earth's surface. The ozone layer has been depleted by human emissions of chlorine and bromine compounds, and this depletion decreases the stratosphere warming, especially in the polar regions (ozone hole) and is expected to cause cooler Antarctic surface temperatures.
Glaciers, Snow Cover, Sea Ice, Ice Caps, and Ice Sheets
Over the past three decades, Arctic summer sea ice retreat has been unprecedented, and sea surface temperatures have been anomalously high, measured against the norms of at least the last 1,450 years. The extent of Northern Hemisphere snow cover has decreased and permafrost temperatures have increased in most regions. In parts of the Russian European North, a considerable reduction in both the thickness and areal extent of the permafrost has been observed. Following a very substantial Arctic region warming, the areal extent of Arctic sea ice decreased at a rate of 3.5 to 4.1 percent per decade. The annual period of surface melt on Arctic perennial sea ice lengthened by 5.7 days per decade, and in the region between the East Siberian Sea and the western Beaufort Sea, the duration of ice-free conditions increased by nearly three months. 23 The Arctic ice retreat could accelerate even faster because further reductions in seasonal ice cover will result in larger waves, which in turn provide a mechanism for breaking up the sea ice. 24
On the other hand, the annual areal Antarctic sea ice has increased at a rate of between 1.2 and 1.8 percent per decade, but with strong regional differences in the rate and in the length of the ice-free season. The Antarctic ice sheet has been losing ice over the last two decades, mainly from the northern Antarctic Peninsula and the Amundsen Sea sector of West Antarctica, due to the acceleration of outlet glaciers. 23 This acceleration has been widely observed where glaciers are melting and is thought to depend on a mechanism of lubrication that was first observed on Alpine glaciers. 25 When it cools, liquid water becomes more dense until reaching 3.98°C. Between 3.98°C and 0°C, the density decreases with decreasing temperature. Therefore a convective movement can start in a melting pond, carrying the denser and warmer (near 3.98°C) water to where it can act to melt the ice on the bottom where it cools (near 0°C), becomes less dense, and together with the water from the just-melted ice, is carried upward by the convective flow. A moulin can form that can reach the bedrock and lubricate the glacial flow.
According to Zwally et al. 26 this kind of lubrication can accelerate ice flow during the periods of summer melting and decelerate it after the melting ceases, with interannual variations in the ice acceleration correlated to variations in the intensity of the surface melting.
Rignot and Kanagaratnam 27 using satellite radar interferometry observations of Greenland observed expanding glacier acceleration that in the east doubled the loss of ice sheet mass between 1996 and 2005, indicating that the contribution of Greenland to sea-level rise could continue to increase more than expected given the growing number of accelerating glaciers. According to models by Shannon et al., 28 however, the lubrication modifies the flow and form of the ice sheet, but should not substantially affect net mass loss because increase to sea-level rise from basal lubrication by all their models is no more than 5 percent of the contribution from surface mass alone.
Overall, there is general agreement about the following:
The Greenland ice sheet has lost ice during the last two decades and the loss of mass has accelerated since 1992 at an average rate that has increased from 34 Gt (billions tons) per year over the period between 1992 and 2001, to 215 Gt per year over the period between 2002 and 2011, corresponding to a contribution to sea-level increase that passed from 0.09 mm to 0.59 mm per year. 23
Almost all glaciers worldwide are persistently shrinking, with measured changes in glacier length, area, volume, and mass.
Satellite data about snow cover show decreases through the year between 1967 and 2012 especially in June (53%) and stations usually report decreases especially in spring.
Permafrost and Circumpolar Lakes
A special attention must be paid to permafrost thawing
Ground that remains at or below 0°C for at least two consecutive years is called permafrost and can be located beneath the land surface (terrestrial permafrost) or beneath the seafloor (subsea permafrost). Permafrost is characterized by high quantities of organic matter and by the methane and carbon dioxide that are trapped in it as metastable gas hydrates. 29
Terrestrial permafrost temperatures have increased in most regions since the early 1980s (up to 3°C in parts of Northern Alaska and up to 2°C in parts of the Russian European North, where a considerable reduction in permafrost thickness and areal extent has been observed, with surface subsidence occurring at many locations). These increases are attributable to increased air temperature and to changes in the timing and thickness of snow cover. By the end of the 21st century, the area of permafrost near the surface (upper 3.5 m) is projected to decrease by more than 35 percent. 19
The release of CO2 or CH4 to the atmosphere from thawing permafrost thus far in the 21st century is assessed to be more than 50 Gigatons of carbon (GtC). Reservoirs of carbon in hydrates and permafrost are very large and could potentially act as very powerful feedbacks, enhancing the global greenhouse effect.19,30 In addition, in a warming climate, permafrost thawing may induce further decomposition of carbon accumulated in frozen soils, leading to a further increase of atmospheric carbon dioxide and methane concentrations. 19
Methane release is expected also from warming circumpolar lakes31,32 and from subsea permafrost through the undersaturated state of the ocean, the long ventilation time of the ocean, and the slow propagation of warming through the seafloor, could slow methane release. On the other hand the high instability of subsea deposits is a source of concern. However, while ocean warming enhances the instability of these deposits, the sea-level rise due to changes in ocean mass increases the water pressure at the ocean floor enhancing their stability.
In summary, anthropogenic warming will very likely lead to enhanced CH4 emissions from both terrestrial and subsea permafrost if all the information available is taken into account. 19
Warming of the Oceans and Sea Level Rise
Average ocean temperature has changed over the past 40 years and in the period between 1901 and 2010 Global Mean Sea Level (GMSL) rose by 0.19 m. The rate of sea level rise since the mid-19th century has been higher than the mean rate over the previous two millennia. 13 Increases in the volume of ocean water are primarily due to the thermal expansion of the ocean water and the transfer to the ocean of water previously stored on land, particularly from glaciers and ice sheets. Water impoundment in reservoirs and groundwater depletion (and its subsequent runoff to the ocean) also affect sea level.
During the 20th century, the mean rate of sea-level rise was 1.7 mm/yr between 1901 and 2010, a rate that nearly doubled, to 3.2 mm/yr, between 1993 and 2010. By 2300, GMSL rise above the pre-industrial level could be around 1 m, assuming CO2 concentrations are below 500 ppm. 33
By the end of the 21st century, about 70 percent of the coastlines worldwide may experience sea-level change within 20 percent of the global mean. Sea level could rise in more than 95 percent of the ocean area, but it has not been and will not be uniform. For example, since 1993, the regional rates for the Western Pacific Ocean were up to three times larger than the global mean, while those for much of the Eastern Pacific Ocean were near zero or negative. 33 Change in sea level relative to the land (relative sea level) can be significantly different from the global mean sea level change because of variations in the redistribution of water in the ocean and of ice on the land, both of which are related to vertical movement of the land and variations in the Earth's gravitational field. 33 According to Kopp et al. 34 regional sea level will change due to dynamical ocean circulation changes, variations in the heat content of the ocean, mass redistribution in the entire Earth system, and changes in atmospheric pressure.
Ocean dynamical change is caused by variations in wind and buoyancy forcing, and associated changes in the circulation and redistribution of heat and freshwater. Ice sheet mass loss, glacier mass loss, and changes in terrestrial hydrology cause water mass redistribution among the cryosphere, the land, and the oceans, giving rise to regional changes in the solid Earth 35 and the gravity field. In some coastal locations, changes in the hydrological cycle, ground subsidence associated with anthropogenic activity, tectonic processes, and coastal processes can dominate the change in sea surface height relative to the land.
Regional variations in sea level could reach up to 30 percent above the global mean value in the Southern Ocean and around North America, between 10 and 20 percent in equatorial regions, and up to 50 percent below the global mean in the Arctic region and some regions near Antarctica. 34 According to Sweet et al., 36 if recent observational and modeling results about rapid ice melt in Greenland and Antarctica are considered, Global Mean Sea Level rise for year 2100 could be in the range of 2.0 to 2.7 m. This is consistent with recent observations of Antarctic ice-sheet instability.
Tropospheric Water Vapor and Precipitation Change
The saturation vapor pressure of air increases with temperature. Therefore it is expected that the amount of water vapor in air will increase with a warming climate. The observed global change in tropospheric water vapor over the past 40 years is about 3.5 percent, which is consistent with the observed temperature change of about 0.5°C and with the observed oceanic surface salinity. The observed oceanic surface salinity is highly correlated with the difference between evaporation and precipitation and since the 1950s, regions of high salinity (and high evaporation) have increased in salinity while regions of low salinity (and high rainfall) have become fresher. A pattern of evaporation minus precipitation can be inferred and is consistent with the observed increased water vapor content of the warmer air and indicates an increase in global mean precipitation.22,37
The number of heavy precipitation events has generally increased even more than global mean precipitation. In North America and Europe, either the frequency or the intensity of heavy precipitation has increased, with seasonal and regional variations, and trends toward heavier precipitation events have been observed in central North America. Since the 1970s, the frequency and intensity of storms in the North Atlantic have increased.
Mean global-scale precipitation is predicted to gradually increase with warming, but the increase in intensity of extreme precipitation events will be even greater. Changes in average precipitation will not be uniform. High latitude regions will experience greater amounts of precipitation while many mid-latitude and subtropical arid and semi-arid regions will experience less. These changes imply increasing aridity in already dry areas, and possible expansion of deserts. Model projections show rainfall becoming more intense and precipitation events occurring less frequently. Therefore more floods are expected and also more drought due to longer dry periods between rain events.22,37
Currently, several regions are experiencing severe drought crises. Between 1951 and 2010, the number of cold days and nights has decreased and the number of warm days and nights has increased on the global scale; the length and frequency of heat waves have increased in large parts of Europe, Asia, and Australia. The frequency and intensity of droughts have increased in the Mediterranean and West Africa and have decreased in central North America and northwest Australia.22,37
According to Trenberth, Fasullo, and Shepherd, 38 changes in the atmospheric circulation related to climate change can be considered small when compared to natural variability. However, since the climate is changing, the environment in which all weather events occur is different, and this makes all events different (extreme) because they occur in a different, more vulnerable environment and have a different, stronger impact.
Acidification of the Oceans and Biodiversity Loss
The increase of the global atmospheric concentration of carbon dioxide since the pre-industrial era is related to the 26 percent increase in the acidity of the oceans, corresponding to a pH variation from 8.2 to 8.1. By 2100 the average surface ocean pH could be lower than it has been for more than 50 million years.39,40
The solubility of carbon dioxide is higher than the solubility of oxygen and nitrogen, but the dissolution of CO2 in the oceans is a very slow process compared to that of current GHG emissions in the atmosphere. Therefore absorption of CO2 in the oceans cannot be thought as a remedy to its increasing atmospheric concentration. On the contrary, it is a source of major concern, one that has been analyzed, discussed, and summarized in two reports and then updated by the IPCC in the Fifth Assessment Report:
Both publications are available free online.
The following considerations are partly inspired by these two documents.
Carbon dioxide is different from the other main atmospheric gases because it reacts with water, starting a series of reactions in which the following chemical species and the related equilibriums are involved: atmospheric carbon dioxide (CO2(g)) and carbon dioxide in water solution (CO2(aq)); carbonic acid (H2CO3(aq)) as the first product of the reaction between water and CO2(aq); the hydrogen carbonate anion (HCO3-(aq)), which is the product of the first dissociation of carbonic acid, and the carbonate anion (CO32-(aq)), which is the product of its second dissociation.
Under current ocean conditions, bicarbonate is the most abundant form of CO2 dissolved in seawater, followed by carbonate and then by aqueous CO2(aq). There is approximately an order of magnitude difference in abundance between each of the inorganic carbon compounds, with variation dependent on seawater temperature, salinity, and pressure. All three are important for the biological processes of marine organisms, which include acidity buffering, calcification (providing structures such as CaCO3 shells), and photosynthesis by marine algae (mostly phytoplankton).
The increase of atmospheric CO2 concentration results in an increase of seawater acidity (H+ concentration, though buffered, slightly increases) and an increase in total inorganic carbon content in the sea environment, but it is accompanied by a decrease of availability of CO32-(aq) and an increase in the dissolution of solid carbonate CaCO3(s). In these conditions the biological systems—for instance coral—experience rising difficulty in building their skeletons and experience the erosion of their calcium carbonate structures.
Acidification not only reduces the carbonate saturation level of the seawater, making calcification harder and weakening already-formed structures, but also can modify the equilibriums, the concentrations, and the biological availability of chemical elements that are fundamental for metabolism such as magnesium, iron, and manganese.
The ocean's capacity to absorb atmospheric CO2 is inhibited by water acidification, making it more difficult to stabilize atmospheric CO2 concentrations.
Ocean acidification is expected to have major negative impacts on corals and other marine organisms whose success is largely controlled by carbonate chemistry. Many calcifying species are located at the bottom or in the middle of global ocean food webs. Therefore their loss will alter predator-prey relationships and the effects will be transmitted throughout the ecosystem, with the likely disruptions of large components of the marine food web and a loss or change in biodiversity.41,42
Global marine species redistribution and marine biodiversity reduction in sensitive regions will challenge the sustained productivity of fisheries and other ecosystem services, exacerbating the damage of overfishing and undermining food security.
Marine ecosystems are at risk from climate change and often show limited adaptive capacity. They can be damaged not only by ocean acidification and rising water temperature per se, but also by decreased oxygen solubility and, in coastal environments, by sea level rise. 13 A warmer climate may increase hypoxia in sensitive areas due to the combined effects of decreased oxygen solubility and increased respiration rates, which would magnify the negative effects of eutrophication. 43
If eutrophic regions are not considered, CO2 storage by photosynthesis is not expected to increase. Plankton growth could remain roughly unchanged because it is limited mostly by nutrients and light, not by the availability of inorganic carbon. On land, vegetation absorbs CO2 by photosynthesis, but this process is critically dependent on factors such as water and nutrient availability and less on CO2 concentration. 39
A Summary about Positive Feedbacks in Climate Change
The feedbacks in climate change are extensively discussed through the whole Fifth IPCC Report and are treated in depth in
Tropospheric concentration of water vapor is increasing and there is evidence of a positive feedback from the combination of water vapor as a greenhouse gas and lapse rate changes.
The albedo decreases as highly reflective ice and snow surfaces melt, exposing the darker and more absorbing surfaces below, either on the ocean or on the land. In the Arctic, as surface albedo decreases, air temperatures increase, and the ocean can absorb more heat and contribute to further sea ice melting. Furthermore, ice sheets and glaciers show enhanced calving at their margins because the ice flow is accelerated by lubrication. Arctic ice retreat could accelerate because further reductions in seasonal ice cover of the ice sea will result in larger waves, which in turn contribute to breaking up sea ice.
The loss of carbon (as carbon dioxide and methane) from frozen soils and methane hydrates constitutes a further positive radiative feedback. A positive feedback is also caused by the decreasing carbon uptake by the ocean because of lower CO2 solubility in a more acidic and warmer sea water. Climate models also indicate that less carbon is absorbed by land as the atmosphere warms because on land, longer seasonal growth periods in temperate and higher latitudes are coupled with faster respiration of soil carbon.
The elucidation of these feedbacks by the international scientific community and the growing awareness of their role in accelerating the observable and predicted consequences of climate change, both in the short term and long term, could explain the trend that can be observed in the graph shown in Figure 1. The steep rise in the number of scientific publications per year during the second half of the first decade of the 2000s may indicate a corresponding growing awareness of the pressing need to mitigate climate change if the accelerating feedbacks are considered, and may be related to the commitment that can be perceived reading the Paris Agreement and the corresponding adoption document. 44
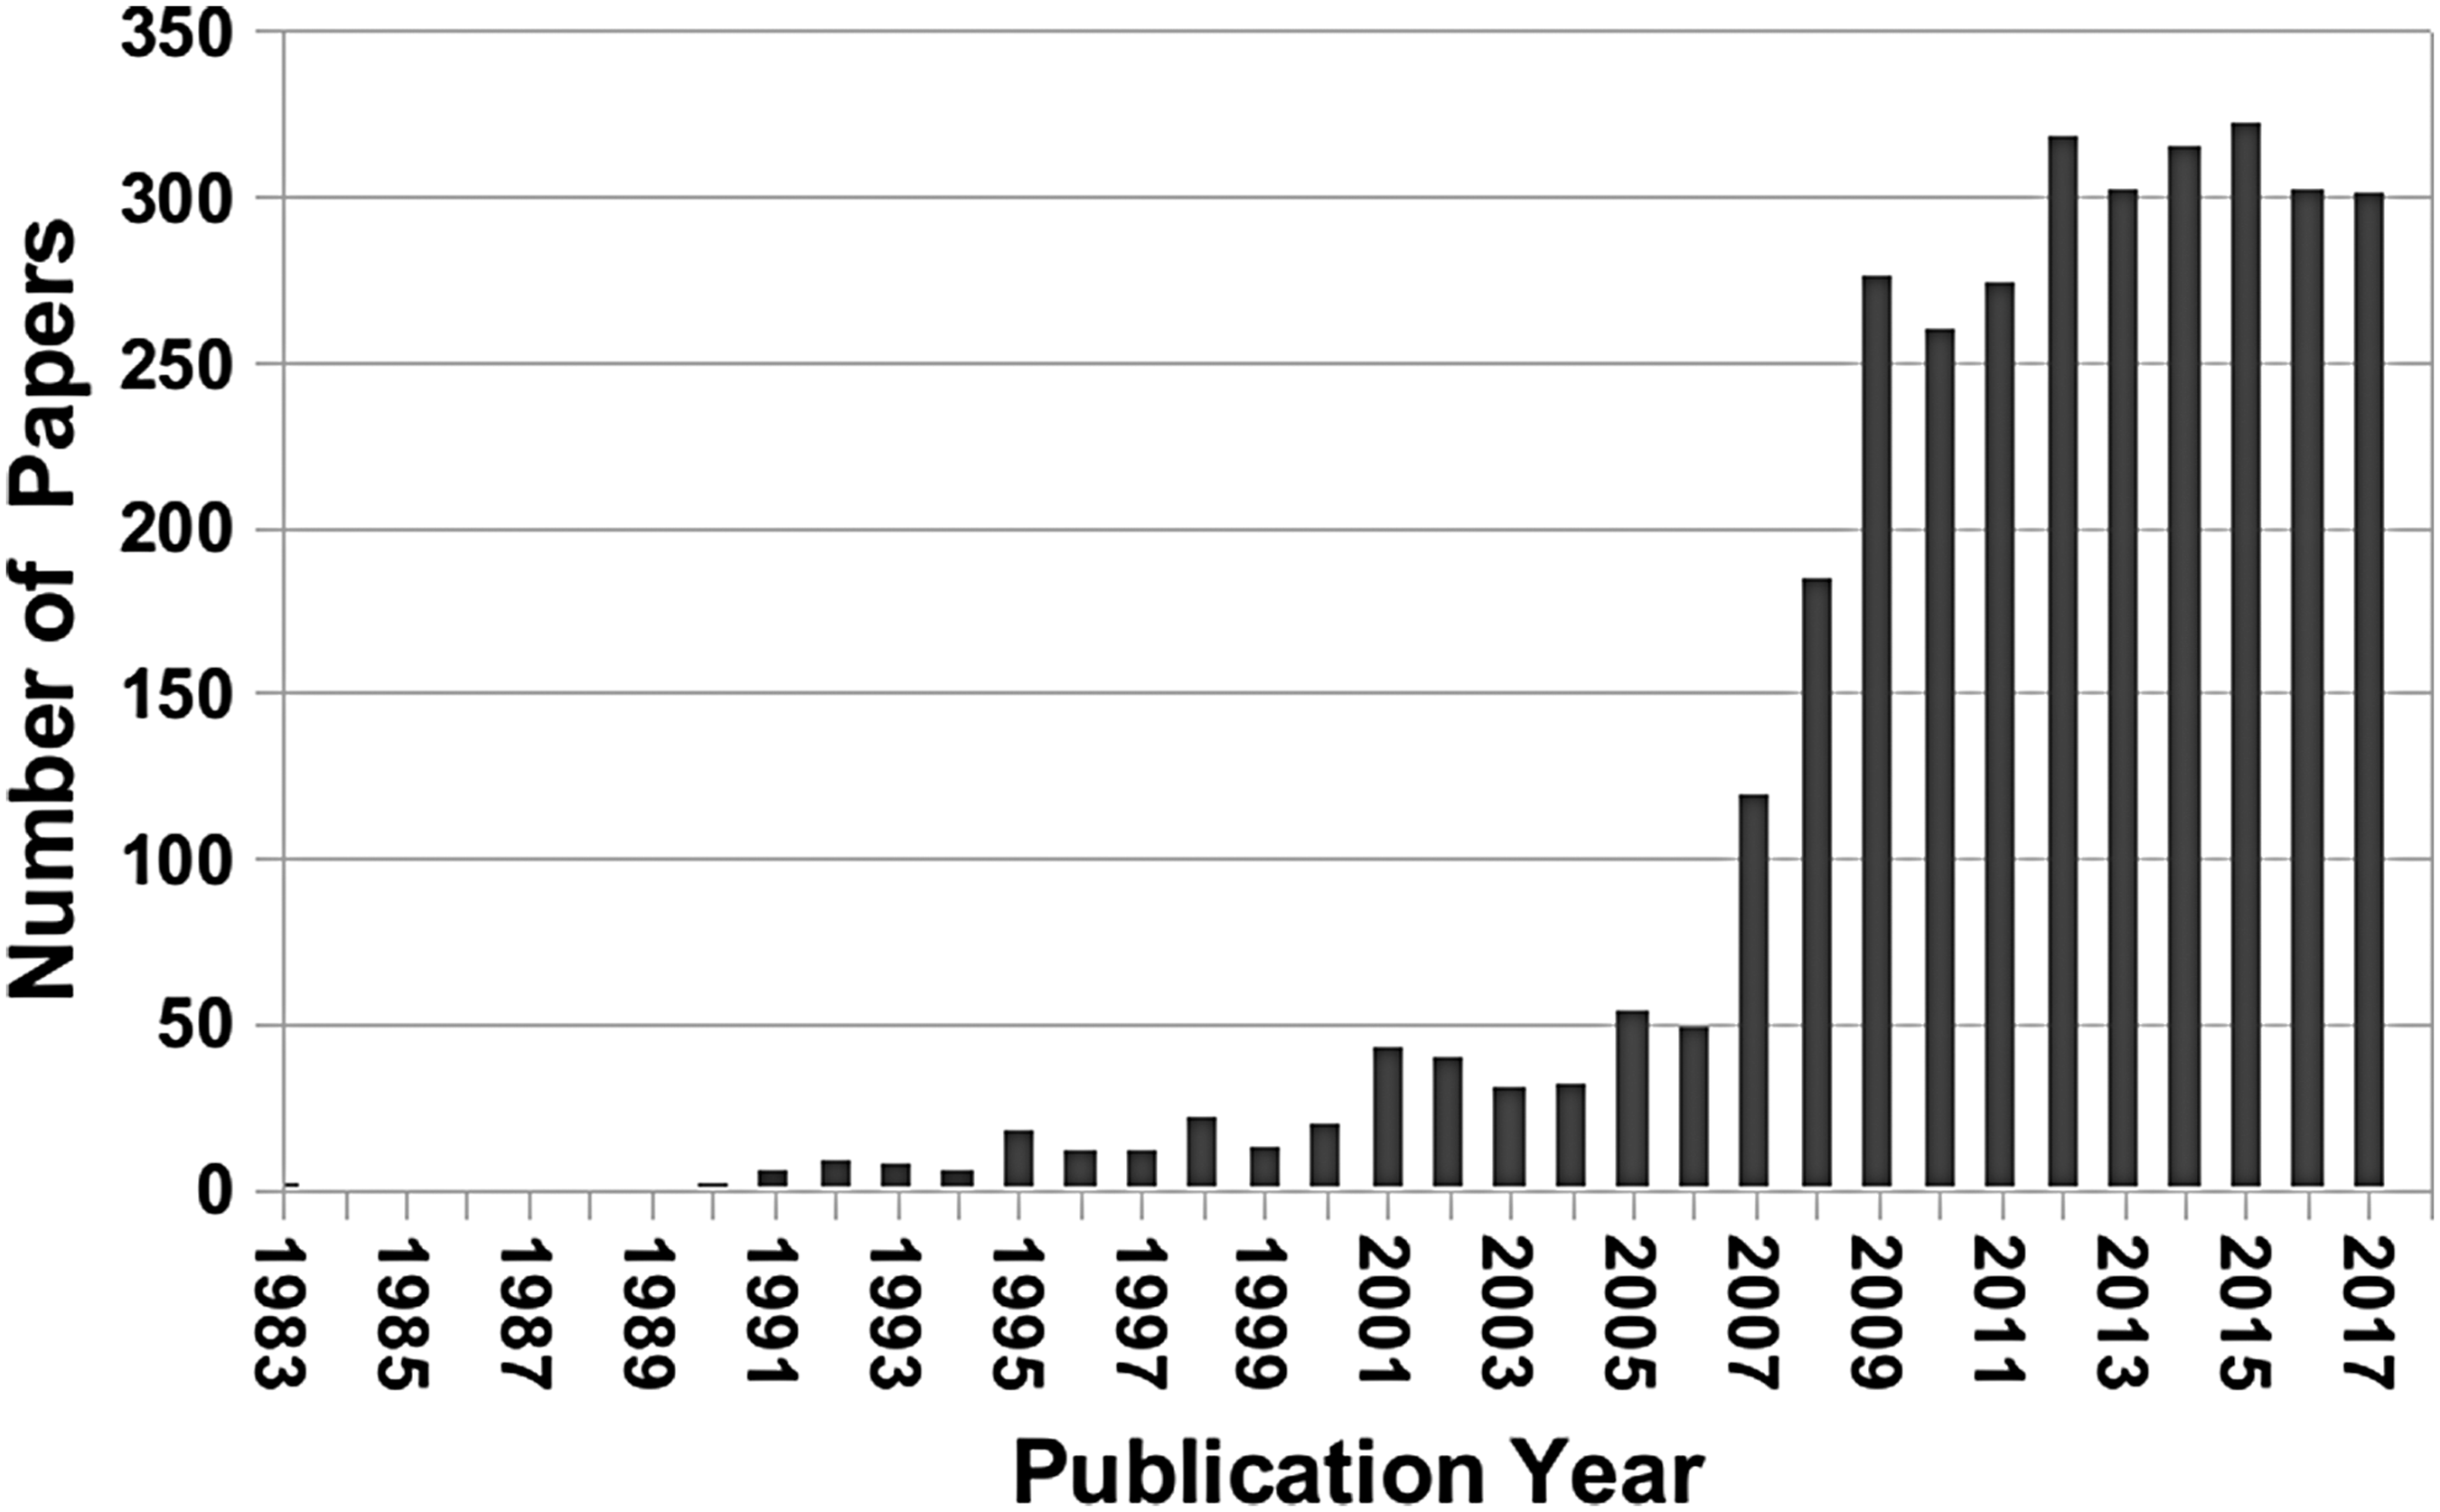
Results of search on Google Scholar using keywords “climate change” and “faster than predicted” or “faster than prediction” or “faster than expected” (excluding patents and citations)
A Short Discussion about the Production Sectors, Their Greenhouse Gases Emissions, and Some Critical Issues for the Acceptance of a New Economy
Energy Supply Systems
The CO2 emitted to the atmosphere from the burning of fossil fuels is the main culprit of climate change. If anthropogenic emissions of greenhouse gases were stopped now, their associated impacts would continue for centuries, but the risks of abrupt or irreversible changes depend on the magnitude of the warming, which can be affected by societal choices, both now and in the immediate future.13,45–47 The energy supply sector (including the energy extraction, conversion, storage, transmission, and distribution processes that deliver final energy to the end-use sectors) is the largest contributor to global greenhouse gas emissions. 17 The stabilization of GHG concentrations at low levels requires a fundamental transformation of the energy supply system.
Renewable Energy
The aggregated global technical potential for Renewable Energy (RE) as a whole is significantly higher than global energy demands. Solar has the largest potential, but there is also great potential for many other forms of RE. The regional distribution of solar is also an important consideration. Fischedick et al. 48 report that there is no obvious single dominant RE technology likely to be deployed at a global level, but bioenergy, wind, and solar may experience the largest incremental growth. The mix of RE technologies suited to a specific location depend on local conditions, with hydropower and geothermal playing a significant role in certain countries. Though the regional distribution of each source varies, the technical potential of RE as a whole is at least 2.6 times as large as the 2007 total primary energy demand in all regions of the world and could definitely contribute to the mitigation of climate change. 48
A growing number of Renewable Energy technologies (wind, hydro, and solar power) can be deployed at significant scale. While they are already economically competitive, they are mainly deployed within larger, centralized energy networks even though they could be decentralized and deployed at the point of use.
Decentralized RE systems can meet rural and small-community energy needs in areas that are not served by an electric grid. Technologies in these areas include various modern advanced and traditional biomass options as well as small hydropower, photovoltaic, and wind. RE technology policies have been successful in driving the recent growth of RE. Furthermore, renewable energy plants are often associated with co-benefits: reduction of air pollution; local employment opportunities; fewer severe accidents compared to some other energy supply technologies, especially if small decentralized plants are considered. It must be taken into account that medium- and large-scale hydro plants not only produce energy but they also ensure effective water management and soil protection, and can become tourism destinations by allowing recreational use.
Nuclear Energy
Nuclear energy is a mature, low-GHG emission energy source and could make an increasing contribution to low-carbon energy supply. However, a variety of barriers and risks exist that make this solution questionable, including operational risks and the associated safety concerns, uranium mining risks, financial and regulatory risks, unresolved waste management issues, nuclear weapon proliferation concerns, and adverse public opinion. Furthermore though nuclear power does not directly emit GHG, significant life-cycle emissions occur through plant construction, operation, uranium mining and milling, and plant decommissioning. According to Sovacool, 49 Life Cycle Analysis (LCA) puts nuclear in an intermediate position: It scores much better than all fossil fuel technologies, but worse than all renewable technologies.
New fuel cycles and reactor technologies that can address some of these critical issues are under development. Small modular reactors (SMRs) with additional passive safety features could be especially promising. 50 The size of these reactors is typically less than 300 MWe, much smaller than the 1000 MWe (or larger) typical of current light-water reactors (LWR). Recently designed SMRs with low power density, large heat capacity, and heat removal through natural means have the potential for enhanced safety 50 and should be characterized by economies of manufacturing from modular construction techniques, shorter construction periods, incremental power capacity additions, and potential for improved financing. 50
Several SMR designs are in development. Light-water SMRs rely on substantial experience with current LWRs and utilize existing fuel-cycle infrastructure. Gas-cooled SMRs operate at higher temperatures and have the potential for increased electricity generation efficiency relative to LWRs and industrial applications as a source of high-temperature process heat. 51 Small nuclear fusion reactors are of special interest and are giving promising results in the research lab. 52 The fusion process could avoid the risks associated with waste management issues, nuclear weapon proliferation, radiological pollution, and the limited availability of fission fuels.
Current market and technology conditions limit extraction of conventional uranium resources to concentrations above 100 ppm, necessitating the development of improved and less expensive extraction technologies. According to the International Atomic Energy Agency (IAEA), present uranium resources are sufficient to fuel existing energy demand for more than 130 years, and if all conventional known sources of uranium are considered, for more than 250 years. 17 Reprocessing of spent fuel and recycling of uranium and plutonium by fast-breeder reactor technology could theoretically increase uranium utilization 50-fold or even more with corresponding reductions in high-level waste (HLW) generation and disposal requirements, 51 but the current technology is burdened by relevant safety issues.
Carbon Dioxide Capture and Storage
Carbon dioxide capture and storage (CCS) technologies are problematic because of barriers to their large-scale deployment. There are concerns about the operational safety and long-term integrity of CO2 storage, and risks related to the transport and to the required up-scaling of the involved infrastructure. Furthermore, the CO2 pressure build-up within a geologic formation could induce seismicity, and CO2 leakage can significantly impact groundwater chemistry and the quality of drinking water, 53 resulting in acidification, eutrophication, and toxicity due to pollution induced by the mobilization of heavy metals. 54
According to IPCC, 17 Carbon Dioxide Removal (CDR) could play an important role in many mitigation scenarios, but bioenergy with carbon dioxide capture and storage (BECCS) and afforestation are the only CDR methods under consideration because of limited comprehensive assessment of feasibility, cost, side effects, and environmental impacts of other CDR technologies. Terrestrial CDR techniques could involve local and regional risks, while maritime CDR techniques may involve significant risks to ocean ecosystems. 13
The Transport Sector
Renewable energy sources are capable of supplying electricity, but some sources can supply thermal and mechanical energy as well as produce fuels that can satisfy multiple energy service needs. The global transport sector accounted for 27 percent of end-user energy use in 2010. Without implementation of aggressive and sustained mitigation policies, transport sector emissions could increase faster than other energy end-use sectors and could lead to more than a doubling of CO2 emissions by 2050.17,46,55
Electric, hydrogen, and some biofuel technologies could help reduce the carbon intensity of fuels. Commercially available liquid and gaseous biofuels already provide co-benefits together with mitigation options that can be increased by technology advances, particularly drop-in biofuels (biofuels that are completely interchangeable with conventional fuels) for aircraft. 55 Energy efficiency measures through improved vehicle and engine designs have a large potential for emissions reductions, but the ultimate contribution of this sector to climate change mitigation will depend on the future electrification of transportation or on the use of RE to produce other energy carriers, e.g. hydrogen.56–58
Human Ability to Understand Climate Change and Promote Mitigation Strategies
Stabilizing greenhouse gas concentrations will require large-scale transformations in human societies, starting from energy production and saving, extending to land use, soil protection, and water management, 17 but both citizens and decision makers often do not have sufficient knowledge about climate risks. This issue can and needs to be addressed through dissemination of more reliable and understandable information and data, and public education that results in a general literacy about the subject. Decision making is affected by knowledge and awareness, but motivation is driven by cultural differences in values and needs, which are equally or more important and, in turn, can lead to differences in beliefs about the existence and causes of climate change. 59
This issue must be addressed first of all by a much more effective and diffused communication strategy by the scientific community, which needs to focus on the message, both in terms of content and audience. All people and particularly decision makers must become priority targets and must be reached by comprehensible, scientifically correct, relevant, and reliable information that could be effectively put to use immediately. Specialized academic and scholarly publications that reach only other scientists, and mainly environment-specialized scientists, are no longer sufficient.
How the climate system is changing, why, in how much time, and the uncertainties must become common knowledge within and outside academia and shared by all disciplines because all contributions are strongly needed to face the crisis of climate change. A first-person awareness deployed across all disciplines can lead to better communication and more reliable knowledge. This poses one more challenge to the scientist: to promote and build day-by-day effective communication channels in all fields, urging involvement and coordination to start working together—everywhere and now.
Only an extraordinary, coordinated and growing effort involving a strong and deep integration of different cultures, different knowledge bases, from humanities and arts to natural, applied, and social science, and different roles from decision makers to the whole society, can achieve results. Certainly this effort is necessary considering that the denial of climate change and of its causes is always alive and, possibly will continue to be so in the future.60,61
Two examples, related to two key issues of mitigation strategies, can help understand the fundamental need for an unprecedented integration of different approaches: water recycling and wind turbines. Both are related to the difficulty of gaining public acceptance for changes in lifestyles.
Recycling, Reusing,…Refusing
Fresh water is a limited resource, and safe drinking water will become more and more scarce in the future, especially at low latitudes. 13 For this reason water recycling could become a mandatory approach to manage this precious resource.
One of the most advanced water recycling plants in the world is in San Diego, California, where recycled water was introduced as early as the 1990s. A local newspaper published an article about the plant, coining the phrase “toilet-to-tap.” Thereafter recycled water became associated with the “yuck factor,” effectively killing its support.
Binz et al. 62 report that the current implementation of reuse schemes in California shows that acceptance of reuse technology must be understood as a complex socio-technical development process, and that the recent successes are the result of a 40-year-long system-building process to legitimize potable reuse. In San Diego proven technology has been adopted to purify recycled water (membrane filtration, reverse osmosis, and advanced oxidation with ultraviolet light and hydrogen peroxide) and rigorous daily monitoring ensures no contaminants are present in the water; yet only indirect potable reuse is currently accepted and adopted; treated water is not sent straight to the tap (direct potable reuse) but it is sent to a reservoir where it is treated again before being piped to homes.
According to Rozin et al. 63 rejection of recycled water is attributable to the way the concept is framed. Unwarranted fear of contamination and contagion also influence resistance to and disgust about consumption of recycled water. Therefore tap water is often rated as significantly more desirable than wastewater that has undergone substantially greater purification than water from the tap.
In their study of the relationship between information and sociodemographic factors in adopting recycled water, Hui and Cain 64 sampled 1,500 adult Californians and found that using recycled water for drinking, bathing, and cooking were linked with resistance, independent of the level of education. Long-term societal legitimization of water reuse, particularly if the potable water supply is involved, is the main stumbling block, not the technical and economical aspects.
More cross-disciplinary efforts are needed in order to provide not only reliable and understandable information, but also to address rational, emotional, and experiential problems and to gain a better understanding of how precognitive affective reactions (e.g., the “yuck factor”) influence responses to water reuse and its public acceptance. 65
The Aesthetics of New Landscapes
The aesthetics of wind turbines as features of a new landscape are at the center of serious controversies. 66 Their presence not only is often considered a danger for birds, a source of noise pollution, a source of severe disturbance due to the intermittent shadow projected by the rotating blades, but also as a visual intrusion on the preexisting landscape. This latter specific feature alone put contemporary wind turbines and their traditional counterparts (windmills) in oppositional positions in the public perception: traditional windmills are seen as an attractive feature while wind turbines as a curse.
On the other hand, according to the European Environment Agency, 67 the potential of raw wind energy in Europe alone may be equivalent to almost 20 times its energy demand in 2020. This makes wind-turbine technology a choice that cannot be ignored; every effort to increase public acceptance of this technology deserves great attention. A proactive approach could be taken, not merely to simply increase public acceptance of renewable energy, but also to address the challenge of making a renewable energy plant beautiful and attractive if art and technology meet and explore new paths to a sustainable future, starting from a strong reciprocal interest and contamination. The following is an example of a totally different strategy to deal with the visual impact of wind turbines. Currently, manufacturers try to make wind turbines a part of the skyline, with gray towers that blend in with the sky. 66 Instead of fulfilling the impossible mission of making wind turbines invisible, German artist Horst Glasker, 68 in his AERO_Art project, 69 dares to propose to make them “works of art for all to see” that “can appear as sculptural, vibrant objects in their own right.” 70
Conclusion
First, the international scientific community (see Supplementary Information) should make every effort to proactively gain attention and be trusted by all disciplines as well as by the general public, and work toward disseminating scientific information in a complete and comprehensible way. People in all disciplines must acquire an in-depth knowledge about what is happening to our climate and how environmental phenomena are studied and described, including all the limitations and uncertainties. All fields of knowledge and activity could make important contributions to dealing with climate and related environmental crises. The general public ought to be extensively involved in the discussion and evaluation of information about climate change and proposed strategies to face it, both on a global level and a local level (where the impact of such strategies is usually more apparent). It is time to put every effort into working across disciplines to advance knowledge, build competencies, and understand the roles played by various actors in the contributions they can make now and in the future, in unprecedented and unexpected ways. Just to save our home planet.
Footnotes
Acknowledgments
The author is grateful to Annalisa Romani (DISIA) director of the projects “Characterization of innovative antimicrobial and antioxidant products based on natural active ingredients for green agriculture uses” (produced by EVERGREENBIOS srl and EVERGRENN-LIFE UE 2014-2917) and “Innovative use of active substrate and phytoremediation technology in environmental impact of Lindane and hydrocarbons in soils and the evaluation of environmental, social and human health BES indexes” (produced by the Municipality of Ceccano, PIN SCRL and CHICO Cluster, PSR 2014-2020 GO-Regione Lazio), which contributed to Open Access Option funding.
Author Disclosure Statement
No competing financial interests exist.
References
Supplementary Material
Please find the following supplemental material available below.
For Open Access articles published under a Creative Commons License, all supplemental material carries the same license as the article it is associated with.
For non-Open Access articles published, all supplemental material carries a non-exclusive license, and permission requests for re-use of supplemental material or any part of supplemental material shall be sent directly to the copyright owner as specified in the copyright notice associated with the article.