
Abstract
To control and navigate micro air vehicles (MAVs) efficiently, there is a need for small, lightweight, durable, sensitive, fast, and low-power airspeed sensors. When designing sensors to meet these requirements, soft materials are promising alternatives to more traditional materials due to the large deformations they can withstand. In this article, a new concept of a soft material flow sensor is presented based on elastic filament velocimetry, which fulfills all necessary criteria. This technique measures flow velocity by relating it to the strain of a soft ribbon suspended between two static supports and subjected to a flow of interest. The ribbon is manufactured from polydimethylsiloxane and can be made piezoresistive by the addition of silver nanowires. With the described manufacturing method, the sensor can be made using common laboratory tools, outside of a clean room, significantly reducing its complexity. Furthermore, it can be operated using a simple and lightweight circuit, making it a convenient alternative for MAVs. Using a piezoresistive material allows for the flow velocity to be calibrated to the resistance change of the strained ribbon. Although certain challenges remain unsolved, such as polymer creep, the sensor has demonstrated its ability to measure flow velocities down to 4 m/s in air through experiments. A time-dependent analytical model is also provided. The model shows that the current sensor has a bandwidth of 480 Hz. Most importantly, the sensitivity and the bandwidth of the sensor can be varied strictly by modifying the geometry and the material properties of the ribbon.
Introduction
With the recent improvements to battery technology and inertial measurement units, there has been increasing interest and availability in small unmanned aerial vehicles, particularly in micro air vehicles (MAVs).
1
These vehicles, which have masses on the order of 100 g, operate close to the ground
2
and travel at velocities comparable to their surrounding wind speeds (i.e., around 10 m/s). Consequently, wind, and particularly gusts, can significantly impact the optimal trajectory and stability of the vehicle when flying between two points,3–6
even when systems such as Global Positioning System (GPS) are used to estimate ground speed. When performing path optimization, measuring the local wind speed requires an anemometry technique that is not only fast enough to resolve changes in wind speed, but it is also sufficiently durable, small, lightweight, sensitive, and energy efficient
1
to minimally impact vehicle performance. There are few conventional techniques designed with all these considerations in mind. Pitot-static tubes are a robust but slow method for measuring wind speed and can be used on larger MAVs.7,8 However, since they measure dynamic pressure, which scales with velocity as
Soft material sensors are commonly used to interface with deformable surfaces as they can accommodate the large engineering strains experienced by the surface. Unlike sensors consisting of stiff materials, soft piezoresistive sensors can be used on skin to measure strain10–12
or pressure.13,14 These types of sensors have been made possible through the development of new, highly deformable, electrically conductive materials,15,16 the most common variants of which are aggregates consisting of conductive particles (e.g., silver nanowires [AgNWs],17–22
silver microparticles,
23
graphene,14,24,25 or carbon nanotubes11,12,14) interspersed within a polymeric binding agent, such as polydimethylsiloxane (PDMS) or polyimide. While these composites derive their electrical conductivity and piezoresistivity from the contact and tunneling between the particulates,
23
the mechanical properties of the composites are determined mainly by the polymer, allowing them to support exceptionally large strains compared with pure metals (
Similar sensors have been developed for velocity and shear stress measurements. Most of these are biomimetics, often utilizing cantilever beam-like form factors that rely on the bending moment of a calibrated structure when subjected to flow. Strain-sensitive traces placed on or around the structure can then be used to measure the local strain and correlate it with the flow. Perhaps, the most notable example is the artificial lateral line (ALL), inspired by the neuromasts found on fish, which allow them to sense water velocity. 27 Neuromasts on fish consist of hair cells embedded in soft cupulae that are typically 0.1 mm in length, whereas engineered versions are on the order of 1 mm. Synthetic ALLs have received considerable attention in recent years, often consisting of stiffer materials such as metal or SU-8,27,28 although softer variants have begun to emerge as well.29–33 Whiskers are another source of inspiration stemming from biology.24,29 In addition to velocity, similar cantilever beam-like sensors have been used to measure wall shear stress.34–36 While these sensors rely on soft materials to achieve a high degree of sensitivity, this often comes at the expense of temporal bandwidth.
Other sensor designs utilize doubly supported sensing elements, such as the spider silk-inspired acoustic sensors developed by Zhou and Miles, 37 the optical fiber described by Stadler et al.,38,39 and the recently developed elastic filament velocimetry (EFV) sensor.40,41 The latter relies on drag from the passing flow to elongate a thin, conductive platinum ribbon suspended between two static supports. The resistance change due to the induced axial strain can be measured via a strain gauge effect and related to the flow velocity. The small dimensions of this platinum ribbon, which are on the order of 100 μm in length and 100 nm in thickness, can be easily obtained using standard microelectromechanical system manufacturing techniques and enable high spatial and temporal resolutions.
Here, we leverage recent advancements in the fabrication and capability of soft materials to develop a unique flow sensor design with the requisite sensitivity, form factor, and bandwidth for MAV applications. The sensor consists of a soft piezoresistive ribbon that deforms when subjected to passing flow. For a given fluid, the flow velocity can be related to the ribbon's change in resistance. Both a schematic and a photograph of the sensor deflecting in flow are shown in Figure 1, where the unstrained ribbon has a length
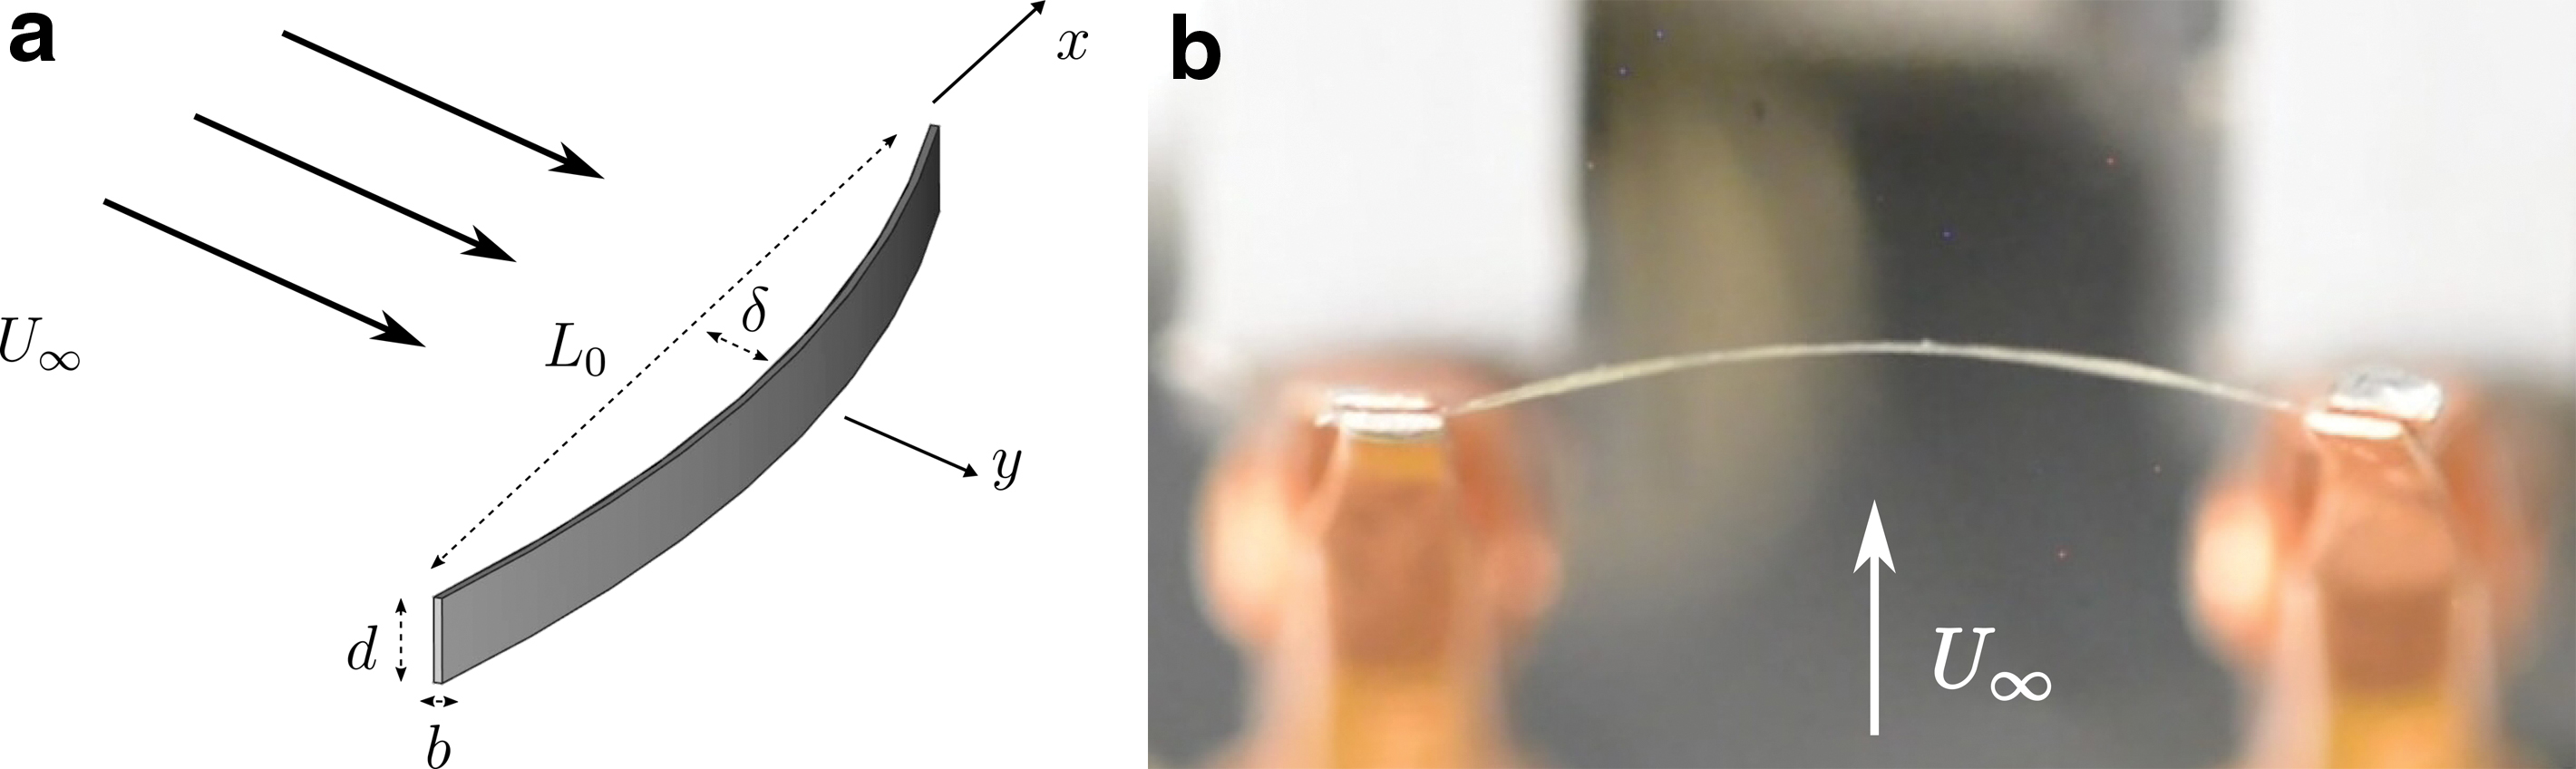
The soft material sensor is shown schematically
The key novelty of the sensor lies, to a great extent, in the simplicity of the design, manufacturing, and operation. For cantilever beam-like sensors, additional strain gauges or measurements of deflection are needed, such as piezoresistive elements, piezoelectric elements, or capacitors that deform when the sensor deflects.
27
Sometimes they rely on complicated structures such as interconnected pillars
30
or liquid metal plates
33
enclosed in a soft cupula. These sensors have been made very sensitive, but the fabrication is typically much more intricate than the method described below. For example, the sensors developed by Chen et al.
42
and Kottapalli et al.31,32 can measure velocities of around 0.1 m/s in air, but their fabrication involves processes that require a clean room. Using the current fabrication process, the sensor can be manufactured using common laboratory tools and low-cost materials without the need for a clean room. It can be operated using a simple and lightweight circuit, making it more accessible to the community compared with most flow sensors. Furthermore, the range of measurable ribbon strains, that is, the sensor rangeability, can be made large since polymers such as PDMS yield at
There are also more subtle advantages regarding the theoretical low-range sensitivity of this sensor design. For example, the drag-induced strain in the ribbon scales with velocity as
In the following sections, we describe the derivation of the physical model and the fabrication process of the sensor. Thereafter, we describe an experimental investigation of the sensor behavior. Finally, sensor time scales are evaluated both analytically and with simulations.
Physical Model
The large aspect ratio of the ribbon greatly simplifies the modeling of the ribbon deflection as well as of the flow around the sensor. A fairly simple model can, therefore, be constructed and used to predict the behavior of the sensor and aid in its design.
With a ribbon of large aspect ratio, the surrounding flow field can be considered quasi-two-dimensional. The behavior of the flow is only dependent on a single parameter, namely the Reynolds number,
where D is the drag force per unit length and
The large aspect ratio of the ribbon enables its deflection to be described by a nonlinear Euler–Bernoulli equation. Considering a stationary ribbon deflection
where E is the Young's modulus,
In the region of measurable strains, the displacement is much larger than the thickness. Under these conditions, it is possible to show that the shear force in the material can be neglected. 40 A model for the sensor behavior can therefore be based solely on the second and third terms in Equation (2).
Since the deflections are much smaller than the length of the sensor, the leading order deflection of the ribbon can be approximated with a parabola,
and Equation (2) becomes
Equation (4) is a third-order polynomial in terms of
Materials and Methods
Fabrication
The PDMS ribbon was made conductive through the addition of AgNWs. This procedure, which is schematically outlined in Figure 2, is a common technique used to make polymers conductive. 23 The properties of a AgNW-PDMS composite are described by Amjadi et al. 18 The AgNWs used here (product number 807923; Sigma–Aldrich) had a diameter of 70 ± 10 nm and a length of 40 ± 5 μm, yielding an aspect ratio of 570. They were in a suspension of ethanol, with a concentration of 5 mg/mL.

Schematic of the fabrication process of an AgNW-PDMS ribbon. AgNW, silver nanowire; PDMS, polydimethylsiloxane. Color images are available online.
To start the fabrication process, 0.15 mL of the AgNW suspension was drop-casted onto a 20 × 20 mm Kapton film, which had been cleaned with deionized water and isopropyl alcohol. A typical distribution of AgNWs after drop-casting is shown in Figure 3. Although this technique produced slight in-homogeneities in the distribution of AgNWs, this was considered acceptable since their scale is much smaller than the length of the sensor.
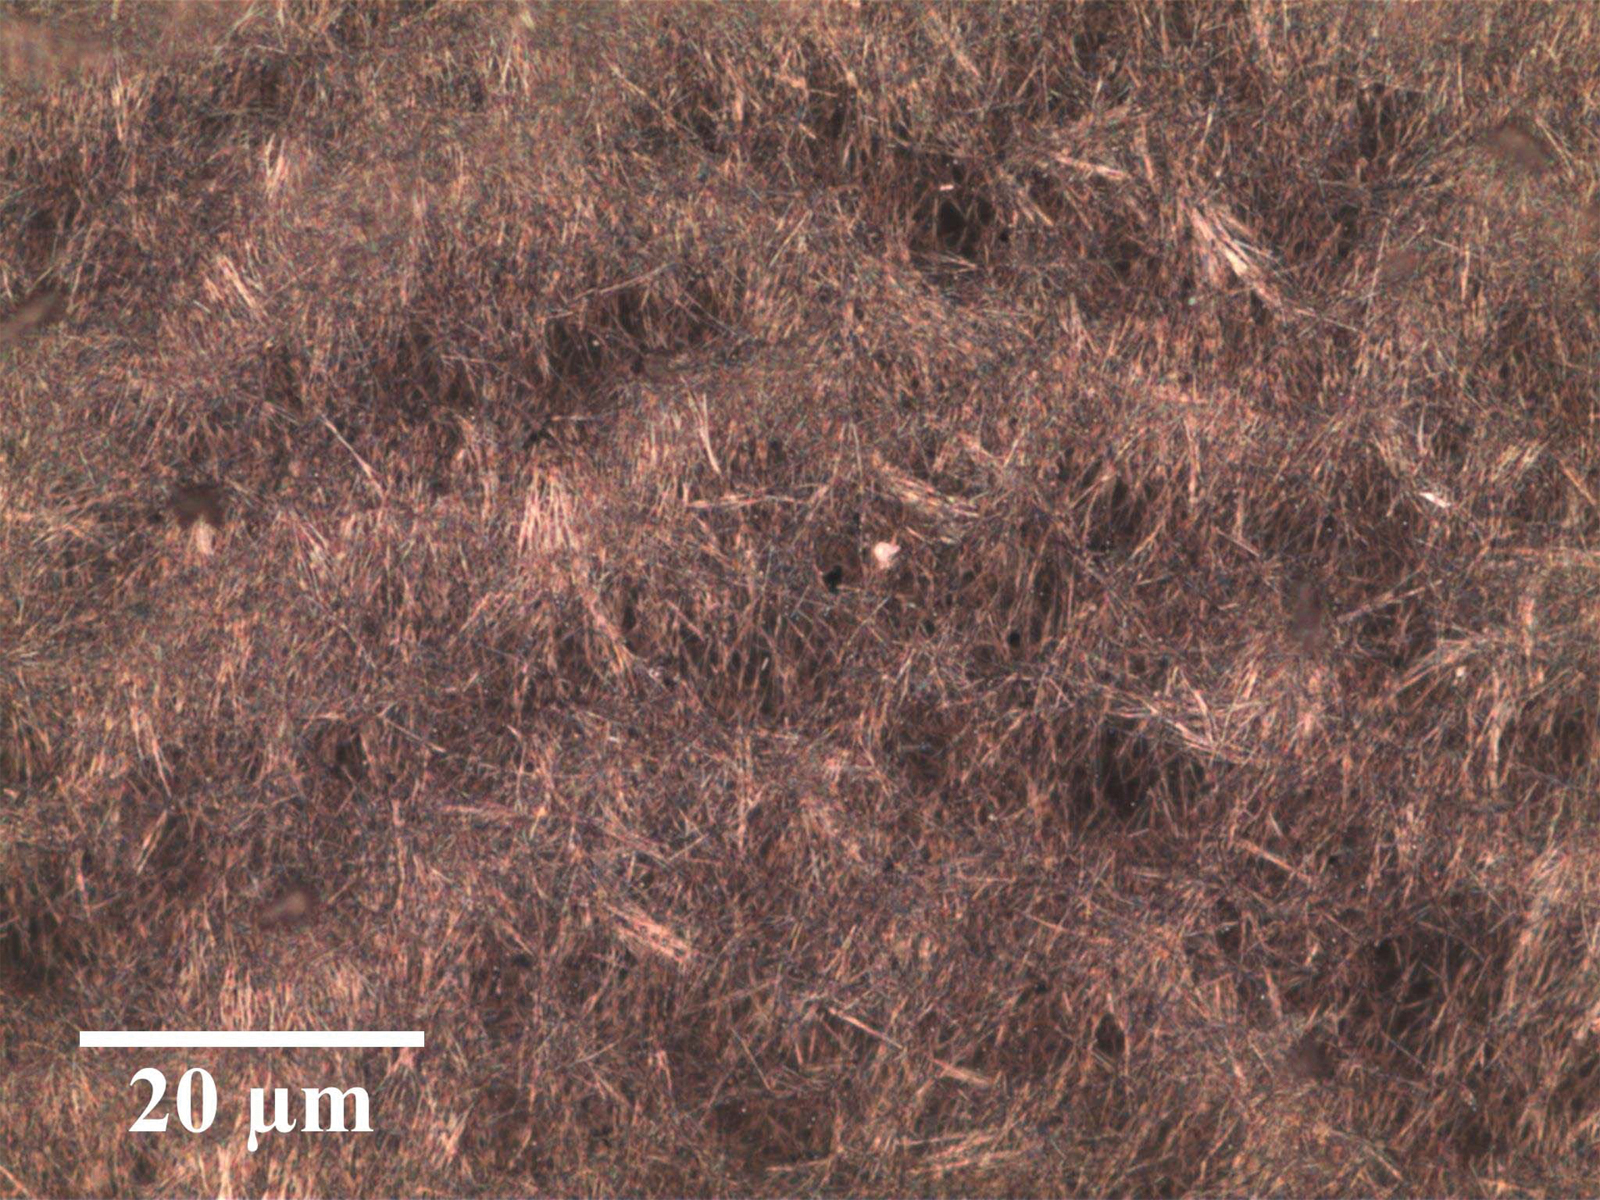
Nanowires photographed with a microscope. Here, the nanowires have been drop-casted onto a glass plate. They have a diameter of ∼70 nm and a length of 40 μm. Color images are available online.
The AgNWs were annealed at 200°C for 30 min on a hot plate. PDMS (10:1 elastomer-binding ratio, Sylgard 184) was then spin-coated onto the sample at 1000 rpm, producing a thickness of 97 μm. This resulted in an AgNW-to-PDMS weight ratio of 0.02 (using a specific gravity of PDMS of
Mechanical and electrical characterizations
To apply the modeled relation between the strain and the velocity of a sensor, Equation (4), the stress–strain and the resistance–strain relations of the ribbon must be characterized. This is equivalent to determining the Young's modulus and the corresponding parameter for the resistance, namely the gauge factor (GF). In practice, these properties can also be found by tuning the model until it fits the experimental calibration curve. However, separate experimental tests were performed to measure these values before data collection.
The stress–strain relation was measured by performing a tensile test (Instron 5865 Universal Testing System with 1 kN range static load cell with 0.5% reading accuracy at 0.1% of full scale). It should be noted that the engineering strain, and not the true strain, was measured. The test was conducted on a sheet of PDMS with a width of 12 mm and the same thickness as the sensor ribbon at an elongation rate of 1 in/min. The results of this test are plotted in Figure 4a and can be seen to consist of two regions. In the first region, up to
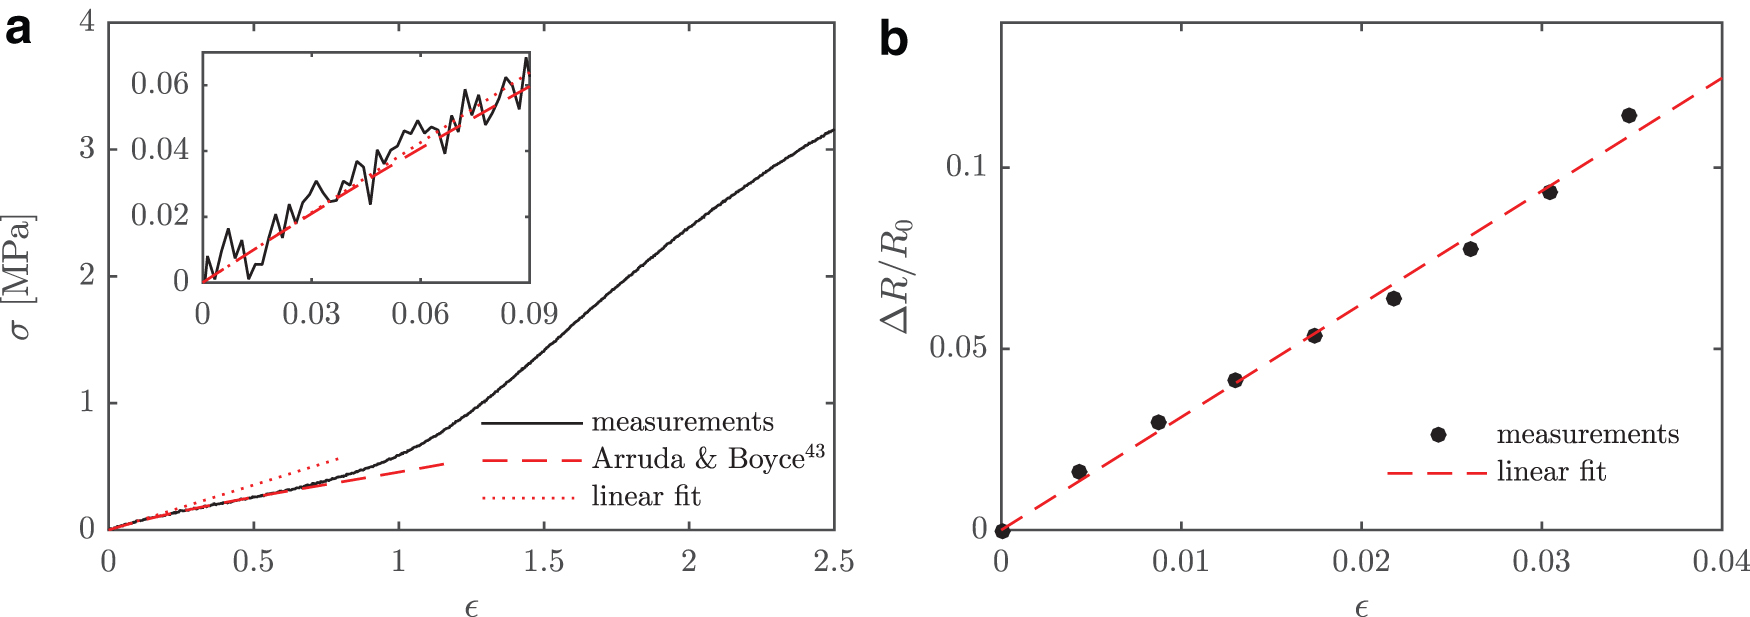
The relation between engineering strain and stress
The stress–strain relation in the first region was assumed to be similar to the analytical model developed by Arruda and Boyce
52
and used for PDMS by Qin et al.
53
This model is shown, together with the measurements, in Figure 4a. For the strains of interest (
It has been reported that applying PDMS by spin coating, as was done here, can affect the stress–strain relation, especially for thicknesses smaller than 200 μm. 54 A thinner sample requires a higher rotational speed, which applies a larger shear stress on the polymers. This aligns the polymers, increasing the Young's modulus of the spin-coated sheet.
Strain is related to the electrical resistance through the strain gauge equation,
where
Results
The model developed in the previous section, Equation (4), was validated by exposing the sensor to flow velocities in the range of 0 to 11 m/s. This was done by positioning the sensor at the centerline of a low turbulence rectangular air jet and measuring the resistance of the sensor.
Three consecutive experiments were performed and averaged to calculate the strain of the ribbon. Due to polymer creep, the resistance increased slightly for each data set (∼0.5%), indicating that the current fabrication process can be improved. Flow velocity was measured using a Pitot-static tube (Honeywell HSC TruStability differential pressure transducer, 250 Pa range with 0.25% accuracy). The estimated strain–velocity relation is plotted in Figure 5 along with the modeled strain, Equation (4). Both the ideal model (no pretension) and a model including a pretension of
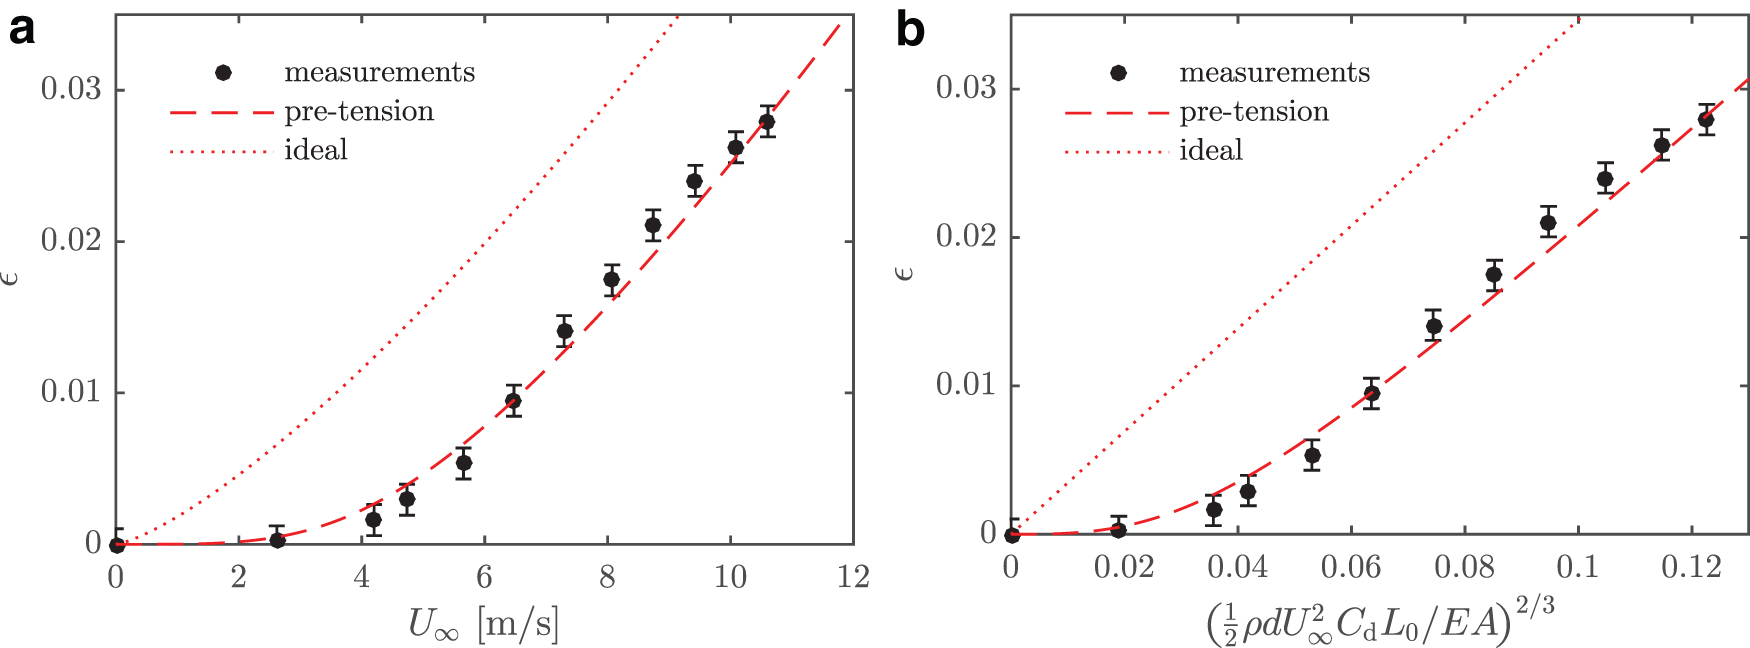
Measured strain–velocity relation with dimensional
The error bars shown in Figure 5 correspond to the root-mean-square deviation of the linear resistance–strain estimate displayed in Figure 4b. With a more controlled manufacturing method, it is believed that the errors can be reduced further. There are also uncertainties in parameters such as drag coefficient, Young's modulus, and GF. These can, in practice, be eliminated by calibration (disregarding nonlinearities).
From photographs of the sensor, similar to Figure 1b, the ribbon deflection was measured to provide an additional validation of the model. This data set is shown in Figure 6. The correspondence between the model and the measurements is worse here, particularly for larger velocities. These measurements were made with the same sensor as the measurements shown in Figure 5, but at a later time. It is therefore possible that the mechanical properties of the ribbon had changed slightly between the two experiments.
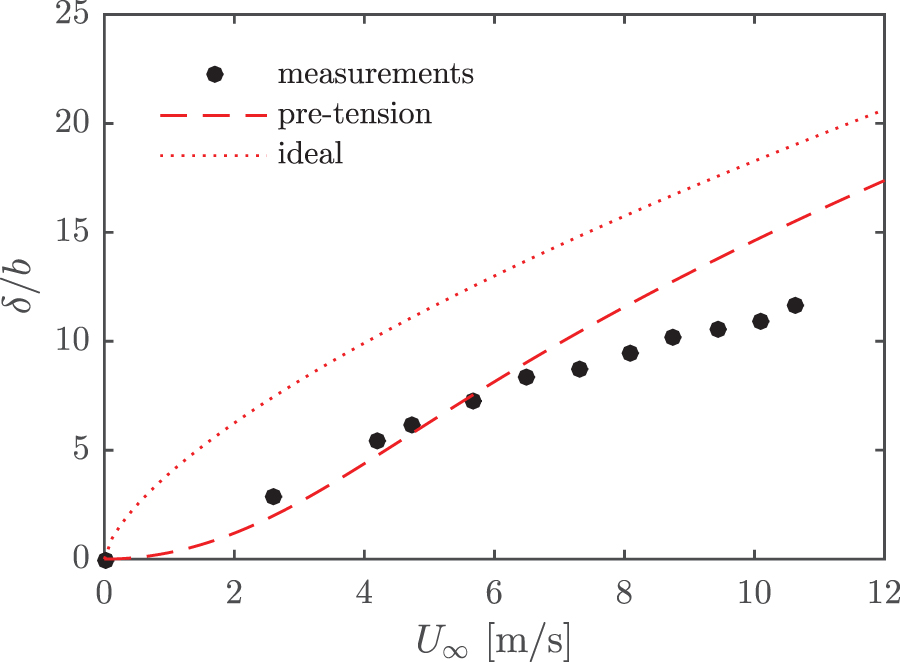
Estimated deflection–velocity relation. The analytical model is also shown, both with and without pretension. Ribbon deflections were determined from photographs. Color images are available online.
Dynamics
The stationary behavior of the sensor has been discussed in previous sections. However, characterizing the time scales governing the sensor is of great importance to determine the frequencies it can capture. The time scales of the sensor were determined through analytical estimation and simulations, outlined below. To simplify the expressions, a linearization technique was used.
With both the deflection and the velocity being functions of time,
where we have assumed that
Due to the nonlinear spring, the natural frequency depends on the amplitude. However, to get a tractable model for the time scales, we can linearize around
where
With
Assumptions of the model were validated by comparing them with the results of a simulation. The simulation was performed using a finite element method (FEM) algorithm with truss elements
57
for a step input, going from

Results of a FEM simulation of the sensor for a step input of
By taking the Fourier transformation of Equation (7), it is possible to find the transfer function between the forcing, F, and
The Bode magnitude plot for the above transfer function is shown in Figure 8 for two different ribbon geometries. The bandwidth of the system is defined as the frequency where the transfer function has decreased by a factor of
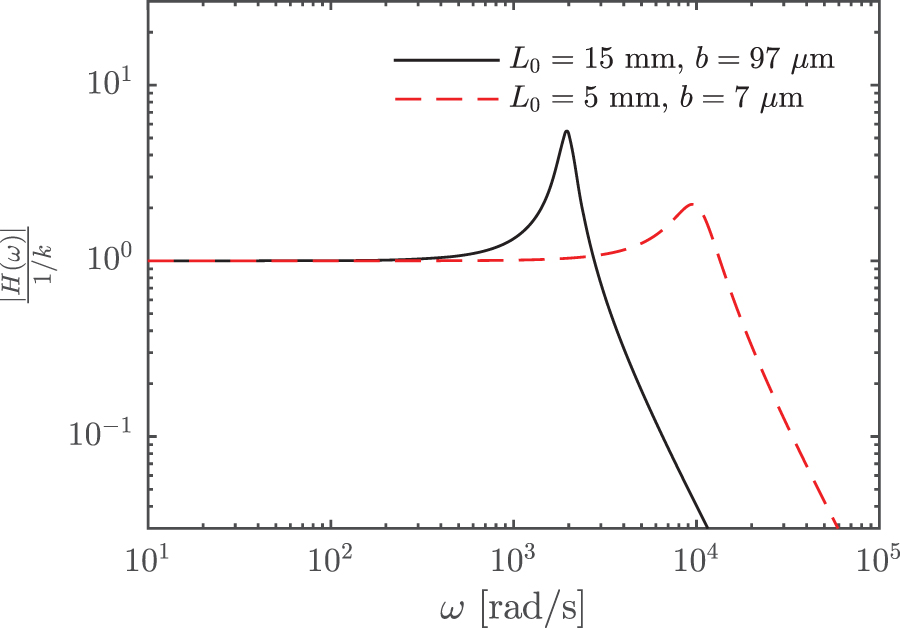
The amplitude of the transfer functions for a velocity
For applications related to MAVs, the bandwidth should be compared with frequencies found in the atmospheric boundary layer. Most turbulent fluctuations in the atmospheric boundary layer have frequencies below 10 Hz, but the spectral levels decrease in a continuous manner.
58
However, if a higher bandwidth and a lower resonance peak are needed, the model shows that the geometry of the ribbon can be modified accordingly. For example, if instead
The effects of vortex shedding have not been considered here. This phenomenon can be expected when
Conclusions
A new concept of a soft material flow sensor was developed based on elastic filament velocimetry (EFV). This sensor has been experimentally shown to measure flow velocities down to 4 m/s in air. The sensitivity of the new sensor is only limited by the dimensions of the ribbon and can therefore be adapted to the requirements of specific applications. Both the range of velocities and the time scales will change with geometric modification of the sensor according to the framework presented in this work. In contrast to the original EFV design, 40 the use of a soft material yields a high durability and enables sensor fabrication without the use of a clean room. This sensor can be made small, lightweight, and requires low power, all of which are crucial characteristics for onboard sensing.
Further investigation regarding polymer creep is warranted since this undesirable phenomenon reduces the reliability of the sensor. This might be solved by improving the PDMS fabrication process or using another polymer. Another solution is to use models which account for polymer creep. 59 Overall, with the benefits of increased durability, high sensitivity, and simplicity of manufacturing, this novel sensor is a viable alternative to conventional flow sensors. In particular, it is very well suited for providing an onboard estimate of wind speeds for MAVs.
Footnotes
Acknowledgments
The authors acknowledge Madeline Vorenkamp, Gawoon Shim, Kyung Min Lee, and Hunter Simonson for assisting in the development of the conductive PDMS method. They are also grateful to SeongHyuk Cho for helping with the tensile tests and to Agastya Parikh for assisting in the revision of the article.
Author Disclosure Statement
No competing financial interests exist.
Funding Information
This work was supported by SSF, the Swedish Foundation for Strategic Research (Future Leaders grant FFL15:0001). M.H. acknowledges the generous support from The Wenner-Gren Foundations.