
Abstract
Abstract
Possessing a sense of touch is fundamental for robots to operate outside controlled environments. Nevertheless, pressure and force-sensing technologies are still less mature than vision or proprioception solutions in commercial robots. In this study we present a novel spatially resolved force sensor that allows dynamic measurement of both the intensity and the direction of forces exerted on a custom-shaped surface. Originally designed for biomechanics of arboreal primates, this sensor meets several challenges in engineering robotic skin. Of importance, its ability to measure tangential forces would be instrumental for robotic hands to grasp deformable and unknown objects. Based on optical measurements of deformations, this array sensor presents a soft, biocompatible, weather resistant body, immune to electromagnetic interferences. Central to the cost-effectiveness of this solution is an architecture where a single image sensor handles hundreds of force measurement points simultaneously. We demonstrate the performance of this sensor in reconstructing normal and slantwise forces on a flat prototype adapted to forces under 3 N. Finally, we discuss the broad range of possible customizations and extensions for applications in biomechanics and robotics.
Introduction
Adding senses to robots allows them to serve outside controlled environments by apprehending autonomously novel situations and objects. Sensing robots can therefore undertake a wider and more general array of tasks. Although they are still under very active development, vision and proprioception/kinesthesis are now standard features of commercial robots. In comparison, arrays of tactile sensors for robots (i.e., robotic skin) are more an active area of research than a mature technology portfolio.
Yet, touch and proprioception work together in forming what is often called somesthesis and is the basis for haptic capabilities, that is, exploring the environment by interacting with it. 1 From a biological perspective, somesthesis is a fundamental sense shared by all animals and is possibly the most ancient sense.2,3 We therefore should expect that adding the sense of touch, by enabling complete somesthesis, will improve considerably robots' capacity to safely and autonomously mingle in unknown environments.
There are many engineering challenges in designing a robotic skin including: sensitivity, resistance to wear, geometric adaptability, power consumption, integration, and obviously cost. 4 In this study, we designed a local directional force-sensing technology that has many interesting properties regarding these aspects. In the spectrum of force-sensing technologies, it can be seen as an array of “stiff sensing pixels” that is an underexplored direction to cope with the typical challenge of decoupling force-induced signals from the deformation or geometry of the substrate. 5
Unlike most sensors, our soft-sensing array relies on optical measurements. This technical direction, mostly explored in the 2000s usually yielded large, bulky, and highly consuming systems. 6 Yet, optical systems like the one presented here possess several intrinsic advantages such as an incomparable immunity to electromagnetic interference. In addition, some optical systems ensure an easier integration by separating force measurement location from optical measurement and the possibility to easily adapt the sensitivity and cost of the system by only changing the optical measurement component. Integration advantages of optical system have even motivated converting electrical sensors' output from microelectromechanical systems to light signals. 7 Moreover, advances in several technical domains such as light-emitting diodes (LEDs), plastic optical fibers (POFs), complementary metal–oxide–semiconductor active image sensor (CMOS) image sensors, and microfabrication help reducing many limitations of previous optical-based sensors.
An efficient robotic skin would probably features a mixture of sensing elements 4 similar to the human body where sensing units with distinct properties are present in different proportions and densities depending on the body location. 8 Except a few noticeable exceptions,9–12 existing touch sensors are all pressure or contact sensors. 13 Although pressure or contact information can be sufficient for a wide array of functions, when it comes to grasping, having access to both normal and tangential components of contact force is fundamental, notably for deformable objects, as has been demonstrated on several robotic hands.14–16 This is because grasping relies heavily on friction forces and pressure information is insufficient to capture it. Moreover, forces perception has been proven to prevail over geometric consideration in human haptic exploration. 17 Practically speaking, with pressure information only, it is in general not possible to distinguish whether an object is slipping or not. It would require previous knowledge of the objects' geometry and the interface friction coefficients. Said otherwise, a robotic hand lacking tangential force sensitivity is only capable of dealing with well-known objects.
This project began with the study of animal biomechanics. The technology described in this article was originally developed for measuring small arboreal primate grasping during climbing where friction aspects are crucial: living in arboreal environments requires hands and feet to develop tangential forces while grasping branches to stabilize the body. Measuring dynamically the repartition of contact forces during grasping would be instrumental for biomechanics. To this end, our sensor must to be made in a soft, weather-resistant, and biocompatible material (some animals tend to chew new objects). In addition, the sensor shape (i.e., the sensitive surface geometry) had be adaptable, for example, a cylindrical shape mimicking a branch.
The results here are based on a flat sensor designed for validation and characterization purposes. Given the species we want to study at first (small mammals of 0.5–2 kg with hands and feet of 2–10 cm), the required spatial resolution was of four measurement points per square centimeter, with each measurement point (that we call “cell”) having a measurement range of 0–3 N. Moreover, measurement frequency had to be 30 Hz at least and the system should be autonomous for field studies.
Serendipitously, characterizing animal grasp entails many similar challenges with the design of robotic grasping hands. We believe this work to be of equal interest to the robotics and biomechanics communities. Many design choices related to animal biomechanics, such as having soft and sensitive elements, are also well suited for robots interacting with humans. Yet, whenever priorities or constrains may differ, we will discuss variants of interest to robotics, leveraging upon the large adaptability of the presented technology.
Materials and Methods
System overview
Our sensor is composed of an array of sensing units (cells) made of a soft and elastic material (Fig. 1A). When a contact force is applied, each cell is deformed depending on the local force. Measuring the cell's deformation gives access to the applied force. To measure each cell's deformation, we track the position of a tracer embedded in the elastic material using an optical principle analogous to performing triangulation: (1) for each cell, a source of light illuminates the tracer, (2) light is reflected and diffused by the tracer, and (3) is collected in three points (Fig. 1B). The intensity of light received in each point is related to the tracer position, and this relation is used to reconstruct the tracer displacement.

Overview of the sensor.
As we have a possibly large array of cells, we used several optical fibers to both inject light in each cell and collect light in three points per cell. A single light source illuminates all injection optical fibers (Fig. 1C). All reception optical fibers are imaged at the same time by a single CMOS sensor (Fig. 1D). From acquired images, a simple image processing pipeline extracts single-fiber light-intensity measurements for each frame. Using a mechanistic model of a cell's physics, single-fiber intensity measurements allow to reconstruct tracer displacements in each cell and ultimately, the applied force.
Components description
The sensor contact surface consists in a tiling of soft, deformable cells of 4 mm in diameter in our prototype (Fig. 2). Cell design will determine many properties of the final system such as contact quality, measurement range, and precision. The emerging part of cells is approximately semispherical to convert oblique contact forces as a slantwise compression of the cell rather than as a surface shearing force. This is desirable because the latter deformation mode depends more importantly on friction parameters of the interface with object in contact, which are usually unknown. Note that this is particularly relevant for measuring contact force with objects that are themselves deformable or soft to some extent, such as animal hand and feet in our case. Similarly, such dome-shaped cells would be of interest if the sensor surface is itself deformable (e.g., sensors used on a robot hand).
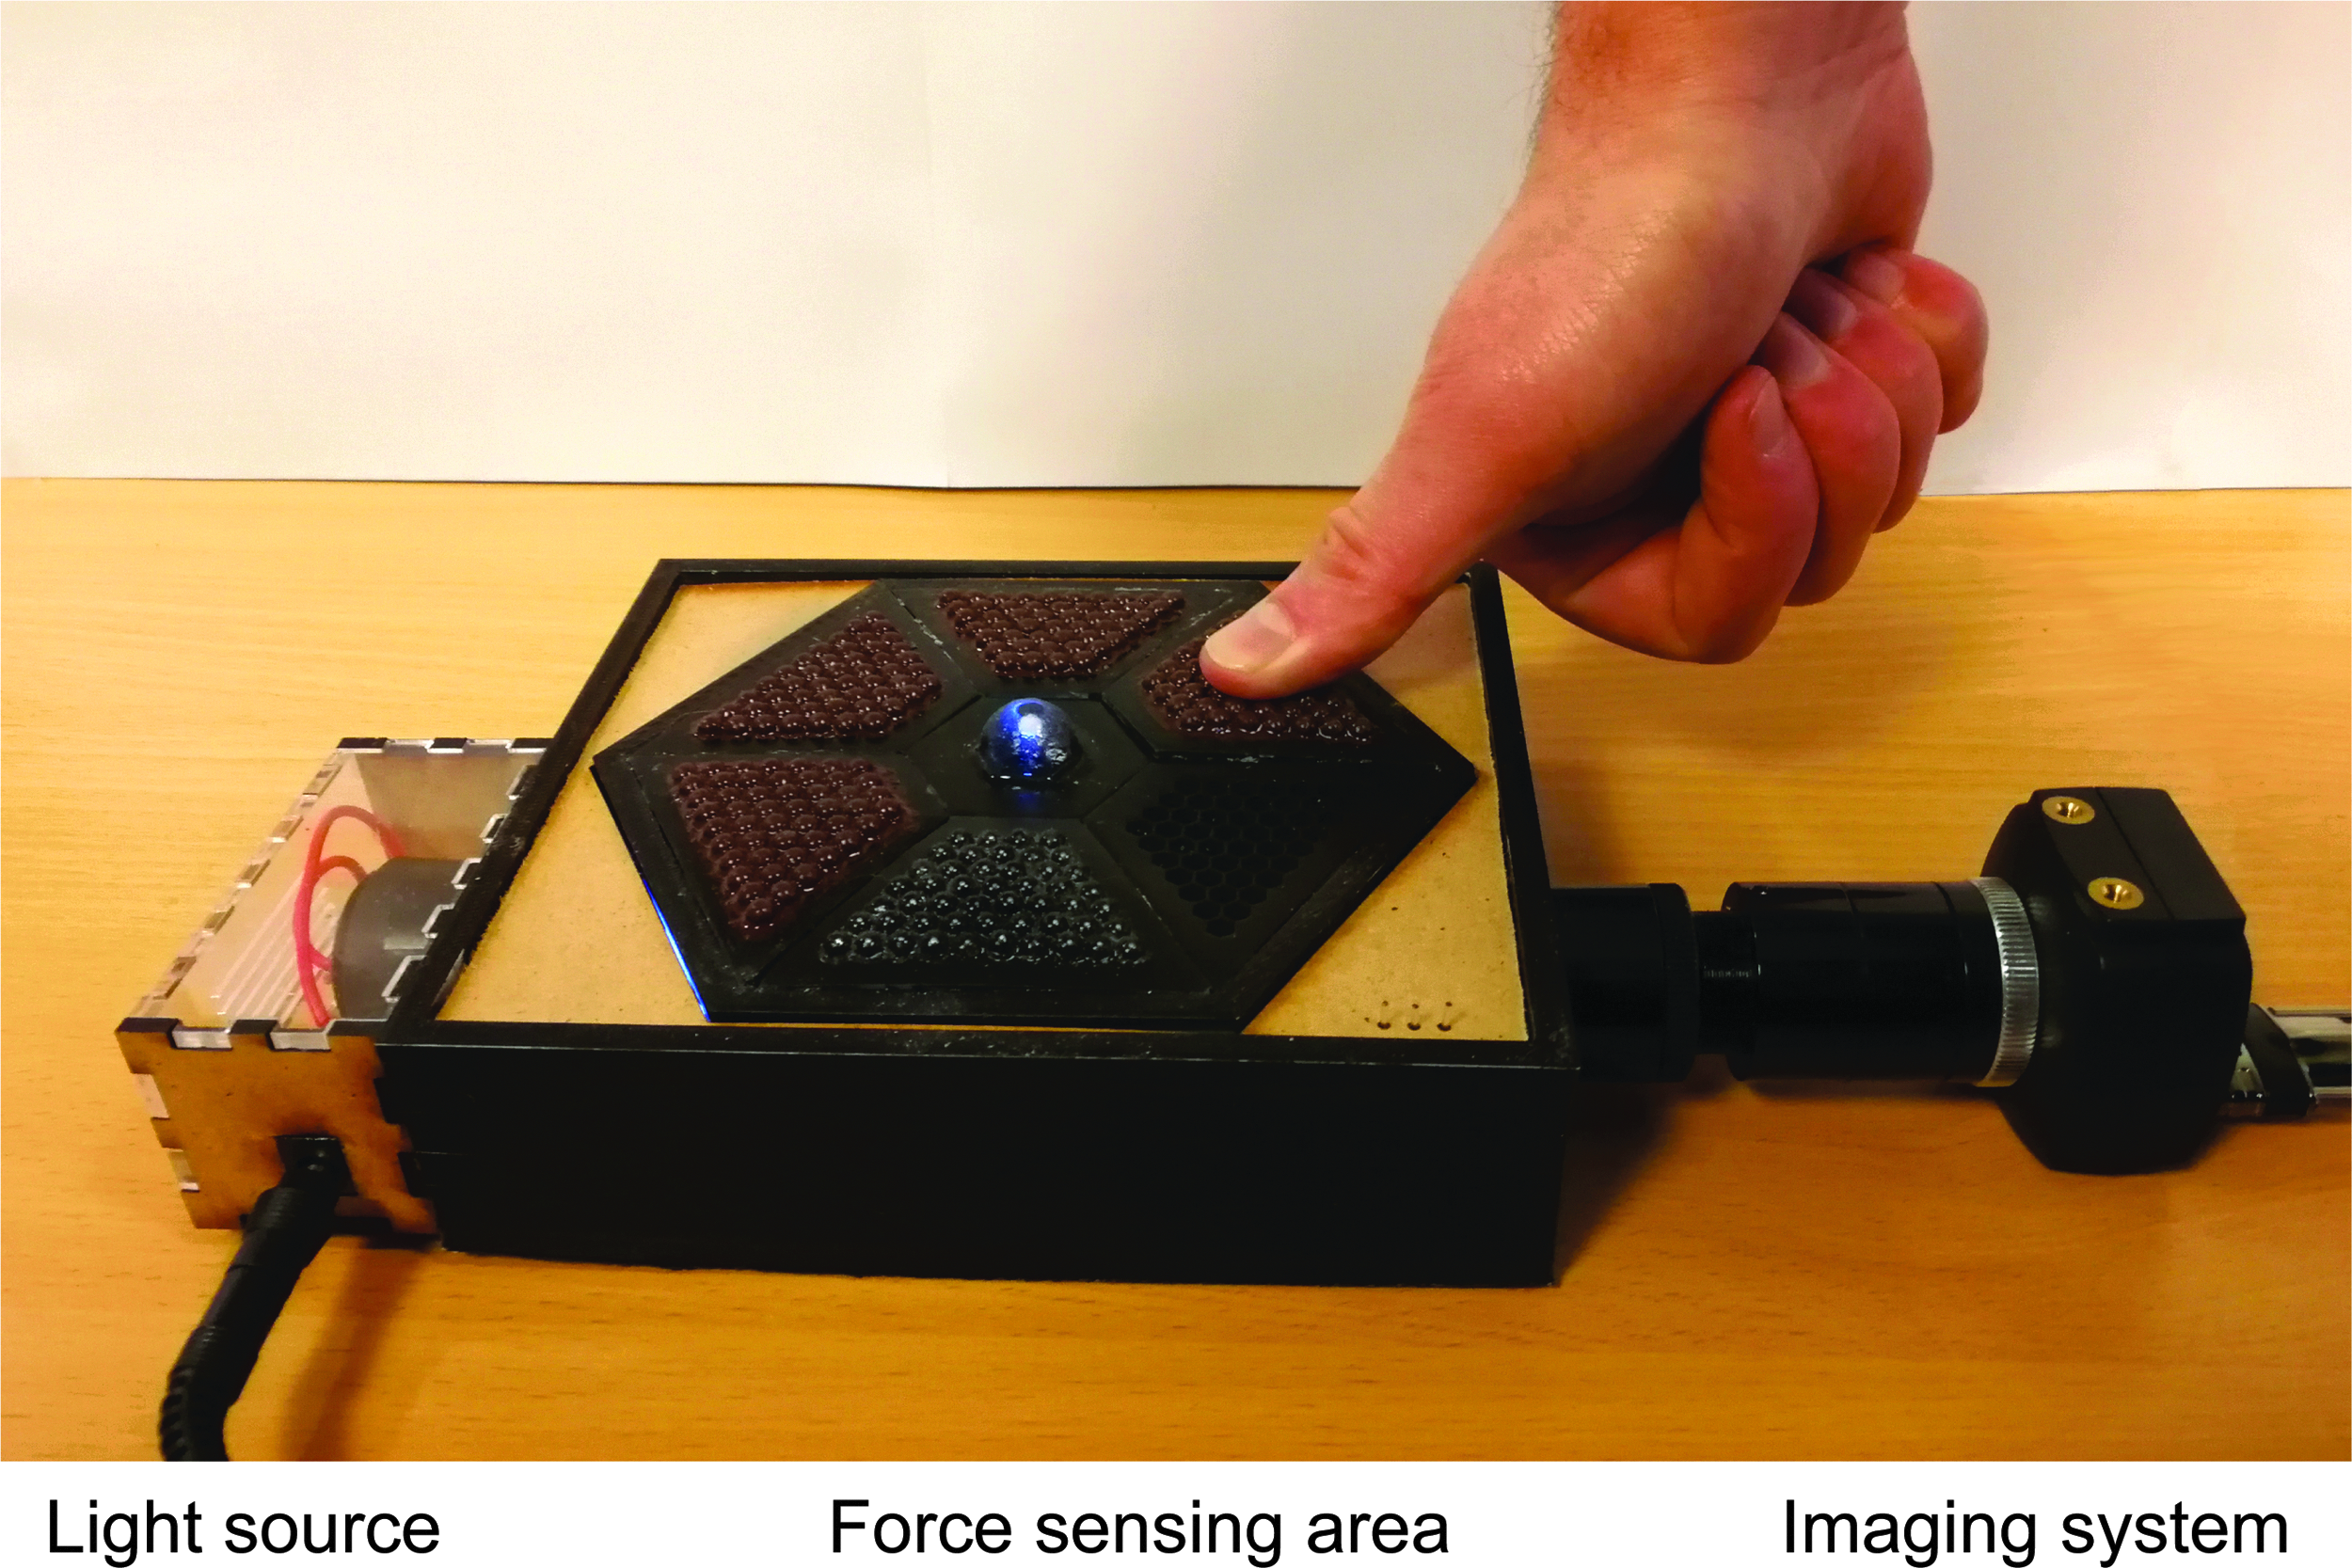
Prototype used in this study. Several cell matrices were produced to illustrate various fabrication steps and at the center is an enlarged and uncoated cell.
To ensure a simple analytical relation between the exerted force and the cell deformation, we used PDMS (polydimethylsiloxane, Sylgard 184; Dow Corning), an elastomer that follows Hooke's law until 40% compression. 18 Given that PDMS is incompressible, the inner part is not deformed by forces applied on the emerged part. PDMS is made from a heat-cured two-component mix. Its mechanical characteristics can be tuned by varying the mix ratio and curing temperature.18,19 Stiffer PDMS means a larger measurement range as more force can be applied before overshooting the 40% deformation limit of elasticity. Nevertheless, a stiffer material also means a decreased precision as deformation is smaller for a same force (and therefore harder to detect). Results reported throughout the article have been obtained with a PDMS mix ratio of 1:15 and a 24 h 40°C heat cure.
Cell material needs to be transparent and isolated optically from the environment. In our prototypes, transparent cells were fabricated with a two-step molding procedure allowing to have an outer coating with pigmented opaque PDMS. Within the elastomer, a reflective bead (∼0.5 mm in diameter) is embedded as a tracer. Cells are embedded in a rigid structure. For our prototypes, the structure was made by precision three-dimensional (3D) printing (Polyjet HD; Stratasys) already including drillings for guiding fibers. Cells were made in hexagonal shape to maximize the sensing surface relative to the residual structure.
POFs are used to transmit light to each cell and to collect it. In addition to being cheaper than silica optical fibers, POF are also mechanically more resistant and bendable. Given that our measurements rely on light intensity only, light pipes can be used instead of POF. For our prototypes, we used multimode, step index POF of 500 μm diameter (Super Eska; Mitsubishi Rayon Co. Ltd.). A single collimated light source (35 lm white commercial grade LED) irradiates the injection POF bundle (Figs. 1C and 2). A bundle is a compact arrangement of parallel fibers, embedded in optical epoxy resin, and polished. For each cell, the injection fiber shines light on the tracer and three reception fibers collect the light reflected by the tracer (Fig. 1B). All reception fibers are regrouped in a bundle to be imaged all together (Fig. 1D). The bundle is imaged using a simple objective conjugating the fibers bundle and a CMOS sensor. In our prototypes, we used a 12 bit, global shutter, monochrome USB3.0 camera (IDS camera harboring the e2v Sapphire 1.3M pixel CMOS, EV76C560; Fig. 2).
Data processing and force reconstruction
At each time frame, an image is taken. Given the magnification of our imaging system, each fiber's image is an ∼42 pixel diameter disk for 500 μm diameter fibers (Fig. 3B). For each frame and each fiber, the average pixel intensity (on a fixed size 28 pixel diameter circle, centered on the fiber's image) is extracted. We note

Reconstruction of a normal indentation force.
We then apply the following two-step normalization and de-noising process: (1) removal of light injection fluctuations (general intensity change) and (2) normalizing relative to absence of force. Using a reference frame taken without any force
Single fiber intensity data are injected in a simple model of the physics of a cell. This model integrates:
The geometry of any specific cell (optical fibers orientations and positions, tracer position). A linear mechanical model of the cell deformation and associated tracer displacement validity of which is restricted to the elastic portion of the deformation. In addition to cell geometry, this includes the compression Young modulus of the elastomer. A simple light irradiance model capturing the relation between the tracer position and changes in reception fiber's irradiance related to
This model can be mathematically described as a mapping
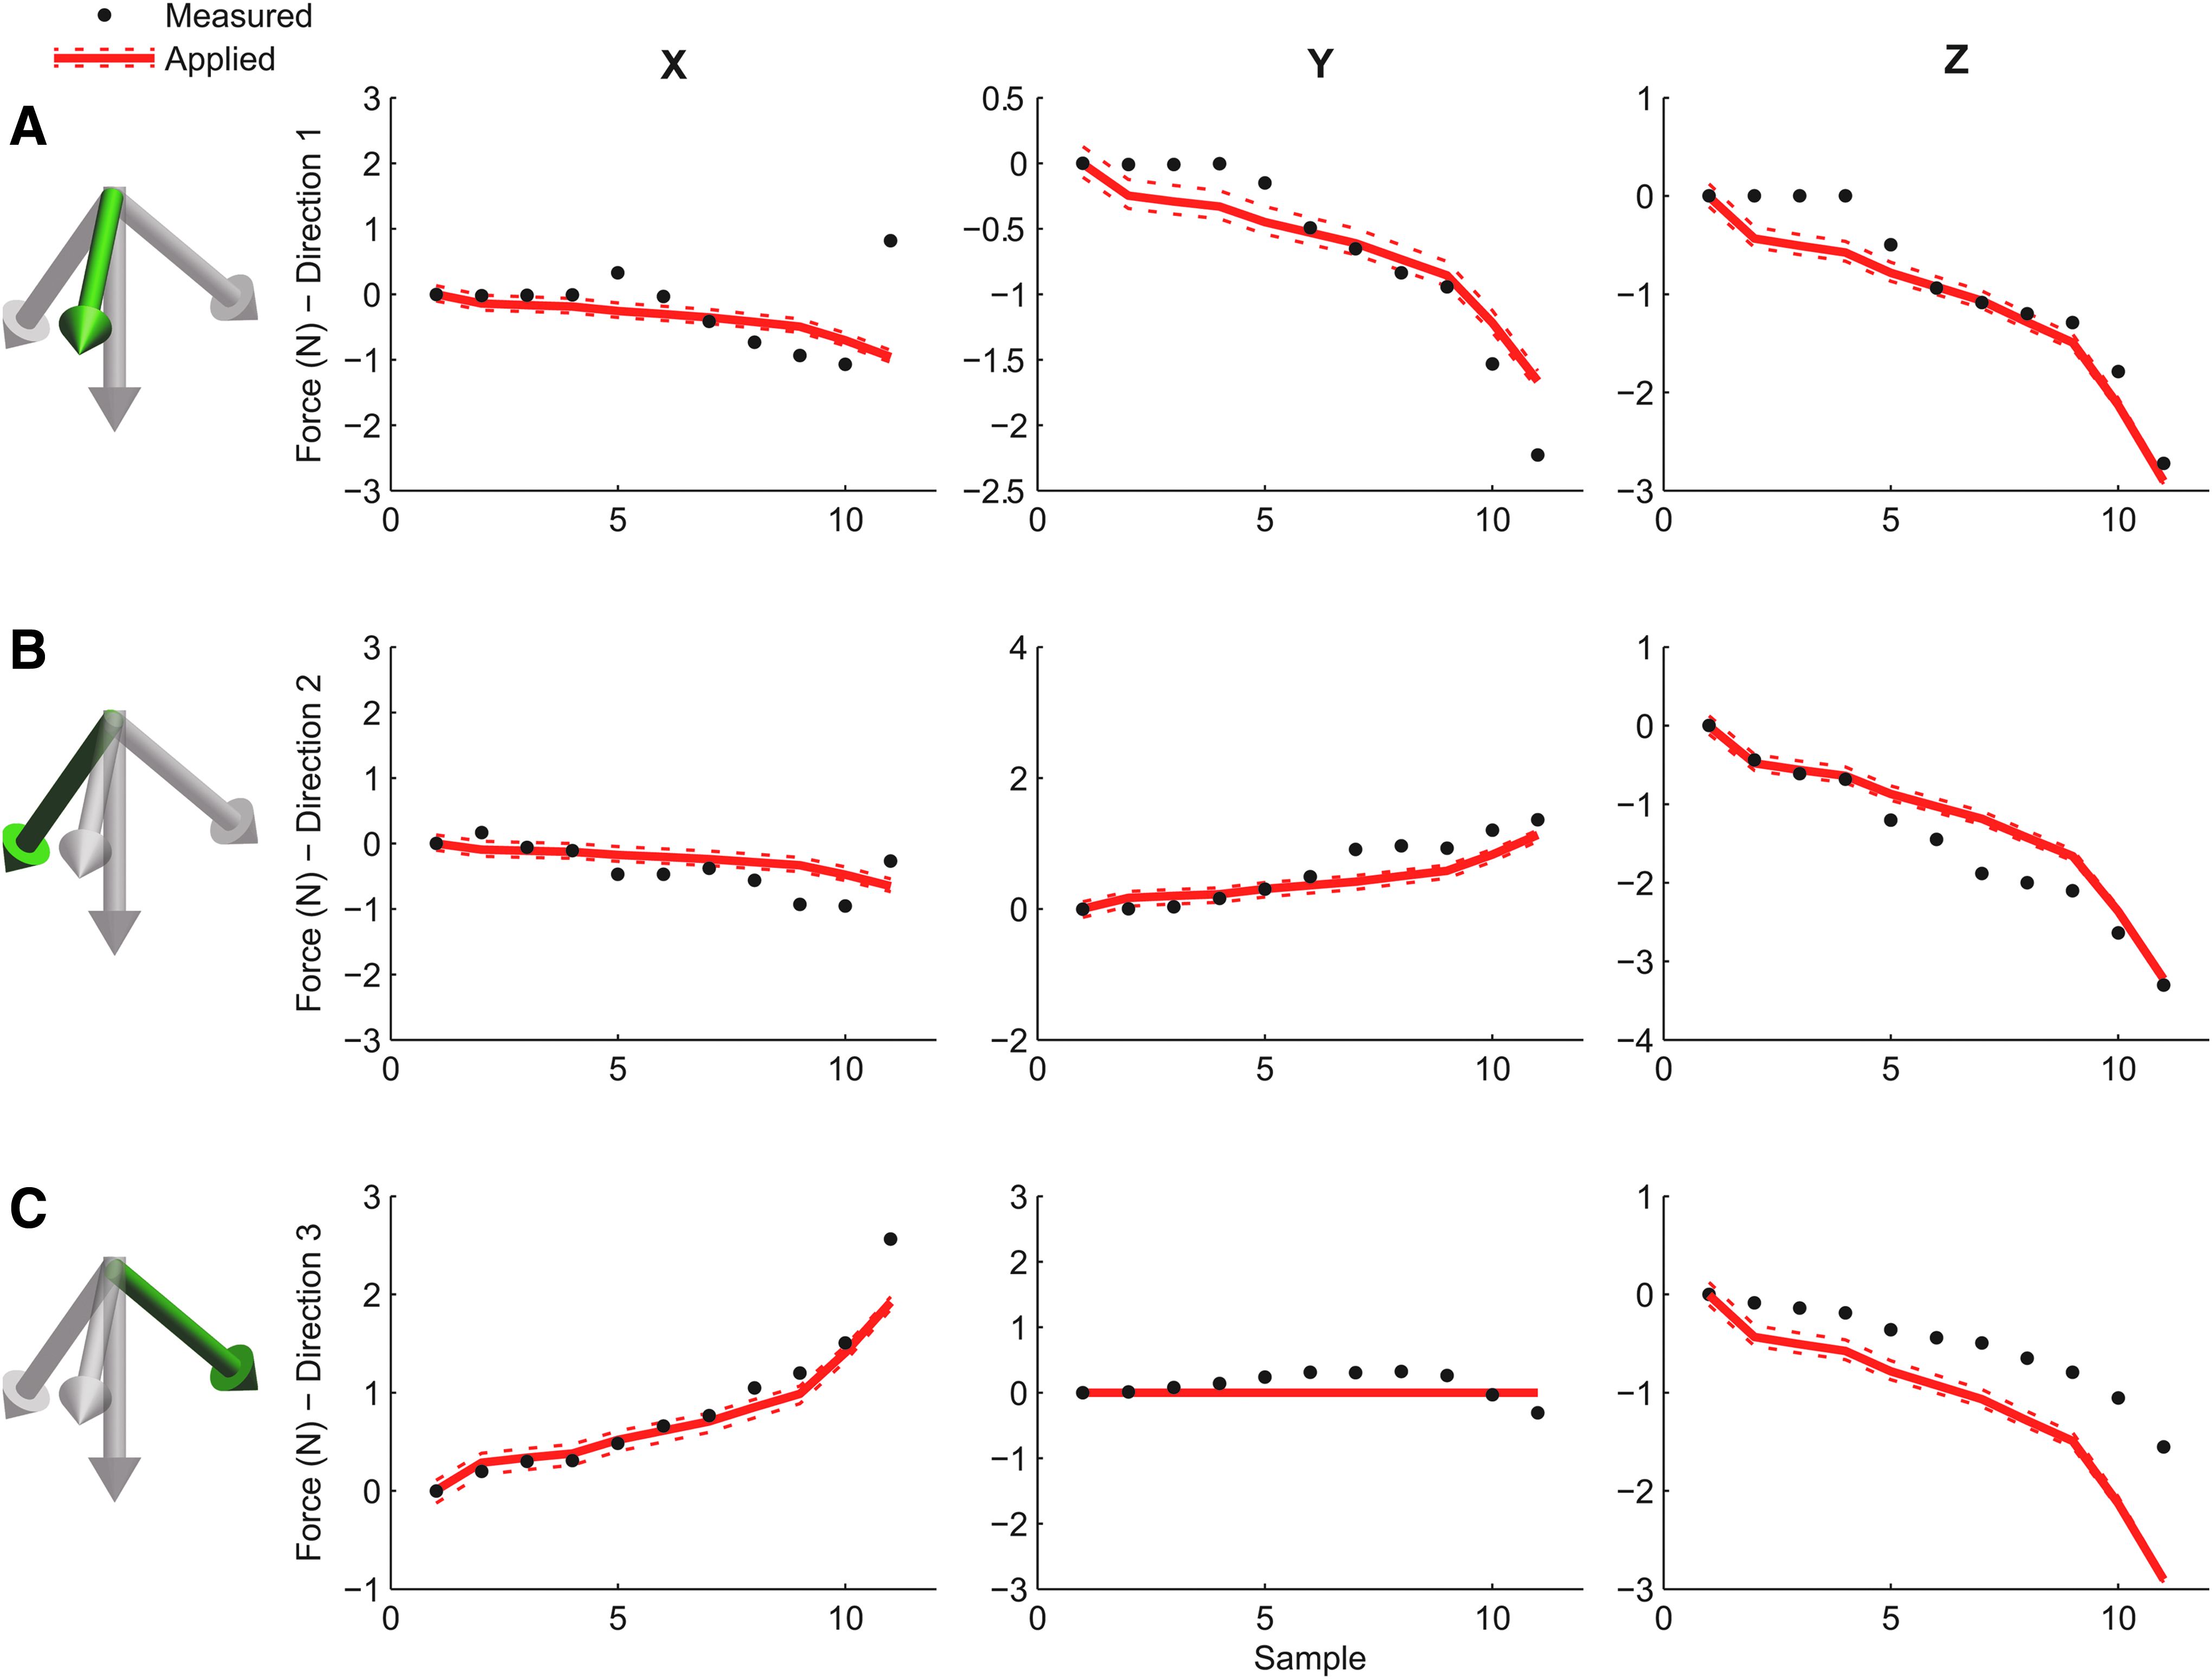
Reconstruction of slantwise forces. For
The force reconstruction process requires parameters that are estimated using a simple calibration procedure. These parameters are as follows: (1) the correspondence between each fiber in the bundle image and the associated specific reception point in a specific cell; (2) a normalization vector for each reception fiber that compensates for both manufacturing variability on reception fiber orientations, and eventual differences in injection and reception fibers transmittance (because of variation in length or fiber-surface quality); (3) the real position of the tracer in each cell to account for manufacturing variability.
Calibration is automated with a custom machine where low-friction pneumatic cylinders apply known forces to each cell (we used M9 Airpel® Anti-Stiction Air Cylinders from Airpot Corp.). For this study, we applied to each cell 18 different vertical forces and 14 × 3 different slantwise forces (along 3 different directions). The reason how reducing the amount of calibration points affects calibration quality has not been investigated yet.
Results
Force reconstruction
In a first experiment, increasing normal downward forces (i.e., along the z axis only) were applied on a cell by an air cylinder, yielding 15 points ranging from 0 to 2 N as given in Figure 3A. From bundle images (Fig. 3B), the variation in fiber intensity, normalized as described previously were extracted. In Figure 3C, we notice that applying force increases the fiber intensity of all fibers. This is expected as the length of the light path going from the emitting fiber to the receiving fiber (through the tracer) decreases with the deformation of the cell cap. If the system was perfect, we would have the same light intensity value along the path for all fibers. In practice, however, some parameters differ between fibers such as fiber transmittance or orientation. Calibration compensates for these fiber-specific variations. From fiber intensities, cell's deformation and the applied force
In a second experiment, we applied slantwise forces instead of normal forces (Fig. 4). These results demonstrate that our system can reconstruct not only the intensity but also the direction of the applied force.
Measurement precision and key performance factors
Several parameters of the system impose tradeoffs between precision, cost, speed, and measurement range. Cell material mechanical properties impose the range of measurable forces as the region where deformation is reversible (and ideally linear to ensure easier force reconstruction). Therefore, the higher the compression modulus, the larger is the force measurement range. Material stiffness also plays a role in the force measurement precision: for a given force, a stiffer material will deform less, generating a smaller (and harder to detect) tracer displacement. Therefore, a stiffer material increases the measurement range at the expense of the measurement precision. Accuracy in tracer displacement measurement is driven by both optical and geometric considerations. Cell size and optical isolation, tracer size, optical fiber sizes, and orientation are the most important parameters. Interestingly, for a given combination of the aforementioned parameters, there is a large margin of improvement in choosing the light source and imaging system. The quality of the CMOS/charged coupled device sensor and more generally of the reception bundle imaging system conditions importantly the overall measurement precision and acquisition speed. This large contribution of standard components' quality (such as CMOS sensors) to our systems' performance makes it very versatile and cost-effective as will be discussed later.
To summarize, the uncertainty in the measured force comes from the uncertainty in tracer displacement and depends on the material stiffness. Estimating the tracer displacement depends mostly on the precision of fiber intensity measurement. Errors in intensity measurement come from uncorrected fluctuations from the light source, cross-contamination of fiber measurement by halo effect, and CMOS errors in intensity measurements. In our image acquisition conditions, the average standard deviation in fiber intensity was empirically measured at 1.6% before normalizing (on >100 fibers from >40 cells and compiling >10,000 measurements per fiber across the whole range of forces used in the article) and at 0.59% after normalizing, which corresponds to a signal-to-noise ratio of 8.31 and 14.0, respectively.
To evaluate more empirically our sensor precision, we conducted a reproducibility experiment where a same force was applied several times with our piston machine. We repeated 10 times 35 different force measurements ranging from 0.5 to 2.5 N along 4 different force directions. As given in Figure 5, this leads to overall reproducible changes in light intensity. The resulting average force–vector deviation was 0.26 N (average 3D deviation among the 10 predictions over all measured points). If we only consider applied force intensity (i.e., the force–vector norm) we obtained an average deviation of 0.11 N. A limitation of this experiment is that our force application system itself suffers from declining precision at low force. More precisely, under 1 N, the standard error on the applied force is rapidly ∼10% and the error on applied force can rise to >50% (see Supplementary Table S1 for details).
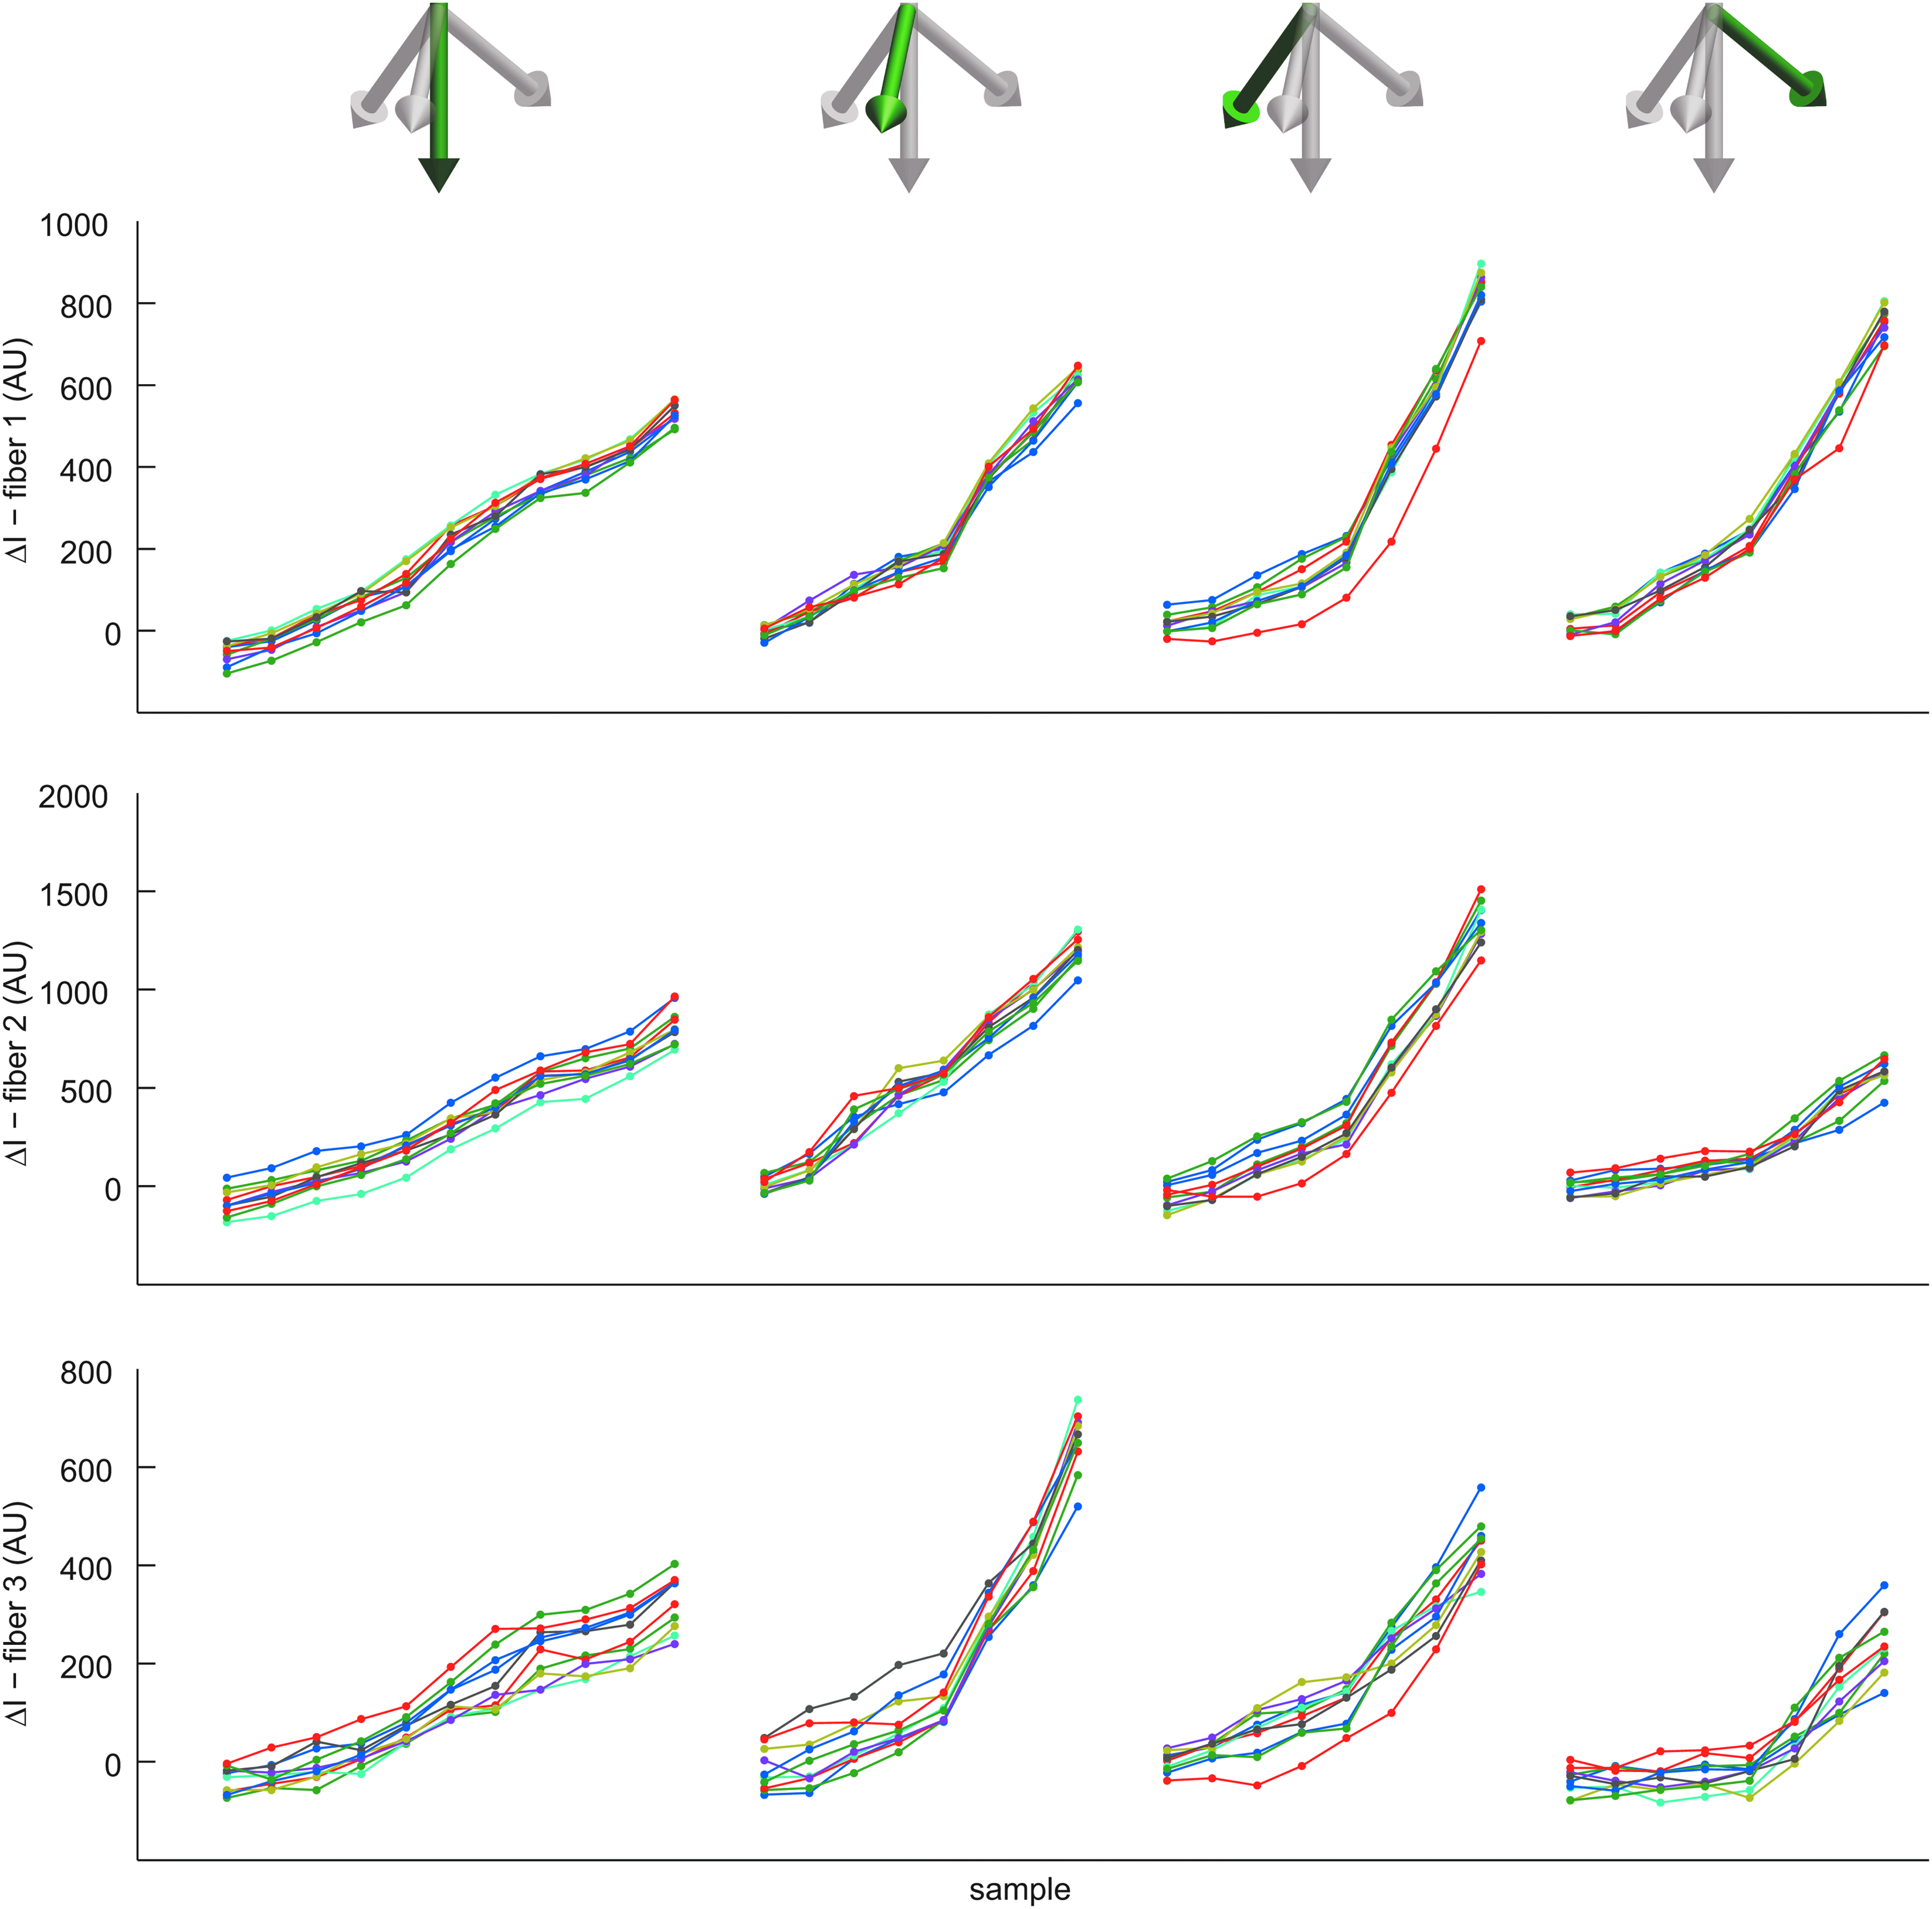
Experimental reproducibility of force measurements. Four force application sequences with distinct directions were repeated 10 times. Normalized fiber intensities for each fiber of the studied cell are reported here with distinct repetitions arbitrarily color coded. Current variance in intensity across repetitions is expected to come mostly from variations in the actual applied force and from insufficiently compensated injected light variations rather than from sensor noise.
Measurement throughput and computational burden
An important factor in several robotic applications is the throughput of the system and the computational burden involved. With the imaging system used in our prototype (1.3 Mpx), it would be possible to image simultaneously fibers of ∼280 cells. Using smaller optical fibers or a different magnification it is reasonable to expect to be able to image several thousands of cells with a standard CMOS. In our system, the exposure time was 12 ms, therefore acquisition at 80 Hz would be feasible. With a more sensitive camera or an improved optical system, much higher acquisition frequencies are possible. Once images are captured, fiber intensity extraction and normalization takes ∼80 ms per frame for 49 cells simultaneously. Force reconstruction from fiber intensity takes on average 28 ms per cell and frame. This step is the most computationally intensive and might be a current limitation for some applications. These results were obtained on a 2.5 GHz quad-core. As these timings were produced with a poorly optimized MATLAB© implementation, they are meant only to provide an upper bound of the computation burden. In addition to code optimization, closed form solution might exist and results tabulation could be used to achieve orders of magnitude faster computation. Indeed, although precise reconstruction can be currently computation intensive, determining if a given force threshold has been crossed is extremely fast, allowing the use of this solution also for time-sensitive application such as collision prevention.
Illustrating example
As a more direct illustration of the regular function of the presented system, we performed a simple experiment as given in Figure 6 and in a Supplementary Video S1. While the carpus remained resting upon the table we applied a pressing force with the index and the auricular fingers alternatively. As we can see by comparing Figure 6B and C, the index is capable of stronger force than the auricular, as expected. In addition, looking at tangential components in Figure 6B, we can see that when applying force with the auricular, the movement is less certain, with mild lateral oscillations of the digit. Also, given the respective position of the index and auricular to the point of force application (roughly at the center of the hand), forces were slightly slantwise in opposite directions for these fingers. Finally, the spatially resolved aspect of our sensor is visible by comparing Figure 6B, C with D: the auricular did not touch the latter cell although it clearly touched its neighbor with non-negligible force, showing that cells provide mechanically independent measurements.
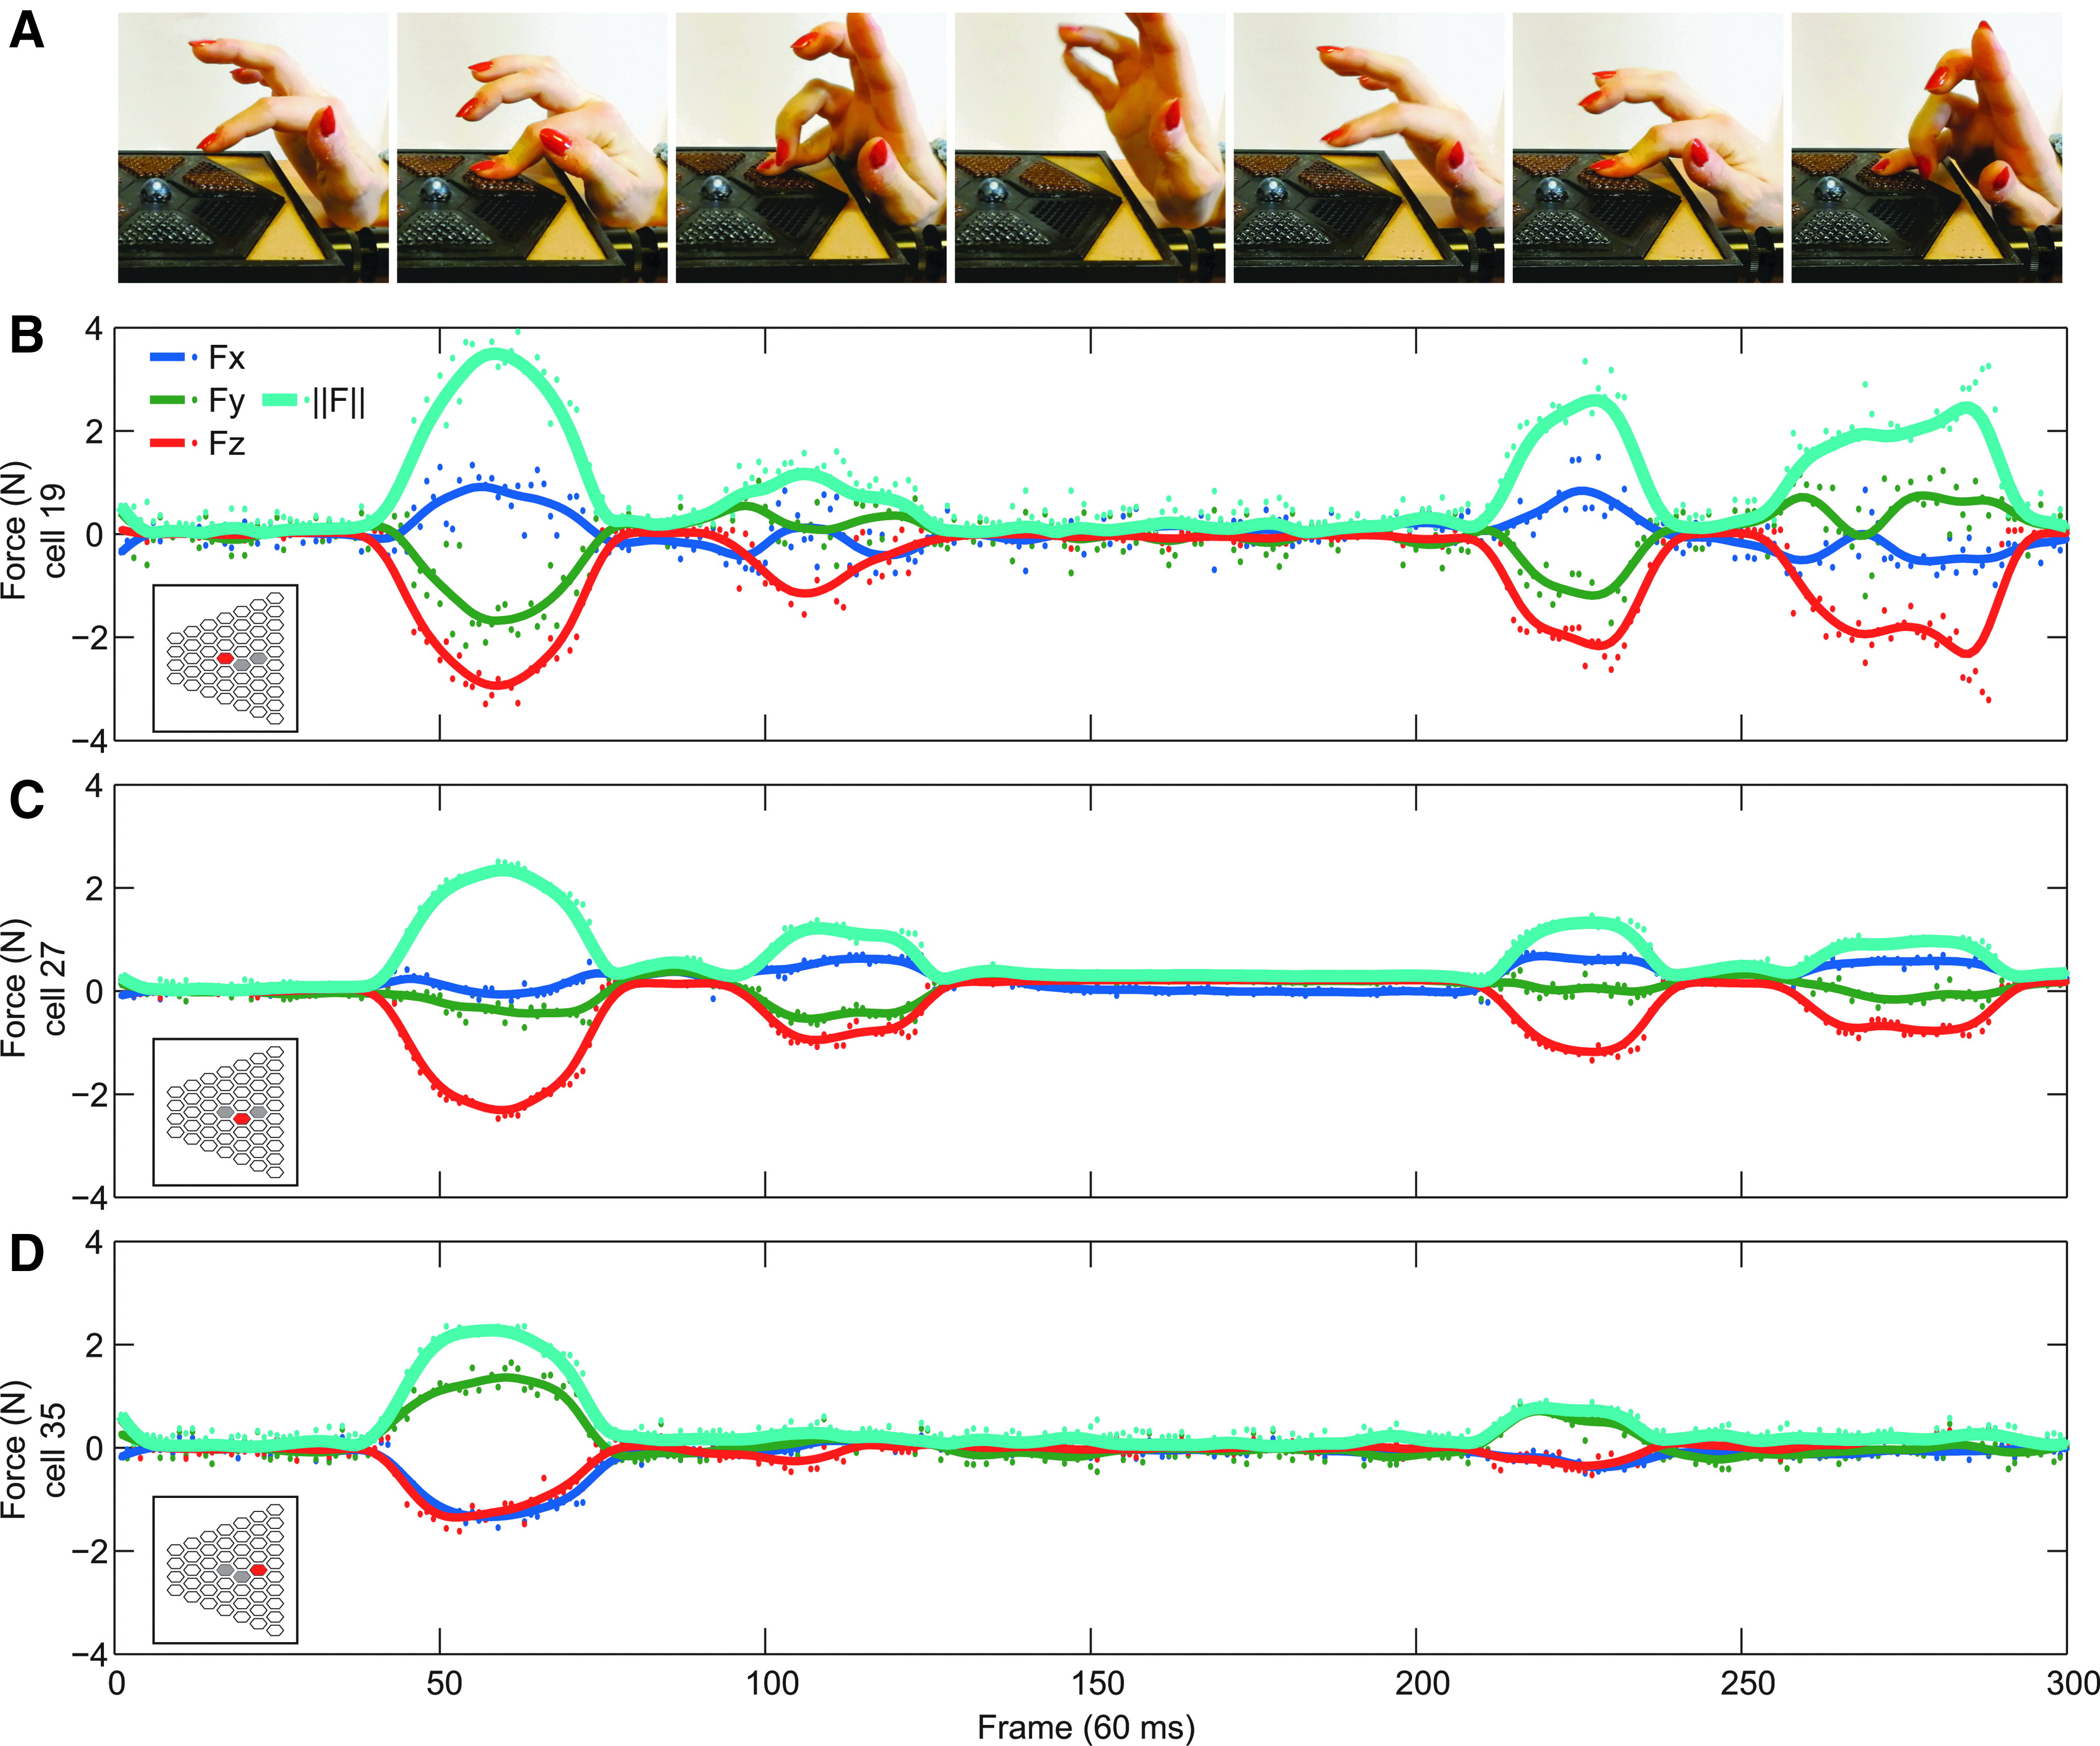
Force measurement for three different cells from a toy example of experiment where we measure the force exerted by the index and auricular fingers.
Conclusion
We presented a novel force sensor enabling the dynamic measurement of both the direction and intensity of forces in a spatially resolved manner. Modifying simple design parameters, it is possible to tune its key properties. Playing on cell size alters the spatial resolution of measurements and playing on cell stiffness defines the range of measurable force. Because of its modular architecture, the sensing surface can take varied shapes. Using a flat prototype, we demonstrated that it can reconstruct accurately and repeatedly the applied force vector on the target range of 0–2.5 N in at least a 65° cone. In its current configuration, this sensor is adapted to the study of small animals or for precision grasps in robotic hands. Forthcoming applications include the use of a cylindrical version of the sensor to measure in situ for the first time, friction forces repartition on hands and feet during arboreal locomotion. This will provide unique insights for climbing biomechanics in primates by revealing the mechanical cues allowing them to move along branches without falling.
Tangential forces also play a key role in grasping complex, deformable, and unknown objects. Mirroring the upcoming characterization of animal hands and feet, it would be informative to equip a robotic hand with our force sensors at its “fingertips” in a similar way as in previous works.15,16 This would allow to compare the grasping performance when using proprioception only, proprioception and pressure information, or proprioception and 3D force information. This would provide an objective assessment of the impact of the somesthesis degree on the performance of grasping and haptic exploration. In addition, it could motivate the inclusion of this sensor as a component of smart skins.
Besides these prospective research directions, several technical improvements and extensions should be considered. Unlike most current pressure or force sensors, our system is based on an optical measurement of deformations. This engineering direction, which was set aside for nearly two decades, now benefits from game-changing innovations in digital imaging with CMOS, light sources with LEDs, and light guiding with POFs. Of importance, our measurements do not require sophisticated optical hardware such as interferometry-based sensors. We used inexpensive and flexible POFs as light pipes to supply light to sensing elements and back to a central measurement system. This architecture ensures immunity to electromagnetic interference and a low consumption compared with electrical wiring. In addition, the quantity of fibers could be further reduced using wavelength multiplexing. We used a single CMOS sensor to measure the light intensity of each individual fiber for all cells simultaneously. This means that, to a large extent, both the performance (in terms of precision, acquisition speed, or throughput) and cost of this solution depend upon the choice of the imaging system. This ensures great versatility as a same cell sensor array can easily be coupled with either a high-end imaging equipment to provide scientific grade force measurements and a mass market imaging system yielding a miniaturized or cost-effective spatially resolved 3D force sensor. These considerations about image capture also extend to the whole data acquisition and processing chain. Indeed, having image-based measurements, it may be possible to adapt vision-specific hardware and software (e.g., GPUs or FPGA) to improve the postprocessing chain performance in a similar spirit as given in Ascari et al. 14 Most existing force/pressure measurement technology requires custom-build electronics, for which cost and performance are driven by capital-intensive R&D. Each improvement requires additional R&D and therefore an increase in cost. In contrast, our system is directly connected to standard components and consequently directly benefits from both the economy of scale and the innovation pace of one of the largest and most competitive market in electronics.
Concerning the sensor body, using microfabrication techniques such as soft lithography could enable several promising adaptations upon the presented design. Optical fibers could be replaced by ribbons of soft micrometric light pipes, improving the sensor integration. In addition, it could simplify the assembly process and enable the production of sensors with smaller cells and thus, higher spatial resolution. Finally, it could reduce manufacturing variability, increasing altogether sensor performance.
Footnotes
Acknowledgments
This work was partially supported by the French PIA IDEFI grant (ANR11-IDFI-0023, Institut Innovant de Formation par la Recherche) and by the SATT Lutech technological transfer company, Paris, France. The authors are grateful to the CR2P laboratory (Centre de Recherche sur la Paléobiodiversité et les Paléoenvironnements, UMR 7207, MNHN, CNRS, UPMC, France) and the CRI (Center for Research and Interdisciplinarity) for granting access to their facilities.
The authors thank Elie Brami for his significant contribution to prototype construction and Hélène Salin, Max Lesaffre, Maxime Huynh, Eric Tordjeman, and Damien Bretegnier for their help and support. Both authors were supported by the FdV (Frontière du Vivant) doctoral school and the University Paris Diderot.
Author Disclosure Statement
No competing financial interests exist.
References
Supplementary Material
Please find the following supplemental material available below.
For Open Access articles published under a Creative Commons License, all supplemental material carries the same license as the article it is associated with.
For non-Open Access articles published, all supplemental material carries a non-exclusive license, and permission requests for re-use of supplemental material or any part of supplemental material shall be sent directly to the copyright owner as specified in the copyright notice associated with the article.