
Abstract
The microenvironment within lymph nodes plays a pivotal role in the pathogenesis of follicular lymphoma (FL), a malignancy characterized by the accumulation of neoplastic B cells. Here, we report that human FL lymph node mesenchymal stromal cells (FLSCs) display surface protein expression profiles consistent with the standard phenotypic criteria for human mesenchymal stromal/stem cells (MSCs), yet exhibit reduced mesenchymal differentiation capability. FLSCs did not show the typical immunomodulatory protein expression patterns observed in fibroblastic reticular cells, marginal reticular cells, or follicular dendritic cells, as they expressed chemokine (C-X-C motif) ligand 13 and podoplanin but lacked chemokine (C-C motif) ligand 19 and complement receptor 1/2. Functionally, FLSCs exhibited superior FL cell survival-supportive capability in cocultures compared with bone marrow MSCs. This supportive effect was reduced when the cell culture inserts were used. In addition, this supportive capability was accompanied by reduced levels of B-cell-supportive soluble factors such as interleukin-6, regardless of the presence of cell culture inserts. Thus, both cell–cell contact-dependent and -independent mechanisms are involved in this process. Comprehensive transcriptomic analysis revealed that transcription factor paired-like homeodomain 1 (PITX1) is downregulated in FLSCs. Given that PITX1 regulates human telomerase reverse transcriptase (hTERT) transcription, FLSCs exhibited longer telomeres and a higher population-doubling capacity than MSCs. Furthermore, FLSCs expressed elevated podoplanin, whereas MSCs did not. Notably, hTERT-transfected MSCs also showed increased podoplanin expression, suggesting a positive association between hTERT and podoplanin. In summary, our findings indicate that FLSCs deviate from classical MSCs in their differentiation potential and instead exhibit a protumorigenic phenotype. This phenotype supports FL cell survival and is potentially mediated by an aberrant PITX1–hTERT–podoplanin signaling axis. These results highlight the critical role of FLSCs in the FL lymph node microenvironment, with implications for understanding tumor-supportive niches in FL pathogenesis.
Introduction
Follicular lymphoma (FL) is characterized by the accumulation of malignant B cells in secondary lymphoid organs. Approximately 90% of cases exhibit the t(14;18) translocation, resulting in IGH::BCL2 rearrangement in B cells. 1 However, FL onset is not solely dependent on BCL2 overexpression. 2 Recent genetic analyses have identified additional genetic abnormalities in B cells related to epigenomic alterations (e.g., lysine methyltransferase 2D, cAMP response element binding-protein-binding protein, and enhancer of zeste homolog 2), the mechanistic target of rapamycin pathway (e.g., Ras-related GTP binding C), and the B cell receptor pathway (e.g., immunoglobulin heavy chain variable region, immunoglobulin light chain variable region, Bruton’s tyrosine kinase, and CD79b), which are crucial for FL development and progression. 3 –5 Beyond these genetic alterations, the microenvironment also plays a critical role in FL pathogenesis, enabling malignant B cells to become immortal, proliferate excessively, and evade immune surveillance. 6
The complex microenvironment surrounding FL cells consists of various hematopoietic and immune cells, including effector CD8+ T cells, T-follicular helper cells, regulatory T cells, cytotoxic CD4+ T cells, T-follicular regulatory cells, and macrophages. 7 –10 While the clinical and biological roles of certain cells, such as T-follicular helper cells, have been well-documented in promoting disease progression through multiple cell–cell interactions, 7 the functions of other cell types remain unclear. In addition, stromal cells, which play an essential role in the functional organization of lymph nodes, are integral components of this microenvironment. 11
In this study, we investigated the characteristics of human FL lymph node mesenchymal stromal cells (FLSCs) using a range of techniques, including cell culture, immunophenotyping, molecular analysis, functional assays, and in vivo bone formation assays. A comprehensive mRNA expression study via microarray analysis was conducted to identify the unique genes expressed by FLSCs. Furthermore, we examined the role of FLSCs in supporting the survival of FL cells and assessed the effects of lenalidomide, a commonly used immunomodulatory drug (IMiD) for FL treatment, on FLSCs. 12,13
Materials and Methods
Processing of lymph node specimens
Ten lymph nodes (F1–F10) from patients with FL were analyzed. Five samples (F1–F5) were selected based on the adequacy of the material for detailed examination. The lymph node specimens were minced into small pieces, mechanically disrupted using a sterile syringe plunger and subsequently passed through a 70-μm strainer to create a single-cell suspension. Anti-human CD19 immunomagnetic microbeads (Miltenyi Biotec, Bergisch Gladbach, Germany) were used to isolate lymphoma cells. The CD19-negative fractions were then seeded onto 15-cm culture dishes at a density of 1 × 10⁶ cells per dish. An overview of cell isolation from lymph node specimens for application is presented in Figure 1.
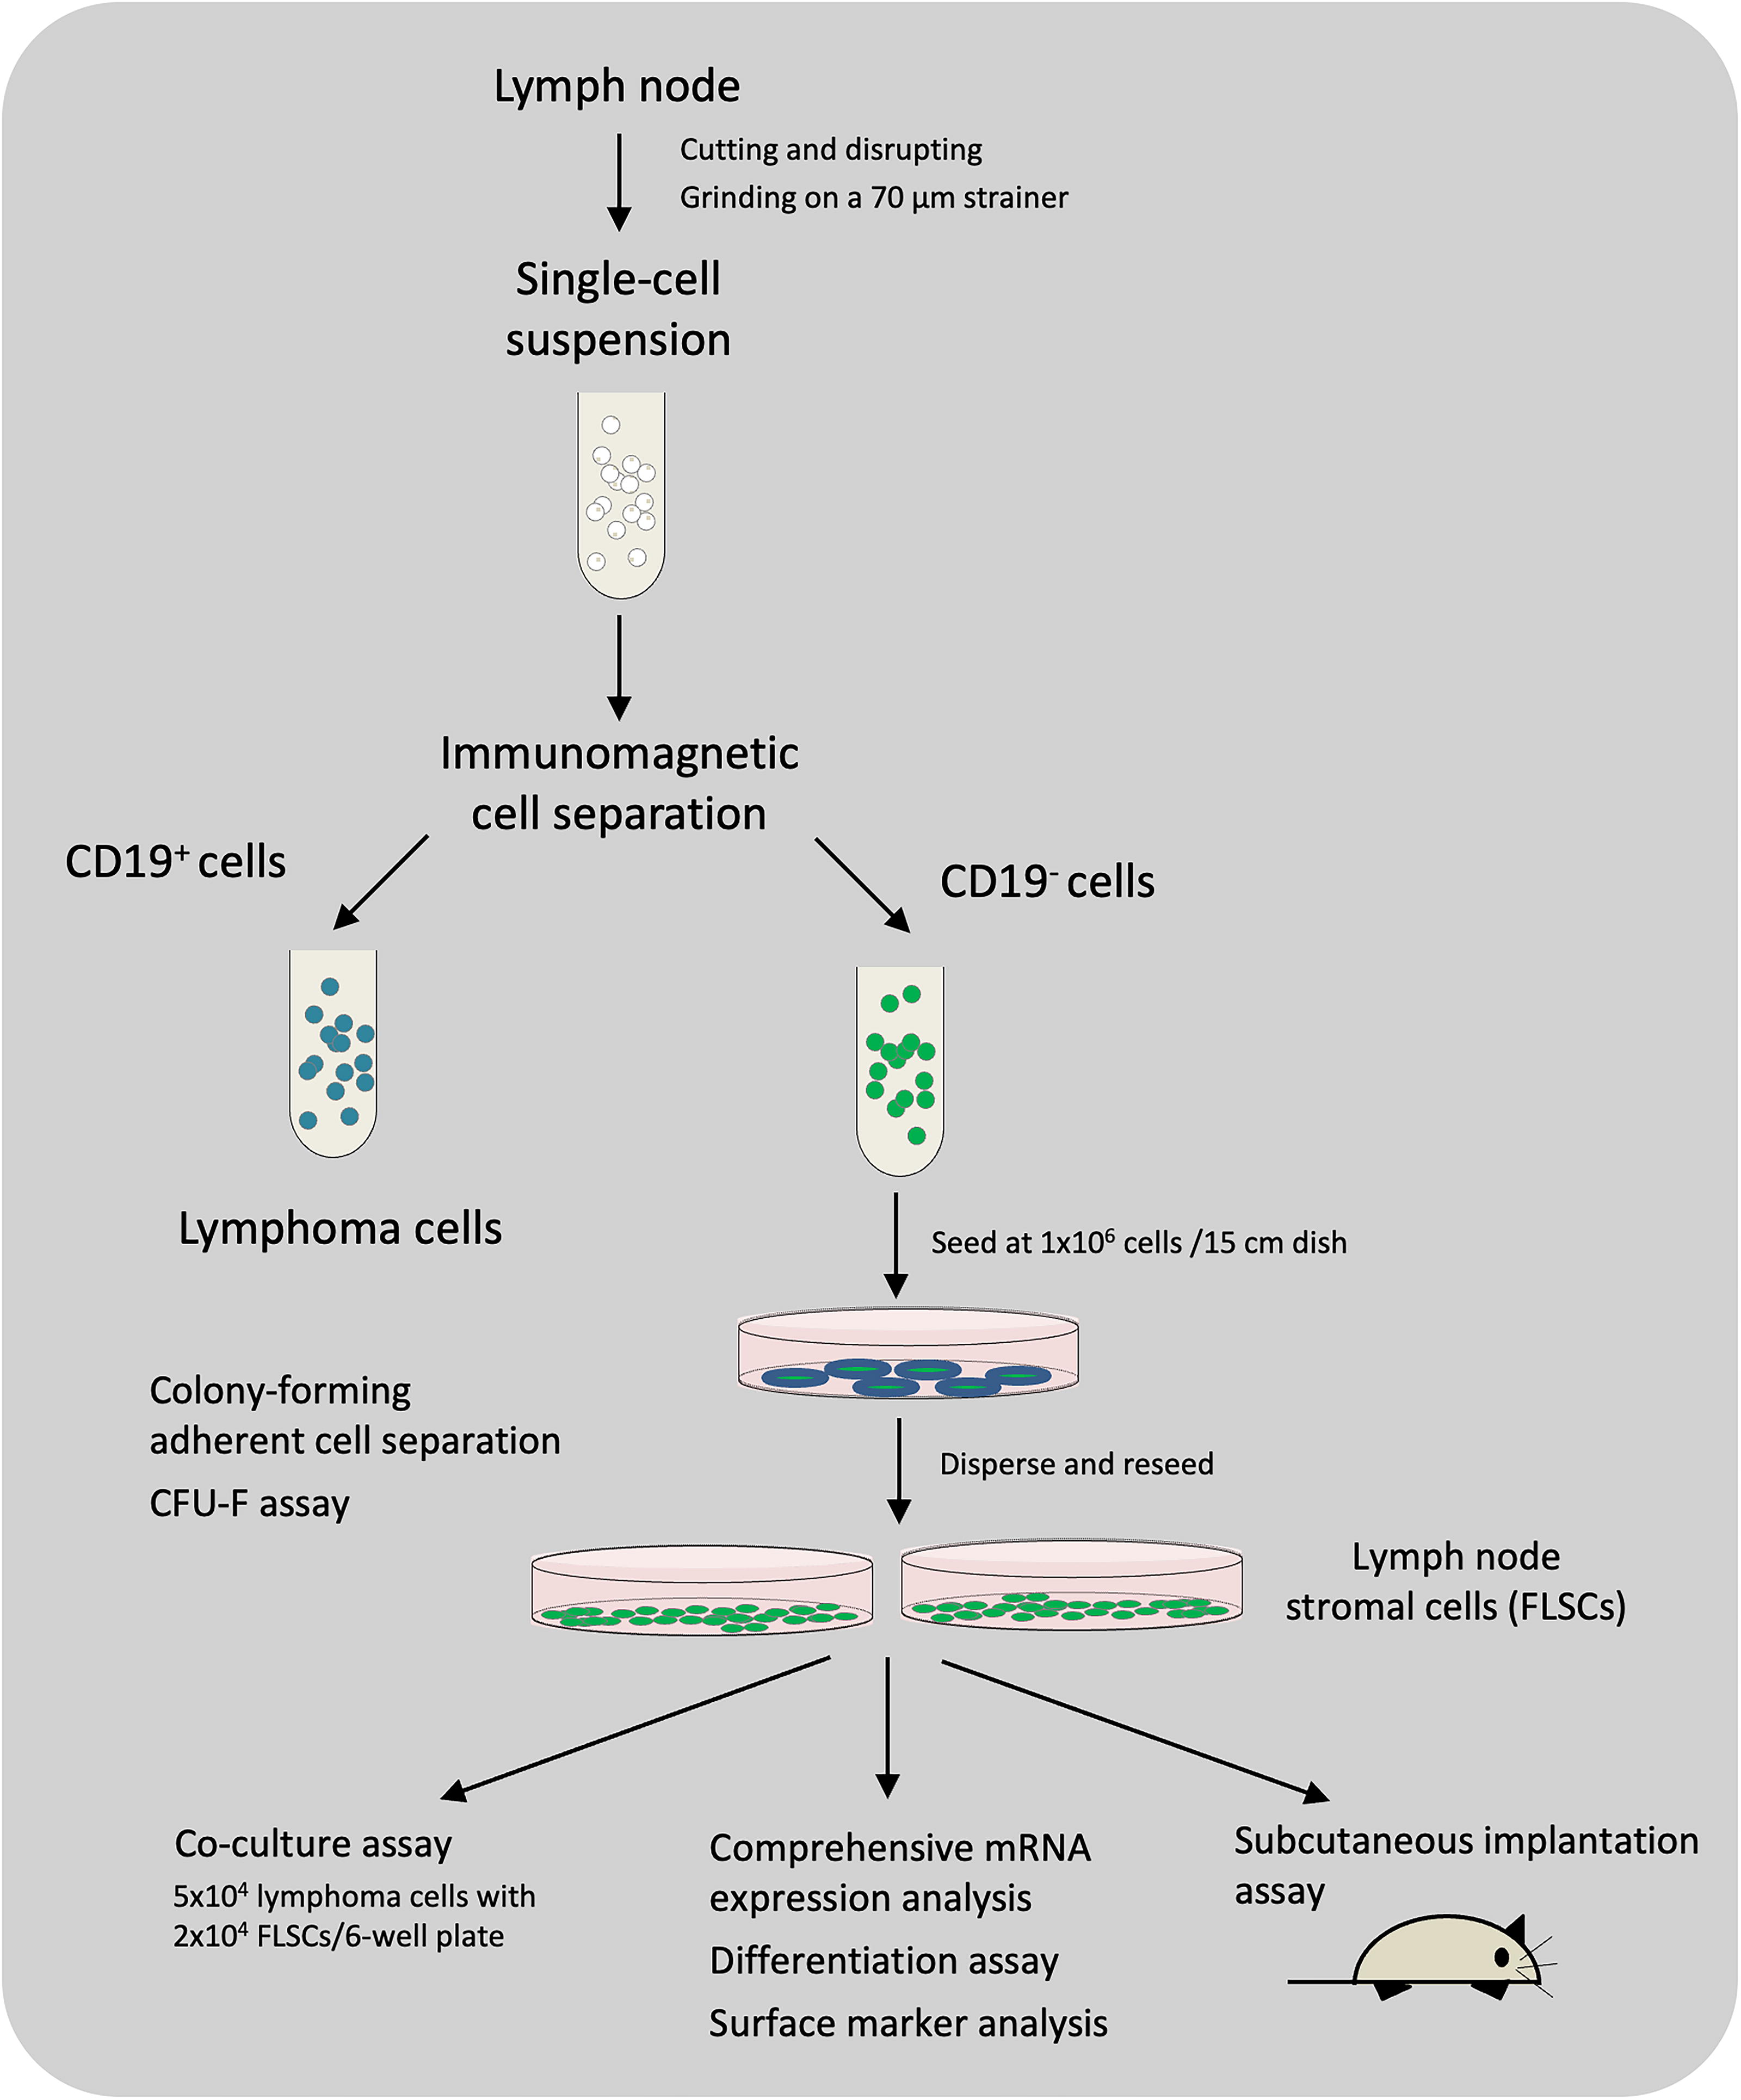
An overview from cell isolation from lymph node specimens to application.
Cell culture conditions
Adherent cells were cultured in advanced minimal essential medium (Invitrogen/Thermo Fisher Scientific, Waltham, MA), supplemented with 5% fetal bovine serum (FBS, Invitrogen/Thermo Fisher Scientific), 100 μM ascorbic acid (Fujifilm Wako Pure Chemical Corporation, Osaka, Japan), 2 mM L-glutamine, 100 U/mL penicillin, and 100 μg/mL streptomycin (all from Gibco/Thermo Fisher Scientific), according to established protocols for the isolation of bone marrow mesenchymal stromal/stem cells (MSCs). 14 The primary cultures were passaged to disperse colony-forming cells (passage 1), and cells between passages 1 and 3 were used as FLSCs for the study. Approval was obtained from the ethics committee of Kyoto University Hospital (#G697) and informed consent was obtained from all participants. For comparative purposes, human bone marrow MSCs (AllCells, Emeryville, CA) were cultured using previously described methods. 15 Human bone marrow MSCs transfected with human telomerase reverse transcriptase (hTERT) were generously provided by Dr. Yonghui Jin at Kyoto University. 16
Cell culture experiments
For coculture experiments, 2 × 10⁴ FLSCs were seeded in 6-well plates. After 48 h, autologous lymphoma cells were added to the FLSC cultures and maintained in RPMI 1640 medium (Fujifilm Wako Pure Chemical Corporation) supplemented with 10% heat-inactivated FBS, 2 mM L-glutamine, 100 U/mL penicillin, and 100 µg/mL streptomycin. In some experiments, FLSCs were pretreated with lenalidomide 17 (AdooQ Bioscience, Irvine, CA) or pomalidomide 17 (MedChemExpress, Monmouth Junction, NJ) before the addition of lymphoma cells.
Flow cytometric analysis
Single-cell suspensions of FLSCs were stained with fluorescence-conjugated antibodies and subsequently analyzed using a FACSCanto II flow cytometer (Becton Dickinson, Franklin Lakes, NJ). The antibodies used for staining are listed in Supplementary Table S1. Data analysis was performed using the FlowJo software (BD Biosciences, Franklin Lakes, NJ). Telomere length was determined using a Telomere PNA Kit/FITC for Flow Cytometry (DAKO/Agilent Technologies, Santa Clara, CA), following the manufacturer’s instructions. The results were expressed as the mean fluorescence intensity relative to hTERT-transfected human bone marrow MSCs.
Colony-forming unit-fibroblast and multilineage differentiation assays
The colony-forming unit-fibroblast (CFU-F) assay was conducted as described previously. 18 Multilineage differentiation assays were performed as previously described. 19
In vivo bone formation assay
FLSCs (1 × 10⁶ cells) were seeded onto a hydroxyapatite/poly(D,L-lactic-co-glycolic acid) scaffold (50 wt% hydroxyapatite, 5 mm diameter, GC Corporation, Tokyo, Japan) and cultured at 37°C in 5% CO2 for 1 h, as previously described. 20 The cell-seeded scaffolds were then implanted subcutaneously into the dorsal surface of 7–9-week-old nonobese/severe combined immunodeficient mice (Clea Japan, Tokyo, Japan). 21 After 10 weeks, the implants were harvested. Bone formation was evaluated by hematoxylin and eosin staining of paraffin-embedded sections. Animal experiments were conducted under specific pathogen-free conditions at the Institute of Laboratory Animals, Kyoto University, with ethical approval from the Committee on Animal Research of Kyoto University Faculty of Medicine.
Quantitative real-time PCR
Quantitative real-time PCR was performed according to the established protocols. 22 Total RNA was extracted using the QIAamp RNA Blood Mini Kit (Qiagen Japan, Tokyo, Japan) and reverse-transcribed. Each reaction mixture (20 μL) included TaqMan Master Mix (Roche, Basel, Switzerland), cDNA, specific primers, and a TaqMan probe from the Universal Probe Library. Amplification was performed on a StepOne Real-Time PCR System (Applied Biosystems, Waltham, MA) with the following cycling conditions: initial denaturation at 95°C for 10 min, followed by 40 cycles of denaturation at 95°C for 15 s and annealing/extension at 60°C for 1 min. Glyceraldehyde-3-phosphate dehydrogenase was used as an internal control. Primers and universal probes used for real-time PCR are listed in Supplementary Table S2.
Microarray analysis
Microarray analysis was performed as previously described. 23 RNA samples (1 µg each) were amplified using the Ambion Amino Allyl aRNA Kit (Ambion, Carlsbad, CA) and labeled with Cy5. Labeled samples were cohybridized with a 3D-Gene Human Oligo Chip 25k (Toray Industries, Tokyo, Japan) at 37°C for 16 h. Hybridization signals were scanned using a 3D-Gene Scanner 3000 (Toray Industries), and the data were normalized globally. The GeneSpring GX software (Tomy Digital Biology, Tokyo, Japan) was used for further data analysis. Raw data were normalized and filtered based on signal intensities within the 20th–100th percentile range.
Statistical analysis
Statistical analysis was conducted using an unpaired Student’s t-test unless otherwise specified. Bar graph data are presented as mean ± standard deviation (SD). Statistical significance was indicated as follows: *, P < 0.05; **, P < 0.01; and n.s., not significant.
Results
Surface marker expression of FLSCs
Flow cytometric analysis showed that FLSCs were positive for CD105, CD73, and CD90 but negative for CD45, CD34, CD11b, CD19, CD31, and HLA-DR (Fig. 2). Additional flow cytometric analysis of FLSCs further revealed that FLSCs were positive for chemokine (C-X-C motif) ligand 13 (CXCL13) but negative for complement receptor 1/complement receptor 2 (CR1/CR2), chemokine (C-C motif) ligand 19 (CCL19), and receptor activator of nuclear factor kappa-B ligand (RANKL) (Fig. 3A–D). The overall protein expression pattern in FLSCs was similar to that observed in MSCs. Notably, a prominent podoplanin (PDPN)-positive cell population was observed in FLSCs, whereas MSCs showed a less pronounced PDPN-positive population (Fig. 3C). Microarray analysis corroborated the expression of CXCL13 in FLSCs (Table 1). In addition, microarray analysis showed no expression of CCL19, chemokine (C-C motif) ligand 21 (CCL21), vascular cell adhesion molecule-1 (VCAM-1), or mucosal addressin cell adhesion molecule-1 (MadCAM-1), but identified intercellular adhesion molecule-1 (ICAM-1) in FLSCs compared with MSCs. Collectively, these findings indicate that FLSCs exhibit surface protein expression consistent with the phenotypic criteria for human MSCs, 24 and do not suggest that FLSCs are endothelial cells. The results also indicated that FLSCs do not display the typical protein expression profiles of fibroblastic reticular cells (FRCs), marginal reticular cells (MRCs), or follicular dendritic cells (FDCs).
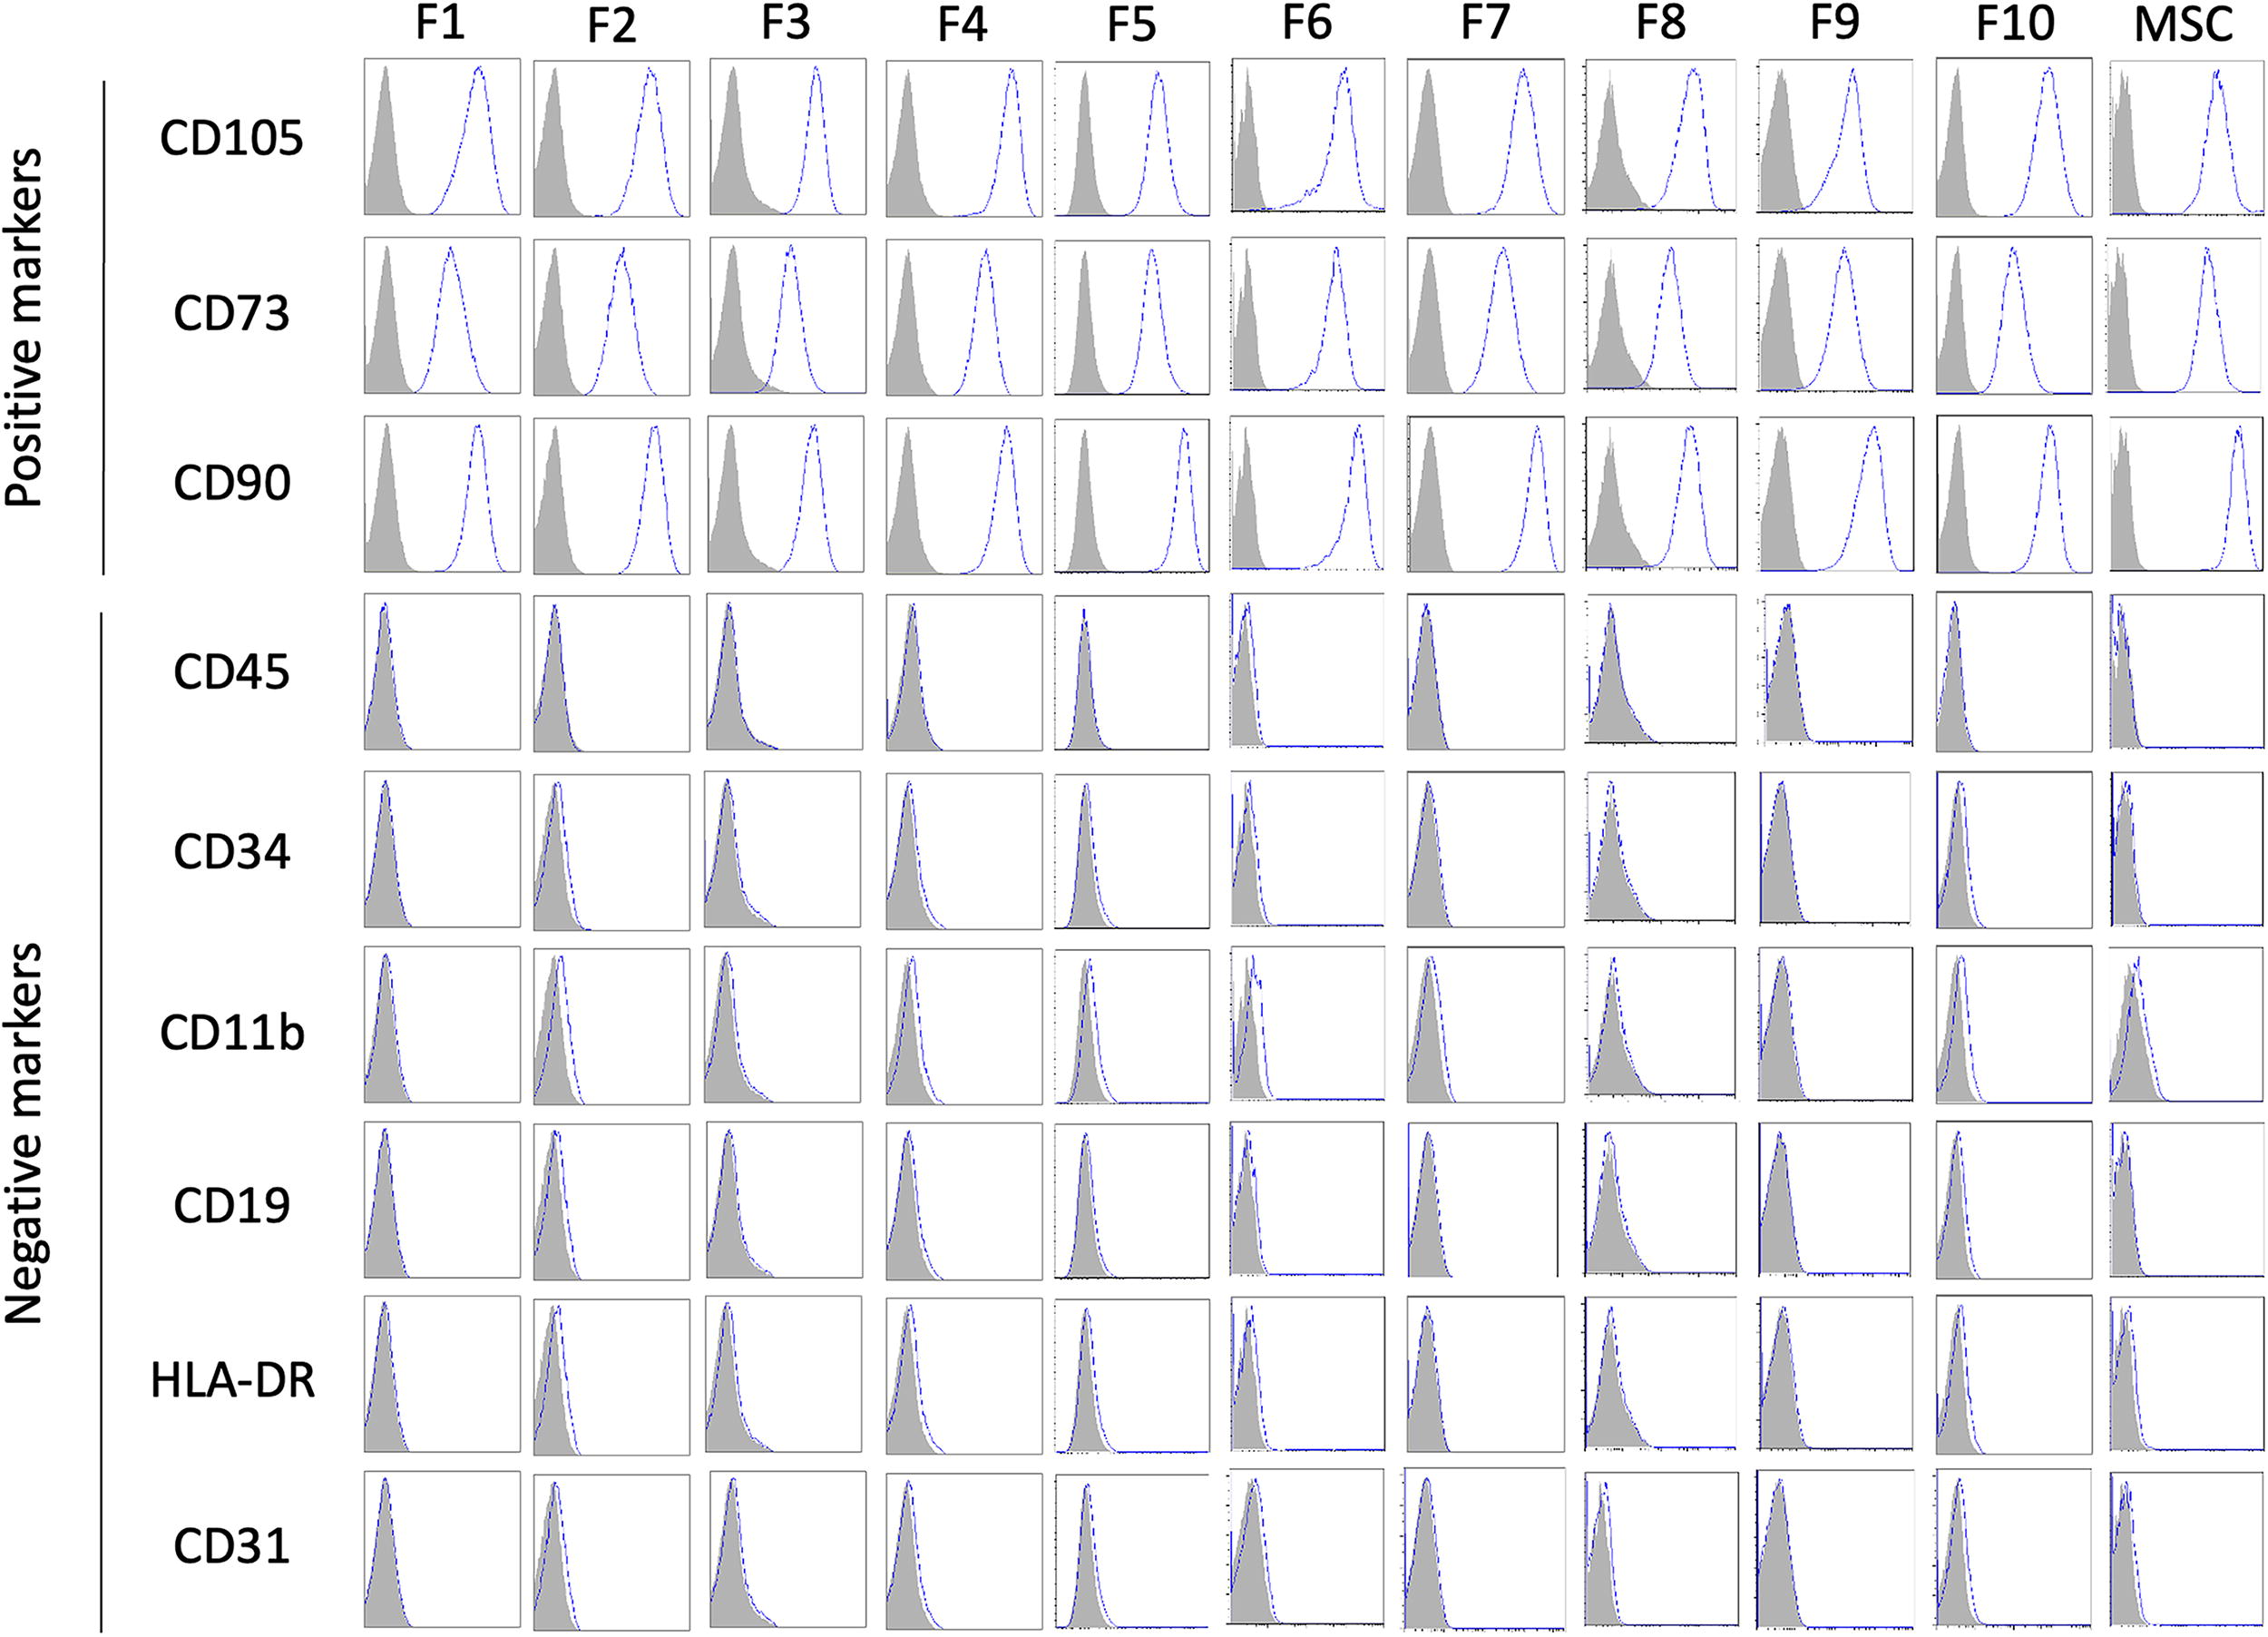
Flow cytometric analysis of surface markers in follicular lymphoma lymph node mesenchymal stromal cells (FLSCs). The expression of CD105, CD73, CD90, CD45, CD34, CD11b, CD19, HLA-DR, and CD31 was examined in FLSCs (F1–F10).
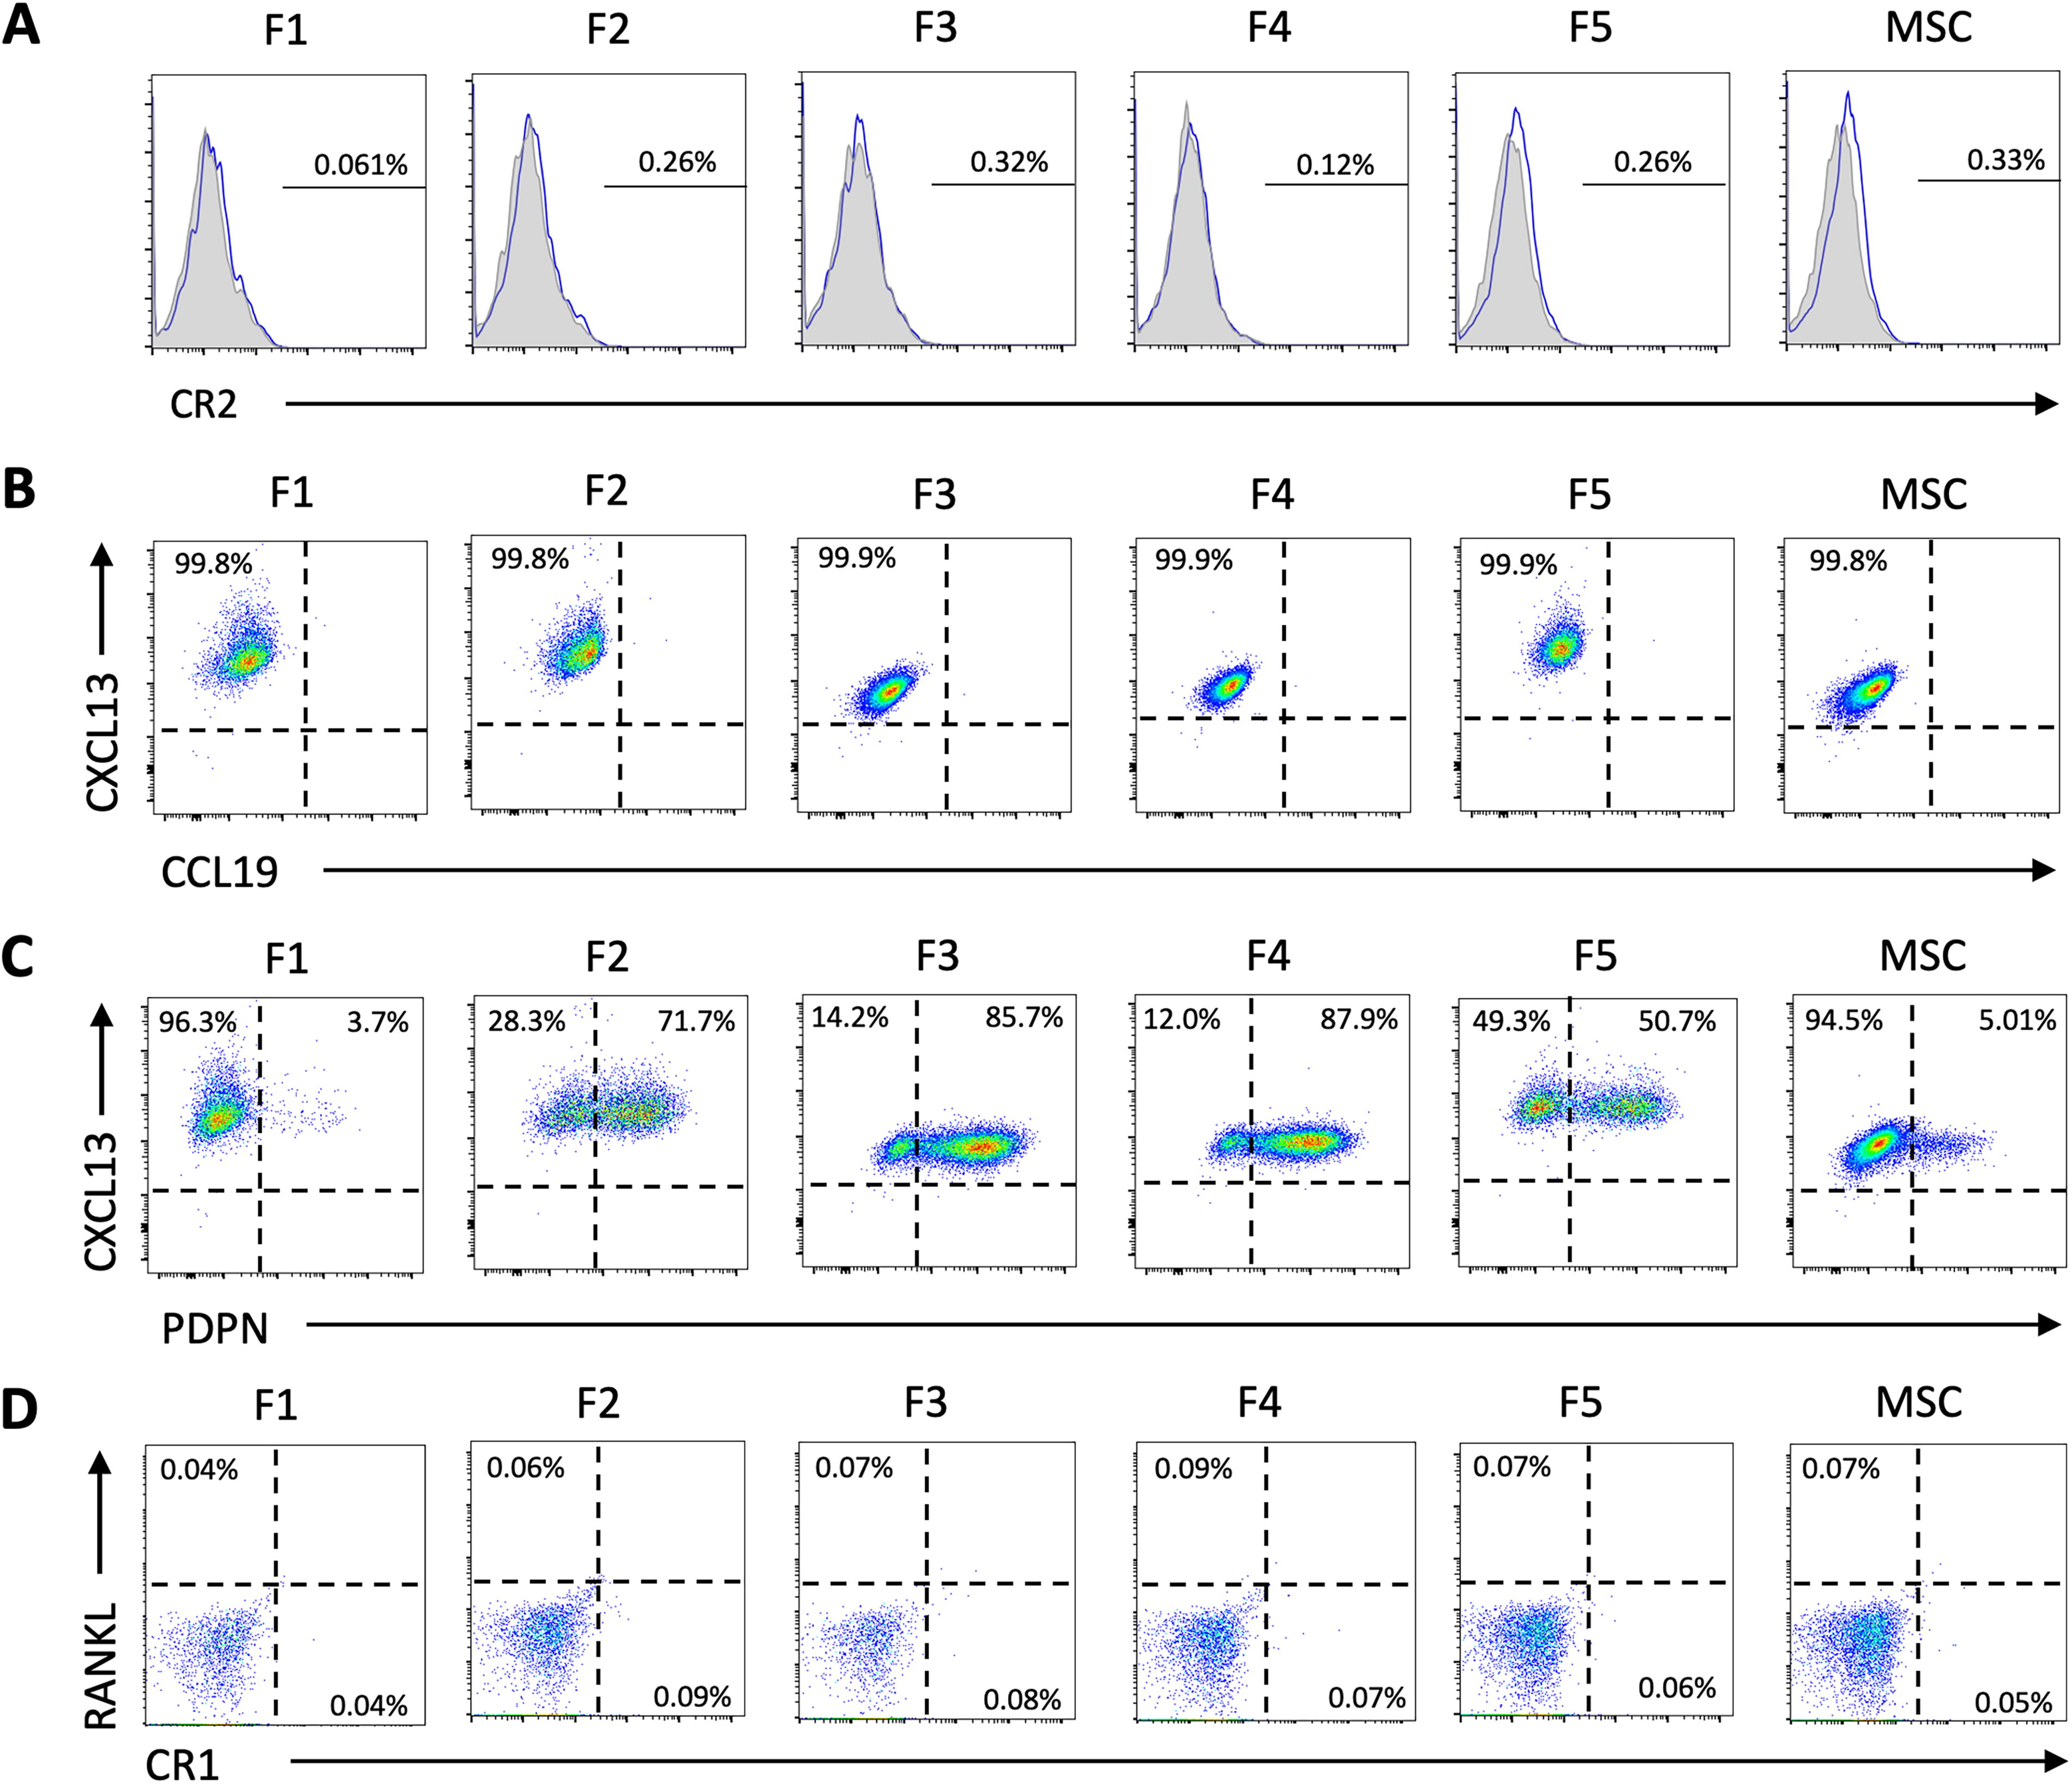
Expression of proteins related to stromal cells in FLSCs. Flow cytometric analysis was conducted on FLSCs (F1–F5) to examine the expression of complement receptor 2 (CR2)
Expression of Endothelial Cell- and Fibroblastic Reticular Cell-Related Genes and Cereblon in Follicular Lymphoma Lymph Node Mesenchymal Stromal Cells and Bone Marrow Mesenchymal Stromal/Stem Cells Determined by Microarray Analysis
FLSCs, follicular lymphoma lymph node mesenchymal stromal cells; MSCs, mesenchymal stromal/stem cells; VCAM1, vascular cell adhesion molecule-1; MADCAM1, mucosal addressin cell adhesion molecule-1; ICAM1, intercellular adhesion molecule-1; CXCL13, chemokine (C-X-C motif) ligand 13; CCL21, chemokine (C-C motif) ligand 21; CCL19, chemokine (C-C motif) ligand 19; CRBN, cereblon. The raw microarray data are openly available in the Gene Expression Omnibus (GEO) at https://www.ncbi.nlm.nih.gov/geo/, reference number GSE270555.
Multipotent mesenchymal characteristics of FLSCs
Lymph node cells obtained from patients with FL displayed colony-forming capabilities, as demonstrated by CFU-F assays, indicating clonogenic characteristics of FLSCs (Fig. 4A). Further analysis of the differentiation potential of FLSCs revealed significantly lower expression levels of adipogenic genes, such as lipoprotein lipase, fatty acid-binding protein 4, and peroxisome proliferator-activated receptor γ, compared with MSCs (Fig. 4B). Consistent with these reduced genes expression levels, fewer lipid-laden fat cells were detected in FLSCs under adipogenic induction conditions in vitro (Fig. 4C). FLSCs also exhibited low expression levels of chondrogenic genes such as aggrecan and type II collagen (Fig. 4D). Upon culture under chondrogenic induction conditions, Alcian blue staining intensity was low in FLSCs (Fig. 4E), indicating inferior chondrogenic differentiation compared with MSCs. The expression levels of osteogenic master genes runt-related transcription factor 2 and bone sialoprotein were significantly lower in FLSCs than in MSCs (Fig. 4F). Consistent with these low expression levels, calcium deposition was reduced in FLSCs under osteogenic induction conditions in vitro (Fig. 4G). A subcutaneous implantation system using immunocompromised mice was used to assess the bone-forming capacity of FLSCs in vivo. Compared with MSCs, FLSCs did not generate bone tissue (Fig. 4H, I). These findings suggest that while FLSCs exhibit clonogenicity, they have diminished multipotent mesenchymal differentiation characteristics.
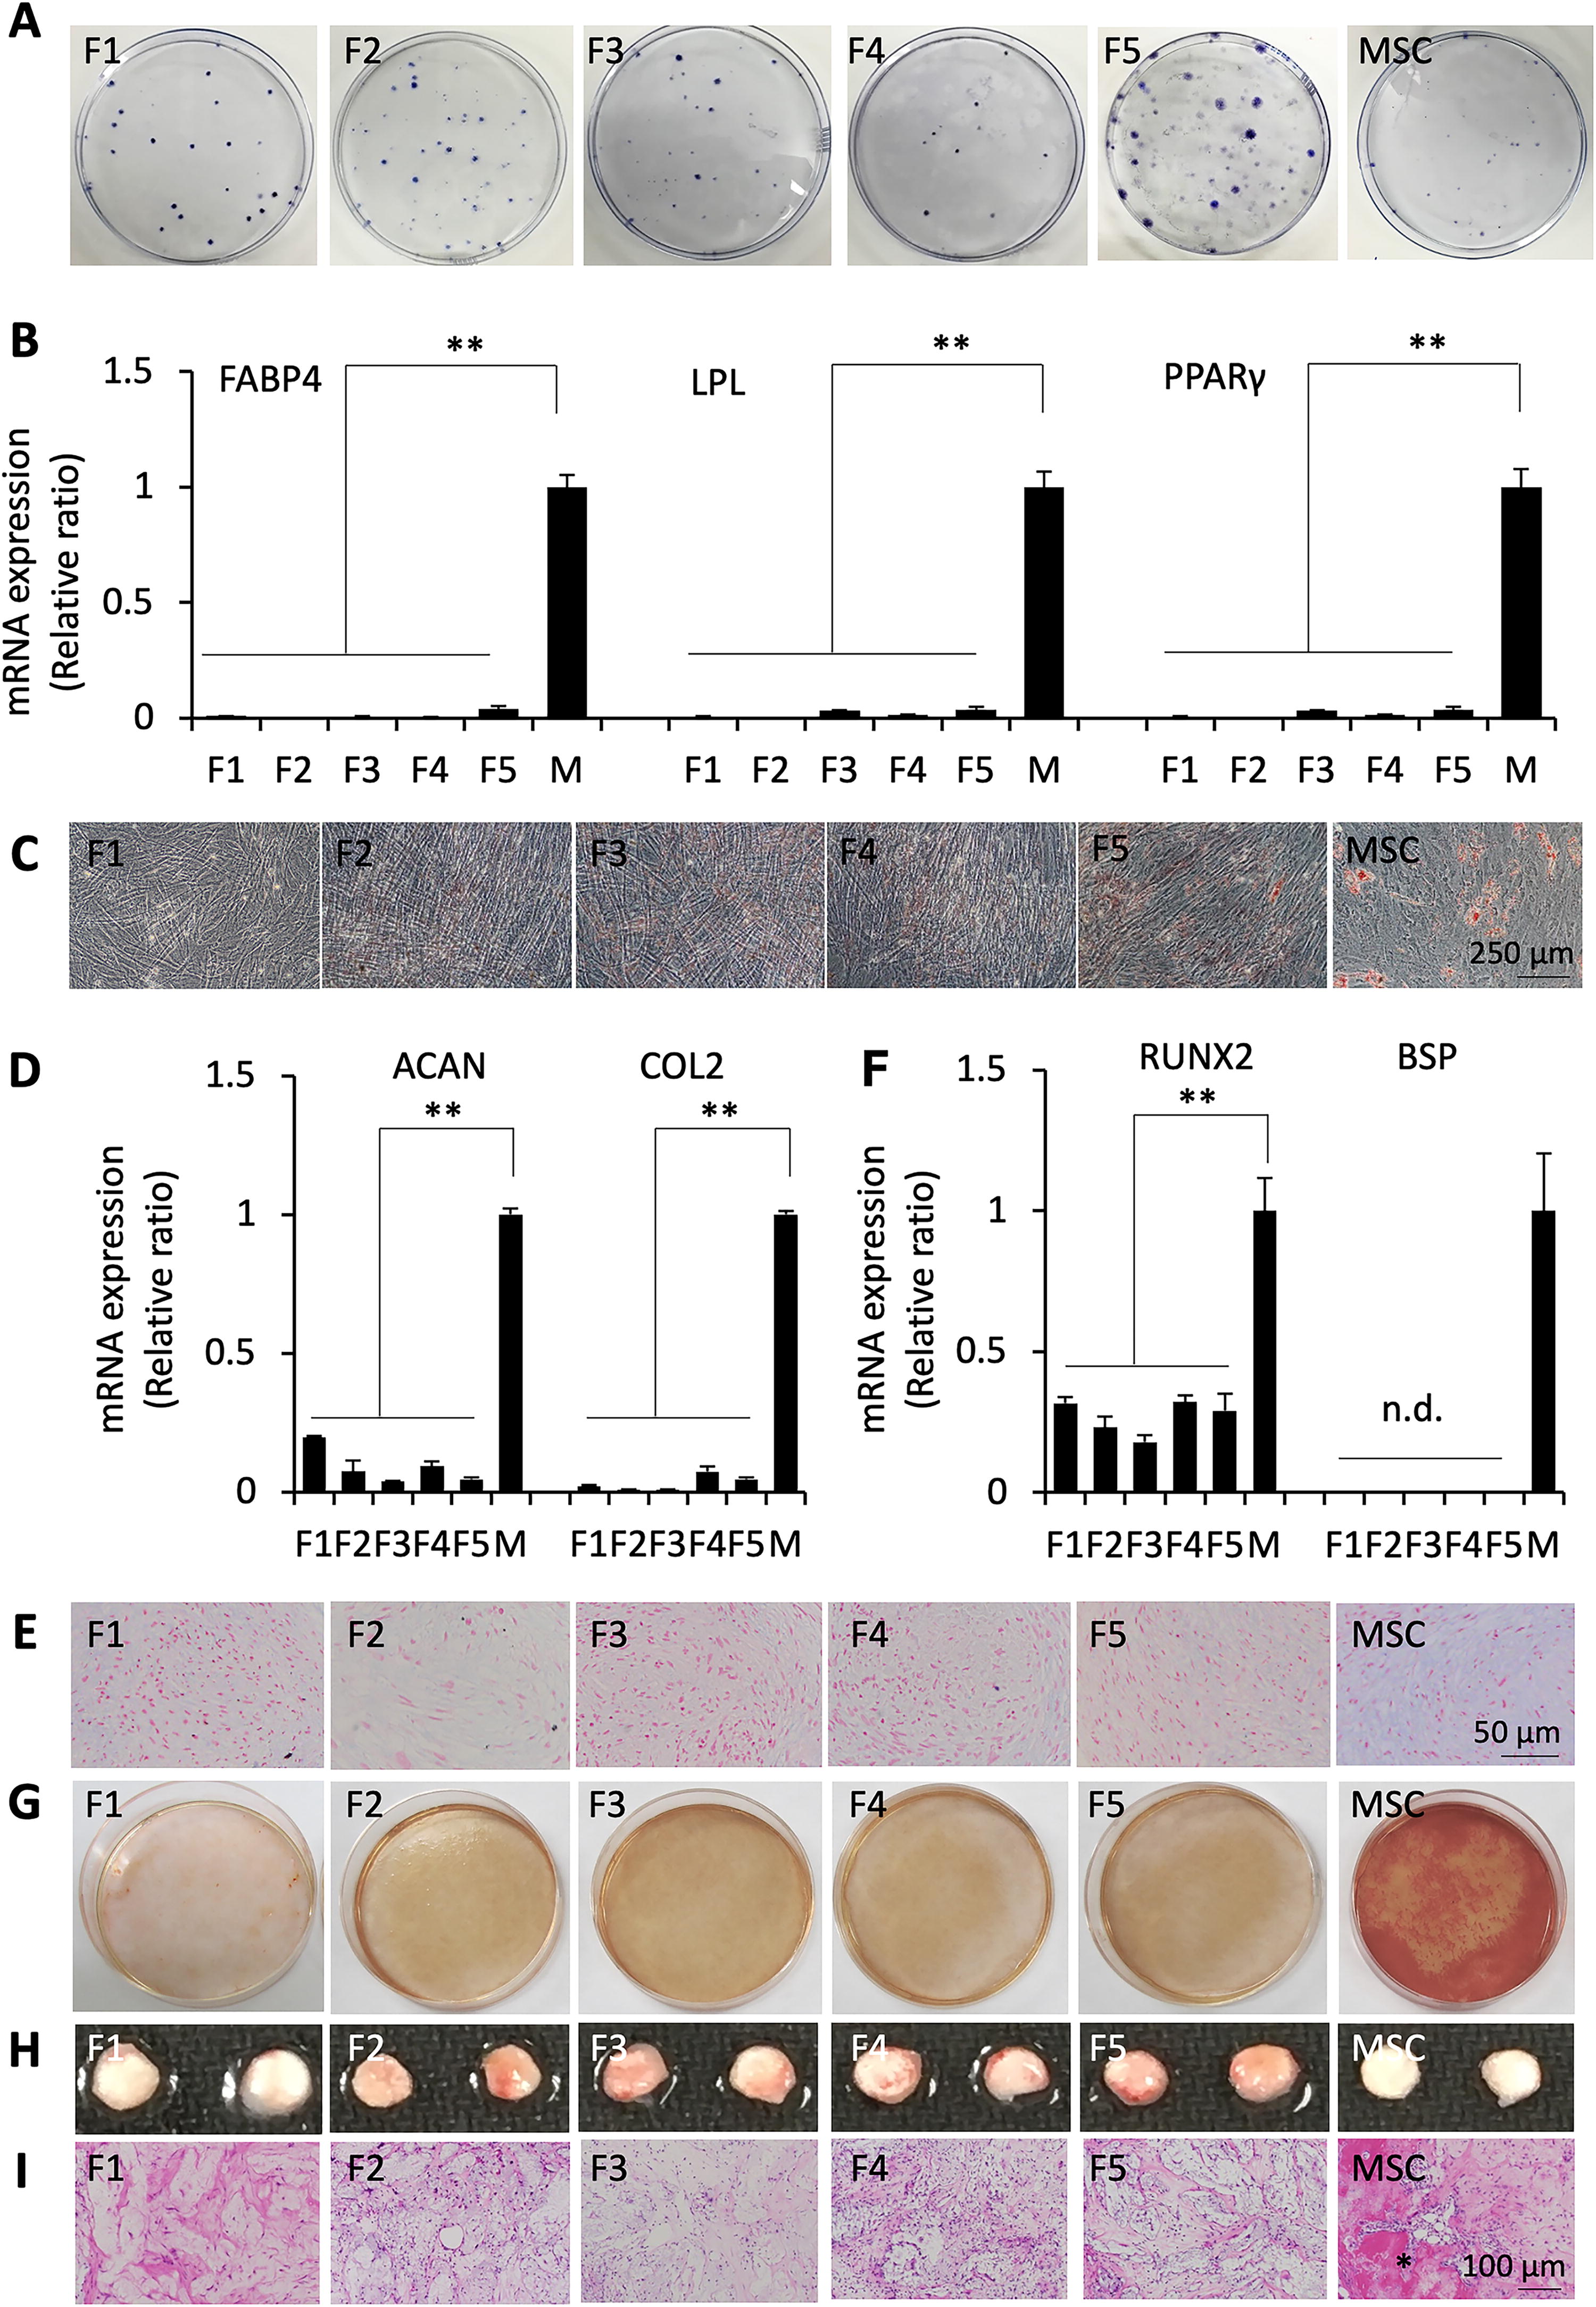
Colony-forming unit-fibroblast (CFU-F) and multilineage differentiation assays of FLSCs.
Paired-like homeodomain 1 is downregulated in FLSCs
We comprehensively examined the gene expression profiles of FLSCs by microarray analysis. Hierarchical clustering analysis revealed that five batches of FLSCs and three batches of MSCs exhibited closely related gene expression patterns, with distinct separation between the two groups (Fig. 5A). Multiple genes associated with osteogenesis were downregulated in FLSCs (Fig. 5B), confirming the poor osteogenic characteristics observed in in vitro and in vivo experiments. Twenty-two genes were downregulated more than two-fold in all five FLSC samples (Fig. 5C). Paired-like homeodomain 1 (PITX1) was the most significantly downregulated gene in FLSCs (Fig. 5C, D). Quantitative RT-PCR analysis confirmed that mRNA expression of PITX1 was lower in FLSCs than in MSCs (Fig. 5E). In addition, telomere length ranged from 76.6 to 87.2 in FLSCs, compared with an average of 50.0 in MSCs, indicating significantly longer telomeres in FLSCs (Fig. 5F). Consistently, the population doubling level of FLSCs was higher than that of MSCs (Fig. 5G). These findings suggest that the downregulation of PITX1 may be associated with increased telomere length and faster doubling times in FLSCs.
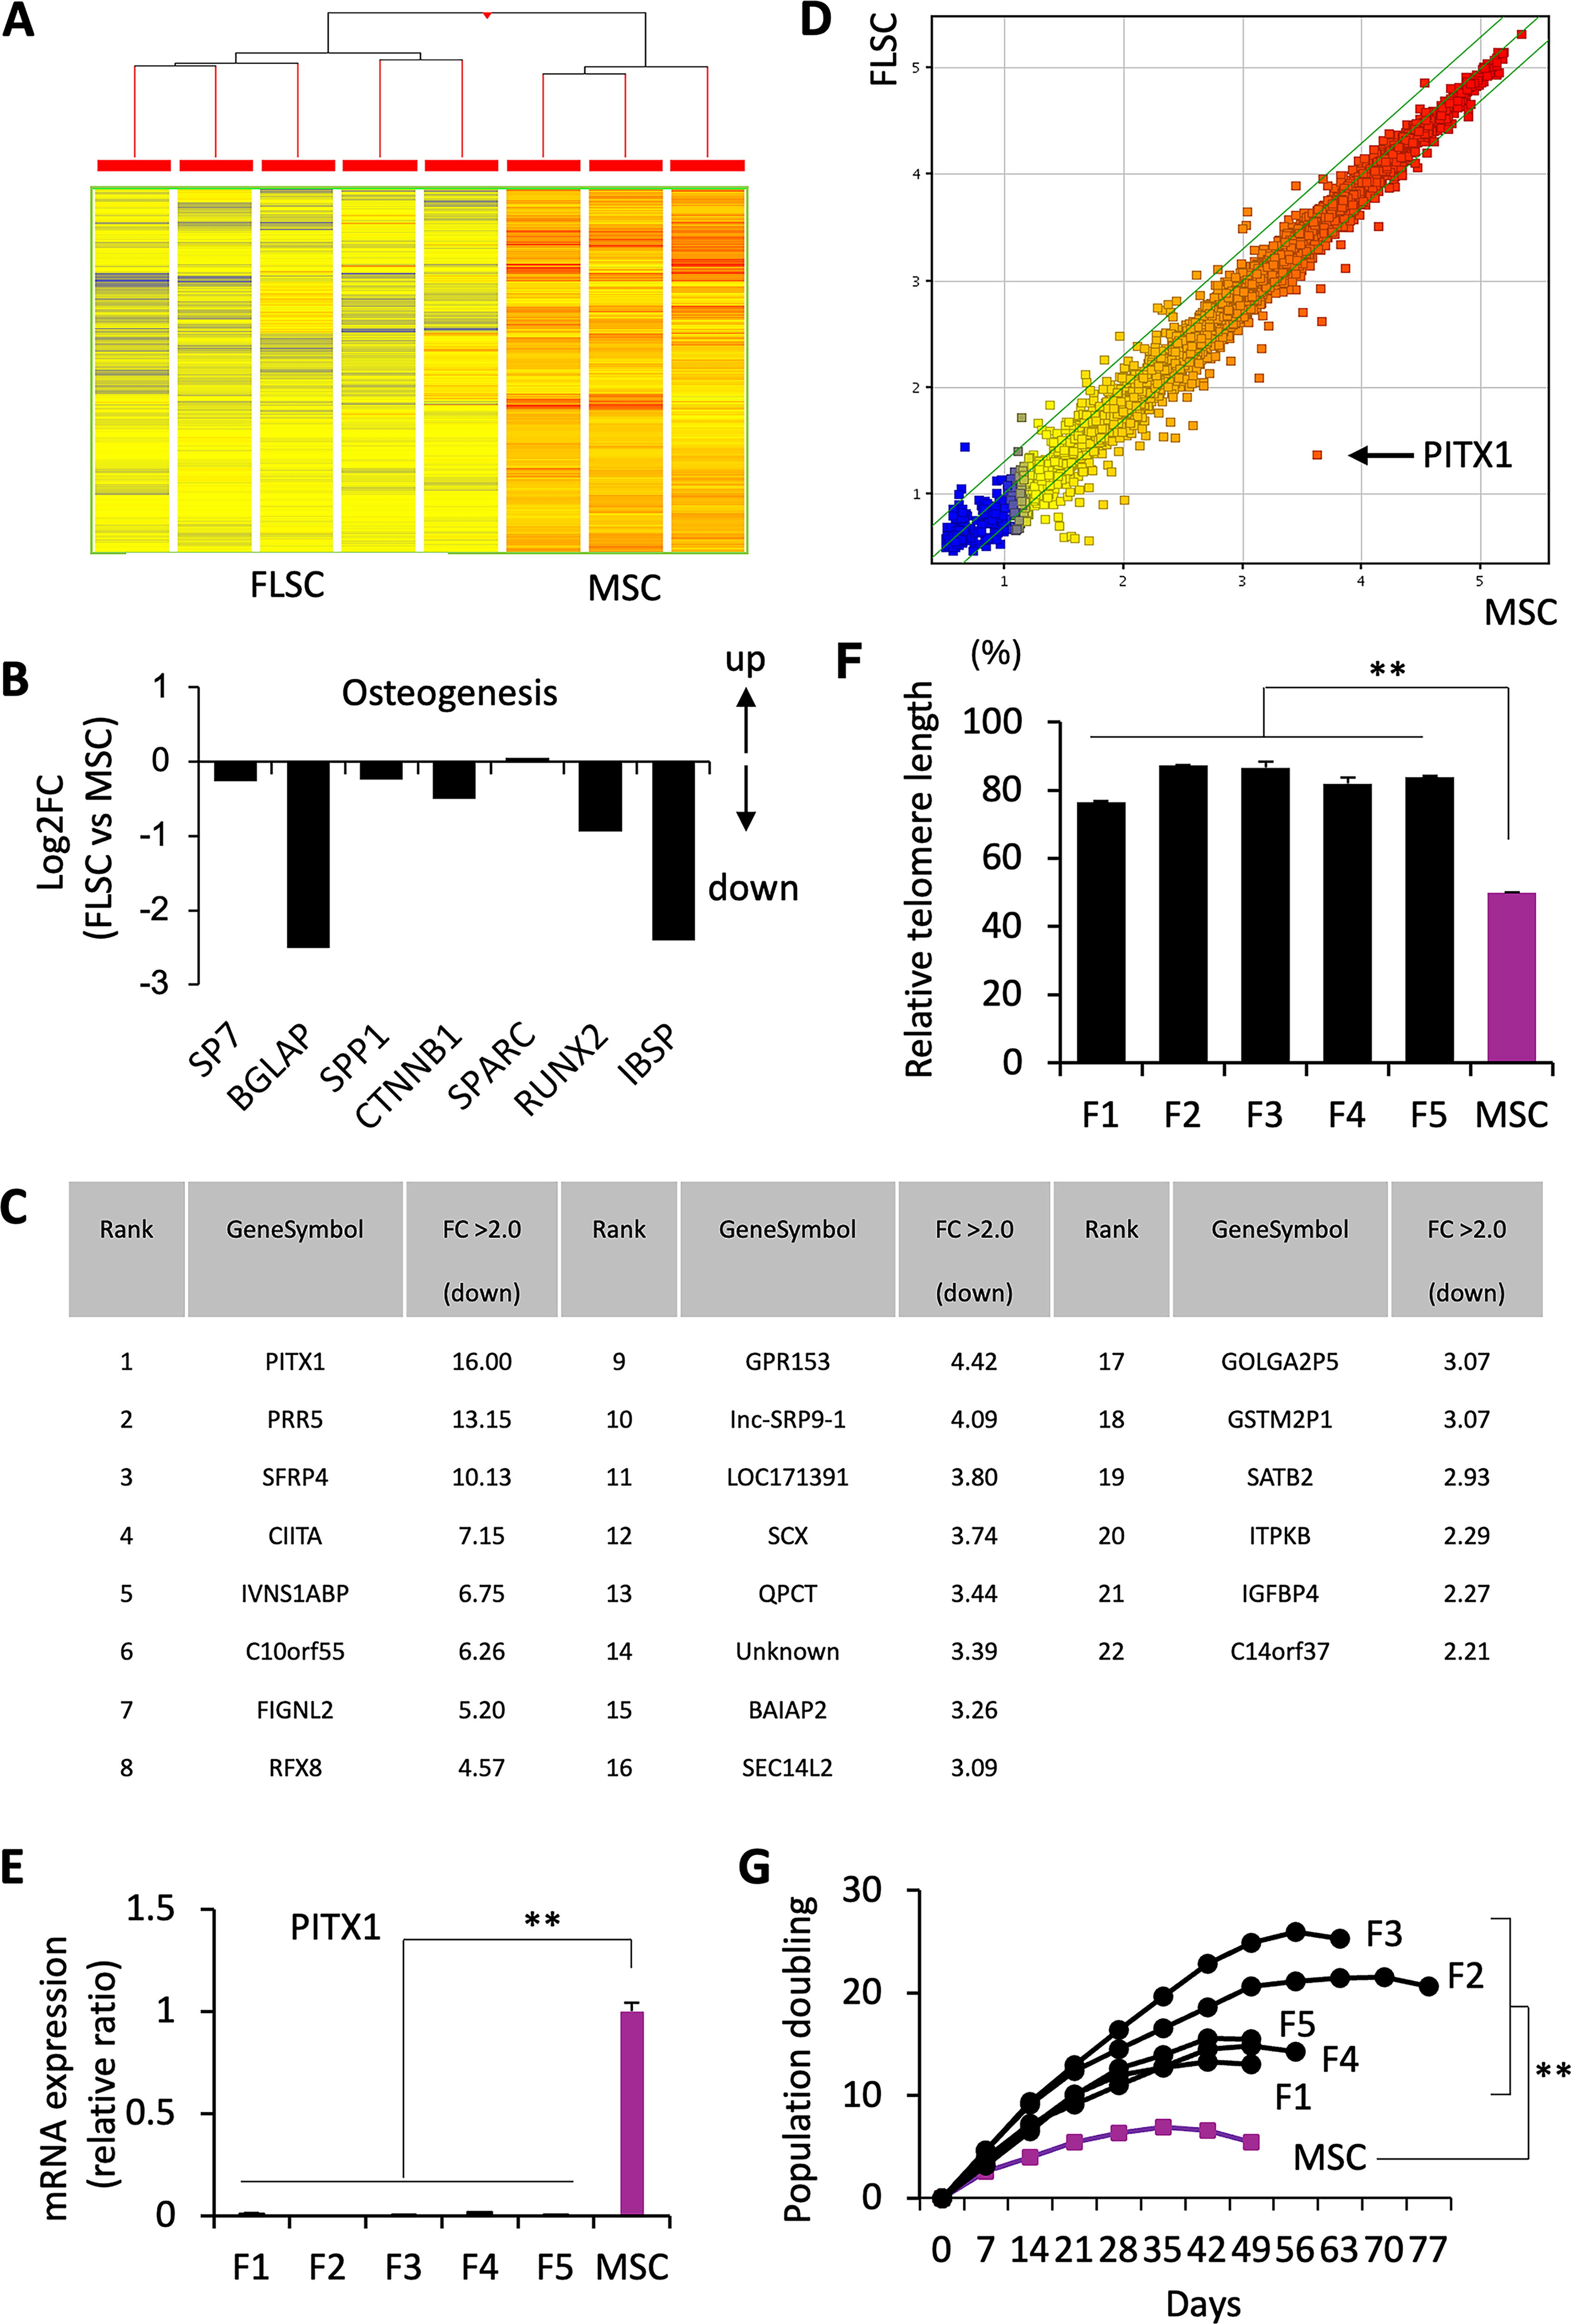
Microarray analysis of FLSCs.
FLSCs support survival of lymphoma cells through cell–cell contact-dependent and -independent mechanisms
The role of FLSCs in supporting lymphoma cell survival was examined using in vitro coculture experiments. Observations under a phase-contrast microscope showed that lymphoma cells accumulated on FLSCs (Fig. 6A–E). The number of lymphoma cells significantly increased in the presence of FLSCs compared with that in the single culture of lymphoma cells (Fig. 6F). However, when cell culture inserts were introduced into the cocultures of FLSCs and lymphoma cells, the increase in the number of lymphoma cells was significantly diminished (Fig. 6F). This finding indicates that direct cell-cell interactions are essential for the supportive effect of FLSCs. Furthermore, the pretreatment of FLSCs with lenalidomide or pomalidomide prior to coculture with lymphoma cells significantly reduced the increase in lymphoma cell numbers regardless of the presence of cell culture inserts (Fig. 6F). This suggests that lenalidomide and pomalidomide affect the secretion of soluble factors by FLSCs, supporting lymphoma cell survival. Supporting this, treatment with lenalidomide or pomalidomide resulted in reduced interleukin (IL)-6 expression levels in FLSCs (Fig. 6G). Other B-cell-supportive soluble factors, including chemokine (C-X-C motif) ligand 12 (CXCL12) and transforming growth factor-β, were also downregulated (Fig. 6G). Collectively, these results indicate that FLSCs promote lymphoma cell survival through both cell–cell contact-dependent and -independent mechanisms. The latter mechanism can be pharmacologically inhibited by lenalidomide and pomalidomide.
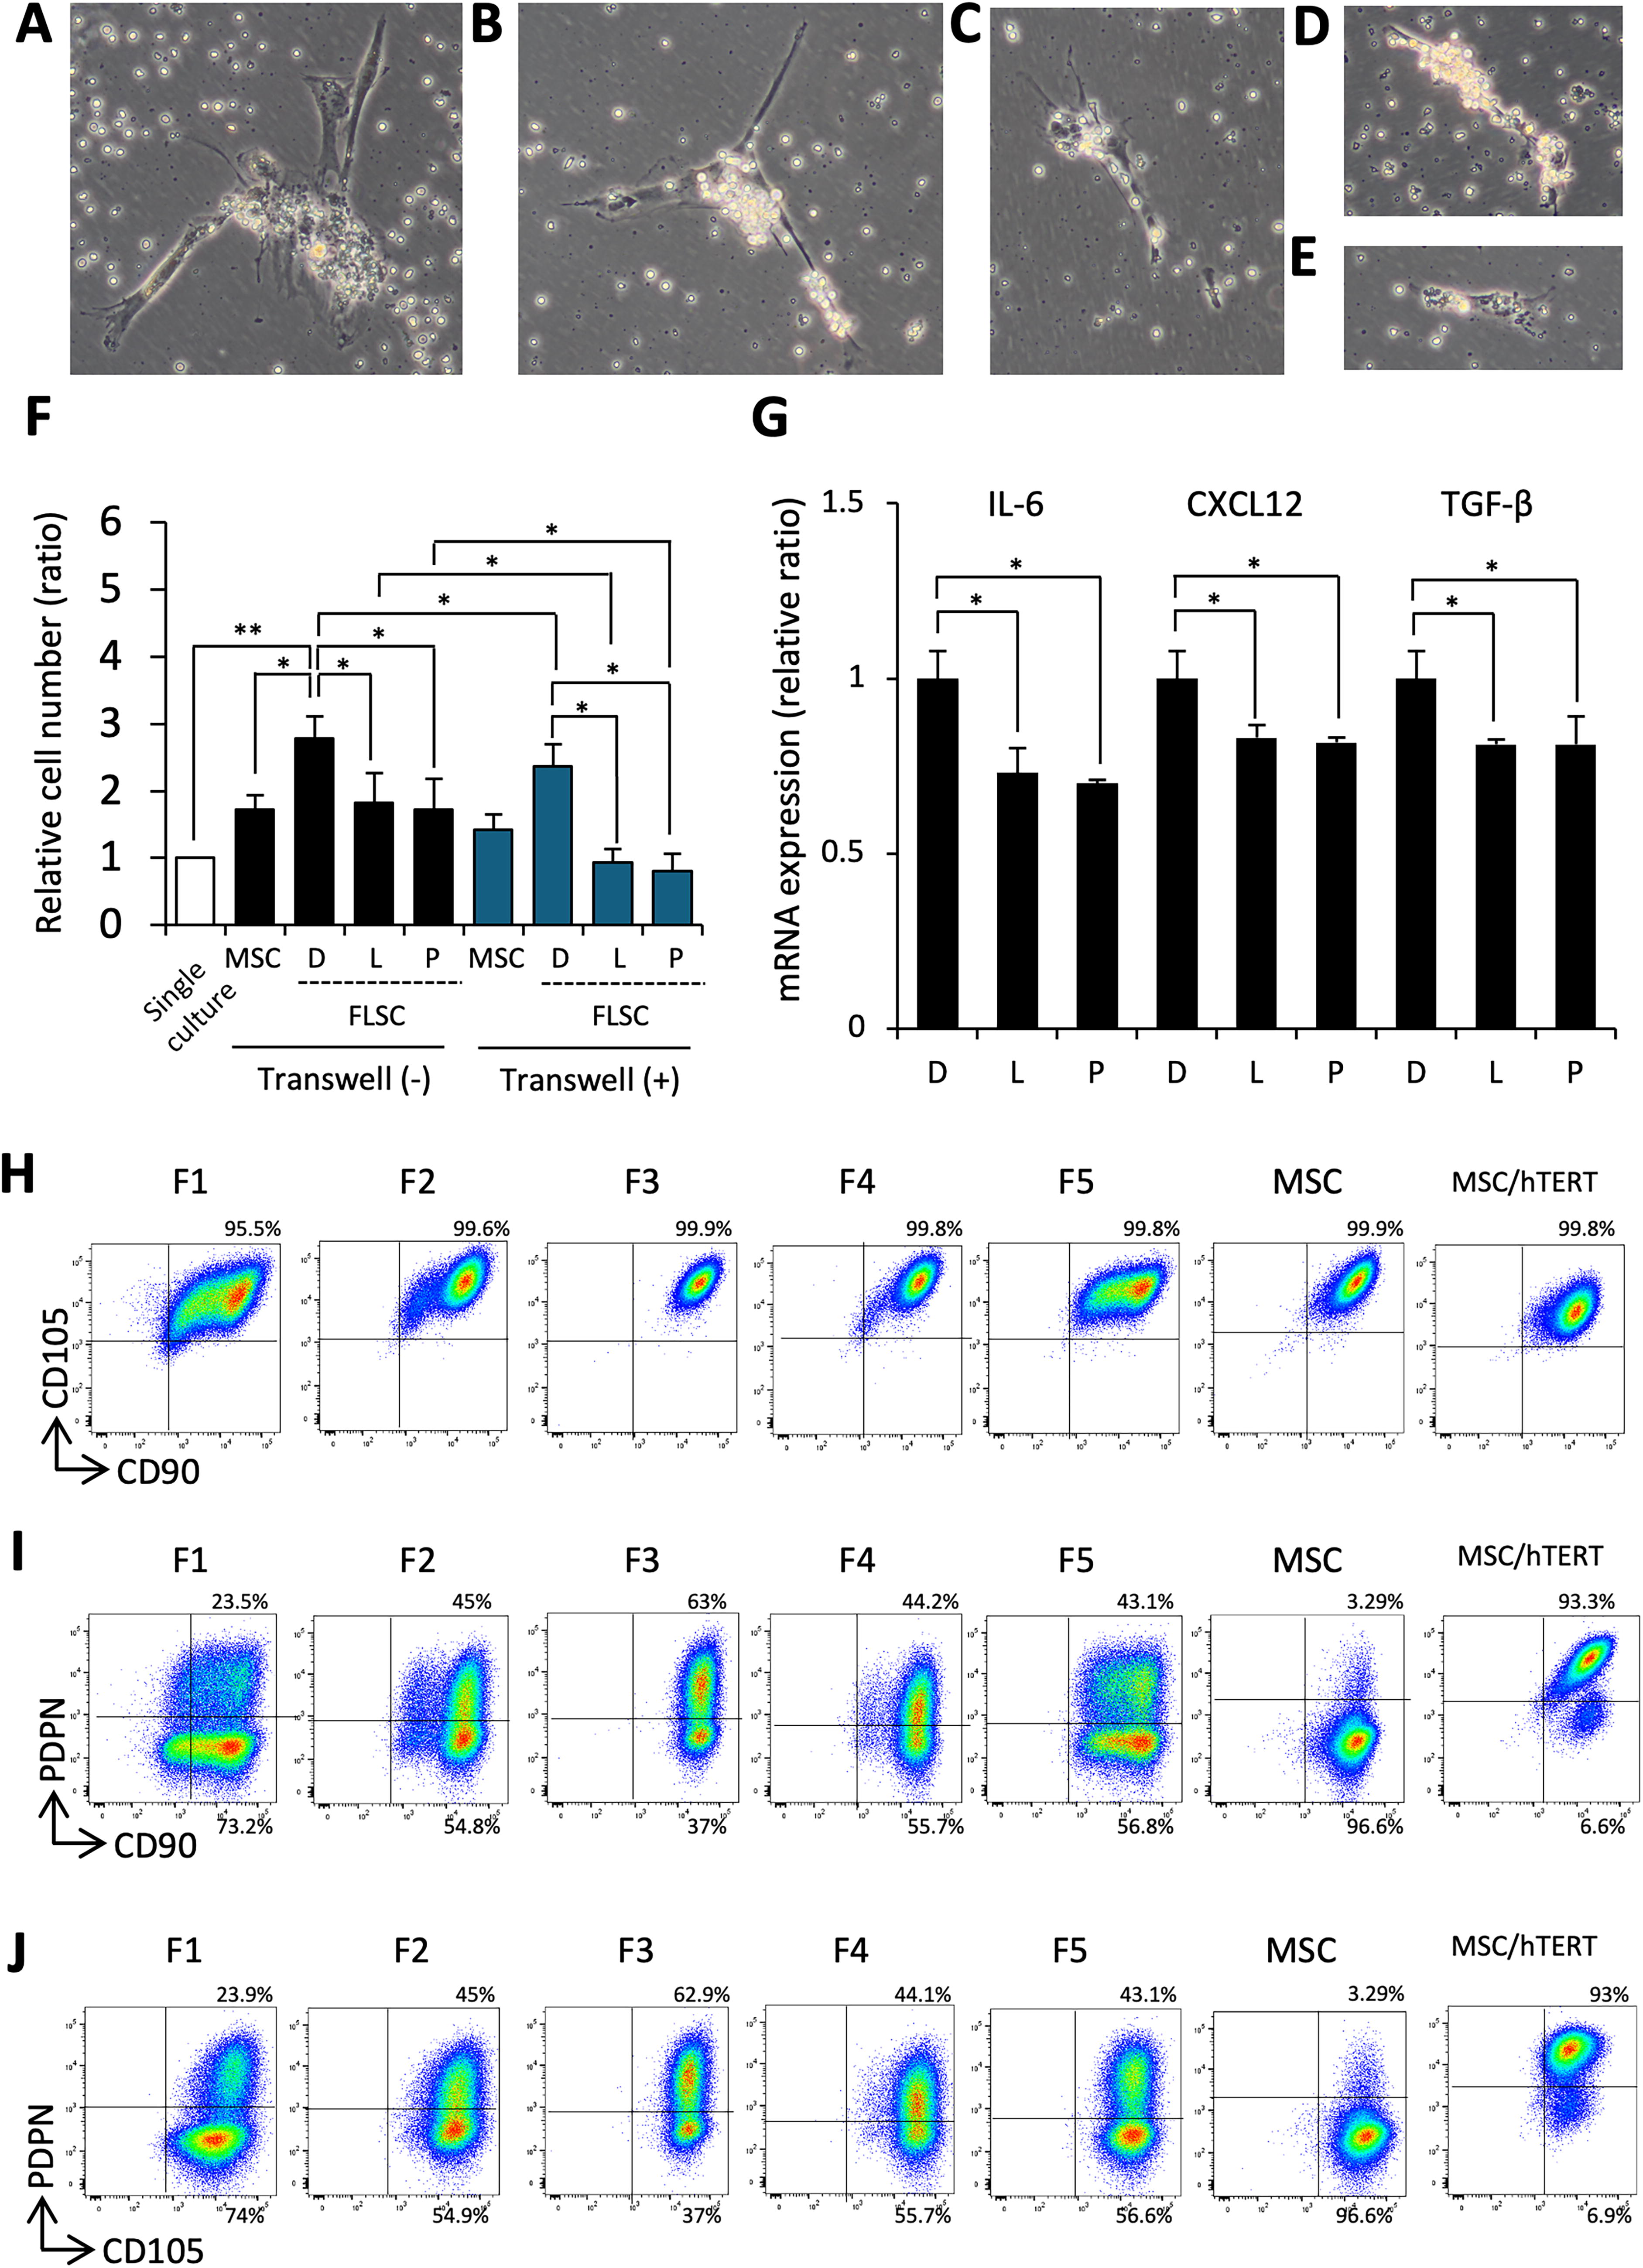
Coculture assays of FL cells and FLSCs.
hTERT overexpression is associated with increased PDPN expression
Flow cytometry analysis demonstrated that the expression patterns of MSC-related markers CD105 and CD90 in human MSCs transfected with hTERT (MSCs/hTERT) closely resembled those in nontransfected human MSCs and FLSCs (Fig. 6H). Notably, PDPN expression was elevated in MSCs/hTERT compared with that in MSCs, with FLSCs exhibiting levels that fell between these two groups (Fig. 6I, J). These findings suggest that hTERT expression is associated with PDPN expression, indicating a potential link between telomerase activity and stromal cell phenotype.
Discussion
Given the dynamic nature of lymphoid tissues in response to infection and cancer, 25 it is plausible that postnatal lymphoid tissues harbor multipotent stromal cells, such as lymphoid tissue organizer (LTo) cells and MSCs, which are essential for adaptable structural organization. 26 –29 Typically, MSCs are derived from the mesodermal germ layer and neural crest; 30 however, within lymph nodes, they may originate from resident cells or be recruited from distant sites, such as the bone marrow, via the lymphatic system.
A previous study has examined the characteristics of human MSCs in secondary lymphoid tissues. MSCs isolated of human tonsils from healthy children have been shown to exhibit characteristics similar to human bone marrow MSCs. 31 These included the presence of MSC-defined surface markers and multiple differentiation capacities. 24 Moreover, tonsil MSCs express a range of molecules, such as CCL19, CCL21, CXCL13, RANKL, IL-7, ICAM-1, MadCAM-1, and VCAM-1. 31 In our study, FLSCs were deficient in multipotent differentiation compared with tonsil MSCs and bone marrow MSCs. Although FLSCs expressed MSC-defined surface markers consistent with tonsil MSCs, the expression profiles of other proteins differed. These findings suggest that FLSCs might represent a more differentiated population than tonsil MSCs, transitioning from LTo cells 27 to various stromal cell populations. 28,32,33
Given their similarity to other stromal cell populations, the absence of CR1/CR2 expression, key molecules within FDCs that support B cells, 34 suggests that these cells are unlikely to be FDCs. Similarly, the absence of CCL19 and CCL21, mediators expressed by FRCs to support T cell and dendritic cell homing, 35 suggests that FLSCs are not FRCs, despite the expression of PDPN and CXCL12, which are characteristic of FRCs. The positive expression of PDPN and CXCL13, combined with the absence of CCL19, CCL21, and CR1/CR2, suggests a resemblance to MRCs, although the presence of CXCL12 was inconsistent with this classification. Recently, single-cell RNA sequencing of human FL lymph node stromal cells revealed distinct nonendothelial stromal cell populations. 36 Further investigations are required to classify FLSCs within diverse and complicated stromal cell populations in lymph nodes.
Recent studies have elucidated the role of PITX1 in modulating telomerase activity in various cancers. 37 –41 PITX1 directly interacts with the hTERT promoter region and represses hTERT transcription. Overexpression of PITX1 inhibits hTERT expression and suppresses melanoma cell proliferation. 37 A marked reduction in PITX1 expression has been associated with melanoma staging. 38 In contrast, in prostate cancer, PITX1 positively influenced telomerase activity by binding to the TERT promoter. PITX1 knockdown reduced TERT expression and inhibited prostate cancer cell growth. 39,40 These findings highlight the complex regulatory role of PITX1 in telomere maintenance. 41 Beyond TERT, PITX1 targets molecules involved in cell proliferation, apoptosis, and drug resistance in cancers. 42,43 For instance, PITX1 binds to the programmed cell death 5 protein, suppressing proliferation and enhancing apoptosis in gastric cancer cells. 42 In addition, PITX1 upregulates p53 transcription, leading to cell cycle arrest and apoptosis. 43 Although PITX1 typically acts as a tumor suppressor gene, it is highly expressed in T cell leukemia, 43 breast cancer, 44 and lung adenocarcinoma. 45 Elevated PITX1 expression does not always correlate with a favorable prognosis, likely because of genetic and epigenetic alterations. 45,46 Consequently, the potential of PITX1 as a cancer biomarker remains unclear.
Although the role of TERT in cancers is well-documented, recent studies have linked TERT expression to PDPN expression. 47,48 In particular, TERT transfection in mesenchymal-like rhesus macaque kidney cells induces PDPN expression. 47 In glioma, TERT promoter mutations correlate with PDPN overexpression, which is associated with cell proliferation and clinical outcomes. 48 Taken together, decreased PITX1 expression elevates TERT expression which in turn induces PDPN expression in cancer cells. Our study revealed that FLSCs, which supported lymphoma cells, exhibit downregulation of PITX1, increased telomere length, and elevated PDPN expression, suggesting that an aberrant PITX1/TERT/PDPN axis in FLSCs may contribute to FL pathophysiology.
Lenalidomide and pomalidomide, both IMiDs and cereblon modulators, exhibit diverse immunobiological properties and therapeutic effects through direct tumoricidal activity and indirect immune cell-mediated effects in the tumor microenvironment. 49 While the direct tumoricidal effect of IMiDs on malignant B cells 50 –53 and their immunomodulatory effects on immune cells such as T cells, natural killer cells, dendritic cells, and macrophages have been explored, 54 their impact on lymph node stromal cells in relation to indirect tumoricidal effects remains unclear. In mantle cell lymphoma, lenalidomide inhibits IL-6-mediated signal transducer and activator of transcription 3 signaling in bone marrow MSCs. 55 Lenalidomide also disrupts lymphocyte function-associated antigen 1 (LFA-1)/ICAM-1 and very late antigen-4/VCAM-1 interactions between myeloma cells and bone marrow MSCs and decreases CXCL12 expression in normal bone marrow MSCs, 56 providing insights into its anti-FL mechanisms via lymph node stromal cell interactions. In our study, IMiD-treated FLSCs exhibited a reduced capability to support lymphoma cells, accompanied by reduced expression of several B cell-supportive soluble factors, particularly IL-6. In addition, disrupting lymphoma cell-FLSC contact also reduced FLSC support for lymphoma cells, likely due to the inhibition of the LFA-1/ICAM-1 interaction. These findings suggest that both cell–cell contact-dependent and -independent mechanisms contribute to FLSC-mediated lymphoma cell survival. The mechanisms by which FLSCs support lymphoma cell survival and proliferation, including the PITX1/hTERT/PDPN axis, are schematically illustrated in Figure 7.
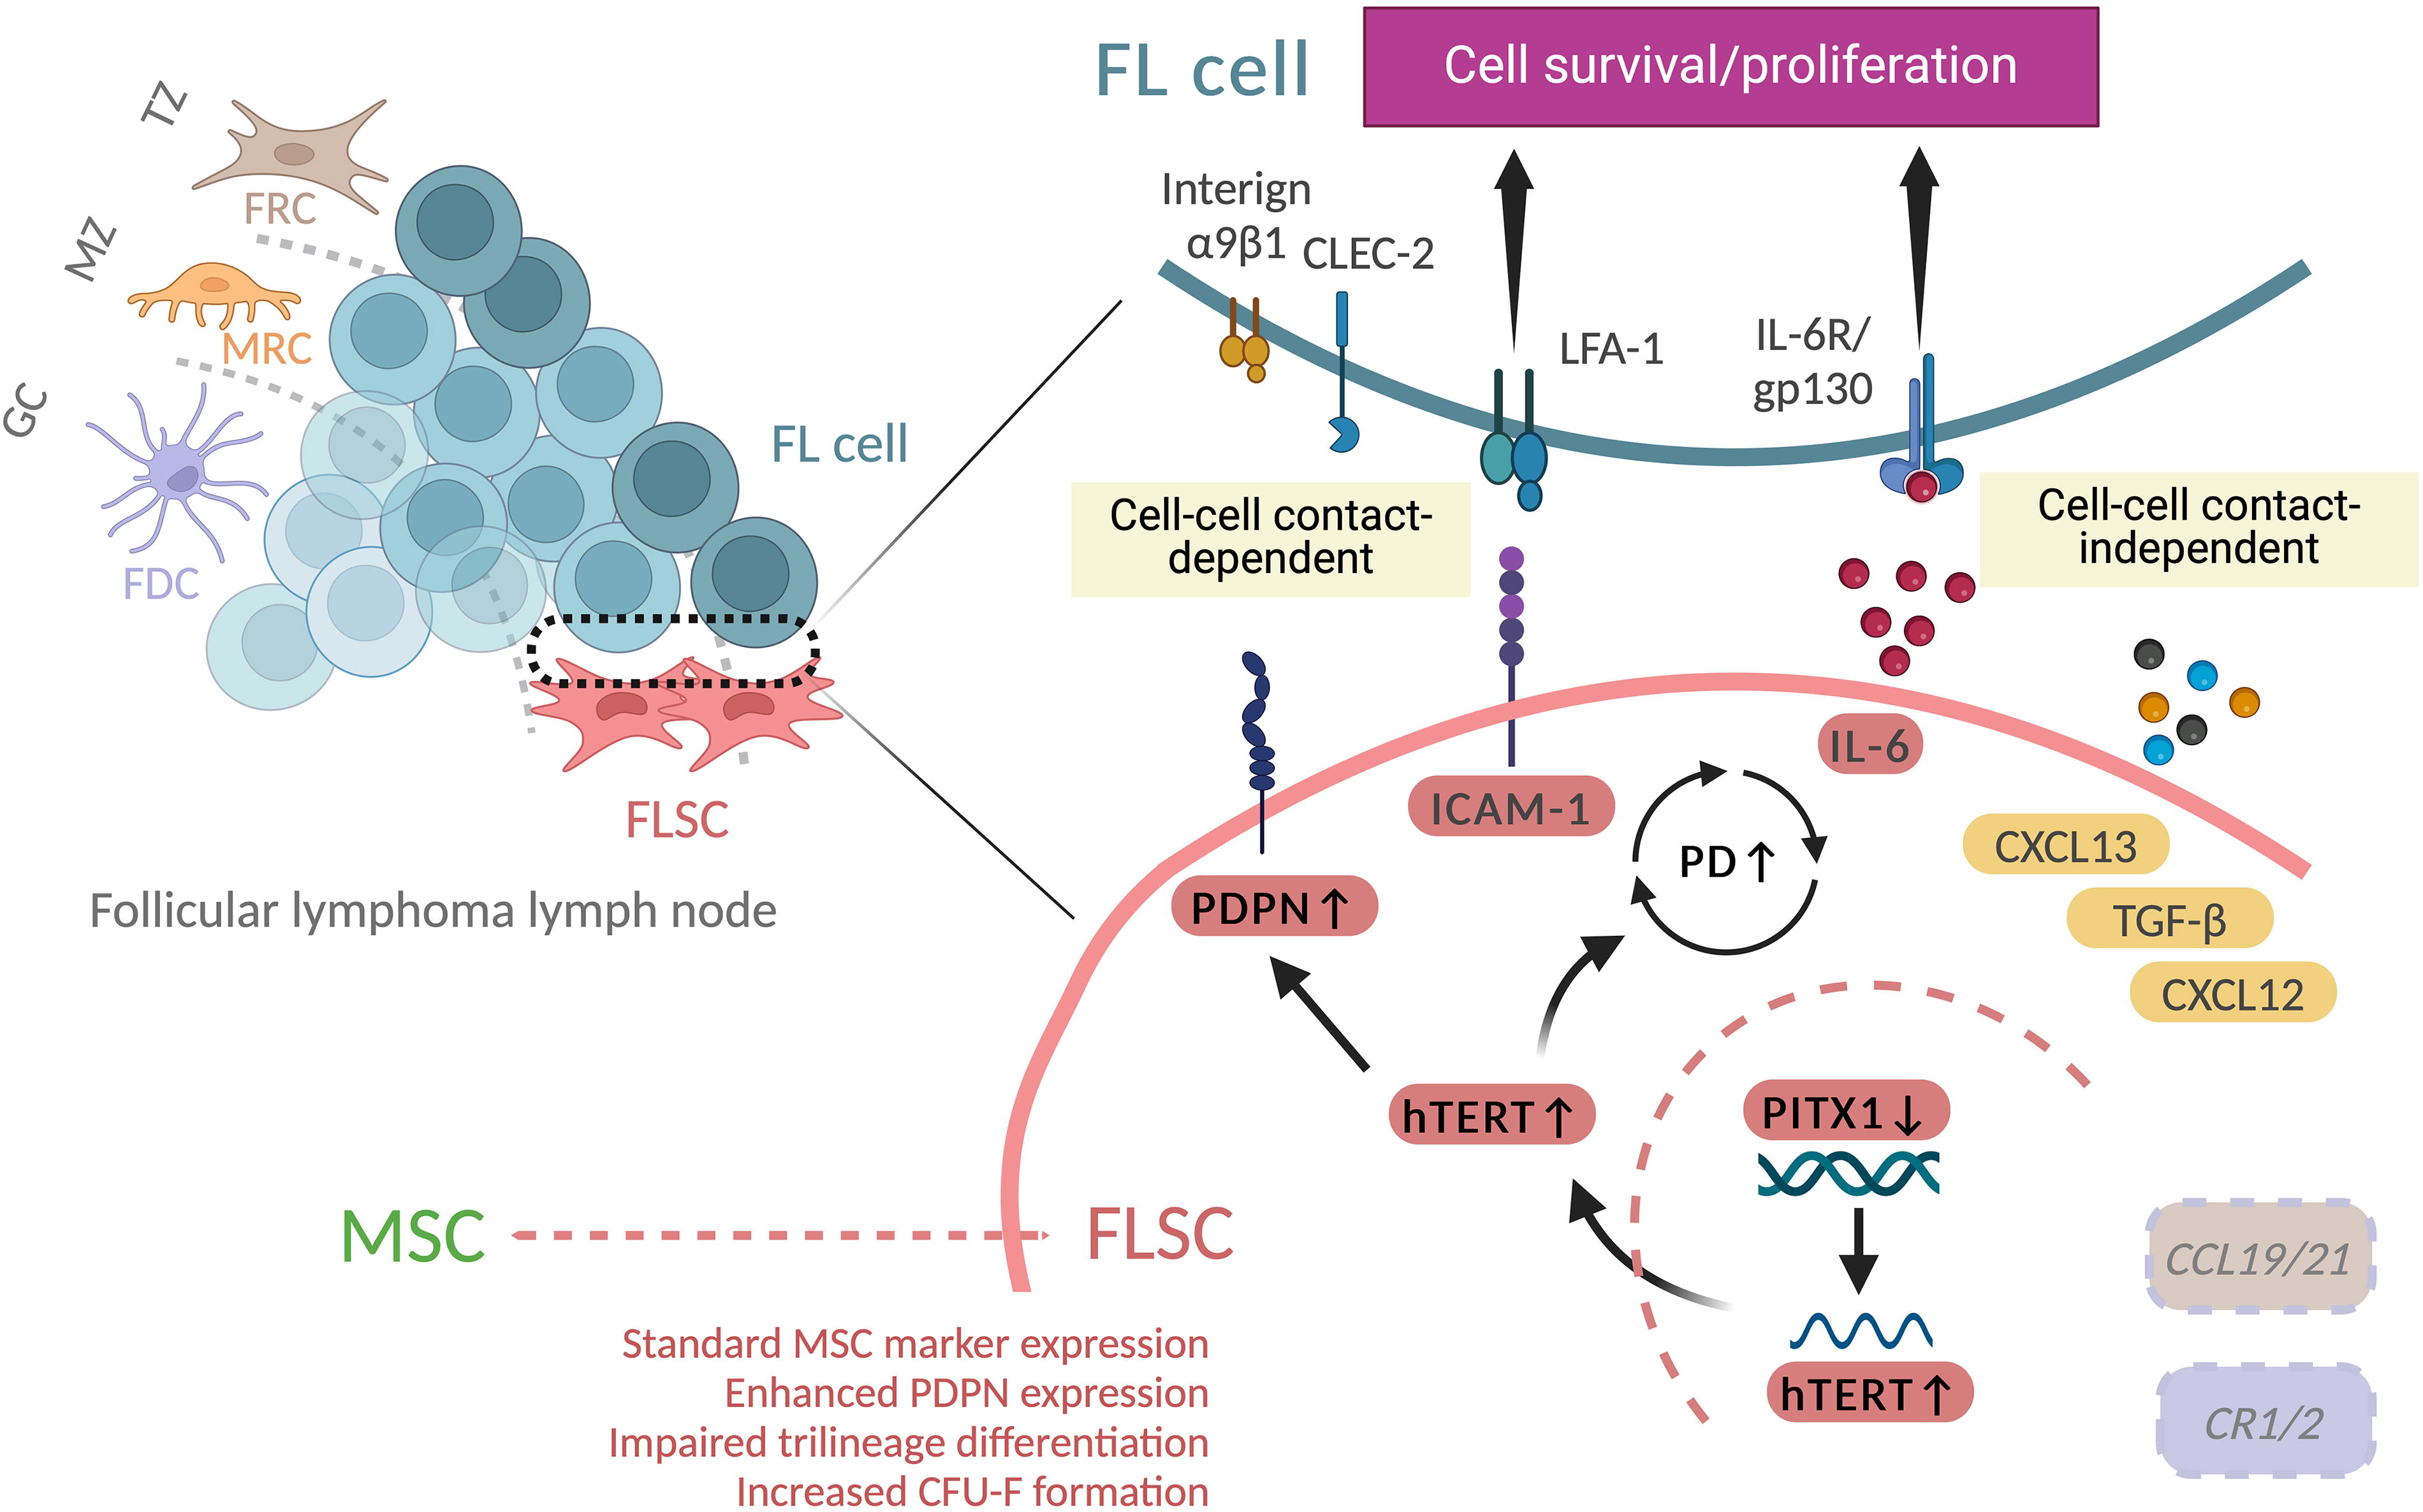
A proposed schematic showing the potential mechanisms favoring follicular lymphoma (FL) cell survival and proliferation. While paired-like homeodomain 1 (PITX1) interacts with the human telomerase reverse transcriptase (hTERT) promoter region to repress its transcription, PITX1 is downregulated in FL lymph node mesenchymal stromal cells (FLSC), leading to increased hTERT expression. The upregulation of hTERT results in elevated podoplanin (PDPN) expression and enhanced population doubling (PD). This aberrant PITX1/hTERT/PDPN axis contributes to FL pathophysiology. Molecules whose names are italicized indicate low or undetected expression. Molecules highlighted in yellow contribute to FL cell retention in the microenvironment and recruitment of immune cells, such as regulatory T cells, facilitating immune escape. ICAM-1, intercellular adhesion molecule-1; CXCL13, chemokine (C-X-C motif) ligand 13; TGF-β, transforming growth factor-beta; CXCL12, chemokine (C-X-C motif) ligand 12; CCL19/21, chemokine (C-C motif) ligand 19 and 21; CR1/2, complement receptor 1 and 2; LFA-1, lymphocyte function-associated antigen-1; CLEC-2, C-type lectin-like receptor 2; FRC, fibroblastic reticular cell; MRC, marginal reticular cell; FDC, follicular dendritic cell; MSC, mesenchymal stromal/stem cell; TZ, T cell-rich zone; MZ, marginal zone; GC, germinal center; CFU-F, colony-forming unit-fibroblast.
In conclusion, our study demonstrates that FLSCs exhibit phenotypic similarities to bone marrow MSCs but lack the multipotency typically associated with MSCs and display protumorigenic characteristics. This unique profile is potentially driven by an aberrant PITX1–hTERT–PDPN axis. These findings contribute to a deeper understanding of FL pathophysiology and suggest potential therapeutic targets.
Footnotes
Acknowledgments
Data Availability Statement
Author Disclosure Statement
The authors declare no conflicts of interest relevant to the content of this article.
Funding Information
This work was supported in part by Takeda Science Foundation (S.F. and Y.M.).
Supplementary Material
Supplementary Table S1
Supplementary Table S2