
Abstract
Mesenchymal stem cells (MSCs) of fetal origin, such as umbilical cord blood MSCs (UCB MSCs), have emerged as a promising cell source for musculoskeletal tissue regeneration because of their higher proliferation potential, lack of donor site morbidity, and their off-the-shelf potential. MSCs differentiated toward the osteogenic lineage exhibit a specific metabolic phenotype characterized by reliance to oxidative phosphorylation for energy production and reduced glycolytic rates. Currently, limited information exists on the metabolic transitions at different stages of the osteogenic process after osteoinduction with different agents. Herein, the osteoinduction efficiency of BMP-2 and dexamethasone on UCB MSCs was assessed using gas chromatography–mass spectrometry (GC-MS) metabolomics analysis, revealing metabolic discrepancies at 7, 14, and 21 days of induction. Whereas both agents when administered individually were able to induce collagen I, osteocalcin, and osteonectin expression, BMP-2 was less effective than dexamethasone in promoting alkaline phosphatase expression. The metabolomics analysis revealed that each agent induced distinct metabolic alterations, including changes in amino acid pools, glutaminolysis, one-carbon metabolism, glycolysis, and tricarboxylic acid cycle. Importantly, we showed that in vitro-differentiated UCB MSCs acquire a metabolic physiology similar to primary osteoblasts when induced with dexamethasone but not with BMP-2, highlighting the fact that metabolomics analysis is sensitive enough to reveal potential differences in the osteogenic efficiency and can be used as a quality control assay for evaluating the osteogenic process.
Introduction
M
Metabolism represents the cellular function used by cells to react first to environmental stimuli and to manifest changes to the cellular physiology. During proliferation, bone marrow MSCs exhibit a glycolytic phenotype with increased reactive oxygen species (ROS) production [5] while at the same time retaining oxidative phosphorylation (OXPHOS) for partial energy production [6]. However, when differentiated to osteoblasts in vitro, their energy production is based on OXPHOS associated with increased biogenesis of mitochondria and a reduction of ROS production [5,7].
Metabolomics affords global analysis of the cellular metabolic state and has already been proven useful as a sensitive tool for cell culture monitoring [8]; it can be applied to study stem cell metabolic physiology [9], enabling elucidation of the metabolic network state. It enables multivariate analysis that accounts for correlations between metabolic pathways that are neglected by traditional enzyme activity tests for a limited number of enzymes and analyses involving only specific metabolites. This is important as minuscule changes in metabolite concentrations can prove significant when multiple metabolites are simultaneously analyzed, whereas the same would not be possible when using one-at-a-time analyses. Specifically, stem cell metabolomics research has revealed that the metabolome is not only affected by cellular processes, such as proliferation and differentiation, but can also regulate the epigenetic state of embryonic stem cells (ESCs) [10] and control the balance between proliferation and differentiation of naive and primed human pluripotent stem cells [11]. In addition, it has been used in the identification of small molecules secreted by ESCs when exposed to valproate [12] and steroid hormones [13] and for the monitoring of chondrogenesis of MSCs [14]. Metabolome differences in lipid and primary metabolism between induced pluripotent stem cells and ESCs [15] and between MSCs cultured on titanium nanopillars compared with those cultured on plastic [9] have indicated that environmental or genetic perturbations and biomaterial surface have important consequences on the metabolic physiology of stem cells. Finally, Muñoz et al. reported differences on glutaminolysis, tricarboxylic acid (TCA) cycle, and malate–aspartate shuttle when osteogenically induced MSCs were exposed to normoxia and hypoxia [16].
Current knowledge of the metabolism of MSCs, mainly based on enzyme activity and extracellular metabolite studies, has showed that in vitro-differentiated MSCs exhibit a specific metabolic phenotype [5 –7,17]. However, the accepted universal feature of osteogenesis involving the metabolic shift to OXPHOS and associated reduced glycolytic rates neglects the fact that various osteoinductive agents have differential efficiencies. In addition, no direct comparison has been performed on the metabolome of primary osteoblasts and in vitro-differentiated MSCs. Even though MSCs can (inefficiently) differentiate in the absence of osteoinductive signals, efficient differentiation strategies require osteoinductive agents, such as dexamethasone and BMP-2 [18,19].
Herein, we demonstrate that differences exist in the ability of dexamethasone and BMP-2 to induce osteogenesis of UCB MSCs. We show by performing time-course metabolomics analysis of the osteogenic differentiation process over 21 days that UCB MSCs go through various metabolic states before acquiring their final metabolic phenotype, which is treatment dependent. This work highlights the fact that metabolic physiology reflects the degree of MSC osteogenic differentiation and signifies the use of metabolomics as a sensitive and robust tool for bioprocess monitoring and optimization.
Materials and Methods
UCB MSC isolation and maintenance
UCB MSCs were isolated from full-term UCB units (NHS Blood & Transplant, Colindale Blood Bank) after obtaining maternal consent according to the relevant ethical approval (05/Q0405/20; NRES Committee, London, Harrow). Blood was processed within 24 hours from bleeding and the mononuclear fragment was isolated by Ficoll density gradient centrifugation. In brief, blood was diluted 1:4 with phosphate-buffered saline (PBS) (Life Technologies, United Kingdom), layered on Ficoll (Ficoll-paque; GE Healthcare, United Kingdom), and centrifuged. The mononuclear layer was subsequently aspirated, washed with PBS, resuspended in αMEM GlutaMax-I (Gibco; Life Technologies, United Kingdom) with 10% fetal bovine serum (FBS) (Gibco; Life Technologies, United Kingdom) and 1% penicillin/streptomycin (Sigma-Aldrich, United Kingdom), and seeded in 75 cm2 plastic culture flasks. After 48 h, the supernatant was removed and the adherent cells were further cultured with the same culture medium under 37°C, 21% O2, and 5% CO2. Culture medium was changed twice a week and cells were passaged before reaching 80% confluence. Cells between passages 4 and 6 were used for subsequent experiments.
Osteogenic induction and culture of primary osteoblasts
For osteogenic differentiation, the culture medium was supplemented with 10 mM β-glycerophosphate (Sigma-Aldrich, United Kingdom), 50 μg/mL ascorbic acid 2-phosphate (Sigma-Aldrich, United Kingdom), and 10−7 M dexamethasone (Sigma-Aldrich, United Kingdom) or human recombinant BMP-2 (PeproTech, United Kingdom) at 100 ng/mL. Primary human osteoblasts isolated from humeral head cancellous bone (PromoCell GmbH, Germany) were used as a positive control group for metabolomics experiments. Cells were cultured with αMEM GlutaMAX, 10% FBS, 1% penicillin/streptomycin under 21% O2, 5% CO2, and 37°C, and metabolomic fingerprints were obtained at passage 4.
Alizarin red S staining and quantification
The effect of dexamethasone and BMP-2 on UCB MSC culture mineralization was evaluated by means of Alizarin red S staining (ARS) at pH 4.1 (Sigma-Aldrich, United Kingdom) and results were quantified according to Gregory et al. [20] by the addition of 10% acetic acid (Sigma-Aldrich, United Kingdom) to the stained culture flask, vortexing the resulting cell stain suspension, and heating to 85°C for 10 min. Subsequently, pH was fixed between 4.1 and 4.5 with 10% ammonium hydroxide (Sigma-Aldrich, United Kingdom) and absorbance values were read at 405 nm with an ELISA reader (ELx808; BioTek, United Kingdom).
DNA quantification
DNA quantification for data normalization purposes was performed as previously published [21] with the use of PicoGreen assay (ThermoFischer Scientific, United Kingdom). In brief, cells were washed with PBS and incubated for 6 h with 1 mL digestion buffer with 0.1% Triton X-100, 10 mM Tris, 1 mM EDTA (Sigma-Aldrich, United Kingdom), and 0.1 mg/mL proteinase K (ThermoFisher Scientific, United Kingdom) at 50°C with intermediate agitation. The resulting solution was diluted 10-fold in PBS and 100 μL of each sample was incubated with 100 μL of PicoGreen dye for 5 min at room temperature. Fluorescence was measured with a Promega GloMax multidetection system (Promega, United Kingdom) with excitation and emission wavelengths of 485 and 530 nm, respectively. Background fluorescence was then subtracted and number of cells were calculated based on a custom standard curve created with UCB MSCs.
Alkaline phosphatase activity
Activity of alkaline phosphatase (ALP) was evaluated by measuring its ability to hydrolyze p-nitrophenyl phosphate (pNPP) producing yellow p-nitrophenol. After washing cells with PBS, 200 μL ALPase buffer (Sigma-Aldrich, United Kingdom) and 200 μL pNPP solution were added to the culture and incubated for 30 min at 37°C in the dark. Sodium hydroxide 0.5 M (Sigma-Aldrich, United Kingdom) was used to terminate the reaction and absorbance at 405 nm was measured with an ELISA reader (ELx808; BioTek, United Kingdom). ALP activity was then expressed as μM of p-nitrophenol/106 cells/min.
RNA extraction and real-time quantitative PCR
Total RNA was extracted with the use of RNeasy mini kit (Qiagen, United Kingdom) according to the manufacturer's instructions followed by real-time quantitative PCR (RT-qPCR) with the use of KAPA SYBR FAST 1-step qRT-PCR kit (Kapa Biosystems Ltd., United Kingdom) based on the manufacturer's instructions (5 min reverse transcription at 42°C, 3 min enzyme inactivation at 95°C, and 40 cycles of 3 s denaturation at 95°C and 30 s of annealing/extension at 62°C) in a StepOne Plus qRT-PCR instrument (Applied Biosystems, CA).
Expression of osteonectin, osteocalcin (OCN), ALP, and runt-related transcription factor 2 (Runx2) mRNA was quantified with the use of the following primers: ALP [22] (forward) 5′-GGACCATTCCCACGTCTTCAC-3′, (reverse) 5′-CCTTGTAGCCAGGCCCATTG-3′; osteonectin [23] (forward) 5′-TCCACAGTACCGGATTCTCTCT-3′, (reverse) 5′-TCTATGTTAGCACCTTGTCTCCAG-3′; OCN [24] (forward) 5′-CCCAGGCGCTACCTGTATCAA-3′, (reverse) 5′-GGTCAGCCAACTCGTCACAGTC-3′; Runx2 [25] (forward) 5′-GAGGTACCAGATGGGACTGTG-3′; (reverse) 5′-TCGTTGAACCTTGCTACTTGG-3′; and RPL13a [23,26] (forward) 5′-CTATGACCAATAGGAAGAGCAACC-3′, (reverse) 5′-GCAGAGTATATGACCAGGTGGAA-3′. Results were normalized with the use of RPL13a as the housekeeping gene and expressed as fold change relative to day 0 based on the 2−ΔΔCt method [27].
Immunofluorescence
Cumulative secretion of OCN and collagen type I A1 over the whole differentiation period in the extracellular matrix was assessed by means of immunofluorescence. Cells were washed with PBS and fixed with 4% paraformaldehyde solution (Sigma-Aldrich, United Kingdom) and subsequently blocked with a solution of 3% donkey or goat serum (Sigma-Aldrich, United Kingdom) for 1 h at room temperature to avoid nonspecific antibody binding. After overnight treatment with primary antibodies at 4°C, they were incubated with FITC- or PE-conjugated antibodies (Santa-Cruz Biotech), counterstained with 4,6-diamidino-2-phenylindole (DAPI) and images were taken with a BX-51 Olympus microscope (Olympus, United Kingdom). Details regarding antibodies and dilutions can be found in Table 1.
Metabolomics analysis
Sampling was performed before the beginning of differentiation and every 7 days until day 21. Metabolite extraction was carried out as previously described [8]. Ribitol (1 mg/106 cells) and [UC-13]-glucose (2 mg/106 cells) were used as internal standards, and dried polar metabolite extracts were derived. Number of cells estimation for the purposes of data normalization was performed with the use of DNA quantification [28]. A precise number of cells extrapolation method is essential analysis of differentiated cultures, in which cells are enclosed in dense, mineralized extracellular matrix and single cell counting is not possible. Methoxyamine hydrochloride (Sigma-Aldrich, United Kingdom) and N-methyl-trimethylsilyl-trifluoroacetamide (Alfa Aesar, United Kingdom) were used for the derivatization steps [29,30].
Metabolic profiles were obtained with the use of a Shimadzu QP2010 Ultra GC-MS (Shimadzu Corp., Milton Keynes, United Kingdom). Data validation, normalization, and filtering were accomplished according to Kanani and Klapa [29] and the peak area of the marker ion 103 of ribitol was used for the calculation of the relative peak areas (RPAs) of all detected peaks. The resulting normalized and filtered RPAs, according to the Kanani and Klapa method [30], consisted of 50 metabolites that were used for further data analysis. Analysis was performed on data from three biological replicates for each group at each time point.
Metabolomic multivariate data analysis was carried out with TM4 MeV (v. 4.9.0) [31] on the standardized RPAs of metabolites. Hierarchical clustering (HCL) with Manhattan distance metric and principal component analysis (PCA) were used as unsupervised multivariate algorithms to observe patterns in our data and explore sample differences based on their metabolic profiles. Significantly increased or decreased metabolites between our groups were identified with the use of significance analysis of microarrays (SAM), with delta scores yielding a false discovery rate of 0%. All significant metabolite changes were depicted on a reconstruction of the basic metabolic network of UCB MSCs.
Statistical analysis
Statistical analysis of ARS quantification, ALP activity, RT-qPCR as well as proliferation data was performed with OriginPro 2016 (b9.3.2.303; OriginLab Corporation, Northampton, MA) with the use of ANOVA and Tukey's posthoc test (n = 3 independent biological replicates). All values are expressed as mean ± standard deviation and statistical significance was set at a P value less than 0.05.
Results
BMP-2 is less efficient than dexamethasone in inducing osteogenesis of UCB MSCs
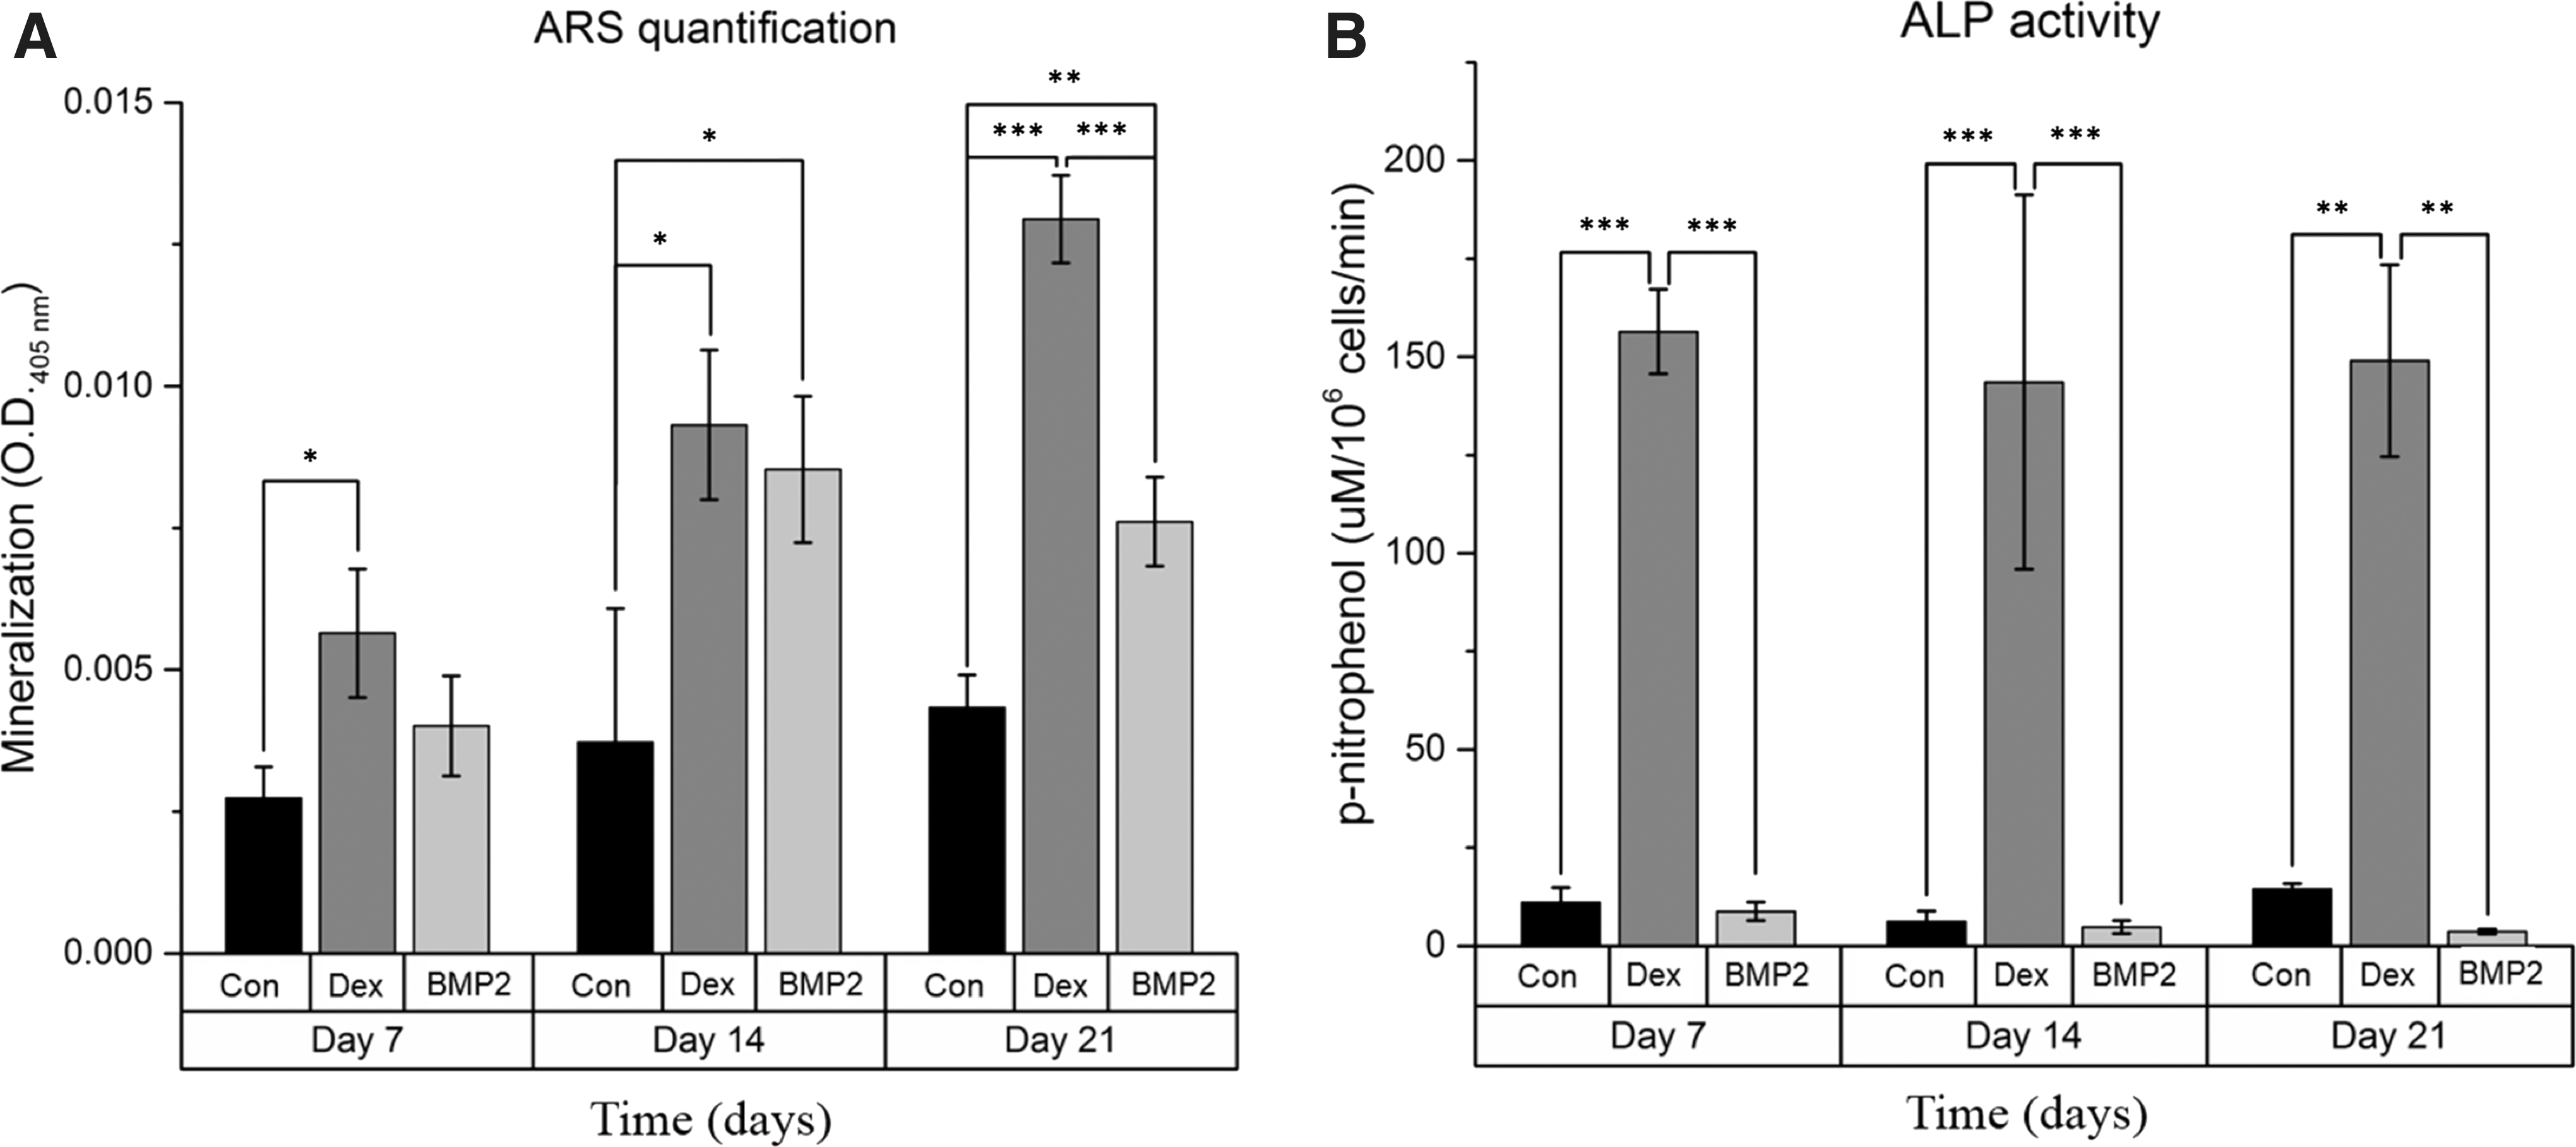
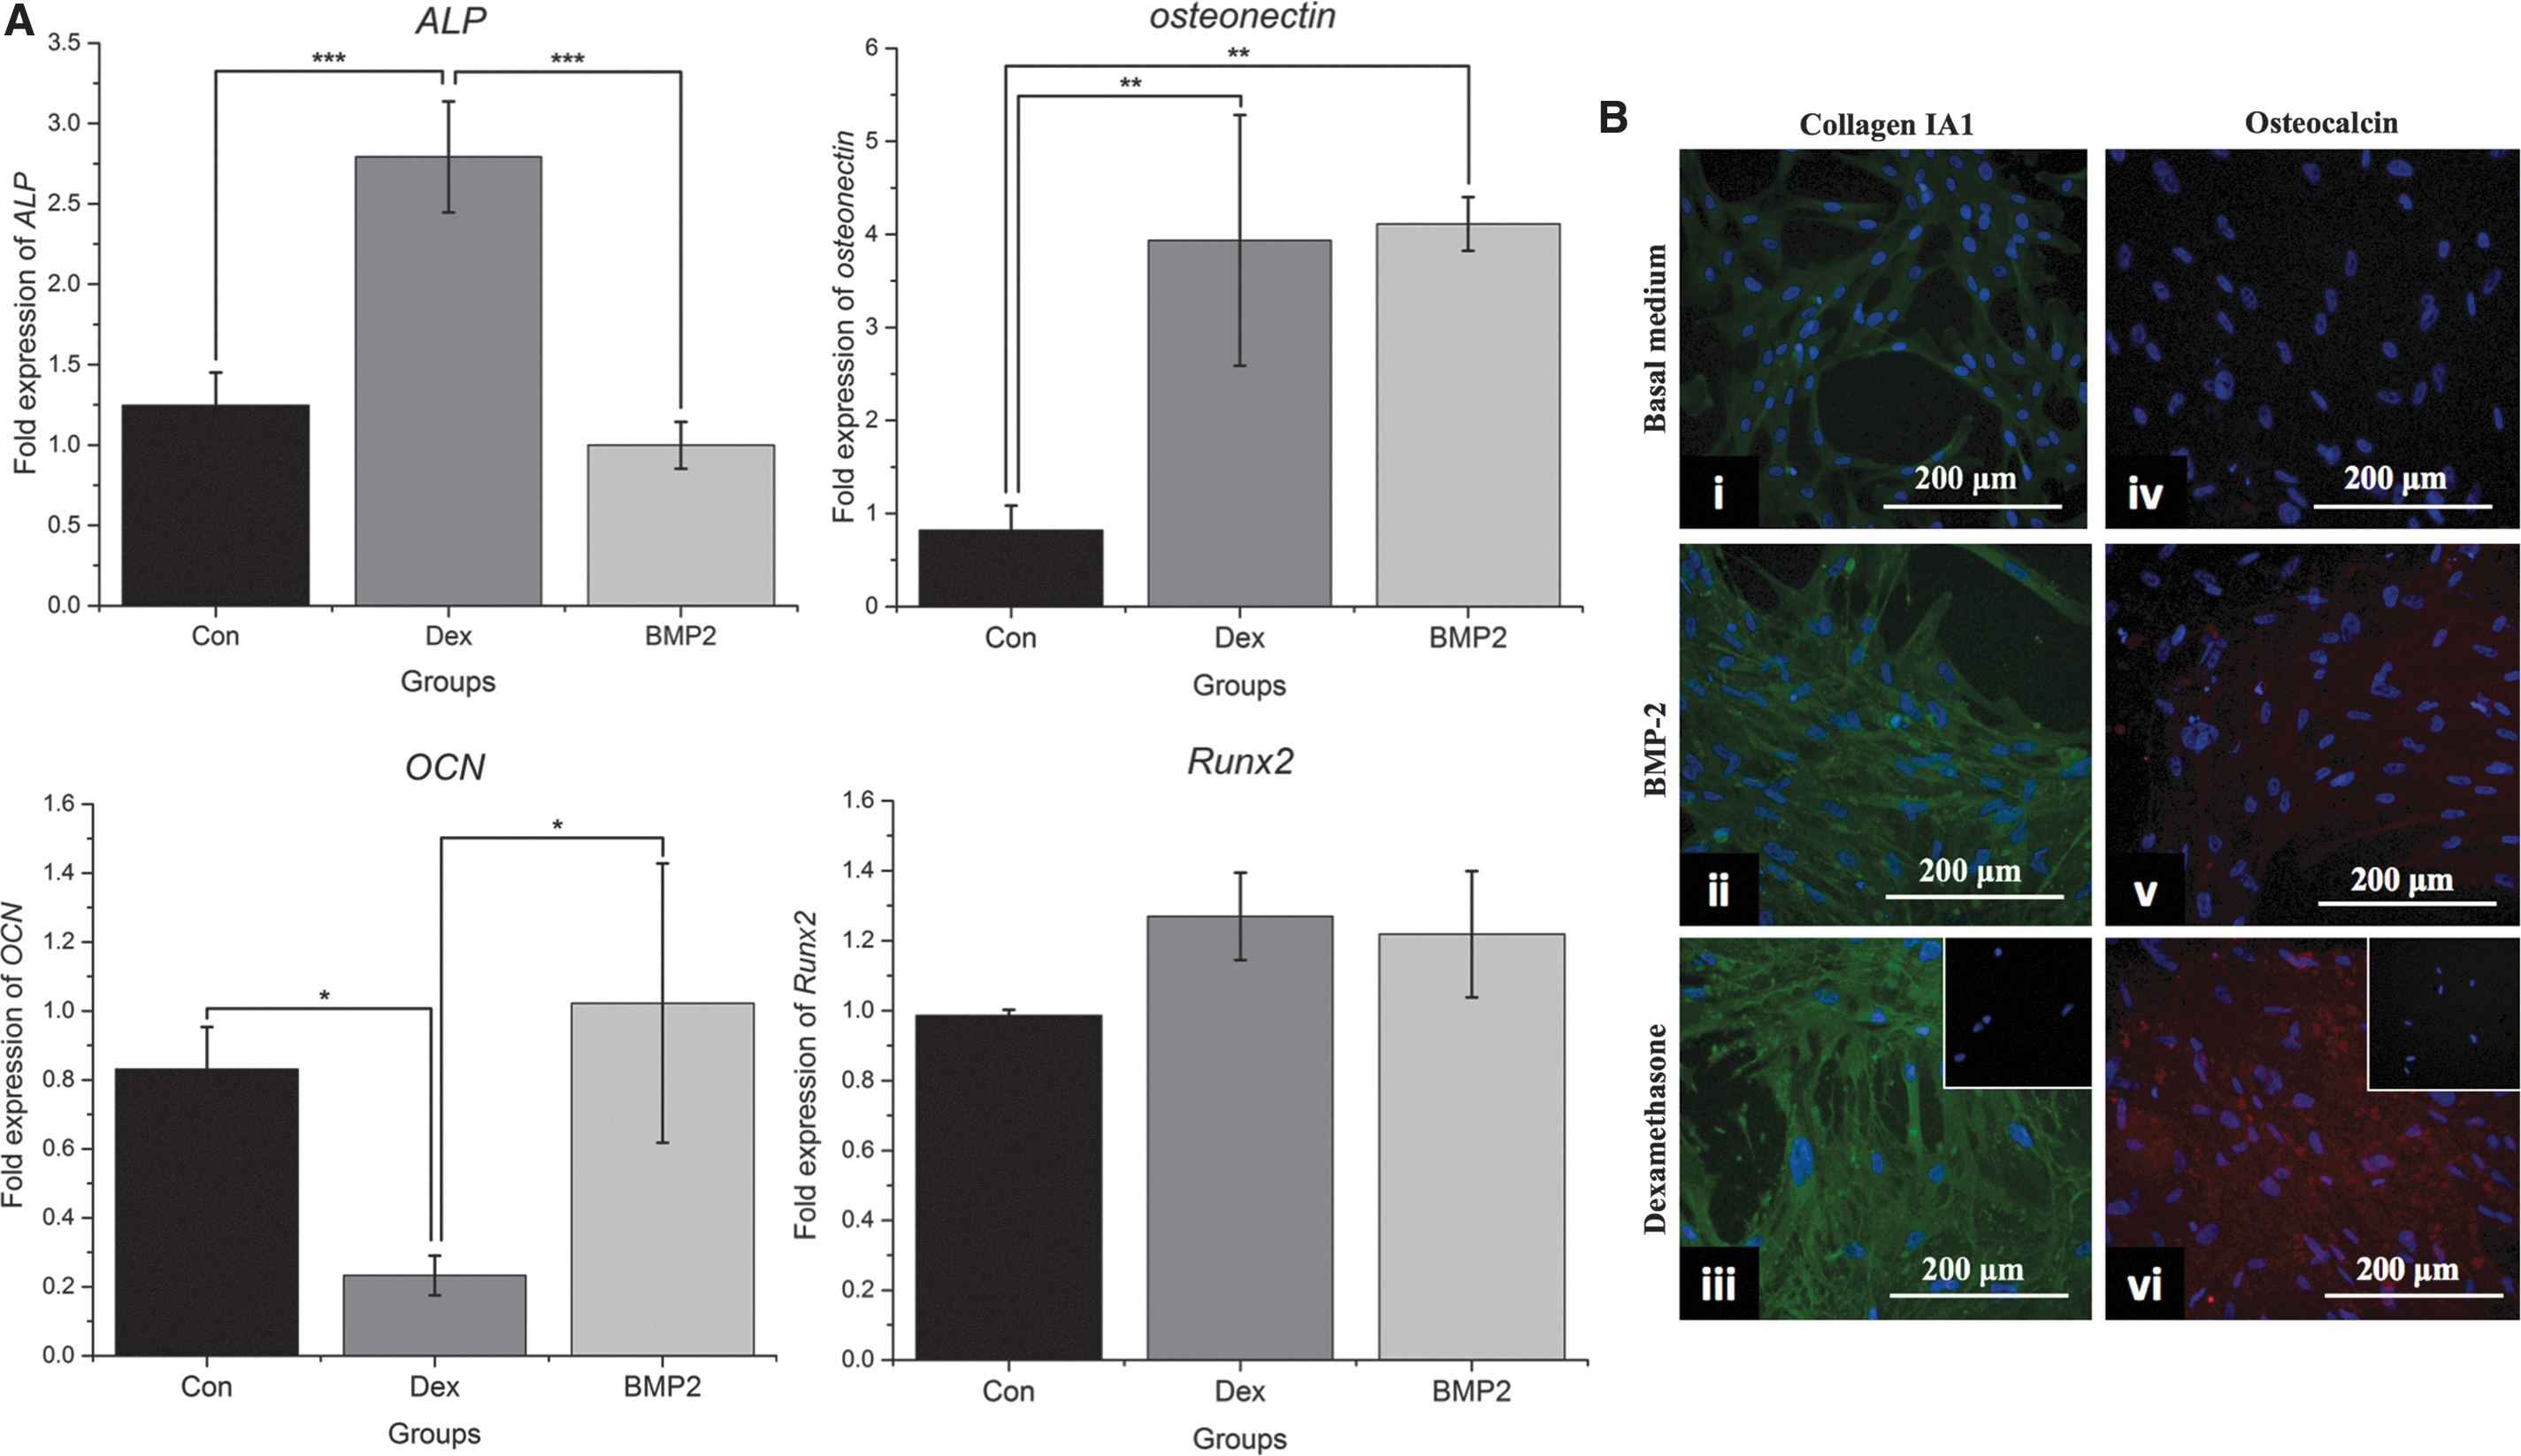
The ability of BMP-2 and dexamethasone to induce osteogenic differentiation and bone extracellular matrix production was evaluated over 21 days. To clearly assess their osteoinductive effects, each osteoinductive agent was applied individually. Direct comparison of the two groups showed that at day 7, mineralization in the BMP-2 group was not significantly higher than in the control group (P = 0.259) in contrast to dexamethasone-treated cells that exhibited significant mineralization (P < 0.05). At day 14, there was no significant difference between the mineralization of the two groups, which was higher than that of the control (P < 0.05), whereas at day 21, mineralization of the dexamethasone group was higher than that of the BMP-2 group (P < 0.001), as shown in Fig. 1A. ALP activity analysis further highlighted the differences between BMP-2 and dexamethasone. Specifically, BMP-2 failed to increase ALP activity compared with the control group; in contrast, dexamethasone significantly increased ALP activity throughout osteogenic differentiation (P < 0.001 at days 7 and 14, P < 0.01 at day 21), as shown in Fig. 1B. These results were corroborated by ALP gene expression in which dexamethasone significantly upregulated ALP gene expression (P < 0.001) at day 21, whereas BMP-2 had no influence, remaining at the same level as the control (P = 0.48, as shown in Fig. 2A).
Alizarin red S staining
Expression of osteogenic markers.
Expression of the rest of the osteogenic genes revealed that both dexamethasone and BMP-2 resulted in four times higher osteonectin mRNA levels than the control group (P < 0.01) and that Runx2 expression had no significant difference between the two groups. At day 21, no significant changes were noticed between the OCN mRNA levels of the control and the BMP-2 groups, whereas OCN gene expression was significantly downregulated by dexamethasone at this time point (Fig. 2A) (P < 0.05). However, immunofluorescence analysis showed that dexamethasone resulted in overall higher cumulative extracellular secretion of OCN and collagen type I over the whole differentiation period than BMP-2 (Fig. 2B). No difference in the proliferation rates was found between the two groups at days 7 and 14 of differentiation, although at the end of the differentiation period at day 21, the BMP-2 group had fewer cells (Supplementary Fig. S1; Supplementary Data are available online at
Differences in the osteogenic efficacy of dexamethasone and BMP-2 are associated with distinct metabolic transitions
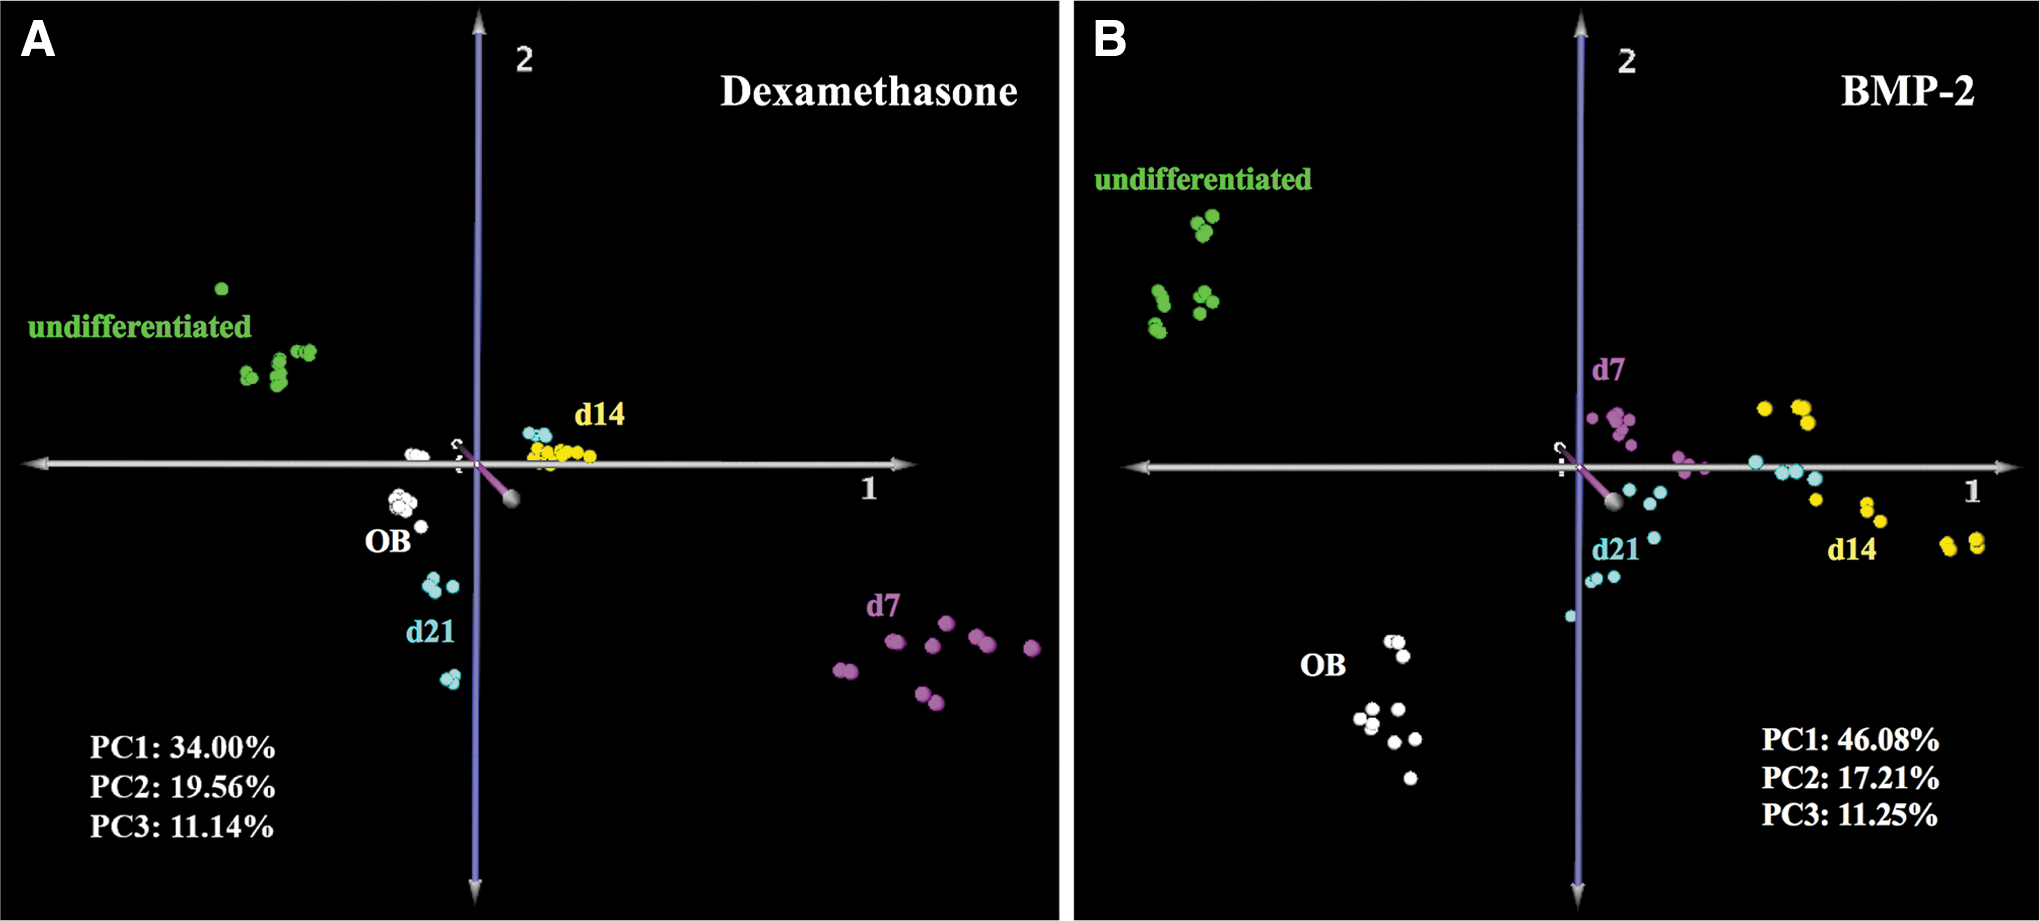
Metabolomics analysis was performed to evaluate the effects of dexamethasone and BMP-2 on the metabolism of UCB MSCs during osteogenesis and to compare with undifferentiated MSCs and primary osteoblasts. Analysis of metabolic profiles of cells stimulated with dexamethasone revealed a distinct pattern of metabolic transitions from undifferentiated to terminally differentiated cells. Specifically, PCA showed that exposure to either dexamethasone (Fig. 3A) or BMP-2 (Fig. 3B) resulted in cells transitioning to a metabolic state different from that of untreated cells. The day 7 metabolomics profile of dexamethasone-treated cells was different from that of days 14 or 21; interestingly, the metabolomics profile of day 21 dexamethasone-treated cells was similar to that of primary osteoblasts (Fig. 3A). In contrast, the metabolomics profiles of BMP-2-treated cells were relatively similar to each other; more importantly, the terminally differentiated day 21 BMP-2-treated cells displayed a metabolomics profile that was significantly different compared with that of human primary osteoblasts.
Principal component analysis of dexamethasone
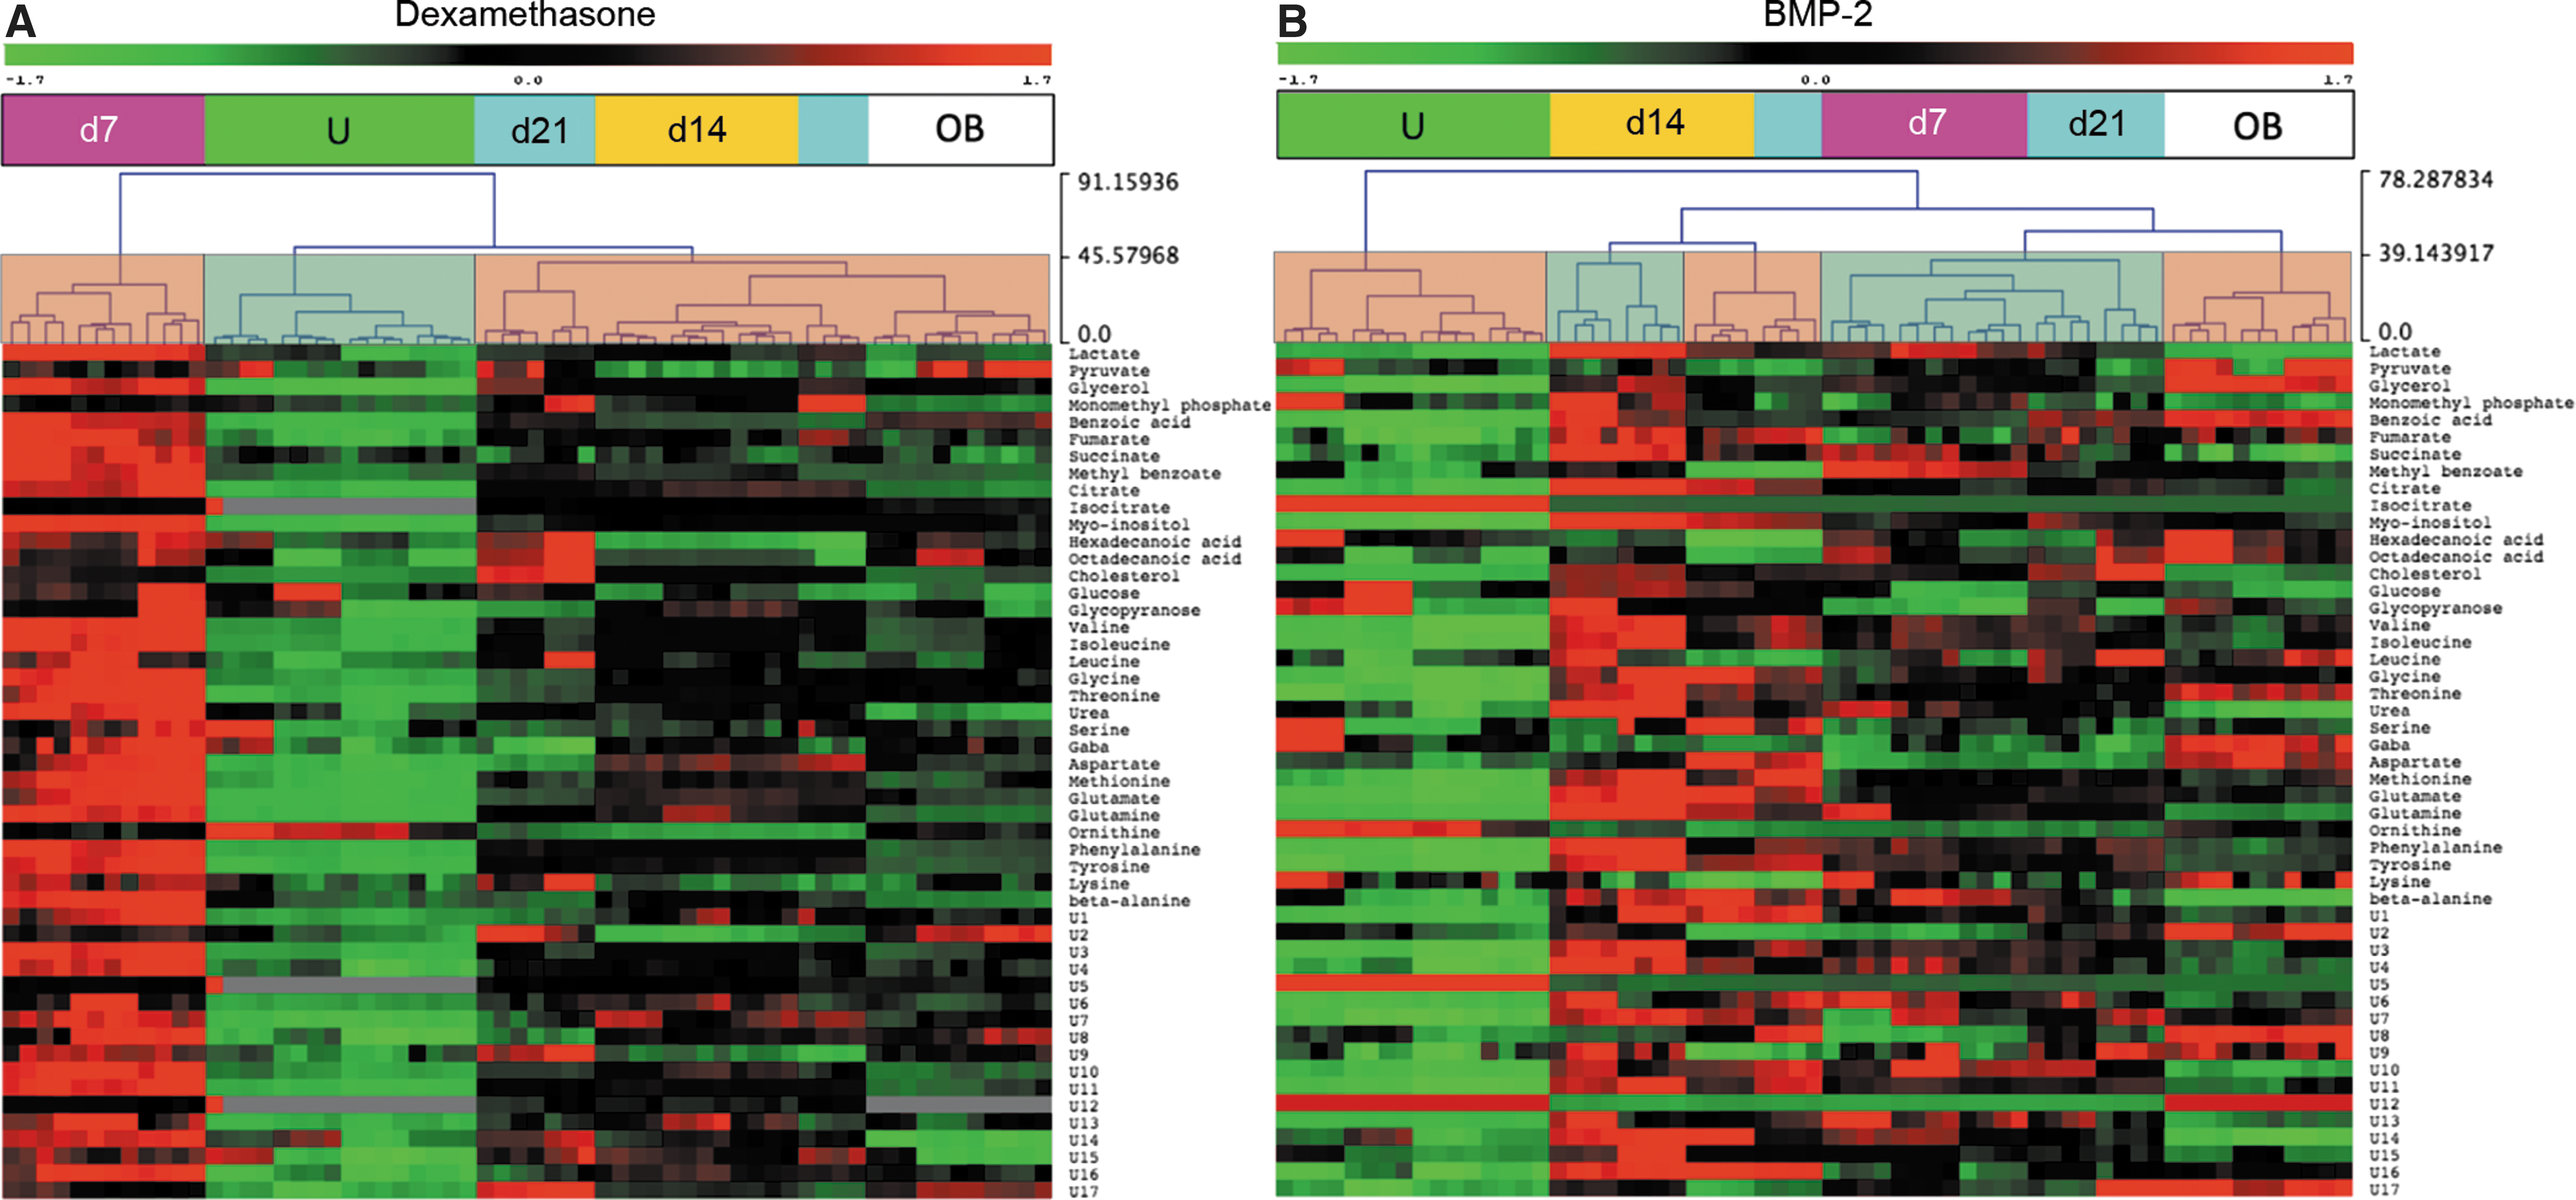
Unsupervised HCL identified distinct clusters in both the BMP-2 and dexamethasone groups. In the dexamethasone group (Fig. 4A), undifferentiated cells and day 7 cells formed two distinct clusters, whereas days 14 and 21 cells clustered together with osteoblasts. In addition, day 7 dexamethasone-treated cells were characterized by global metabolic hyperactivity. Unsupervised HCL of BMP-2-treated cells (Fig. 4B) was vastly different, as undifferentiated cells and osteoblasts formed separate clusters and the profiles of BMP-2-treated cells matched with each other in a mixed clustering pattern. Importantly, none of the BMP-2-stimulated cells clustered together with osteoblasts.
Hierarchical clustering of dexamethasone
SAM was utilized to reveal significant changes in individual metabolite concentrations over the differentiation time course, resulting in the reconstruction of the metabolic network, as shown in Fig. 5. As cells transitioned from the undifferentiated state to early stage of osteogenic induction (day 7), significant increases in concentration were observed in the amino acid pools in both groups. In addition, the concentration of glutamine, cholesterol, one-carbon metabolism intermediates (eg, serine, threonine, and methionine), phospholipid, and glycerolipid precursors (eg, glycerol and myoinositol) was significantly increased only in the dexamethasone group (Supplementary Table S1). The same changes in the BMP-2 group were observed, alas with a 7-day delay (day 14), whereby glucose, TCA cycle intermediates (eg, fumarate and citrate), and glutamate were significantly increased. In the dexamethasone-treated group, cells started to reduce the concentration of amino acids, lactate, lipid precursors as well as urea cycle (ornithine) and one-carbon metabolism intermediates at day 14 (Supplementary Table S2).
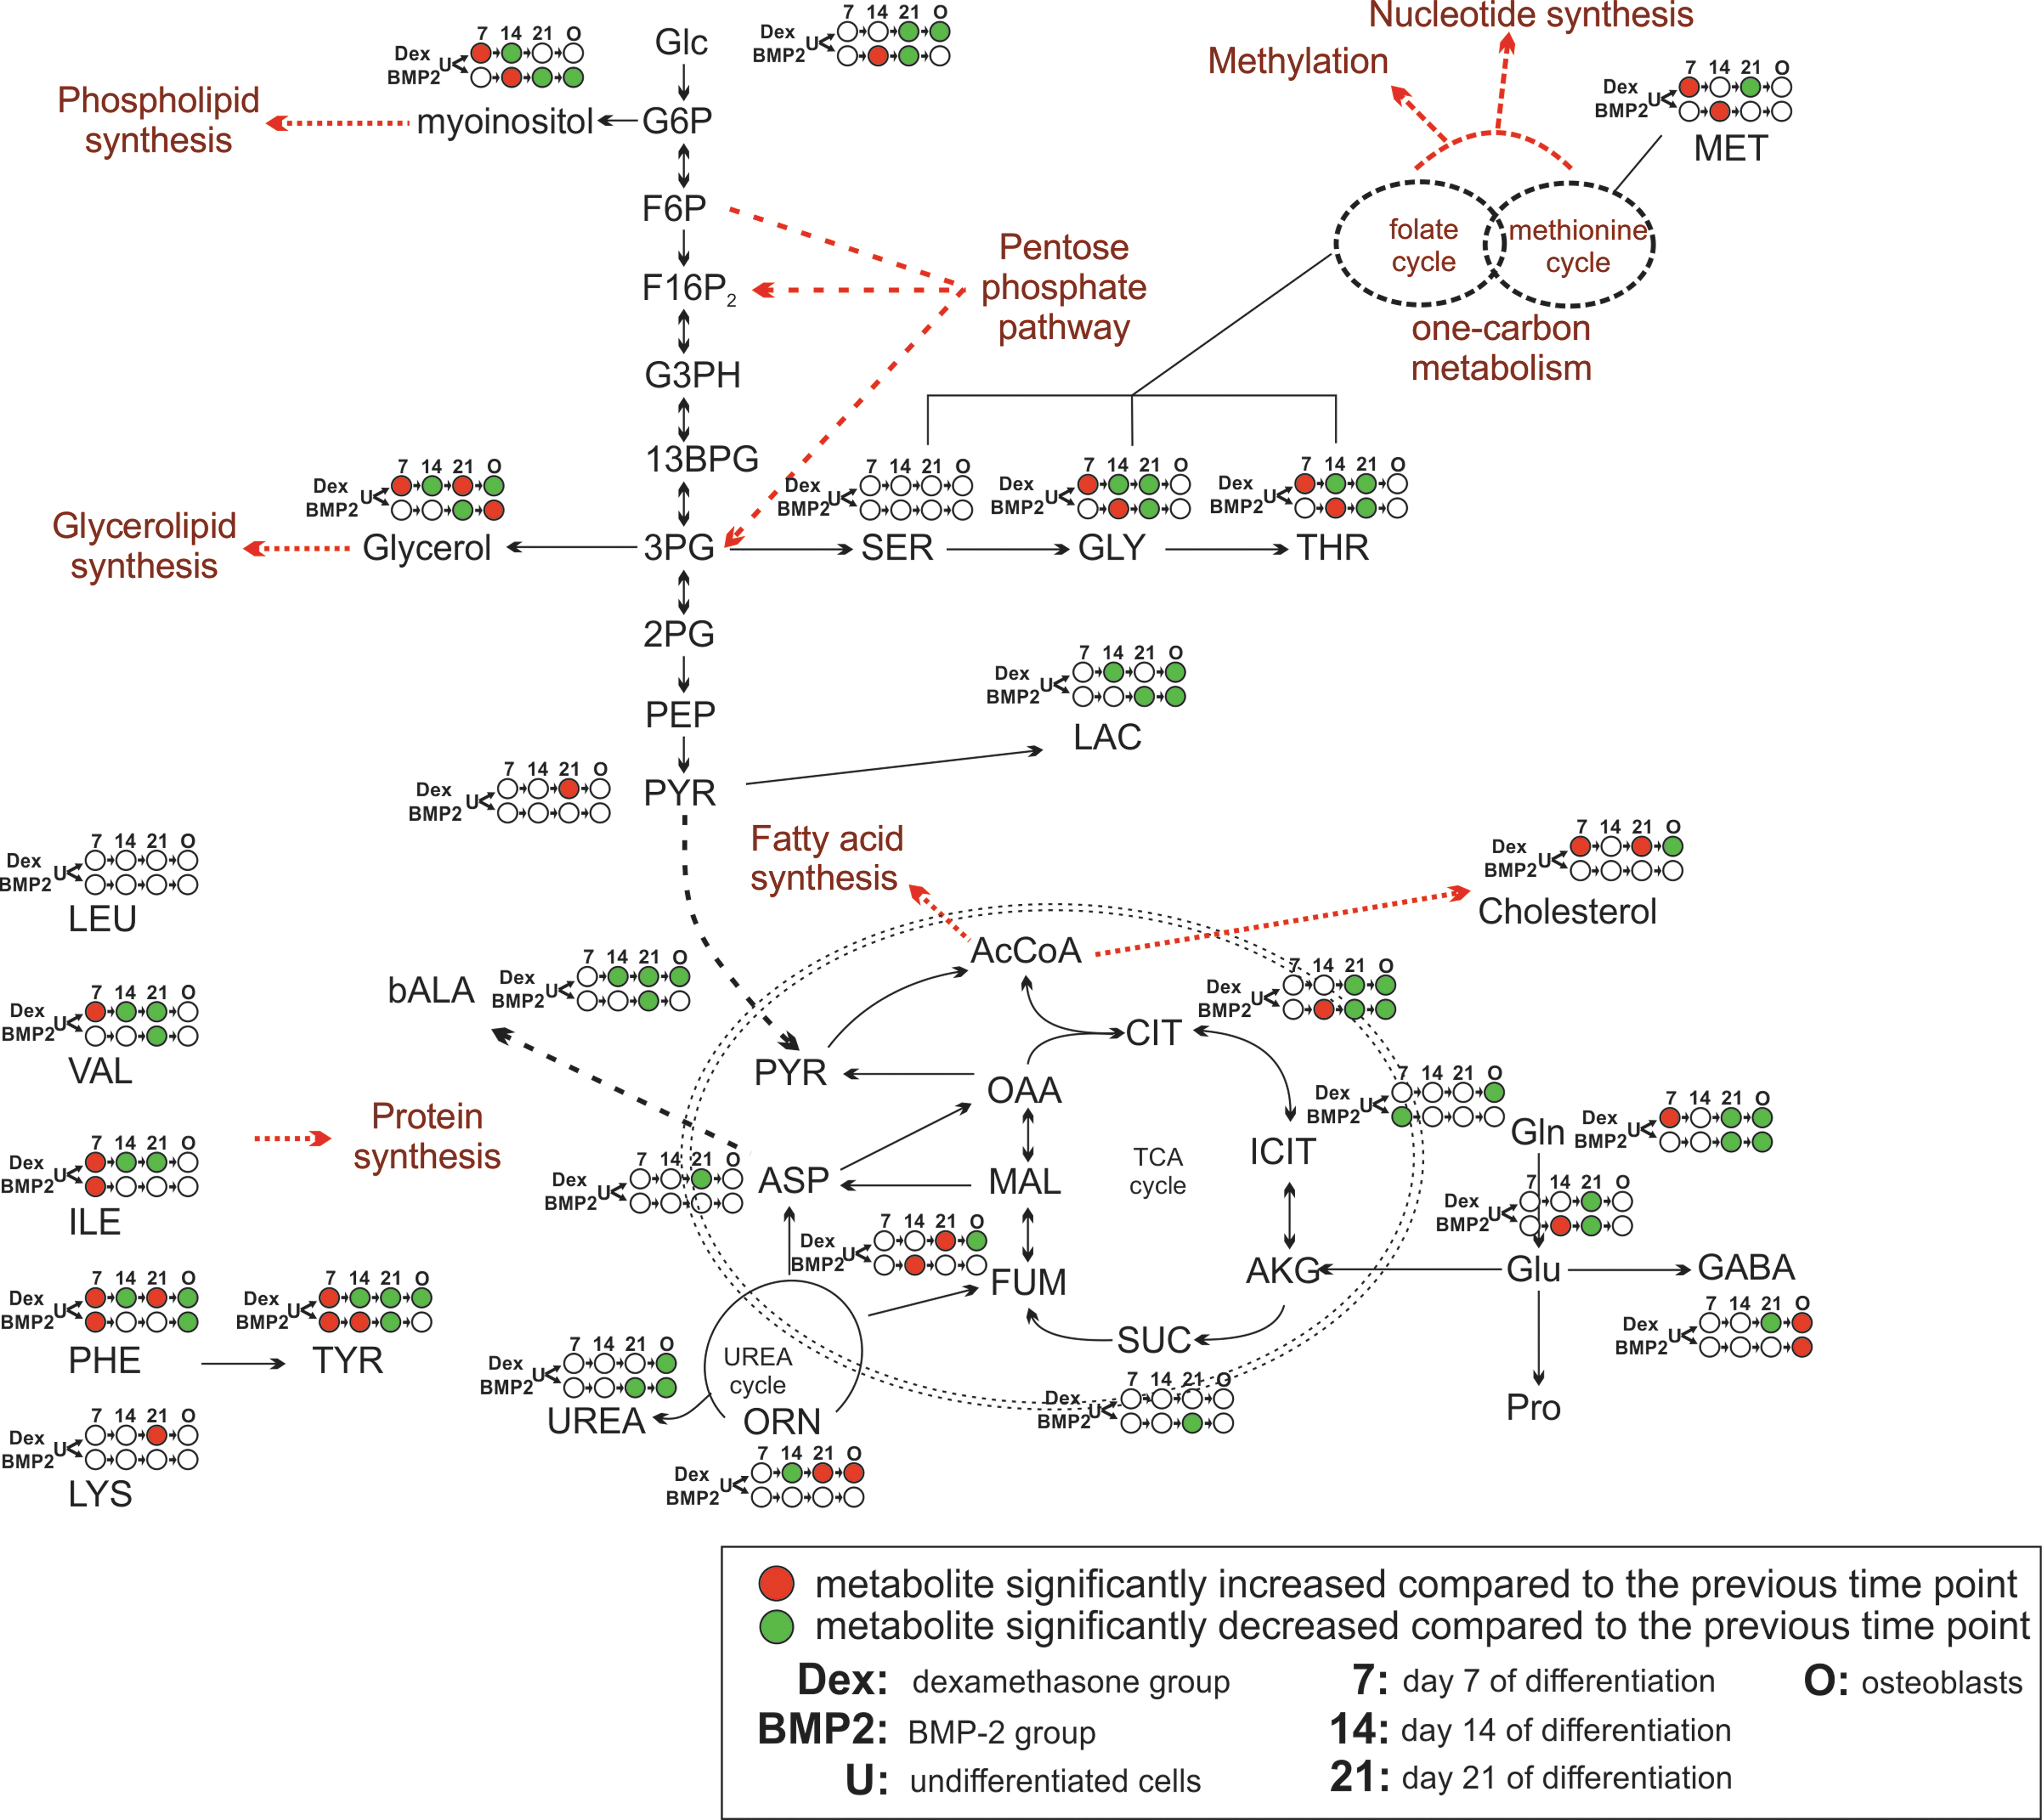
On-network time-course analysis of significant metabolite changes during osteogenic differentiation. Red and green represent a significantly increased or decreased metabolite with regard to the previous time point/condition, respectively. White indicates no significant change in the metabolite level compared with the previous time point/condition; 7, 14, 21, and O represent days 7, 14, 21, and osteoblasts, respectively.
At the final day of osteoinduction (day 21), the concentrations of TCA cycle, glycolysis, and glutaminolysis intermediates kept decreasing in both groups compared with the previous time point (day 14). In addition, unique changes in the day-21 dexamethasone-treated group included a further decrease in amino acid pools as well as increased concentrations of lipid-related molecules (eg, cholesterol and glycerol) and ornithine. Interestingly, the BMP-2-treated group at day 21 qualitatively displayed similar changes as those observed in day-14 cells stimulated with dexamethasone (Supplementary Table S3). A comparison of the metabolite concentrations of the terminally differentiated cells with those of primary osteoblasts revealed that osteoblasts had significantly higher glycerolipid and lower phospholipid precursors as well as lower lactate and glutamine levels than the day-21 BMP-2 treated cells (Fig. 5). In contrast, osteoblasts had lower glucose, lactate, glutamine, lipid precursors, and TCA cycle (citrate, isocitrate, and fumarate) levels than day-21 dexamethasone-treated cells (Fig. 5 and Supplementary Table S4).
Discussion
A comprehensive analysis of UCB MSC metabolism during osteogenesis employing two of the most commonly used osteoinductive agents, dexamethasone and BMP-2, was performed. BMP-2 was shown to be less effective than dexamethasone in inducing UCB MSC osteogenesis. Importantly, metabolic profiling revealed differences in the osteogenic capacity of both agents and proved that cells undergo specific metabolic alterations before reaching a terminal metabolic state that reflected their degree of differentiation.
Metabolomics comparison of in vitro-differentiated cells and primary human osteoblasts demonstrated that metabolism has the potential to accurately capture the extent of osteogenic differentiation. Despite the variability in osteogenic marker expression, metabolomics described the overall differentiation process and revealed the differentiation stage of the cells, suggesting using metabolic profiling as a tool of monitoring stem cell bioprocesses, such as maintenance and differentiation, and establishing quality control criteria for both the bioprocess and the product. Similar analyses have been employed to investigate the effects of different culture conditions on MSC metabolism during differentiation. Specifically, Muñoz et al. showed that MSCs rely on high oxygen concentration for their successful osteogenic differentiation when stimulated with dexamethasone for 21 days and subsequently cultured for 3 days under either hypoxic or normoxic conditions [16]. Alas, in their study, metabolomics analysis was performed after completing the osteogenic differentiation process for 21 days in normoxia and consequently overlooking the potential role of hypoxia during the osteogenic differentiation of MSCs as well as not correlating the metabolomics results to gene expression [32 –34]. Utilization of metabolomic profiles as biomarkers of MSC differentiation was also suggested by Jang et al., who used nuclear magnetic resonance spectroscopy to monitor chondrogenesis [14]. Surrati et al. [35] monitored osteogenesis of mouse MSCs with the use of dexamethasone by performing metabolomics of the culture medium, finding increased TCA cycle and glycerol derivatives in the medium. Nevertheless, their approach is limited by the fact that extracellular metabolites provide only a rough approximation of intracellular metabolism [36].
UCB MSC differentiation employing dexamethasone was characterized by fluctuations in cellular metabolic activity. The activation of pathways related to lipid and protein biosynthesis as well as energy production during the onset of osteogenic differentiation (day 7) could be attributed to a metabolic shift toward gluconeogenesis as observed in cancer cells stimulated by glucocorticoids such as dexamethasone [37]. However, the fact that glucose was provided in excess in the culture medium did not facilitate the detection of intracellular glucose production because of gluconeogenesis. Cells could have also increased their metabolic activity as a result of increased proliferation [38,39], a possibility that is not supported as proliferation was found similar between the dexamethasone- and BMP-2-treated groups. Therefore, the most plausible explanation for this phenomenon is that in response to dexamethasone, cells increase their metabolic rates to support the induction of the differentiation processes that require building blocks (eg, amino acids and lipids). Nonetheless, further research is needed to elucidate the exact mechanism(s) responsible for this phenomenon. Metabolic fluctuations of smaller magnitude noticed in BMP-2-stimulated cells were proven less significant than those in the dexamethasone group. These observations highlight the fact that metabolism changes significantly during (osteogenic) differentiation and is agent-specific, necessitating the development of “dynamic application- and agent-specific” bioprocesses (including culture media), because current protocols use the same culture medium and provide the same nutrients throughout the culture process irrespective of maintenance or differentiation protocols [40].
In terms of energy production, UCB MSCs displayed a less proliferative metabolic phenotype toward the end of differentiation (day 21) using dexamethasone, reflected by reduced glycolytic rates, TCA cycle, and glutaminolysis activities. These findings are in agreement with Chen et al. who showed increased mitochondrial activity and decreased intracellular ROS during dexamethasone-induced osteogenic differentiation of bone marrow MSCs, suggesting a transition from glycolysis to OXPHOS during osteogenesis [5]. Similarly, Pattappa et al. showed that, in contrast to MSCs differentiated toward the chondrogenic lineage, those differentiated toward the osteogenic lineage with the use of dexamethasone retained high oxygen consumption and, therefore, an oxidative phenotype throughout the process [6]. However, our findings differ from the results of Shum et al. [7], who showed that glycolytic rates remained the same in undifferentiated cells despite the increase in OXPHOS. This discrepancy is explained by the fact that Shum et al. investigated bone marrow MSCs that were not stimulated with dexamethasone and confined their study at the transcriptome rather than the metabolome.
Threonine and one-carbon cycle metabolism were correlated with the degree of differentiation earlier in the dexamethasone group (day 7) and delayed in the BMP-2 group (day 14). The activity of these pathways was reduced by both agents at the end of the differentiation process (day 21). These findings correlate with the loss of stemness associated with differentiation as suggested by results demonstrating that mouse pluripotent stem cells rely on threonine catabolism, one-carbon metabolism, and folate pools for maintaining pluripotency, which is lost when deprived of threonine [41].
Human UCB MSCs were less responsive to BMP-2 than to dexamethasone. BMP-2 is an osteoinductive growth factor that has received FDA approval for use in patients [42]. Although it is considered a potent stimulator of the osteogenic process, it is well established that responsiveness of MSCs to BMP-2 varies according to factors such as the MSC source and the age of the donor [43,44]. Responsiveness to BMP-2 also varies between species as rat bone marrow MSCs consistently increase their ALP activity when exposed to BMP-2, whereas human MSCs require the presence of dexamethasone along with BMP-2 to achieve the same ALP enzyme activity and mRNA levels [45 –47]. Osteoblastic gene transcription and bone extracellular matrix synthesis further confirmed that BMP-2 cells achieved an extent of osteogenic differentiation, which was inferior to that observed in the dexamethasone group. The inability of BMP-2 to activate Runx2, shown by Osyczka et al. [48], or the low expression of BMP-2 receptors, which is significantly increased when dexamethasone is coadministered with BMP-2 [45], provides plausible explanations of our results.
Downregulation of OCN under the effect of dexamethasone at day 21 was in agreement with the results of Wang et al., who showed that OCN in UCB MSCs increases during the second week of differentiation followed by a dramatic decrease at the end of differentiation, reaching levels lower than the control group [49]. Such an early increase in OCN followed by a late decrease in its expression levels could also be indicated by the fact that the secretion of OCN in the extracellular matrix was higher in our dexamethasone group. The more efficient cumulative secretion of OCN in dexamethasone-treated cells over 21 days could also be attributed to differences in protein translation or post-translational modifications at some point during the 3-week process. The increasing clinical importance of both UCB MSCs and BMP-2 highlights the importance of our observations. Nevertheless, it is critical to stress that in vitro results differ from in vivo data, in which circulating endogenous glucocorticoids may potentiate the action of exogenously administered BMP-2.
In conclusion, differences in the osteogenic efficiency of dexamethasone and BMP-2-treated UCB MSCs were observed through the use of metabolomics with BMP-2 being less effective. Comprehensive metabolic analysis represents a sensitive and efficient monitoring tool in elucidating key pathways activated during various stages of a stem cell bioprocess, such as differentiation, and can be utilized for the optimization of culture conditions and the development of optimal and robust bioprocesses as well for quality control of the bioprocess and the cell product, as stem cell-based cellular therapies achieve increasing clinical significance.
Footnotes
Acknowledgment
This project has received funding from the European Union's Horizon 2020 research and innovation program, under the Marie Skłodowska-Curie grant agreement no. 675585.
Author Disclosure Statement
No competing financial interests exist.
References
Supplementary Material
Please find the following supplemental material available below.
For Open Access articles published under a Creative Commons License, all supplemental material carries the same license as the article it is associated with.
For non-Open Access articles published, all supplemental material carries a non-exclusive license, and permission requests for re-use of supplemental material or any part of supplemental material shall be sent directly to the copyright owner as specified in the copyright notice associated with the article.