
Abstract
Bmi1 is a component of the Polycomb repressive complexes and essential for maintaining the pool of adult stem cells. Polycomb repressive complexes are key regulators for embryonic development by modifying chromatin architecture and maintaining gene repression. To assess the role of Bmi1 in pluripotent stem cells and on exit from pluripotency during differentiation, we studied forced Bmi1 expression in mouse embryonic stem cells (ESC). We found that ESC do not express detectable levels of Bmi1 RNA and protein and that forced Bmi1 expression had no obvious influence on ESC self-renewal. However, upon ESC differentiation, Bmi1 effectively enhanced development of hematopoietic cells. Global transcriptional profiling identified a large array of genes that were differentially regulated during ESC differentiation by Bmi1. Importantly, we found that Bmi1 induced a prominent up-regulation of Gata2, a zinc finger transcription factor, which is essential for primitive hematopoietic cell generation from mesoderm. In addition, Bmi1 caused sustained growth and a >100-fold expansion of ESC-derived hematopoietic stem/progenitor cells within 2–3 weeks of culture. The enhanced proliferative capacity was associated with reduced Ink4a/Arf expression in Bmi1-transduced cells. Taken together, our experiments demonstrate distinct activities of Bmi1 in ESC and ESC-derived hematopoietic progenitor cells. In addition, Bmi1 enhances the propensity of ESC in differentiating toward the hematopoietic lineage. Thus, Bmi1 could be a candidate gene for engineered adult stem cell derivation from ESC.
Introduction
S
PcG proteins were initially described in Drosphila, where they control embryonic development by repressing homeotic gene expression [5 –7]. PcG proteins are conserved from Drosphila to humans, and most of them are involved in maintenance of cellular memory by modifying chromosome structure and silencing gene expression. PcG proteins occur in large protein complexes to exert transcriptional repressor activity, referred to as Polycomb repressive complexes (PRC) [6,7]. In mammals, 2 PRC complexes, PRC1 and PRC2, have been described. PRC2, which contains Eed, Suz12, and Ezh2 proteins, is recruited to chromatin and trimethylates lysine residue 27 of histone 3 (H3K27me3). PRC1 contains Bmi1, Ring1A/B, Cbx, Mel18, and Mph and is recruited to specific sites formed by PRC2, referred to as maintaining complex [7].
PRC and H3K27me3 co-occupy cis-regulatory elements of a large number of development-associated genes [8,9]. Genome-wide mapping of histone modification in embryonic stem cells (ESC) identified regions that are modified with both H3K27me3 and histone 3 lysine 4 trimethylation (H3K4me3) [9 –12]. H3K4me3 is catalyzed through trithorax group proteins and associated with active transcription units [7]. The simultaneous occurrence of H3K4me3 and H3K27me3, referred to as “bivalent domain,” effectively controls gene transcription and poise genes in a ready-for-transcription status [10,11].
Down-regulation of the PRC2 component Eed and Suz12 caused silenced differentiation-associated genes to become re-expressed in ESC [9,12]. Further, ESC could not be established from Ezh2 deficient mice [13]. For PRC1, it has been shown that RingA/B is directly involved in the transcriptional network associated with ESC pluripotency [14]. All these studies indicate that PcG proteins are highly critical for embryonic development, the establishment and maintenance of ESC pluripotency. Recent studies demonstrated that PRC2 components, such as Ezh2 and Suz12, also orchestrate gene expression in adult stem cells [15 –17].
Unlike other PcG components that are ubiquitously expressed during development, Bmi1, a key component of PRC1, is selectively expressed in diverse postnatal adult stem cells, including neural stem cells (NSC) and hematopoietic stem cells (HSC) [18 –22]. Bmi1 activity in maintaining the pool of adult stem cells is mainly due to repression of the Ink4a/Arf locus, which encodes inhibitors of the cell cycle kinase p16Ink4a and p19Arf [18,19,23,24]. Accordingly, in Bmi1 deficient (Bmi1−/−) mice, the number of adult HSC is markedly decreased. Additionally, in competitive transplantation experiments, the repopulation capacity of Bmi1−/− HSC was significantly decreased, thus mirroring their deficiency in self-renewal [19,20]. In fact, with HSC differentiation, Bmi1 expression declines gradually [25]. In contrast, Bmi1 over-expression enhances HSC self-renewal in both the human and mouse system [26,27]. Thus, there is multiple evidence of Bmi1 activity in maintaining the pool of adult stem cells, yet its role in pluripotent stem cells and on transition toward adult stem/progenitor cells has so far not been studied.
Here, we examined the activity of Bmi1 on ESC and on hematopoietic stem/progenitor cells derived from ESC. We present evidence for a novel activity of Bmi1 in enhancing hematopoietic cell development from ESC.
Materials and Methods
Cells and cell culture
ESC culture was performed as previously described [4]. Briefly, R1 ESC were cultured on irradiated mouse embryonic fibroblasts (MEF) feeder. E14 and CCE ESC were cultured on 0.1% gelatin (Sigma-Aldrich) precoated dishes with ESC medium. ESC medium was Dulbecco's modified Eagle's medium (DMEM, high glucose) supplemented with 15% heat-inactivated fetal calf serum (FCS; Lonza), 25 mM HEPES and 1,000 U recombinant leukemia inhibitory factor (LIF, a kind gift of Anna M. Wobus, IPK, Gatersleben, Germany), 2 mM L-glutamine, 100 units penicillin/100 μg streptomycin, 0.1 mM nonessential amino acids, and 50 μM β-mercaptoethanol. ESC differentiation medium was ESC medium but with 10% FCS and without LIF. ESC were cultured at 37°C with 5% CO2. Medium was refreshed daily, and cells were passaged every 2–3 days before reaching confluency. OP9 stroma cells (a kind gift of Ursula Just, University of Kiel, Kiel, Germany) were grown in α-MEM supplemented with 20% FCS (both from PAN Biotech), 2 mM L-glutamine, 100 units penicillin/100 μg streptomycin, 25 mM HEPES, and 100 μM β-mercaptoethanol. 293T human embryonic kidney cells were maintained in DMEM medium containing 10% FCS, 2 mM L-glutamine, and 100 units penicillin/100 μg streptomycin. Unless stated differently, all reagents were purchased from Invitrogen.
Bmi1 lentivirus vector and infection of ESC
Bmi1 cDNA was obtained from mouse NSC [4] by reverse transcriptase (RT)-polymerase chain reaction (PCR) (forward primer 5′-GCCGCCACCATGCATCGAACAACCAGAATC; reverse primer 5′-GGGATCCCTAACCAGATGAAGTTGCTGATGACCC) and cloned into pJET vector (Fermentas Life Sciences). Bmi1 sequence was released from the construct by XbaI and BamH1 digestion and subcloned into XbaI/BamH1 sites of FUGIE vector (a kind gift from Filip Farnebo, Karolinska Institute, Stockholm, Sweden). The Bmi1 cDNA was verified by sequencing. FUGIE vector contains the human ubiquitin C promoter driving Bmi1 expression and an internal ribosome entry site (IRES) for expression of enhanced green fluorescent protein (GFP).
For infection of ESC, lentivirus was produced from 293T cells. Briefly, 293T cells were transfected with 10 μg FUGIE or FUGIE-Bmi1 plasmid DNA, 7.5 μg pCMVΔR8.74 packaging plasmid, and 2.5 μg envelope vector pVSV-G. Virus supernatant was collected and used to infect ESC in the presence of 8 μg polybrene (Sigma-Aldrich). After 2 passages, infected GFP+ ESC were sorted by flow cytometry, and GFP+ ESC were further expanded. Alkaline phosphatase staining was performed with Alkaline Phosphatase Staining Kit II (Stemgent) according to the manufacturer's protocol.
ESC differentiation
ESC were subjected to differentiation by embryoid body (EB) assay. Briefly, ESC were trypsinized into single-cell suspensions. EB were generated in hanging drops at 100 cells per 10 μL drops in an inverted bacterial Petri dish for 2 days with ESC differentiation medium. EB were then collected and cultured in bacterial Petri dishes for an additional 4 days. For some experiments, ESC were directly subjected to EB formation in mass culture as previously described [28].
Hematopoietic cell differentiation from ESC
Hematopoietic cell differentiation from ESC was adapted from the protocol by Carotta et al. [29]. Briefly, ESC were differentiated by EB formation as just described. On day 6, EB were dissociated into single cells with 0.05% trypsin/ethylenediaminetetraacetic acid (EDTA) solution (Invitrogen), and cells were passed through a 40 μm cell strainer. Cells were then plated on gelatin-coated dishes at 2×10⁶ cells/mL in serum-free medium (StemPro34 plus nutrient supplement; Invitrogen) supplemented with 25 ng/mL Flt3 ligand (Flt3L; PeproTech), 30 U/mL murine SCF, 5 ng/mL IL-6/soluble IL-6R fusion protein (hyper-IL-6) [30], 40 ng/mL long-range IGF-1 (Sigma-Aldrich), 2 ng/mL murine IL-3 (PeproTech), and 1 μM dexamethasone (Sigma-Aldrich). After 2–3 days, nonadherent cells were harvested, passed through a 40 μm cell strainer, and further cultured in the same culture medium plus growth factors as just described. The cell concentration was maintained at 2×10⁶ cells/mL, and the medium was refreshed every 1–2 days. Cumulative cell numbers were determined with a CASY-1 cell counter and analyzer system (Schärfe Systems).
Colony-forming assay and cytospins
Day 6 EB were dissociated into single cells with 0.05% trypsin/EDTA as just described. Cells were collected and re-suspended in DMEM, 10% FCS at 1×10⁶ cells/mL; and 100 μL of cell suspension was added to 3 mL MethoCult GF M3434 methylcellulose, containing insulin, transferrin, SCF, IL-3, IL-6, and erythropoietin (StemCell Technologies). Methylcellulose cultures were plated in two 35 mm dishes and incubated at 37°C with 5% CO2. The number of erythroid colonies was scored on day 4–5; myeloid colonies were evaluated at day 10. 1×10⁴ ESC-derived hematopoietic progenitor cells (ESC-HPC) were subjected to colony-forming units (CFU) assay in MethoCult GF M3434 methylcellulose as just described. Individual colonies were picked, washed, and cyto-centrifuged on slides. Cells were stained with neutral benzidine and histological dyes [31] and photographed.
Apoptosis and proliferation assays
To study the impact of Bmi1 expression on apoptosis during ESC differentiation, day 6 EB were dissociated with 0.05% trypsin/EDTA and passed through 40 μm cell strainer. Single-cell suspensions were incubated with 7-amino-actinomycin D (7-AAD) and allophycocyanin (APC)-conjugated Annexin V (BD Bioscience) according to the manufacturer's instructions. Cells were then subjected to flow cytometry. To determine the growth factor responses of Bmi1-ESC-derived HPC, a total of 5×10⁴ cells were incubated in 200 μL serum-free medium supplemented with different combinations of growth factors in a 96-well flat-bottom plate at 37°C for 48 h. Samples were then pulsed with 0.75 μCi/well [3H] thymidine (29 Ci/mmol; Amersham Biosciences) for 4 h and harvested onto glass fiber filters. Radioactivity was measured by liquid scintillation counting in a Microbeta counter (Wallac).
Western blot and immunofluorescence analysis
Cells were lysed in 2% sodium dodecyl sulfate with 5 mM EDTA. About 20 μg protein per well were subjected to polyacrylamide gel electrophoresis (12% sodium dodecyl sulfate-polyacrylamide gels) and transferred onto nitrocellulose membranes by Western blotting. Membranes were blocked overnight with 2% nonfat milk in phosphate-buffered saline (PBS) at 4°C and reacted with anti-Bmi1 antibody (Clone F6, 1:1,000 dilution; Millipore) at room temperature for 2 h. Anti-actin antibody (Clone AC-74, Sigma) was used to detect actin loading control. Peroxidase-conjugated anti-mouse secondary antibody (NA931, Amersham Biosciences) was incubated for 1 h at RT and detected by chemiluminescence (ECL; Amersham Biosciences). Images were acquired by Image Reader Las-1000 (Fujifilm).
For immunofluorescence staining, ESC were grown on gelatin-coated chamber slides, fixed with 1% formaldehyde, and permeabilized with PBS buffer containing 0.5% BSA, 0.1% Triton X-100. Cells on cover-slips were washed twice with 0.5% BSA in PBS buffer and then incubated with anti-Bmi1 antibody (Clone F6, Millipore). Secondary antibody was anti-mouse Alexafluor 647 (Invitrogen), and 4′,6-diamidino-2-phenylindole dihydrochloride (DAPI) was used to stain nuclei. Cover-slips were mounted on a glass slide with mounting medium, and images were acquired under bright and fluorescent fields with an Axiovert 200 microscope (Carl Zeiss).
RNA isolation and RT-PCR
Total RNA was isolated from cells with RNeasy Mini Kit (Qiagen). RNA quality and concentration were determined by spectrophotometer. Total RNA (1 μg) was used as template for reverse transcription with High Capacity cDNA Reverse Transcription Kit (Applied Biosystems). cDNA was then used for PCR amplification by Taq DNA polymerase (Fermentas Life Sciences). PCR fragments were separated on 2% agarose gels, and images were recorded with Gel-Doc system (BioRad).
The quantitative (q) PCR was carried out with 7300 Real-Time PCR system (Applied Biosystems). Reactions were performed with 50 ng cDNA, SYBR Green PCR master mix and primers (see Supplementary Table 2; Supplementary Data are available online at
Microarray analysis
RNA was isolated using RNeasy Mini Kit with DNase I digestion (Qiagen) and subjected to microarray analysis as earlier [4]. Briefly, sample preparation was performed according to the Expression Analysis Technical Manual (Affymetrix). GeneChip One-cycle Target Labeling Kit (Affymetrix) and 1 μg total RNA were used. Biotin-labeled cRNA was hybridized on Affymetrix Mouse Genome 430 2.0 GeneChip arrays. Arrays were stained, washed, and scanned according to the manufacturer's protocols. Gene expression levels were determined by GCRMA algorithm in R/Bioconductor. Hierarchical clustering was performed using Pearson correlation coefficient and the average linkage method and represented by dendrogram and heatmap. Differential expression between 2 conditions was analyzed using Student's t-test. The transcripts with fold change >2 and P-values <0.05 were considered as being differentially expressed. Raw P-values were adjusted by Benjamini and Hochberg's method. Data sets were submitted to Gene Expression Omnibus database (
Flow cytometry analysis
EB were dissociated into single cells by incubation with 0.05% trypsin/EDTA (5 min) or 0.1% collagenase IV (Gibco; 20 min) at 37°C and pipetting. Cells were passed through a 40 μm cell strainer, washed with PBS, and incubated with the following antibodies: phytoerythrin-conjugated anti-mouse Flk1 antibody (clone Avas 12alpha1, BD Pharmingen), eFluor 450-conjugated anti-mouse CD41 (clone MWReg30), and PE-Cy7-conjugated anti-mouse c-Kit (clone ACK2, both eBioscience) in fluorescent activated cell sorting (FACS) buffer. Isotype IgG was used as control. Samples were measured by FACSCanto (BD Biosciences) and analyzed by Flowjo software (Tree Star). CD41+ c-Kit+ cells from day 6, 8, and 10 EB-derived cells were sorted by FACSAria cell sorting system (BD Biosciences).
For immunophenotyping of hematopoietic cells from Bmi1-ESC, 1×10⁶ cells were washed with 1×PBS and incubated with corresponding antibodies in FACS buffer for 30 min. Samples were measured by FACSCanto, and results were analyzed by Flowjo software. The following antibodies were used: APC-Cy™7 rat anti-mouse CD45 (A95-1), PE-Cy7 anti-mouse c-Kit (ACK2), PE anti-mouse CD24 (M1/69), PE-Cy5 anti-mouse Sca-1 (D7), PE anti-mouse CD34 (MEC 14.7), APC anti-mouse CD133 (13A4), APC anti-mouse CD115 (AFS98), pacific blue anti-mouse CD11b (M1/70), biotin anti-mouse Ter119 (Ter119), biotin anti-mouse Gr-1 (RB6-8C5), and unlabeled anti-mouse CD14 (mC5-3). For Ter119, Gr-1, and CD14, the corresponding secondary antibodies were added after incubation with the first antibody. CD34 antibody was from Invitrogen; all other antibodies were from BD Biosciences or eBioscience.
Statistics
Results are given as the mean±standard deviation. The Student's t-test was applied for paired samples of microarray data. EB size was calculated with Image-Pro Plus 6.0 software and quantified with SPSS software (version 10, SPSS, Inc.).
Results
Forced Bmi1 expression in ESC leaves self-renewal unaffected
Expression of Bmi1 and other PRC components was determined in ESC, NSC, MEF, and bone marrow (BM) mononuclear cells by q-PCR analysis. There was no or very low Bmi1 expression in ESC (R1, E14, and CCE lines), whereas Bmi1 was abundantly expressed in NSC and BM cells (Fig. 1A). There was also some Bmi1 expression in MEF. The PRC components Ezh2 and Suz12 were highly expressed in ESC, corroborating their transcriptional role in ESC [9,12]. As expected, the pluripotency gene Oct4, used as a control, was expressed in ESC but not in somatic cells. Importantly, Bmi1 expression was rapidly induced during ESC differentiation in EB assays (Fig. 1B and below Supplementary Fig. S3).
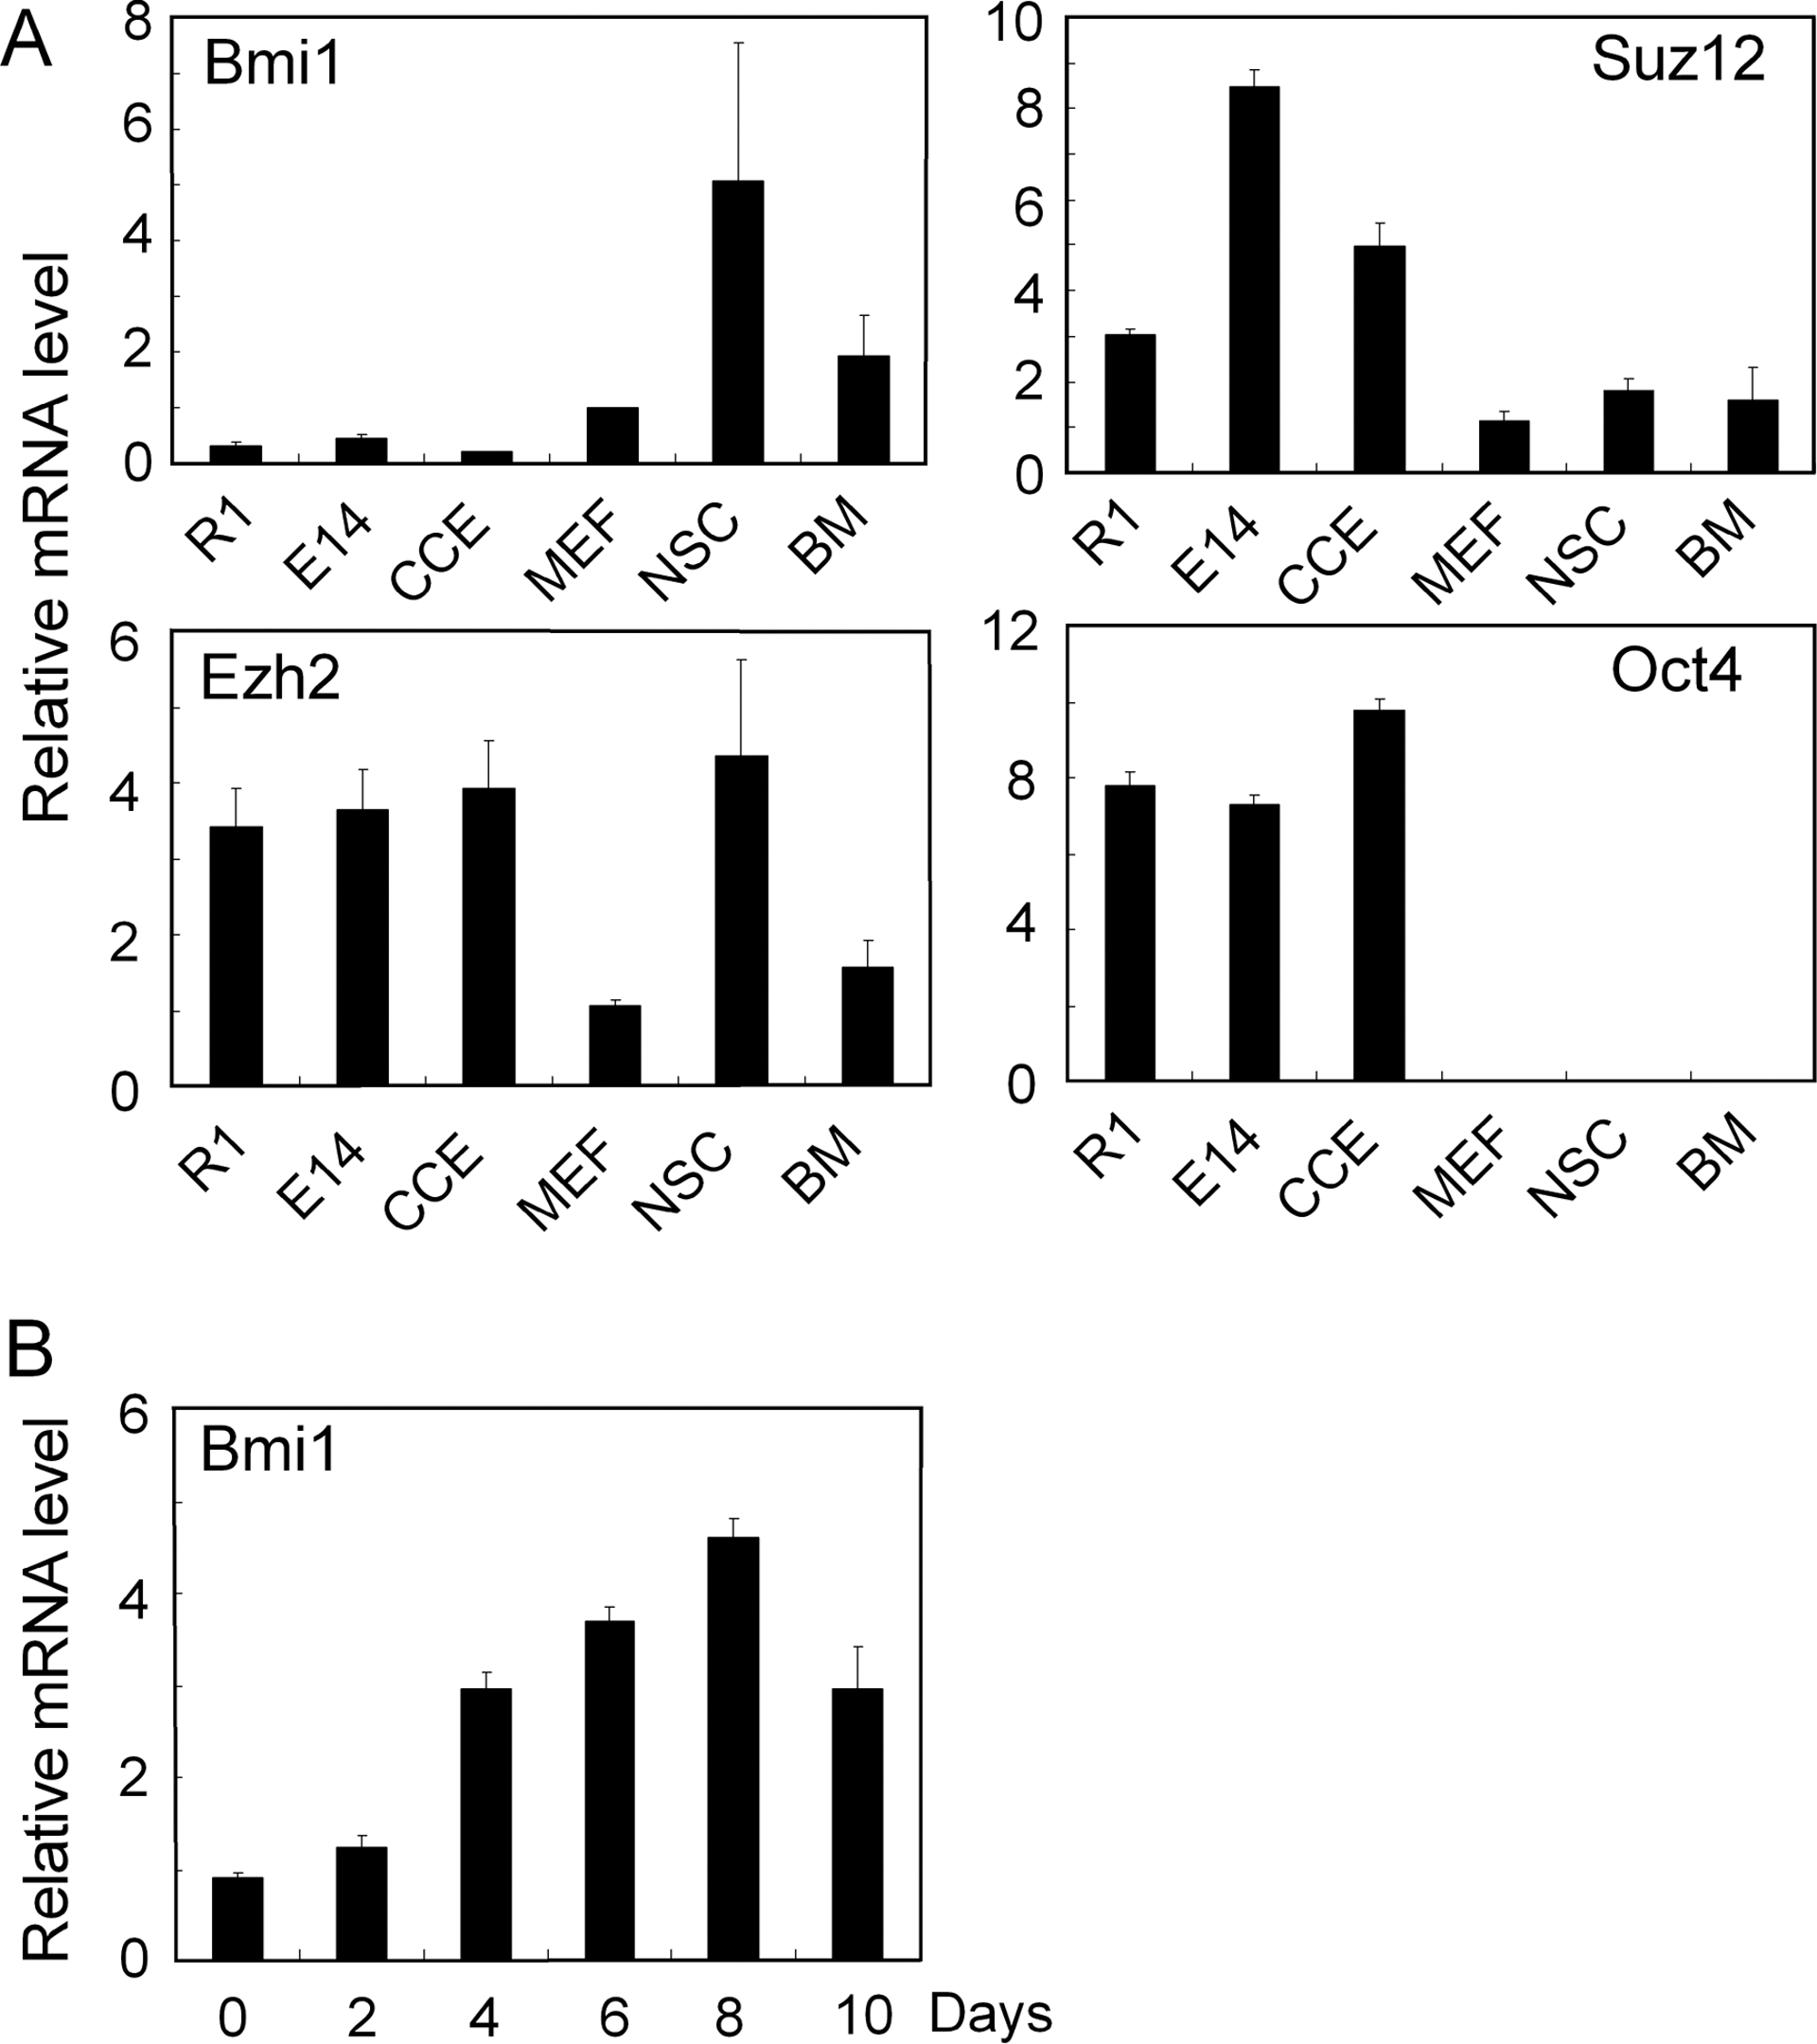
Bmi1 is not expressed in ESC.
The absence of Bmi1 in ESC and its up-regulation during their differentiation was surprising, and we, thus, sought to investigate the impact of enforced Bmi1 expression on ESC growth and differentiation. CCE ESC were transduced with lentivirus vector containing Bmi1 cDNA (Fig. 2A). By examining IRES-driven GFP expression by flow cytometry, infection efficiencies were routinely ∼50% (data not shown). GFP+ cells were FACS sorted, thereby achieving a purity of >95% Bmi1-GFP-transduced cells (Fig. 2B), and we refer to these cells as Bmi1-ESC. Bmi1 expression in Bmi1-ESC was confirmed by immunofluorescence and immunoblotting with anti-Bmi1 antibody (Fig. 2C and D). Bmi1 protein was abundantly expressed both under growth conditions and after ESC differentiation in EB assays (day 14, Fig. 2D).
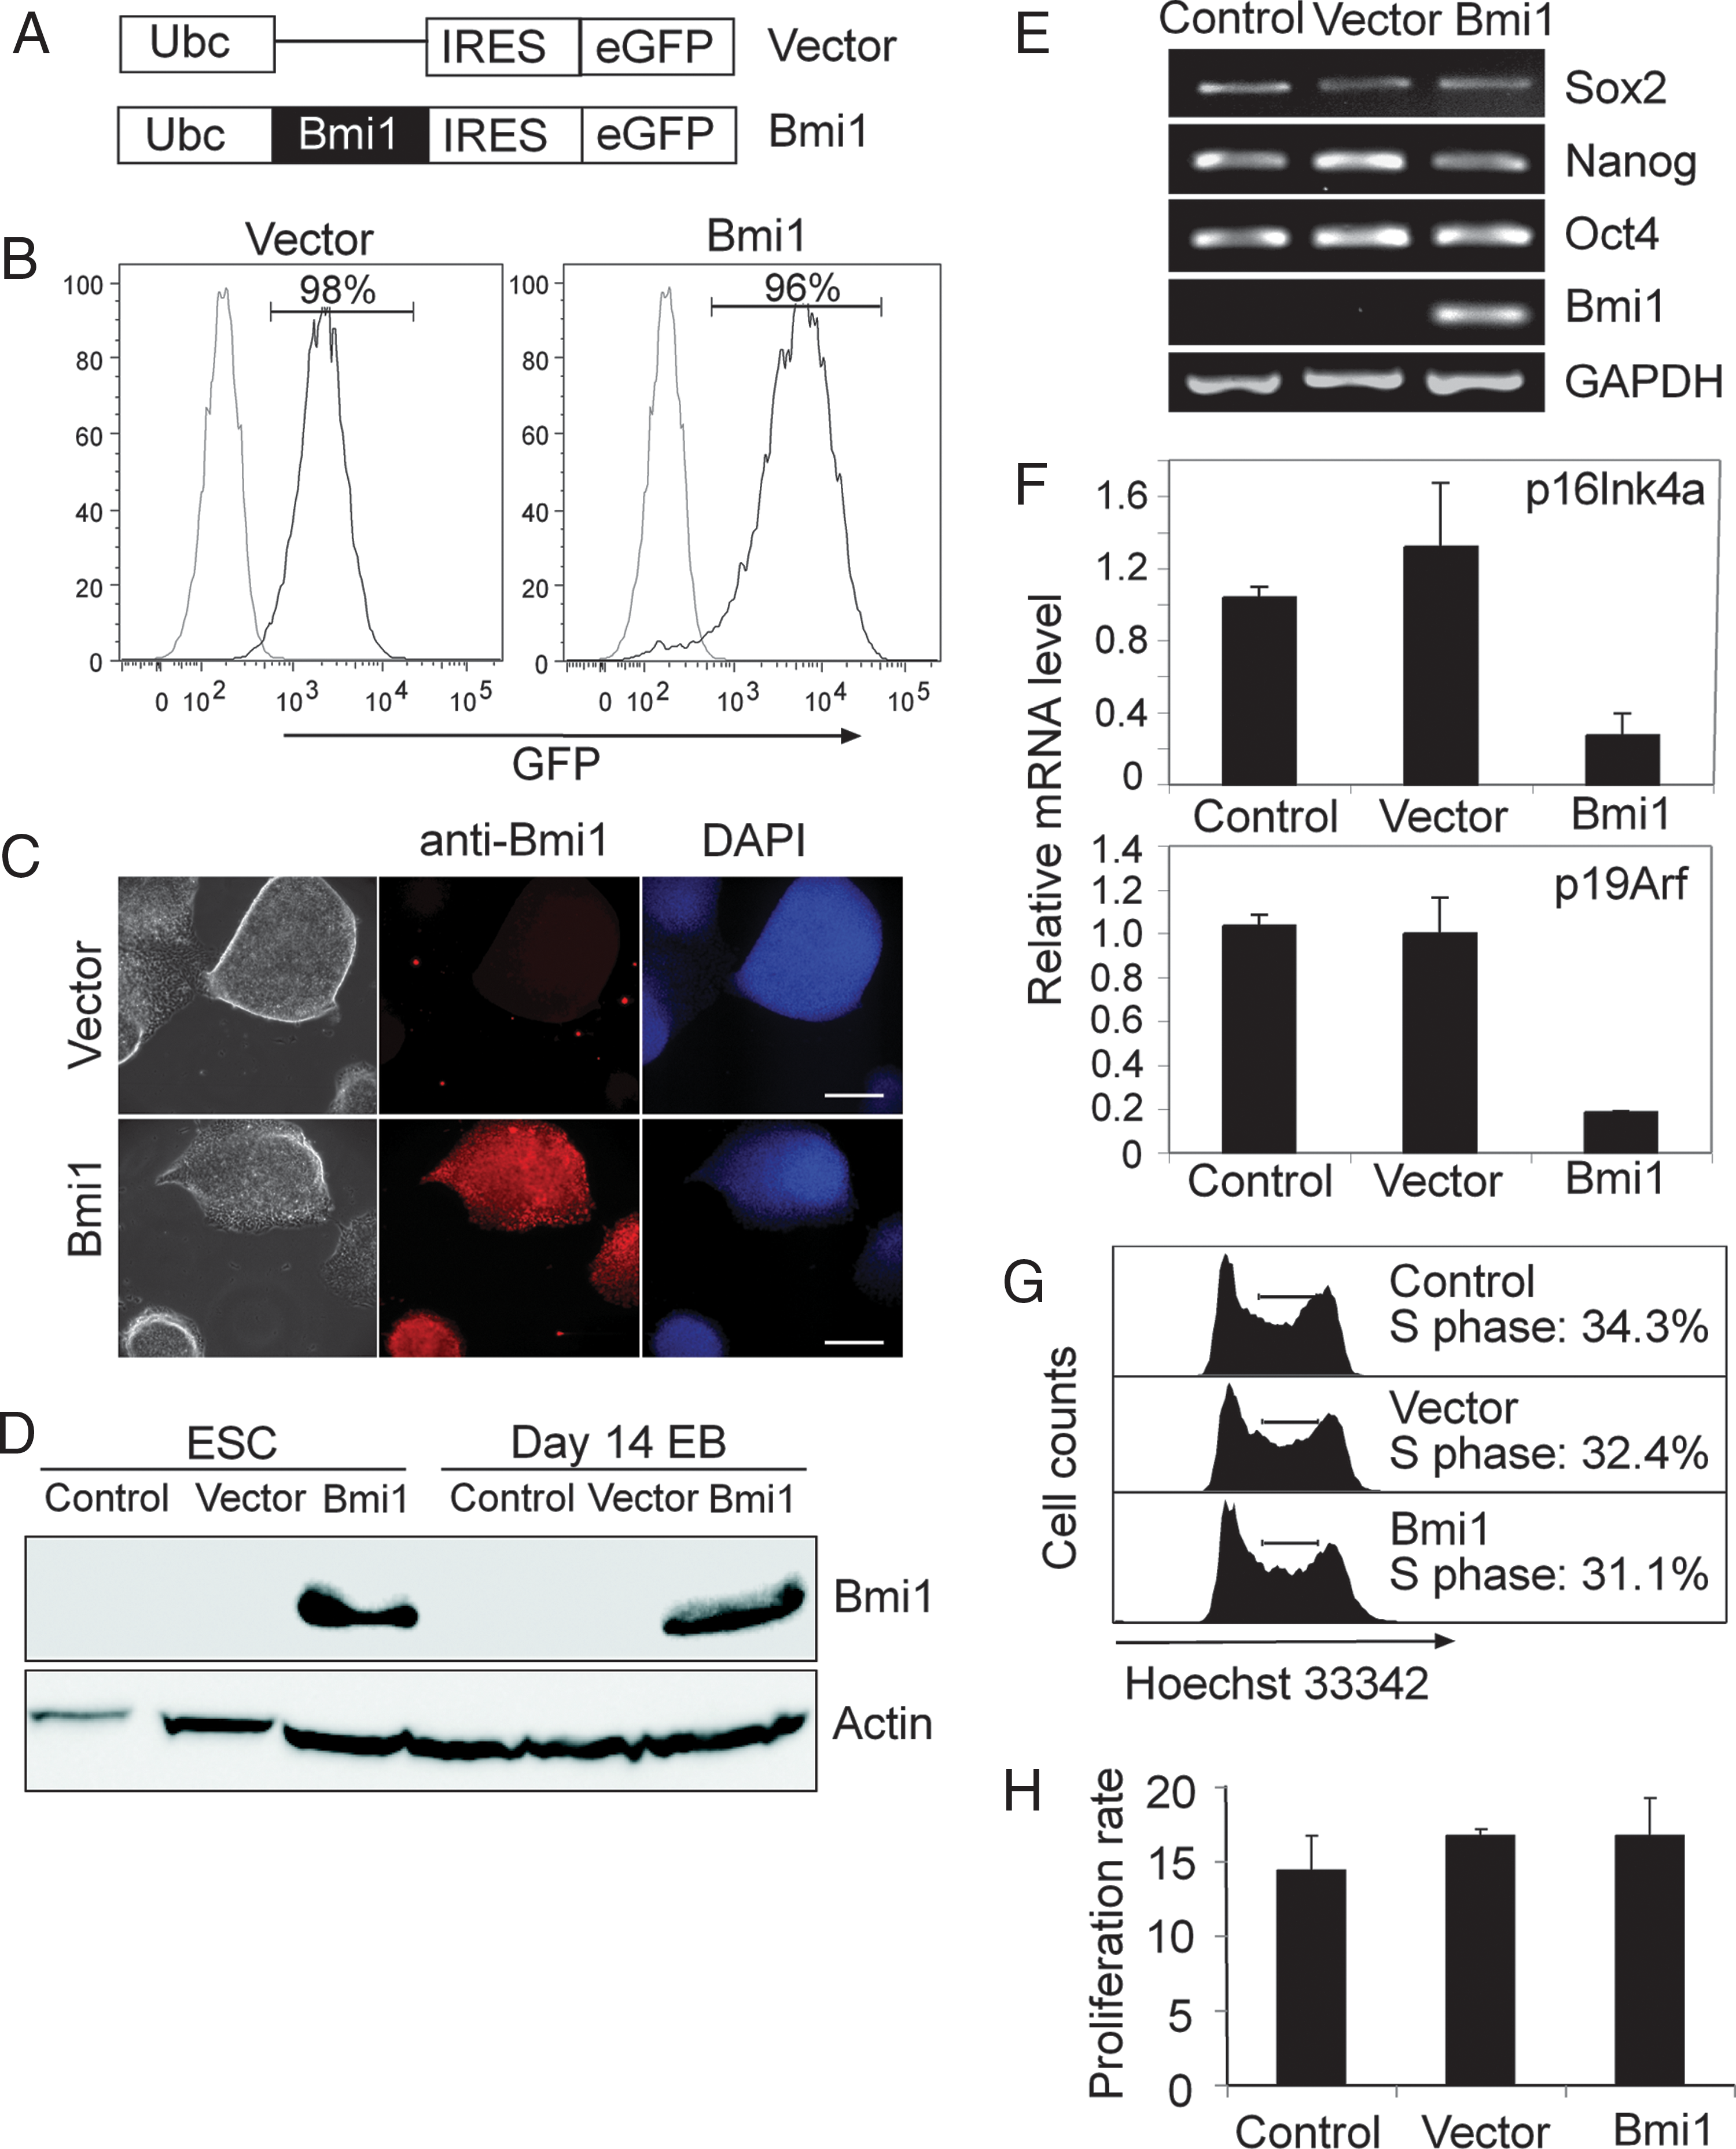
Forced Bmi1 expression in ESC does not affect self-renewal capacity.
Bmi1-ESC had a colony morphology similar to parental ESC and stained positive for alkaline phosphatase (Supplementary Fig. S1A). ESC are characterized by a pluripotent gene expression profile [32,33], and, thus, we subjected Bmi1-ESC to genome-wide gene expression profiling with DNA microarray. Scatter plot analysis and hierarchical clustering show that Bmi1-ESC and parental ESC were very similar and also clustered with a panel of other ESC lines (Supplementary Fig. S1B and C). Additionally, key genes of pluripotency-transcriptional circuits, such as Oct4, Nanog, and Sox2, had very similar expression levels in Bmi1-ESC and control cells (Supplementary Fig. S1B). We also examined expression of Oct4, Nanog, and Sox2 by RT-PCR and demonstrate that their expression was the same in Bmi1-ESC, empty vector ESC, and uninfected ESC control (Fig. 2E).
In adult stem cells, Bmi1 represses transcription of the Ink4a/Arf locus, which encodes the CDK inhibitors p16Ink4a and p19Arf [18,23], and thereby promotes cell proliferation. In ESC expression of the Ink4a/Arf locus is repressed by bivalent chromatin, and Ink4a/Arf mRNA levels are very low (Fig. 2F) [34]. Ink4a/Arf expression was further down-regulated in Bmi1-ESC, showing that the repressive activity on this locus is reinforced by exogenous Bmi1.
Repression of Ink4a/Arf by Bmi1 in adult cells directly translates in an altered cell cycle profile [18,23], and we, thus, proceeded to investigate the impact of Bmi1 on ESC proliferation by cell-cycle analysis. Bmi1-ESC have a similar frequency of cells in S phase as controls (Fig. 2G; 31%–34%), which is in line with the same proliferation rate and growth potential of Bmi1-ESC as controls (Fig. 2H). Taken together, these results indicate that exogenous Bmi1 expression leaves ESC self-renewal and pluripotency unaffected.
Gata2 is up-regulated during mesodermal differentiation of Bmi1-ESC
To assess the impact of Bmi1 on differentiation, Bmi1-ESC were subjected to differentiation by EB formation. Bmi1-ESC gave rise to EB with similar morphology, size, and frequency as controls (Fig. 3A and Supplementary Fig. S2A). The frequency of apoptotic cells was the same for Bmi-ESC and controls, as determined by 7-AAD and annexin V staining (Supplementary Fig. S2B).
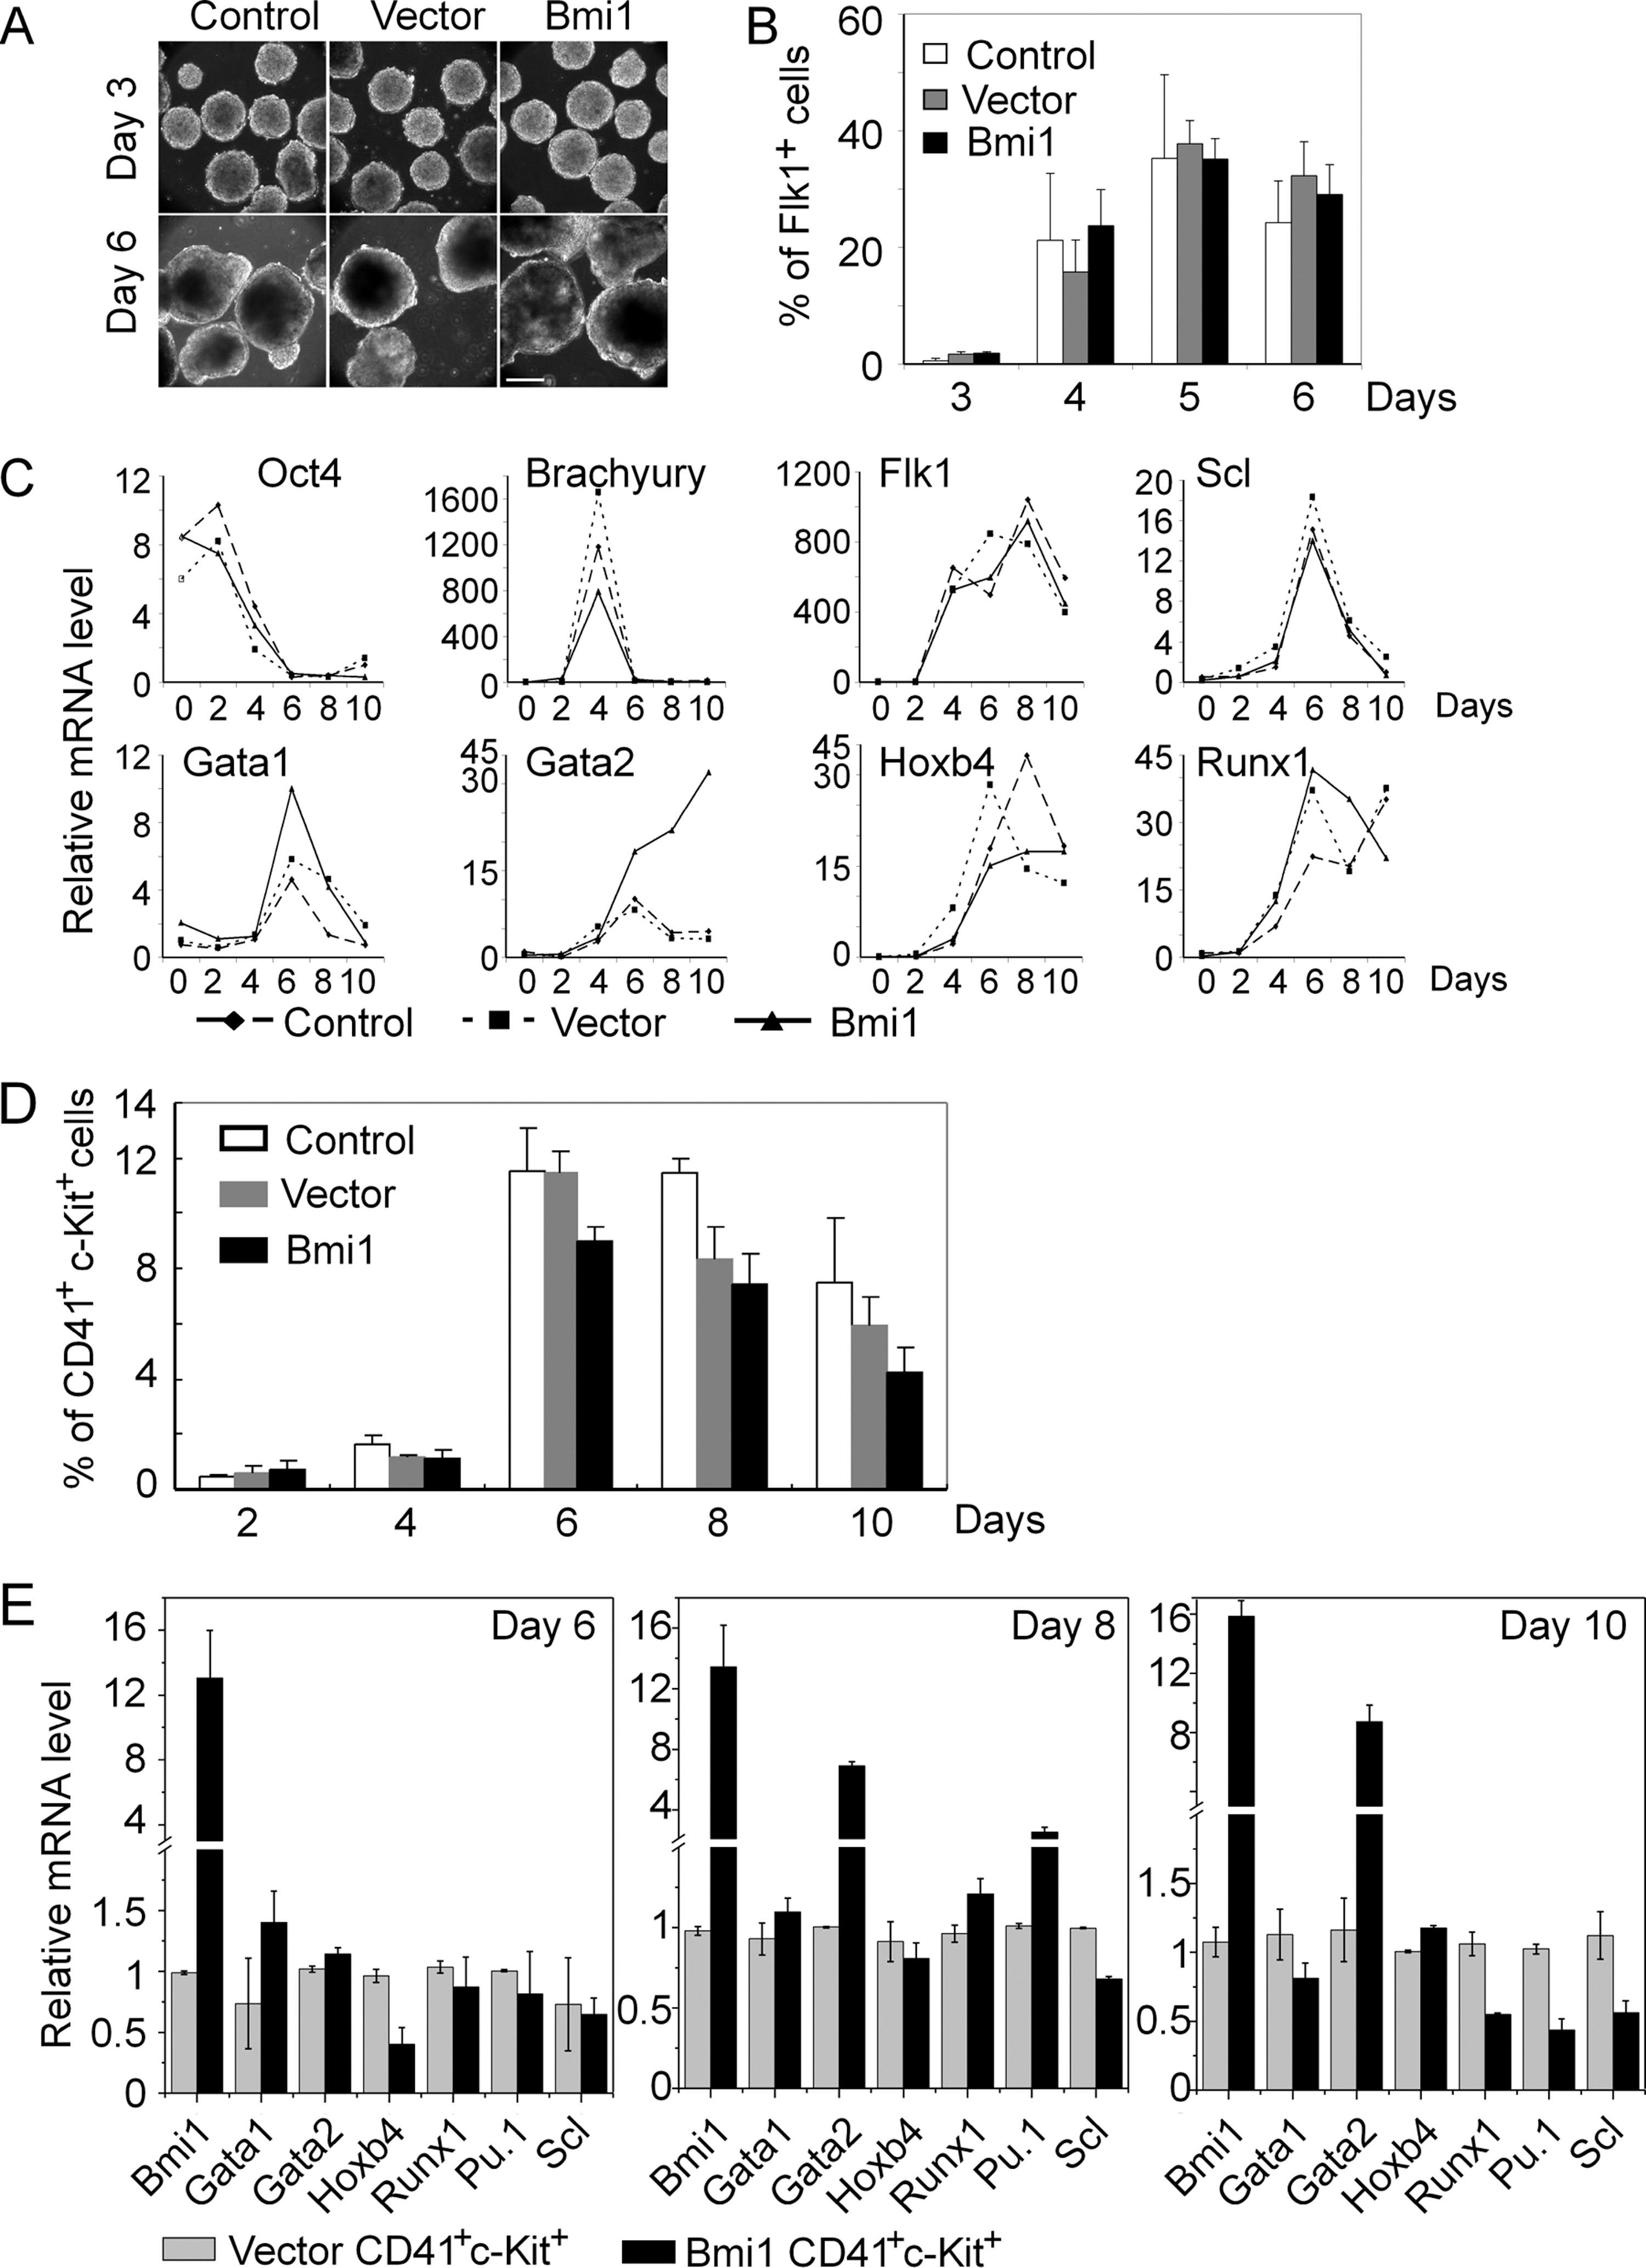
Differentiation of Bmi1-ESC in EB assays.
Lineage tracing and reporter studies demonstrated that during ESC differentiation, the hemangioblast is emerging around day 3 of EB culture and is detected by expression of the receptor kinase Flk1 (VEGF receptor-2) [35]. Hemangioblast development is followed by patterning of specific subsets of mesodermal cells, including hematopoietic, vascular, and cardiac somatic cells [36,37]. To determine the influence of Bmi1 expression on mesoderm formation, Bmi1-ESC were subjected to differentiation in EB assay, and Flk1 expression was examined by flow cytometry. Flk1+ cells first emerged around day 3 of differentiation in both control and the Bmi1-ESC (Fig. 3B). The frequency of Flk1+ cells peaked at day 5 (around 40% of Flk1+ cells) and started to decrease from day 6 onward. Thus, the temporal pattern of Flk1+ cell generation is similar between Bmi1-ESC and ESC controls.
To study the impact of Bmi1 on early stages of development, RNA was extracted at various periods of time of EB culture, and expression of pluripotency genes, mesodermal and hematopoietic markers was measured by q-PCR. Oct4 expression decreased gradually in both Bmi1-ESC and controls. Importantly, we found a prominent up-regulation of Gata2, which persisted over the entire period of analysis (day 10) and was not observed in controls (Fig. 3C and Supplementary Fig. S3). Gata2, a zinc finger transcription factor, is essential for primitive hematopoietic cell generation from mesoderm [38,39]. Gata1, another member of the same family, was also up-regulated. However, this up-regulation was transient and the same for Bmi1-ESC and controls (Fig. 3C and Supplementary Fig. S3).
The activation of Brachyury (T), an early mesoderm marker, showed a similar profile in Bmi1-ESC as controls (Fig. 3C). Scl, a member of the basic helix-loop-helix transcriptional factor family, is involved in mesoderm patterning and primitive hematopoietic cell generation. Scl and Flk1 are involved in a combinatorial manner in regulating hemangioblasts fate [37]. These 2 genes were activated sequentially in both Bmi1-ESC and controls (Fig. 3C and Supplementary Fig. S3). Runx1 is expressed in yolk sac mesodermal cells before the establishment of the blood islands and also in the corresponding EB-derived hemangioblasts [40]. The homeobox gene Hoxb4 is implicated in growth of both embryonic and adult HSC and is important for engraftment potential of ESC-derived hematopoietic cells [41]. Runx1 and Hoxb4 displayed a similar pattern of expression for Bmi1-ESC and control ESC (Fig. 3C).
CD41 represents one of the early markers during hematopoiesis in EB assays and in the mouse embryo [42]. Therefore, to determine frequencies and kinetics of CD41+ c-Kit+ hematopoietic precursor cells in differentiating Bmi1-ESC, EB from day 2 to 10 were dissociated and analyzed by flow cytometry. There was a prominent increase in CD41+ c-Kit+ cells between day 4 and 6 (Fig. 3D). CD41+ c-Kit+ cells were then obtained by cell sorting and analyzed for expression of hematopoietic genes. We observed strong up-regulation of Gata2 in CD41+ c-Kit+ cells at day 8 and 10 (Fig. 3E).
Taken together, our results demonstrate that forced expression of Bmi1 allows ordered mesoderm and hemangioblast development of ESC. Remarkably, Gata2, a gene expressed in primitive hematopoietic cells, was efficiently increased by Bmi1.
Transcriptional regulation by Bmi1 in differentiating ESC
To obtain further insights into gene regulation by Bmi1 during differentiation in EB assays, we performed genome-wide gene expression studies with DNA microarray. RNA from Bmi1-ESC at day 10 of differentiation was extracted and subjected to Affymetrix GeneChip arrays, and data were analyzed by hierarchical clustering. Empty vector-transduced ESC were used as control. We identified 304 genes that were differentially expressed between both groups: 221 genes were found to be up-regulated, and 83 genes were down-regulated by Bmi1 (Supplementary Table 1). Many differentially regulated genes were found to be involved in specific biological functions, and Supplementary Fig. S4A shows a panel of transcription factors and development-associated genes.
Several members of Hox gene family of transcription factors, which play a critical role in development, are known to be dynamically regulated by Bmi1 or other PcG proteins [43,44]. We find 4 Hox genes, Hoxa3, Hoxa9, Hoxd10, and Hoxa11, being repressed by Bmi1 (Supplementary Fig. S4A). The zinc-finger domain transcription factor Zic1, which is required for neuronal differentiation, was also repressed by Bmi1. This is consistent with the observation that Zic1 represents a known target of PcG proteins [8]. Several members of hemoglobin genes (Hbb-y, Hba-a1, and Hbax), markers for erythroid cell differentiation, were also down-regulated in differentiating Bmi1-ESC. However, repression of the Ink4a/Arf locus, which is a direct target of Bmi1 in adult stem/somatic cells, could not be detected by microarrays, probably due to very low expression levels (see also below Fig. 5E). Several genes were up-regulated in Bmi1-ESC during differentiation (Supplementary Fig. S4A), including transcription factors, cell structure proteins, membrane receptors, and extracellular matrix proteins (Supplementary Fig. S4; Supplementary Table 1). As expected, Gata2 was also found to be up-regulated in Bmi-ESC, which is in line with the PCR data just described (Fig. 3C, E and Supplementary Fig. S3). Elevated expression of these up-regulated genes is most likely due to secondary and indirect effects of the repressive Bmi1 activity.
PCR analysis of the Hox genes Hoxa3, Hoxa9, Hoxd10, and Hoxa11 and of the Zic1 and Gata2 transcription factors confirmed the DNA microarray data (Supplementary Fig. S4B). The myosin genes Myh6 and Myl2 showed elevated expression in Bmi1-ESC, which is also consistent with microarray data (Supplementary Fig. S4A and B). The hematopoietic genes c-Kit, Hoxb4, and Gata1 and the endothelial cell markers CD31 and CD144 (VE-Cadherin) remained unaffected by Bmi1, by both microarray analysis and q-PCR. Thus, forced Bmi1 expression during EB differentiation entails repression of known Bmi1/PcG protein target genes but also causes elevated expression of yet another group of genes, most probably through indirect mechanisms.
Bmi1 promotes primitive hematopoiesis
Given the prominent up-regulation of Gata2 in Bmi1-ESC, we chose to study the impact of Bmi1 on the generation hematopoietic cells from ESC. Primitive hematopoietic CFU, particularly erythroid and erythroid-myeloid CFU cells, are first detectable in differentiating ESC at day 5 to 6. Therefore, single-cell suspensions of day 6 EB were plated in semi-solid methylcellulose cultures supplemented with hematopoietic cytokines, and the number and morphology of colonies was evaluated, including CFU-E (erythroid CFU), CFU-GM (granulocyte and macrophage CFU), and CFU-GEM (erythrocyte, granulocyte, and macrophage CFU). Strikingly, Bmi1 enhanced the number of hematopoietic CFUs up to 3-fold over controls (Fig. 4A). Frequencies of CFU-GM and CFU-GEM for Bmi1-ESC were also increased, whereas the morphology of Bmi1-ESC and controls were quite similar (Fig. 4A and B). Therefore, Bmi1 promoted development of hematopoietic cells from ESC, but there appears to be no prominent impact of Bmi1 on the development of specific hematopoietic lineages.
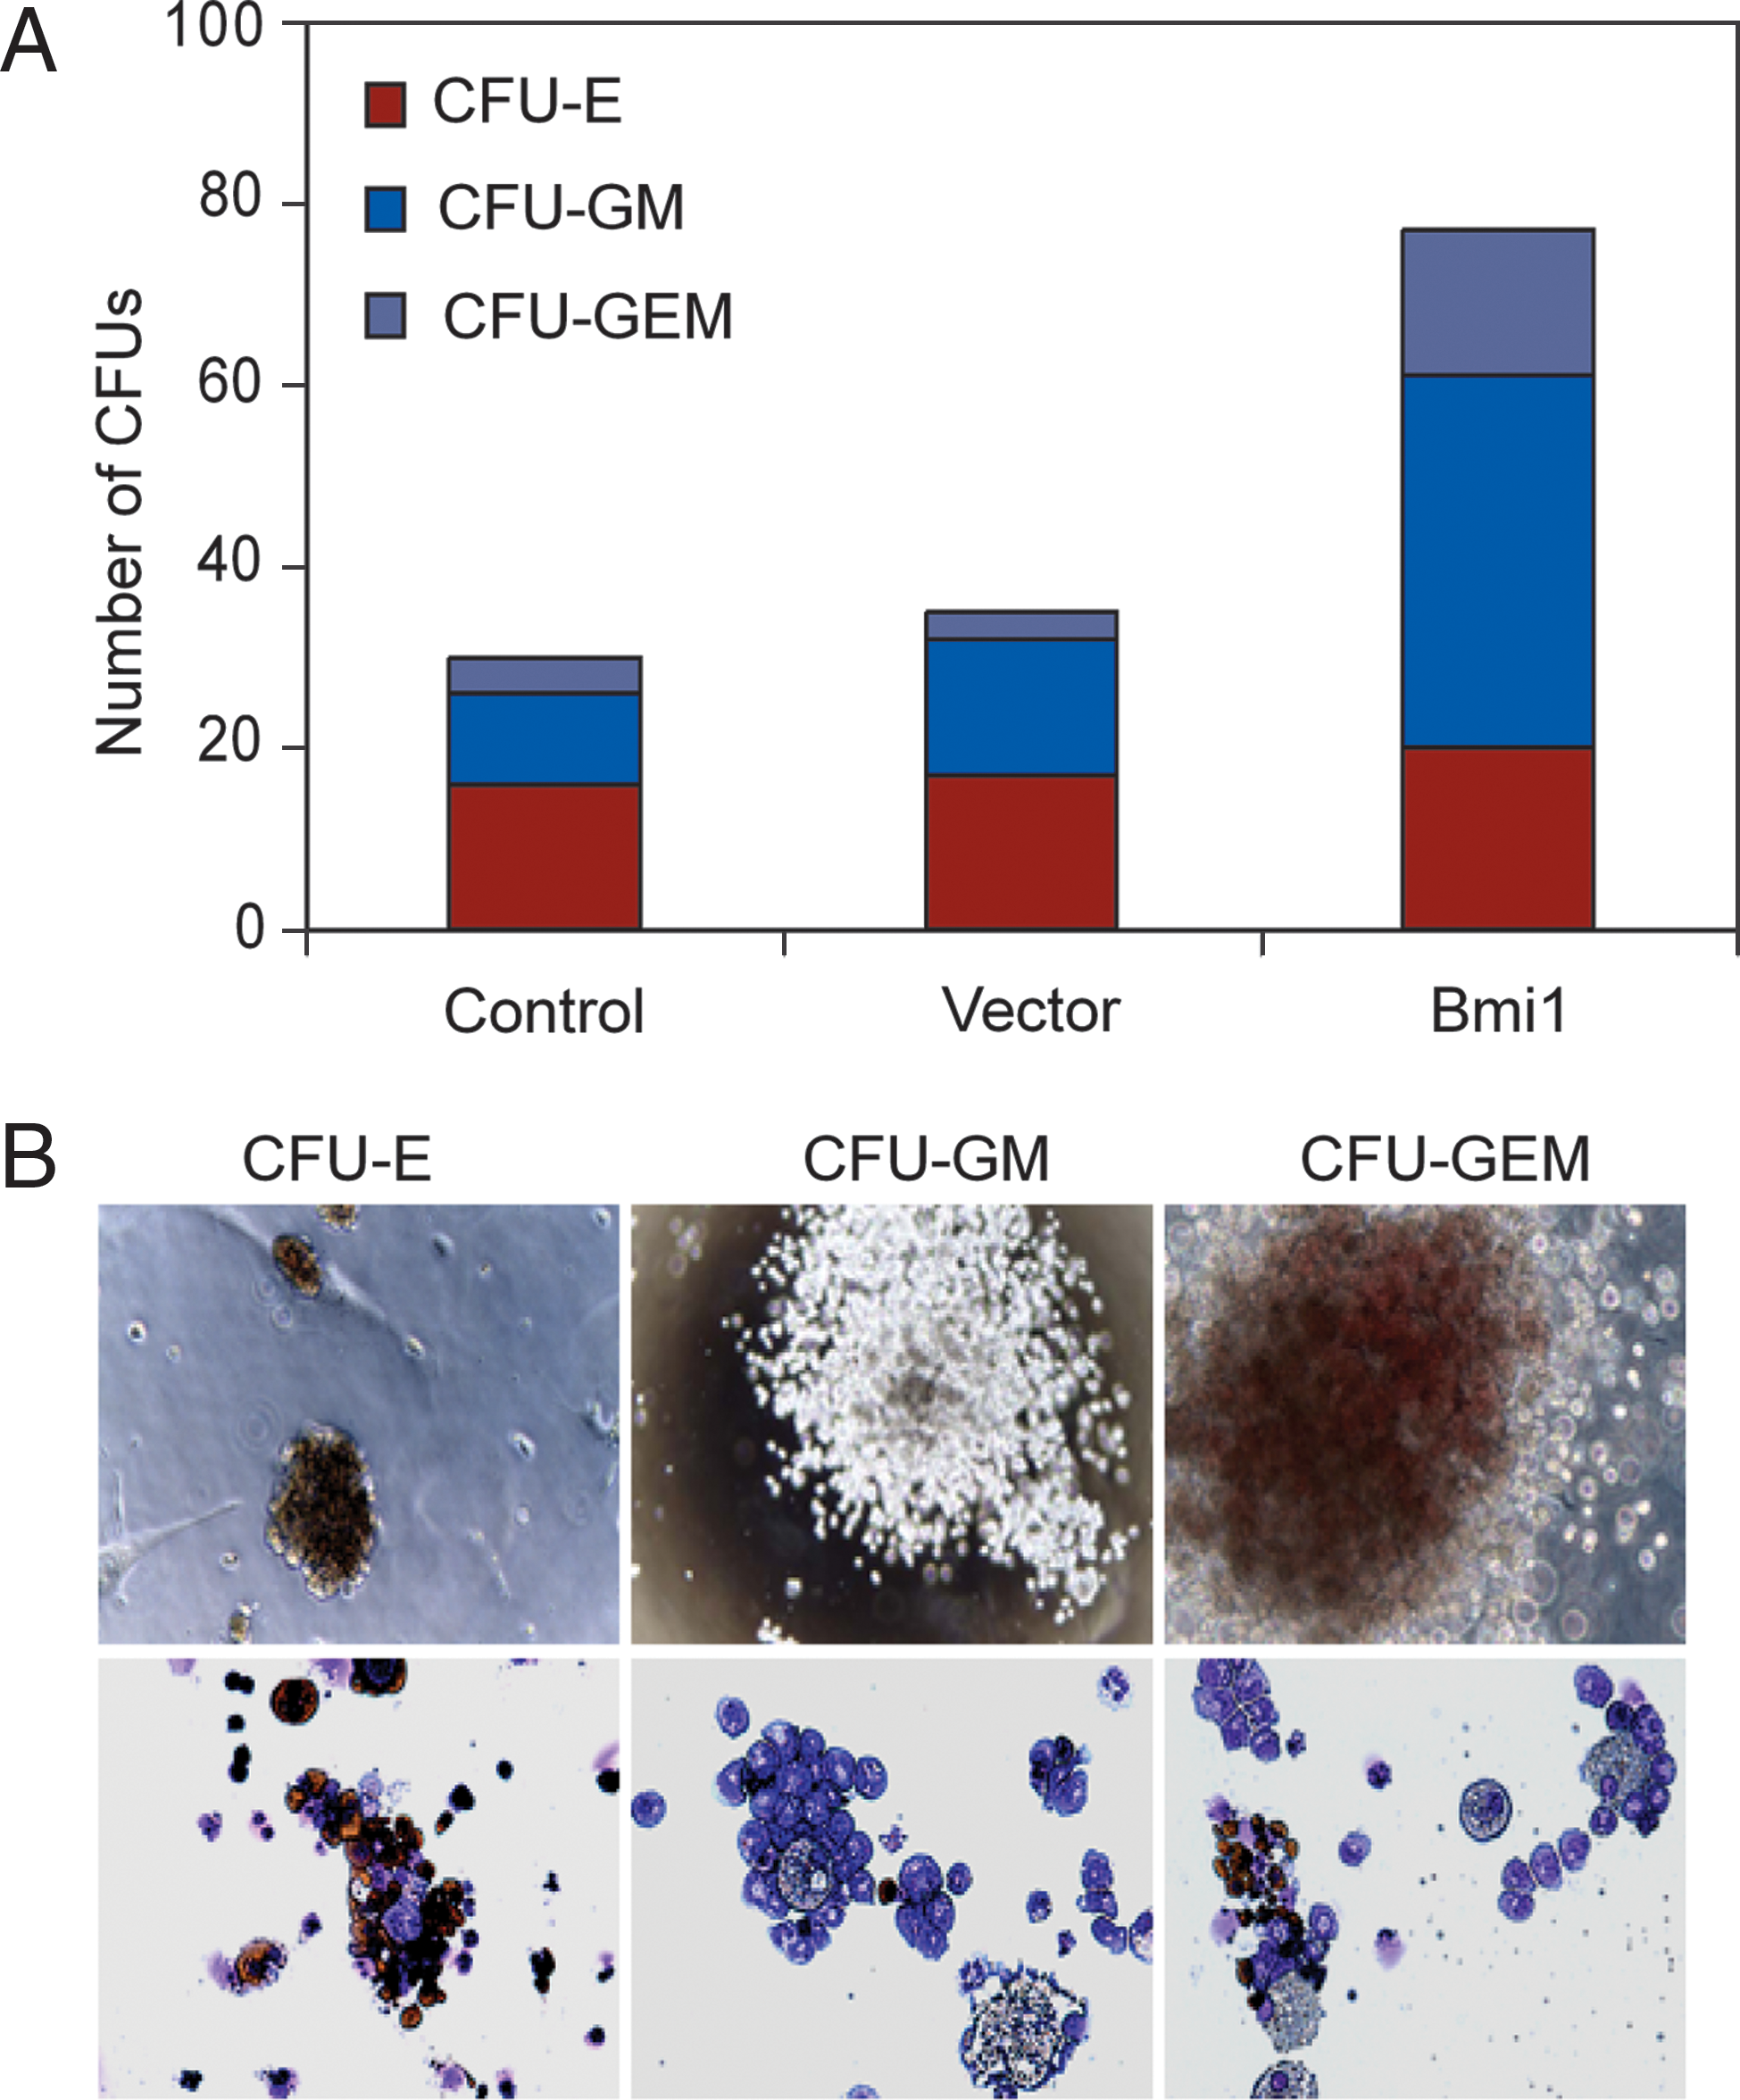
CFU assay of EB-derived cells.
Bmi1 leads to robust proliferation of ESC-derived hematopoietic progenitor cells
To further assess the impact of Bmi1 on hematopoietic cell development from ESC, we studied hematopoietic progenitor cells (HPC) obtained from EB (Fig. 5A). Bmi1-ESC and control ESC were subjected to differentiation in EB assays. At day 6, single-cell suspensions were prepared and seeded in serum-free medium with SCF, Flt3L, hyper-IL-6, IGF-1, and IL-3. Cumulative cell numbers were calculated to assess the proliferation potential of cultures. Strikingly, Bmi1 markedly enhanced the proliferation capacity, and Bmi1-ESC-derived HPC (Bmi1-HPC) were expanded up to nearly 100-fold within 3 weeks of culture (Fig. 5B). Bmi1-HPC were maintained in culture for almost 2 months without loss of proliferation potential and generated a vast number of cells. In contrast, control ESC-HPC failed to expand and deteriorated after a few days of culture (Fig. 5B). The low expansion rates of control ESC-HPC made it difficult to obtain enough cells for analysis. Bmi1-HPC had a primitive blast-like morphology, as revealed by histological staining of cytospins (Fig. 5C), whereas cultures of control ESC-HPC showed dead cells and cell debris (data not shown).
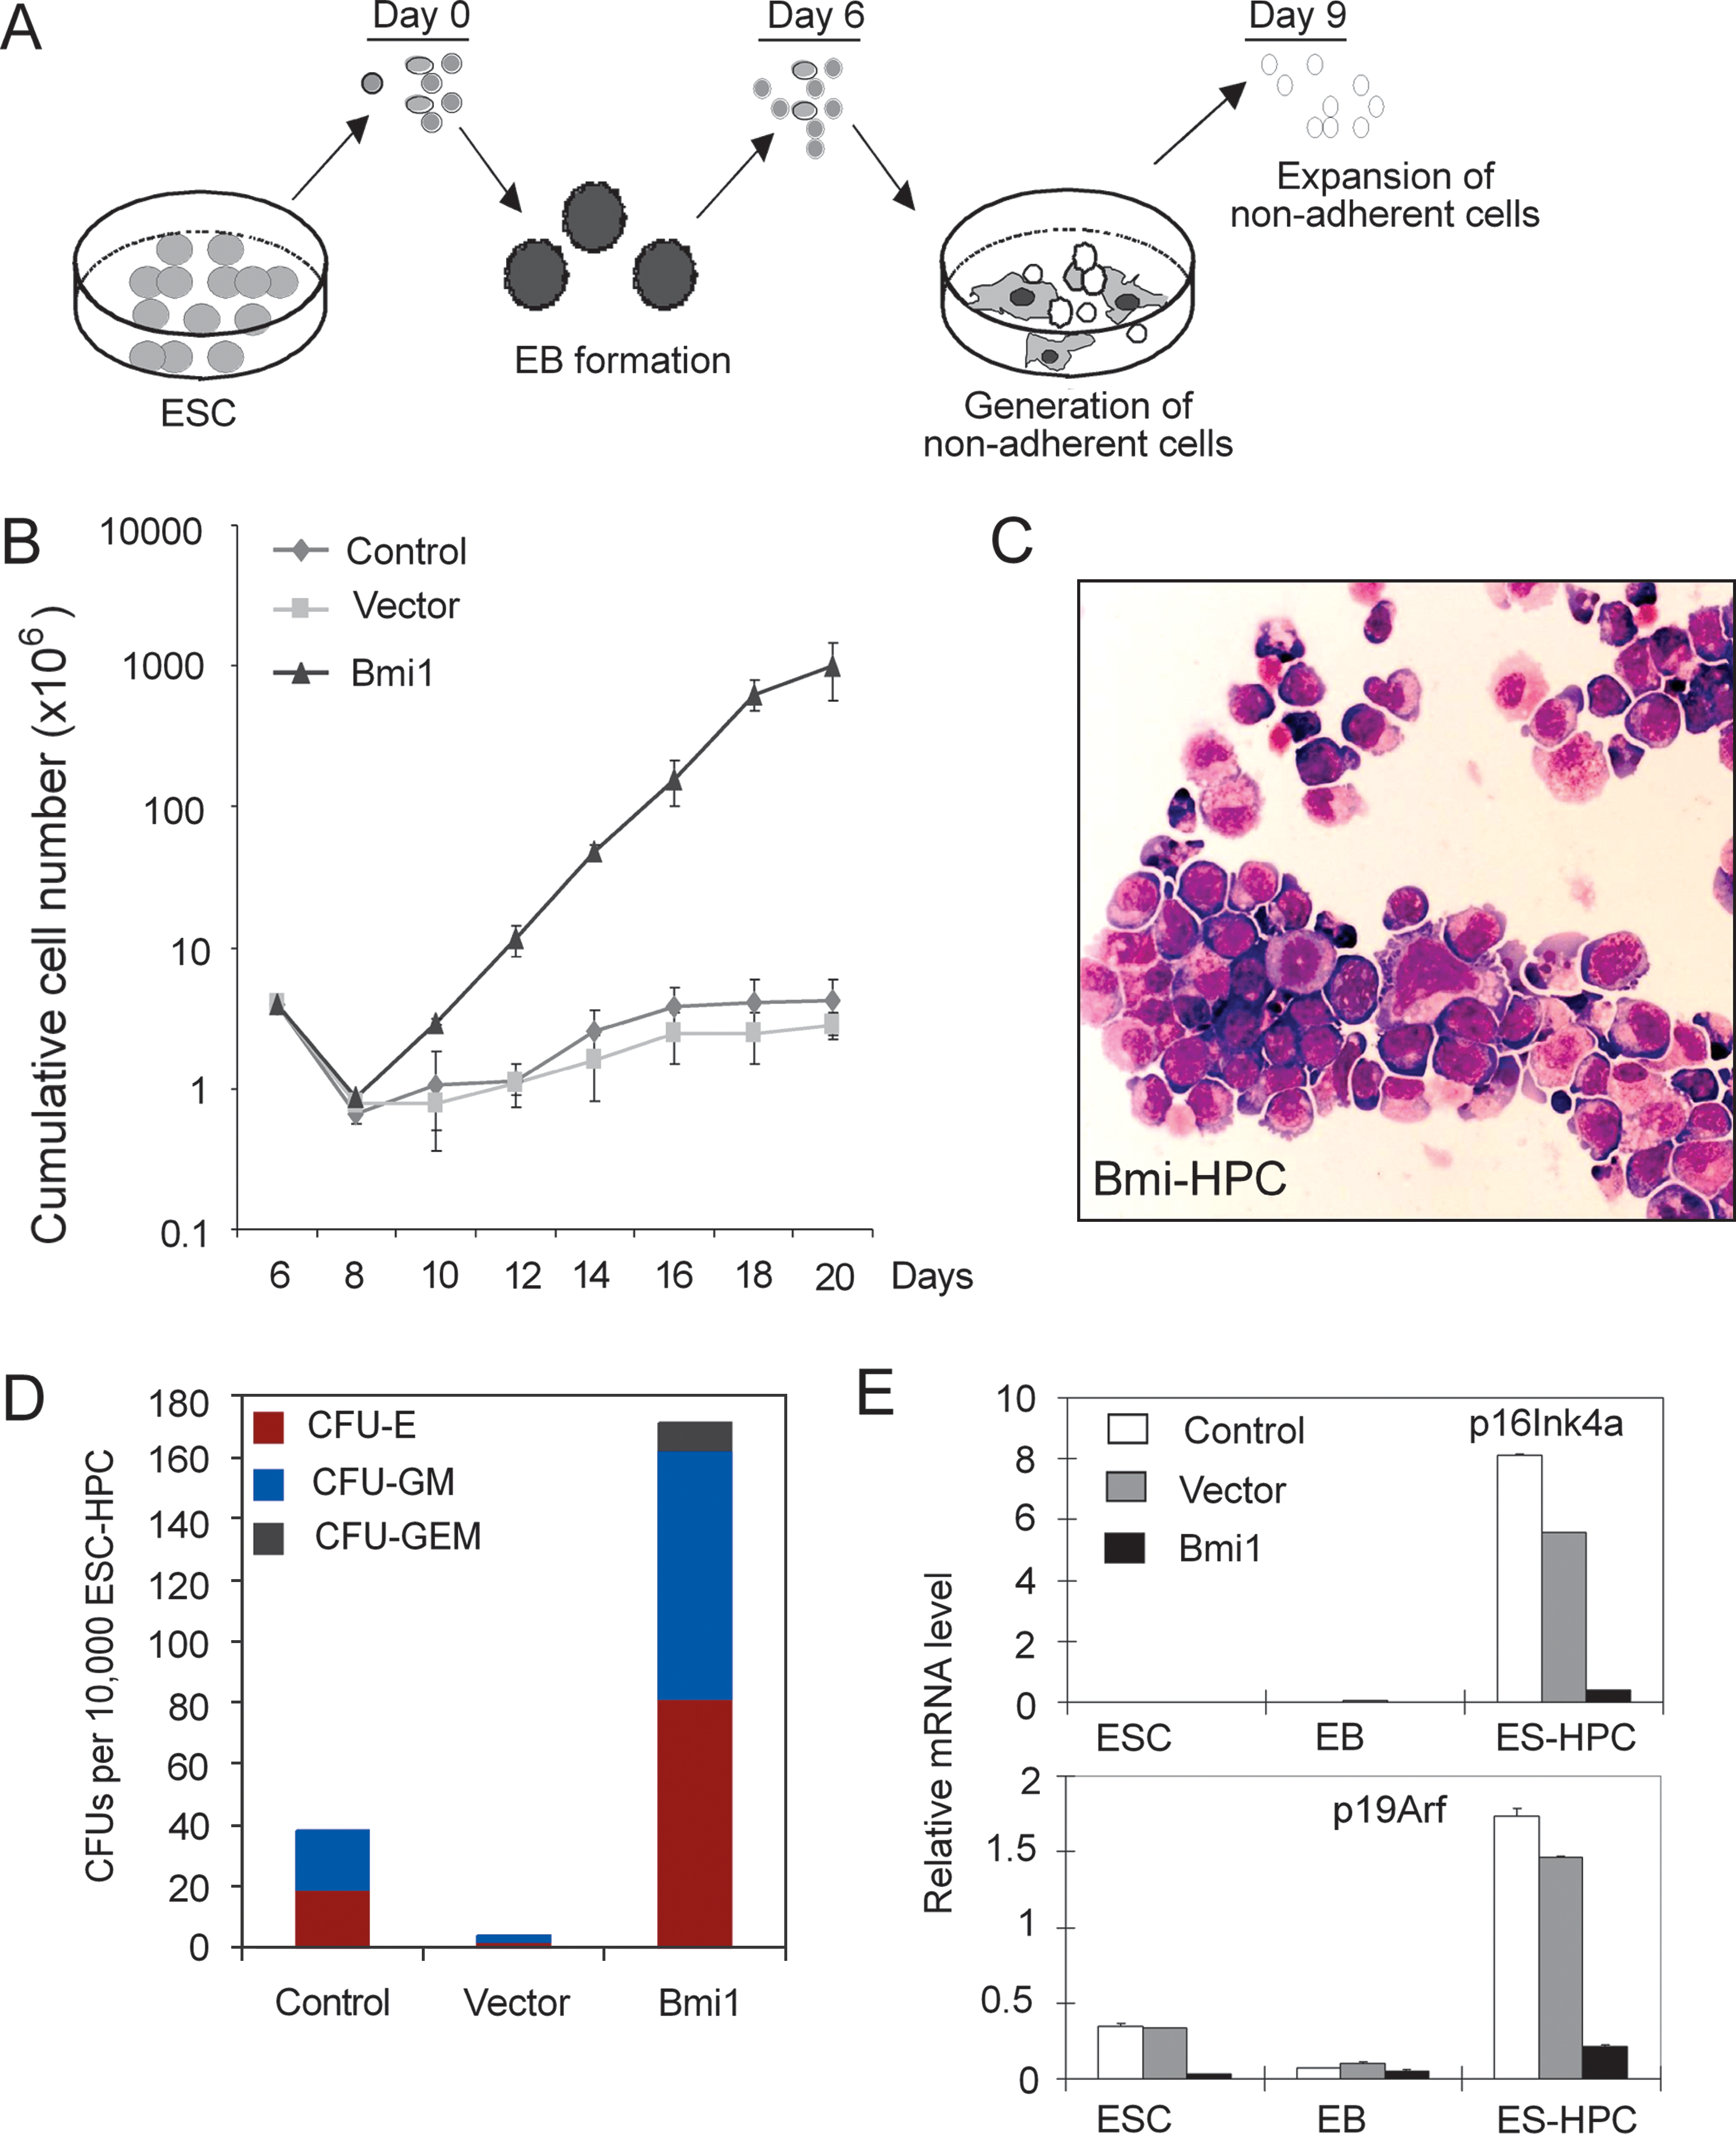
Bmi1 promotes hematopoietic cell differentiation from ESC.
To extend these studies, we performed colony-forming assays of cells at day 12 of suspension culture. Bmi1-HPC showed up to 10-fold increase in CFUs, including CFU-E, CFU-GM, and CFU-GEM (Fig. 5D). Bmi1 promotes self-renewal of adult HSC mainly though repressing the expression of p16Ink4a and p19Arf. Therefore, we determined expression of Ink4a/Arf in ESC, day 6 EB, and day 12 ESC-HPC by q-PCR (Fig. 5E). We found that Bmi1 efficiently repressed expression of p16Ink4a and p19Arf in Bmi1-HPC. Thus, similar to the activity of Bmi1 on adult stem cells, Bmi1 might confer its growth promoting activity at least partially through repressing the Ink4a/Arf locus.
The self-renewal of HSC is closely related to their adhesion properties [45], and thus, we investigated the interaction of Bmi1-HPC with stroma cells. HPC in suspension culture were plated on OP9 stroma cells and cultured with growth factor as just described. Bmi1-HPC formed typical cobblestone areas beneath the stroma cell layer (Supplementary Fig. S5), whereas control HPC died during culture. Taken together, these data demonstrated that enforced Bmi1 expression enhanced hematopoietic cell differentiation, survival, and caused continuous and extensive proliferation of ESC-derived HPC in vitro.
The Bmi1-HPC are heterogeneous in phenotype and dependent on hematopoietic cytokines
To characterize the phenotype of Bmi1-HPC, cells were stained for a panel of hematopoietic cell surface antigens and analyzed by flow cytometry (Fig. 6A and Supplementary Fig. S6). More than 90% of the cells expressed c-Kit, probably because cells were always cultured in the presence of c-Kit ligand SCF. There was also expression of other stem cell markers, such as Sca1, CD34, and CD133; however, these cells represented only 10%–30% of the cell population. A rather high fraction of cells expressed myeloid lineage markers, including CD11b, CD14, and Gr1 (30%–45%) and the erythroid lineage marker Ter119 (60%). We also examined the surface phenotype of cells at days 15, 30, and 40 of culture, and there were no obvious changes over extended culture periods (data not shown). Thus, Bmi1-HPC are heterogeneous in phenotype, which is similar to Hoxb4 ESC-HPC [46].
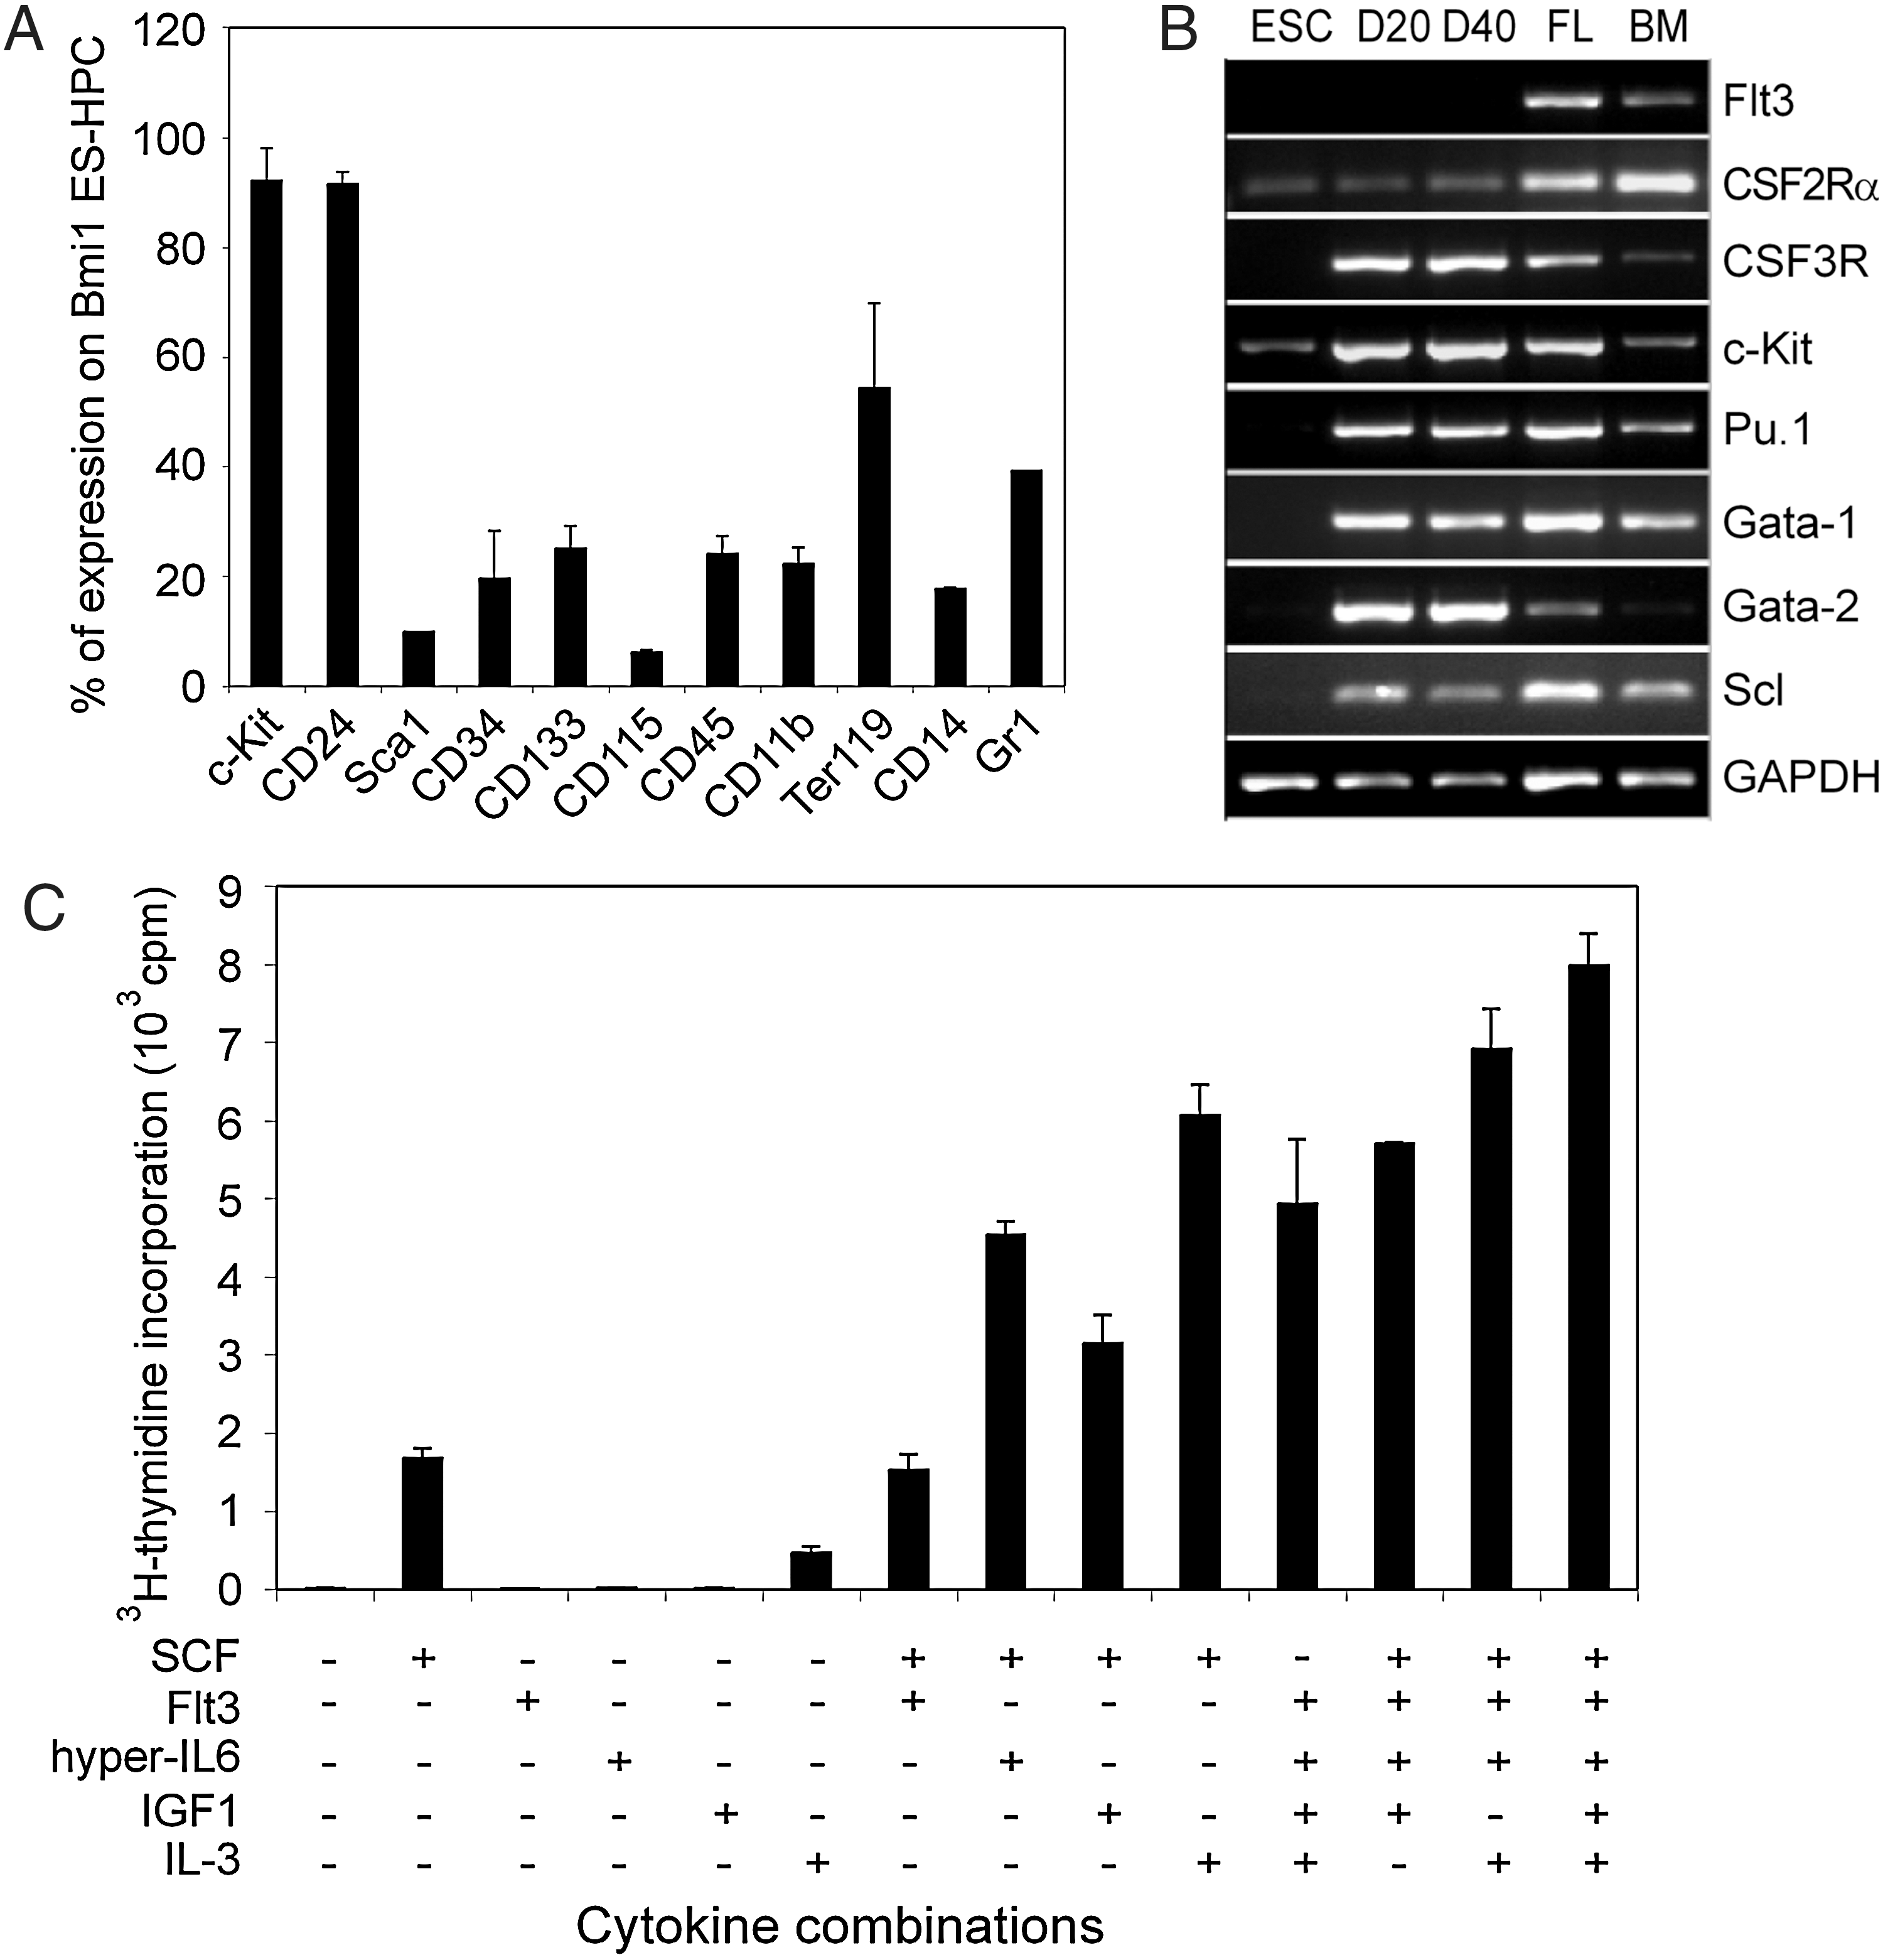
Characterization of Bmi1-HPC.
To further characterize Bmi1-HPC, we compared the hematopoietic gene expression profile of Bmi1-HPC with fetal liver cells and adult BM cells by RT-PCR (Fig. 6B). Bmi1-HPC showed high expression of the hematopoietic transcription factors Gata1, Gata2, and PU.1 and abundantly expressed the cytokine receptors c-Kit and G-CSF receptor, but not Flt3.
Deregulation of Bmi1 is a common feature in several types of leukemias, and high Bmi1 expression is frequently found in primary leukemia cells [19]. This raises the question whether enforced Bmi1 expression is sufficient to promote Bmi1-HPC self-renewal or to transform the cells. Therefore, we tested the cytokine and growth factor response of Bmi1-HPC in 3H-thymidine incorporation assays (Fig. 6C). We found that Bmi1-HPC were critically dependent on growth factors for survival and proliferation. SCF and IL-3 conferred some proliferative potential, yet multiple factor combinations were required for maximal proliferation rates (Fig. 6C). Since survival of the majority of leukemia cells is aberrantly independent on cytokines signals [47], this finding suggests that forced Bmi1 expression causes more potent proliferation rates but is not sufficient to transform cells.
Discussion
Bmi1 is crucial for maintaining the pool of adult stem cells, and several types of malignancies are characterized by deregulated Bmi1 expression [18 –21]. Here, we found that Bmi1 is not expressed in ESC and that forced Bmi1 expression caused Gata2 up-regulation and enhanced frequencies of hematopoietic cells derived from ESC. Such hematopoietic cell derivatives expressing Bmi1 displayed robust proliferation capacity in vitro. Our results uncover a so-far-not-recognized activity of Bmi1 in ESC commitment and differentiation, and, thus, Bmi1 might be a candidate factor to improve hematopoietic stem/progenitor cell derivation from pluripotent cells.
The epigenetic modifier PcG proteins are important in maintaining self-renewal in ESC and adult stem cells, including HSC, NSC, and endothelial precursor cells. For example, Ezh2 and Suz12 are required for both adult stem cells and pluripotent cells [9,12,13,16,17]. RingA/B is directly involved in the transcriptional network of ESC [14]. Eed and Bmi1 have antagonistic functions in HSC [48]. Bmi1 is critical for maintenance of adult stem cells, but as shown here, it is not expressed or expressed at very low levels in ESC. Further, we also show that forced Bmi1 expression leaves ESC self-renewal unaffected. Thus, stem cell self-renewal appears to require specialized PcG proteins. Understanding the requirements and roles of PcG proteins for different stem cell types is expected to help in elucidating the genetic programs that drive stem cell self-renewal and cell fate decisions upon differentiation. Thus, we set out to analyze the influence of Bmi1 on differentiation and show that forced Bmi1 expression enhances hematopoietic cell development from ESC.
The activity of Bmi1 on promoting adult stem cell self-renewal is, in part, through repressing p16Ink4a and p19Arf, encoded by the Ink4a/Arf locus [18]. In ESC, the promoter region of Ink4a/Arf gene contains bivalent chromatin histone H3 methylation marks, and Ink4a/Arf expression is repressed [34]. We show here that Bmi1 is not expressed in ESC; therefore, repression of the Ink4a/Arf locus through H3K27me3 might be performed by alternative PcG proteins. We also found that exogenous Bmi1 expression in ESC reinforced the repressive activity on this locus. However, cell-cycle analysis revealed that a further decrease in Ink4a/Arf expression did not affect ESC proliferation.
Expression of the Ink4a/Arf locus remained low during early stages of ESC differentiation in EB formation assays. At later stages, Ink4a/Arf expression increased; however, it remained effectively repressed in Bmi1-ESC-derived HPC. The low expression of Ink4a/Arf gene in ESC and EB might explain that ecotopic Bmi1 expression did not affect ESC self-renewal and the early stages of ESC differentiation. Bmi-1-/- mice displayed normal embryogenesis, as well as normal numbers of fetal liver HSC [20]. Ink4a/Arf expression was not detected in fetal or young adult stem cells but increases in aged stem cells, which are impaired in self-renewal [49,50]. Thus, the repressive activity of Bmi1 on Ink4a/Arf locus seems to be confined to adult stem cells, whereas in ESC and during embryo development, repression appears to be due to other PcG proteins. How PcG dynamics change during development is an interesting question. A large number of genes, which are known to be regulated by PcG proteins, are altered in expression during ESC differentiation, and this coincides with dynamic changes of PcG protein regulatory function [9,12,51]. ESC differentiation recapitulates aspects of early stages of embryonic development, and, thus, studying PcG dynamics in differentiating ESC will provide valuable information on PcG activities during development.
Bmi1 acts as transcriptional repressor [6], and, thus, its activity directly translates into changes in gene expression. Gene expression profiling by microarray represents a powerful tool to survey transcriptional pattern on a genome-wide scale, and, thus, Bmi1 expressing cells were subjected to microarray analysis. We identified a large number of genes that had been repressed by Bmi1, which was expected. For instance, several Hox genes were down-regulated, but Gata2 was up-regulated. This finding is interesting, as others and we have shown earlier that Gata2 plays a key role in hematopoietic cell proliferation and in maintaining the pool of adult HSC [31,39,52]. Additionally, doxycycline-induced Gata2 expression in differentiating EB promoted hematopoietic mesoderm formation and suppressed endoderm and ectodermal lineages [53].
Up-regulated Gata2 expression in Bmi1 ESC-derived EB is unlikely to be due to an increased frequency of hematopoietic cells, as other hematopoietic genes, such as Scl, c-Kit, Runx1, and Hoxb4, showed no large difference in expression compared with controls. Additionally, Bmi1 over-expression in adult BM Flt3+ HSC [54] also caused up-regulation of Gata2 (data not shown). Moreover, frequencies of CD41+ c-kit+ early hematopoietic precursor were unaffected by Bmi1 expression and forced Bmi1 expression up-regulated Gata2 in CD41+ c-kit+ precursor cells. Thus, elevated Gata2 expression in CD41+ c-kit+ precursor cells might account for the enhanced commitment and/or growth of hematopoietic cell derivatives.
Both Gata2 and Bmi1 are essential for adult HSC, and, thus, it is tempting to speculate that both are important components of a circuitry that is important for maintaining the HSC pool and/or keeping progenitors immature. In addition, HPC generated from Bmi1-ESC, despite showing an enhanced proliferation capacity, were fully responsive and dependent on cytokines for survival in culture. This suggests that the extended lifespan observed for Bmi1-HPC is not related to malignant transformation. In initial transplantation experiments using standard protocols [54], we did find neither short-term or long-term engraftment of Bmi1-HPC nor tumor formation (data not shown).
The derivation of tissue-specific stem/progenitor cells and terminally differentiated cells from ESC for stem cell-based replacement therapies represents a major challenge in regenerative medicine. In vitro generation of hematopoietic cells from ESC has been demonstrated by several studies but remained rather inefficient compared with other cell lineages [55]. Additionally, several previous studies demonstrated that intrinsic regulators for adult HSC, such as Hoxb4, Stat5, and Runx1, can promote hematopoietic cell development from ESC [41,56 –58]. In particular, Hoxb4 supports the generation of long-term repopulating HSC from mouse ESC [41,56]. However, data on a similar activity of Hoxb4 on hematopoiesis of human ESC are still inconsistent [59,60]. Thus, the identification of genes that enhance the hematopoietic cell development from ESC, as reported here for Bmi1, represents an important step toward the aim of obtaining high cell numbers for treatment of hematopoietic diseases.
Footnotes
Acknowledgments
We would like to thank F. Farnebo (Karolinska Institute, Stockholm, Sweden) for providing FUGIE vector, H. Klump (University Hospital Essen, Essen, Germany) for the CCE ES cell line, U. Just (University of Kiel, Kiel, Germany) for OP9 cells, and Anna M. Wobus (IPK, Gatersleben, Germany) for LIF. We also thank A. M. Müller (University of Würzburg, Würzburg, Germany) for critical reading of the article and all lab members for helpful comments and suggestions on this work, C. Becker and B. Denecke for help with gene array hybridization, I. Ortseifer for cell sorting, and A. Offergeld for expert secretary assistance. Part of this work was supported by funding within the SPP1356 program to M. Z.
Author Disclosure Statement
The authors have no financial conflict of interest.
References
Supplementary Material
Please find the following supplemental material available below.
For Open Access articles published under a Creative Commons License, all supplemental material carries the same license as the article it is associated with.
For non-Open Access articles published, all supplemental material carries a non-exclusive license, and permission requests for re-use of supplemental material or any part of supplemental material shall be sent directly to the copyright owner as specified in the copyright notice associated with the article.