
Abstract
In 2011, an outbreak of Murray Valley encephalitis virus (MVEV) occurred in Australia, and in 2022, the Japanese encephalitis virus (JEV) caused a significant outbreak, both reaching southern regions of the country. The outbreaks were unexpected, and the cause of their presence in temperate regions remains uncertain. Climate conditions are one of the factors that could have influenced the outbreaks; however, a better understanding of the climate suitability for these viruses is needed to help anticipate future outbreak events. This study aimed to help fill this gap by analyzing the climate suitability and risk of MVEV and JEV during outbreak and non-outbreak years in the state of Victoria. By implementing an analytical hierarchy process (AHP) with the participation of an expert panel, areas with suitable climates and high-risk areas of MVEV and JEV were mapped using a geographic information system. Precipitation was highly suitable for the viruses’ transmission in both outbreak years, and the minimum temperature was highly suitable in the 2021–2022 outbreak year. Furthermore, suitable climate and high-risk conditions of MVEV and JEV outbreaks have been present in the state of Victoria every summer since 2016. This suggests that regions of the state were already at a potential risk of MVEV and JEV. In a climate change context, assessing the future risk of flaviviruses of public health concern is essential. The AHP with an expert panel can be a practical tool to identify risk areas and support local and statewide decision-making in public health preparedness.
Introduction
Japanese encephalitis virus (JEV) and Murray Valley encephalitis virus (MVEV) are mosquito-borne flaviviruses (MBF) that circulate in Australia (MacKenzie & Williams, 2009; Russell & Dwyer, 2000). MVEV is endemic in the Northern Territory (NT) and the Kimberly region of Western Australia (Beltz, 2021b), and JEV is endemic to Asia and the Western Pacific (Misra & Kalita, 2010). Even though these viruses are endemic to tropical and subtropical climates, they have caused severe outbreaks in southern regions of Australia. For instance, in 2011, there was a major outbreak of MVEV, with the majority of cases affecting horses in southeast Australia (Roche et al., 2013), as well as three human cases in New South Wales (NSW), nine in Western Australia (WA), and two in South Australia (SA) (Department of Health and Aged Care, 2025). In 2023, an outbreak of MVEV occurred across Australia (Quigley & Honeyman, 2023), with six human cases recorded in Victoria, six in NSW, six in WA, five in the NT, two in Queensland, and one in SA (Department of Health and Aged Care, 2025).
The JEV caused the first human-acquired case on the Australian mainland in 1998 (Hanna et al., 1999; van den Hurk et al., 2019), and in 2021–2022, an unexpected outbreak recorded 45 human cases of JEV nationally, also affecting 80 piggeries in Queensland, Victoria, NSW, and SA (Department of Agriculture Fisheries and Forestry, 2023; Department of Health and Aged Care, 2023; Furuya-Kanamori et al., 2022; Mackenzie et al., 2022). A better comprehension of the climate suitability that favors the expansion of these viruses into temperate regions of Australia could help understand how climate change might influence future outbreaks in those regions, a step forward in preparing for these events.
There is still much unknown about what causes the occasional presence of these viruses in temperate regions of Australia. From a climate standpoint, heavy rainfall has been linked to MVEV and JEV outbreaks in Australia (Broom et al., 2001; Roche et al., 2013; van den Hurk et al., 2022), which favors the presence of mosquito habitats and waterbird breeding (van den Hurk et al., 2022). Alternatively, non-climatic factors have been associated with the risk of outbreaks, such as the proximity to water bodies, wetlands, and animal hosts (Ho et al., 2016; Roche et al., 2013; Walsh et al., 2022). The primary vector for MVEV and JEV, the mosquito Culex (Cx.) annulirostris, and a diversity of hosts capable of maintaining an enzootic cycle are present in temperate regions of Australia (Beltz, 2021b, 2021a; MacKenzie & Williams, 2009; Pandit et al., 2018). Despite the presence of favorable factors that could have supported MVEV and JEV outbreaks in temperate regions of Australia, there has been a prolonged period of absence of outbreaks between 2011 and 2022.
Even though the outbreaks of MVEV and JEV have been associated with heavy rainfall, a deeper understanding of the climate suitability of these viruses in temperate climates is needed to help anticipate outbreaks in a climate change context. The present investigation sought to help fill this gap by determining the climate suitability and risk of outbreaks of MVEV and JEV. We engaged a panel of experts with expertise across epidemiology, public health policy, ecology, entomology, and disease surveillance, to ensure a broad perspective and integrated their opinions within an analytical hierarchy process (AHP). Specifically, this study analyzed the climate suitability and risk of outbreaks during both outbreak and non-outbreak years for MVEV and JEV in the state of Victoria, Australia. The results from this investigation can help bridge the gap in the understanding of what climate conditions could favor MVEV and JEV outbreaks in temperate regions of Australia, a critical aspect in preparing for future events considering climate change.
Methods
To investigate the concept of the climate suitability and risk of MVEV and JEV outbreaks in temperate regions of Australia, a modeling framework developed in a previous study was applied (Flores Lima et al., 2024). The framework consists of an AHP with the participation of an expert panel to weigh the risk factors within the AHP. The state of Victoria was the study area of this investigation to analyze within a contained geographic area with a temperate climate in Australia. This allows to visualize the potential practical usefulness of the AHP approach as an informative and decision-making tool for the states’ regions as a method for assessing the risk of MBFs. Moreover, this methodology provides a foundation for informing policy development by enabling the visualization and mapping of the different levels of risk within other geographical areas, thereby supporting targeted public health decision-making. The analysis spanned the summer months, from December to March, from 2010 to 2022. This period includes two major outbreaks, the 2010–2011 MVEV and the 2021–2022 JEV outbreaks, both affecting the state of Victoria. The climate suitability analysis included monthly rainfall and maximum and minimum temperature data. The risk of MVEV and JEV outbreaks in human populations was analyzed by overlaying the climate suitability layer with some of the relevant non-climatic factors.
Modeling Approach: Analytical Hierarchy Process with an Expert Panel
The AHP is a decision-making tool that has been used to structure and solve complex problems in a variety of fields (Vaidya & Kumar, 2006). This methodology employs a hierarchical structure to describe the problem and uses pairwise comparisons to determine relationship between elements within the structure (Saaty, 1987). The AHP structure used in the current study was previously developed for JEV (Flores Lima et al., 2024) and used for the MVEV analysis. Briefly, the AHP was designed with three hierarchical levels:
The first level describes the objective of the study: the risk of outbreaks (defined as a sudden increased in reported cases in a particular area [Department of Health and Aged Care, 2024]). The second level contains some of the critical factors, obtained from the literature, influencing the risk of outbreaks. The criteria included in this level for JEV were climate, proximity to piggeries, proximity to wetlands, and human population density (Flores Lima et al., 2024). The AHP for MVEV included climate, proximity to wetlands, and human population density (Figure 1). The proximity to piggeries was included in the JEV analysis as they played a significant role in the 2021–2022 JEV outbreak (Mackenzie et al., 2022). The inclusion of proximity to wetlands in both AHPs was made to delineate areas where water birds, important reservoir hosts for both viruses (Beltz, 2021b; Mackenzie et al., 2022), might be present. Finally, since outbreaks of MVEV and JEV can affect human populations and have implications on public health, human population density was included as a factor in both AHPs. The final level is the climate layer that includes rainfall, and maximum and minimum temperatures, factors previously identified as key climate conditions affecting the risk of MVEV and JEV outbreaks (Roche et al., 2013; Selvey et al., 2014; Tian et al., 2015). The modeling of this layer generates the climate suitability maps of MVEV and JEV.
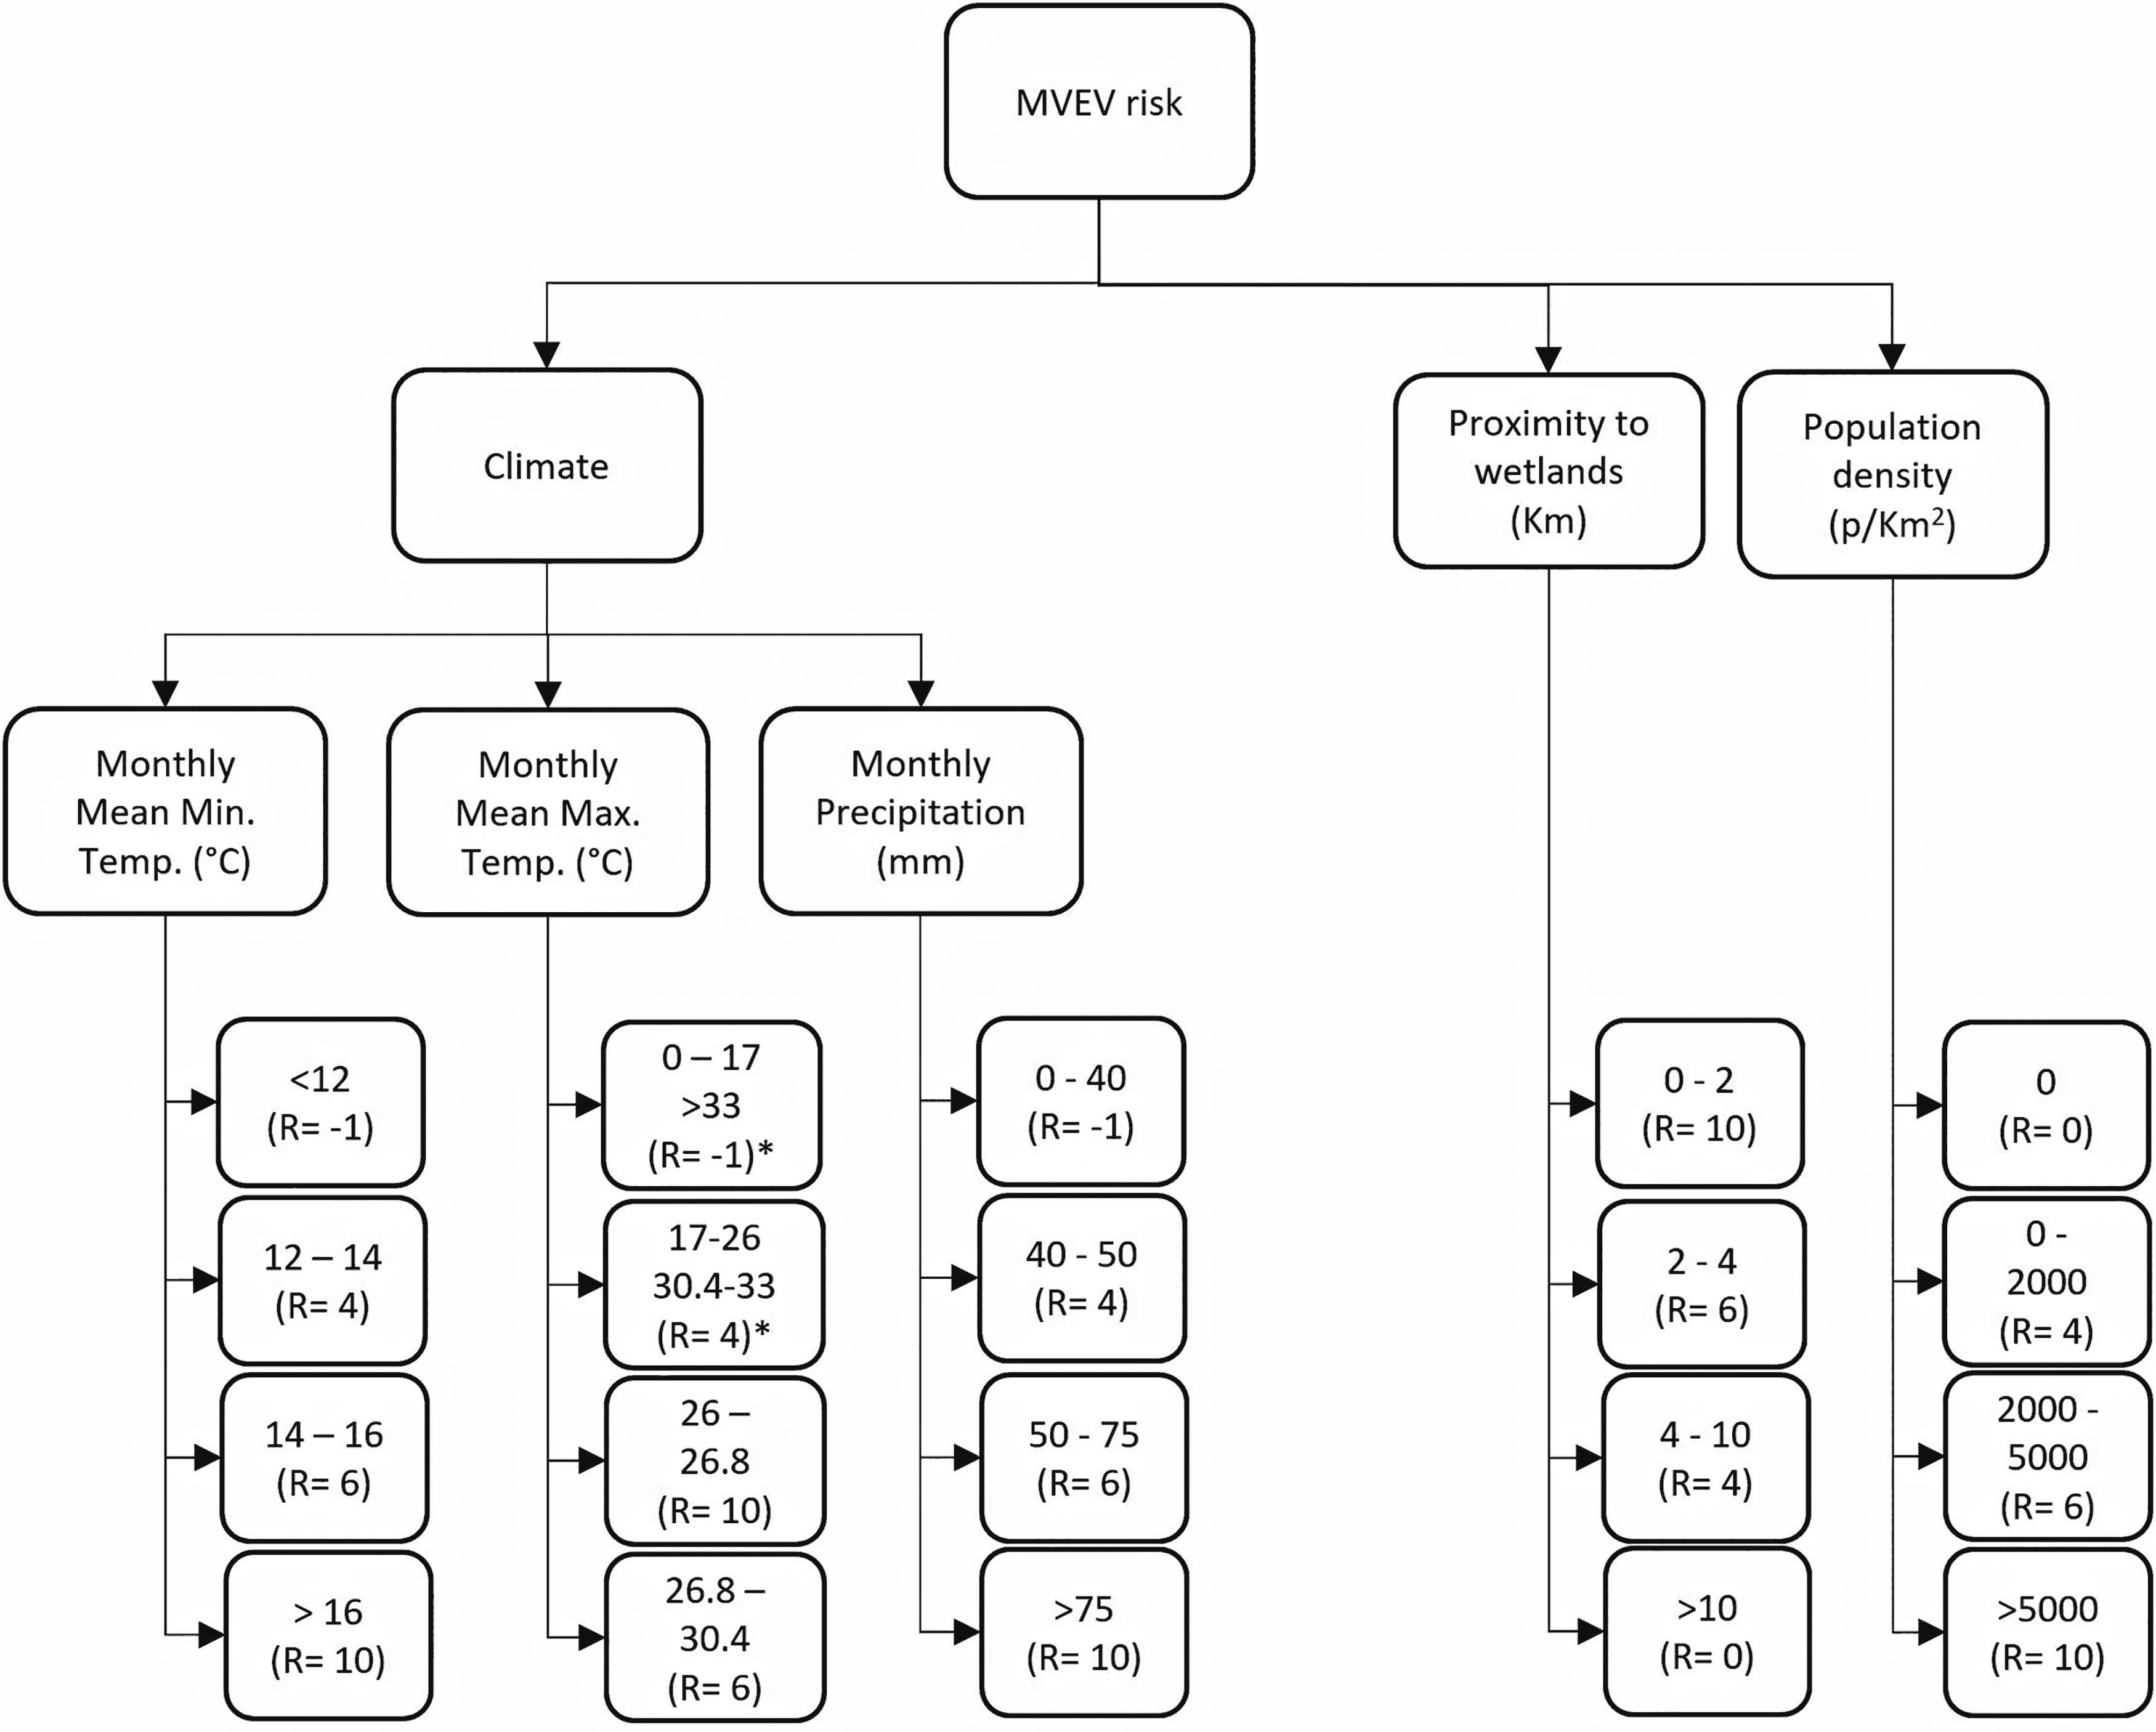
Analytical hierarchy process for MVEV risk in Victoria, Australia. R = rating. * Two ranges of temperature are shown with the same rating. −1: The model excludes the corresponding area from consideration; 0–4: low risk; 4–6: medium risk; 6–10: high risk. The temperature thresholds were extracted from Mordecai et al. (2019), and the rainfall thresholds were determined in Flores Lima et al. (2024).
The participation of an expert panel established the climate suitability and risk of MVEV and JEV by weighting the relative importance of each factor through a pairwise comparison with a 1–9 scale. More details on the experts’ participation can be found in Flores Lima et al. (2024). Twelve participants were engaged for the JEV-AHP on a previous study (Flores Lima et al., 2024) and 11 for the MVEV-AHP. The weights given by the experts were normalized and consolidated using a matrix, according to Saaty’s eigenvector procedure (Albayrak & Erensal, 2004). The consolidated weights (CW), which represent a consensus view from the expert panel, were incorporated into the model using the Model Builder tool in ArcMap 10.7.1 (Esri, 2019) to display the climate suitability and risk maps.
Data Sources
All data files were reprojected to conform to the GCS_GDA2020 coordinate system. A buffer zone of 0 to 10 km was established to calibrate proximity to wetlands and piggeries. The digital boundary of the Victorian maps was extracted from the Australian Statistical Geography Standard (Australian Bureau of Statistics, 2021).
Wetlands and Piggeries
The location of the inland wetlands was obtained from the Victorian Wetland Inventory (Data Vic, 2022), and the location of the farm piggeries was extracted from the Farm Transparency Project (Farm Transparency Project, 2019). The piggeries that were deemed nonoperative were not included in this study.
Human Population Data
For the historical risk analysis, population data from the Australian Bureau of Statistics for 1991 were used (Australian Bureau of Statistics, n.d.a). The population data from 2021 were used to analyze the risk spanning from 2010 to 2022 (Australian Bureau of Statistics, n.d.b). The population density was calculated by dividing the total population within each Statistical Area Level 2 (SA2) by the area of the corresponding SA2 in square kilometers.
Climate Data
Historical climate data: The monthly mean precipitation and minimum and maximum temperatures from December to March were extracted from the WorldClim website (version 2.1) (WorldClim, 2020). The historical data correspond to 1970–2000 with a spatial resolution of 30 s (∼1 km2).
Climate data from 2010 to 2022 were obtained from 809 weather stations across Victoria from the Australia Bureau of Meteorology (Bureau of Meteorology, 2023)—specifically, the monthly mean maximum and minimum temperatures and precipitation records. The climate data were geocoded and interpolated using Kriging in ArcMap 10.7.1 to map the data for analysis at 30-s spatial resolution spatially (Esri, 2019).
Climate Suitability and Risk Analysis
The Tabulate Areas tool from ArcGIS was used to calculate the geographic area in percentage with high suitability of each climate condition for the summer months corresponding to the historical period (1970–2000) and from December 2010 to March 2022. Similarly, the geographic area in percentage with high risk of MVEV and JEV transmission was quantified for the same periods.
Japanese Encephalitis Virus
The AHP structure and the experts’ participation corresponding to JEV were previously published on a separate study (Flores Lima et al., 2024). Briefly, rainfall was weighted as the main diver of the climate suitability of JEV, with a CW of 0.598, followed by the minimum and maximum temperatures, with a CW of 0.230 and 0.172, respectively (Flores Lima et al., 2024). The climate was the most influential factor affecting the JEV risk, with a CW of 0.403, followed by proximity to piggeries (0.272), proximity to wetlands (0.236), and human population density (0.089) (Flores Lima et al., 2024). These results were used to model the climate suitability and risk of JEV during outbreak and non-outbreak years.
Results
The climate suitability and risk of MVEV were determined by the CW arrived at by the expert panel. Rainfall was determined as the main driver of the climate suitability of MVEV, with a CW of 0.677, followed by the maximum and minimum temperatures, with a CW of 0.168 and 0.156 respectively (Table 1). According to the expert panel, the risk of MVEV is influenced primarily by the proximity to wetlands, with a CW of 0.465, followed by climate, 0.438, and human population density, 0.097 (Table 1).
Experts’ Weights of Each Criterion Affecting the Risk of MVEV in Victoria
A–K represent the participants. Zero indicates no influence, one represents high influence.
CR: consistency ratio, which reflects the consistency of response; CW, consolidated weight.
Climate Suitability
The climate suitability for MVEV and JEV was consolidated by the three layers of climate conditions—precipitation, maximum temperature, and minimum temperature—and their corresponding CW determined by the expert panel. Notably, the specific values allocated to each alternative under the precipitation and minimum and maximum temperatures describe optimal conditions for virus transmission (Figure 1). The temperature values describe the optimal thermal thresholds for the MVEV transmission by the vector Cx. annulirostris, obtained from Mordecai et al. (2019). The same thermal thresholds were used for the climate suitability analysis of JEV as determined in a previous study (Flores Lima et al., 2024); consequently, the suitability of each individual condition is the same for both viruses. However, the CW of MVEV and JEV ascertained by the expert panel determines that the climate suitability composites of MVEV and JEV are not the same. The rainfall thresholds were defined considering Victoria’s monthly average rainfall in the summer months as a baseline (Flores Lima et al., 2024). The historical climate data were used as a baseline to compare changes in the presence of suitable climate for MVEV and JEV.
Precipitation Suitability
Outbreak Years
In Victoria, more areas had high precipitation suitability than historically in the 2010–2011 and 2021–2022 outbreak years (Supplementary Figure S1, S2). During the summer of 2010–2011, Victoria presented high precipitation suitability for MVEV and JEV across the state from December to March (Supplementary Figure S1). Compared with historical records, all summer months in the 2010–2011 season had more areas with high precipitation suitability (Table 2). In December 2010, 82 percent of the Victorian geographical area presented high precipitation suitability, the highest percentage of areas with high suitability observed during the summer months, followed by January 2011 with 80 percent of highly suitable areas (Table 2). The increment in the areas with high precipitation suitability was also observed in January and March 2022 (Supplementary Figure S2), with 41 percent and 26 percent of the state showing highly suitable areas, respectively (Table 2).
The Monthly Percentage of Areas in Victoria That Had High Suitability for Each Climate Condition from December to March
The period 1970–2000 represents the historical data. Outbreak years are marked in bold.
Prec, precipitation; Tmax, maximum temperature; Tmin, minimum temperature.
Non-Outbreak Years
Among the non-outbreak years, all summer seasons presented at least 1 month with more high precipitation suitability areas than historically (Table 2). Particularly, February and March 2012, January 2015 and 2021, and December 2017 and 2018 were the months when Victoria presented the highest percentage of areas with high precipitation suitability (Table 2, Supplementary Figures S1 and S2).
Minimum Temperature Suitability
Outbreak Years
This study showed that during the summer of 2010–2011, no areas were highly suitable for the minimum temperature from December to March (Table 2, Supplementary Figure S3). The summer of 2021–2022 showed more areas with high suitability of minimum temperature than historically in January (Table 2, Supplementary Figure S4). Specifically, 51 percent of the state’s geographical area presented high suitability for the minimum temperature for MVEV and JEV (Table 2, Supplementary Figure S4). Notably, no areas in Victoria presented high suitability for the minimum temperature in December and March 2022 (Table 2).
Non-Outbreak Years
Three non-outbreak years had highly suitable areas of minimum temperature: January 2017; January, February, and December 2018; and January 2019 (Table 2, Supplementary Figure S4). Among those, January 2018 and 2019 showed the highest percentage of the geographical area highly suitable for minimum temperature in Victoria, with 22 percent and 38 percent, respectively (Table 2).
Maximum Temperature Suitability
Outbreak Years
During the 2010–2011 outbreak year, 11 percent and 4 percent of Victoria’s geographical area showed high suitability of maximum temperature in January and February 2011, respectively (Table 2, Supplementary Figure S5). December 2010 and March 2011 did not present areas highly suitable for maximum temperature (Table 2). In 2021–2022, 5 percent of Victoria had high suitability for maximum temperature in December and January, and 6 percent of the state showed high suitability for maximum temperature in February and March (Table 2, Supplementary Figure S6). These values from the summer of 2021–2022 were below the historical percentage of areas highly suitable of maximum temperature (Table 2).
Non-Outbreak Years
During the non-outbreak years, Victoria did not present more areas than historically with high suitability of maximum temperature in December of any year (Table 2). January had more highly suitable areas for maximum temperature than historically in 2012, 2013, 2014, and 2016 (Table 2). March 2013, February, and March 2019 showed more areas highly suitable for maximum temperature than historically (Table 2).
Climate Suitability and Risk of MVEV and JEV from 2010 to 2022
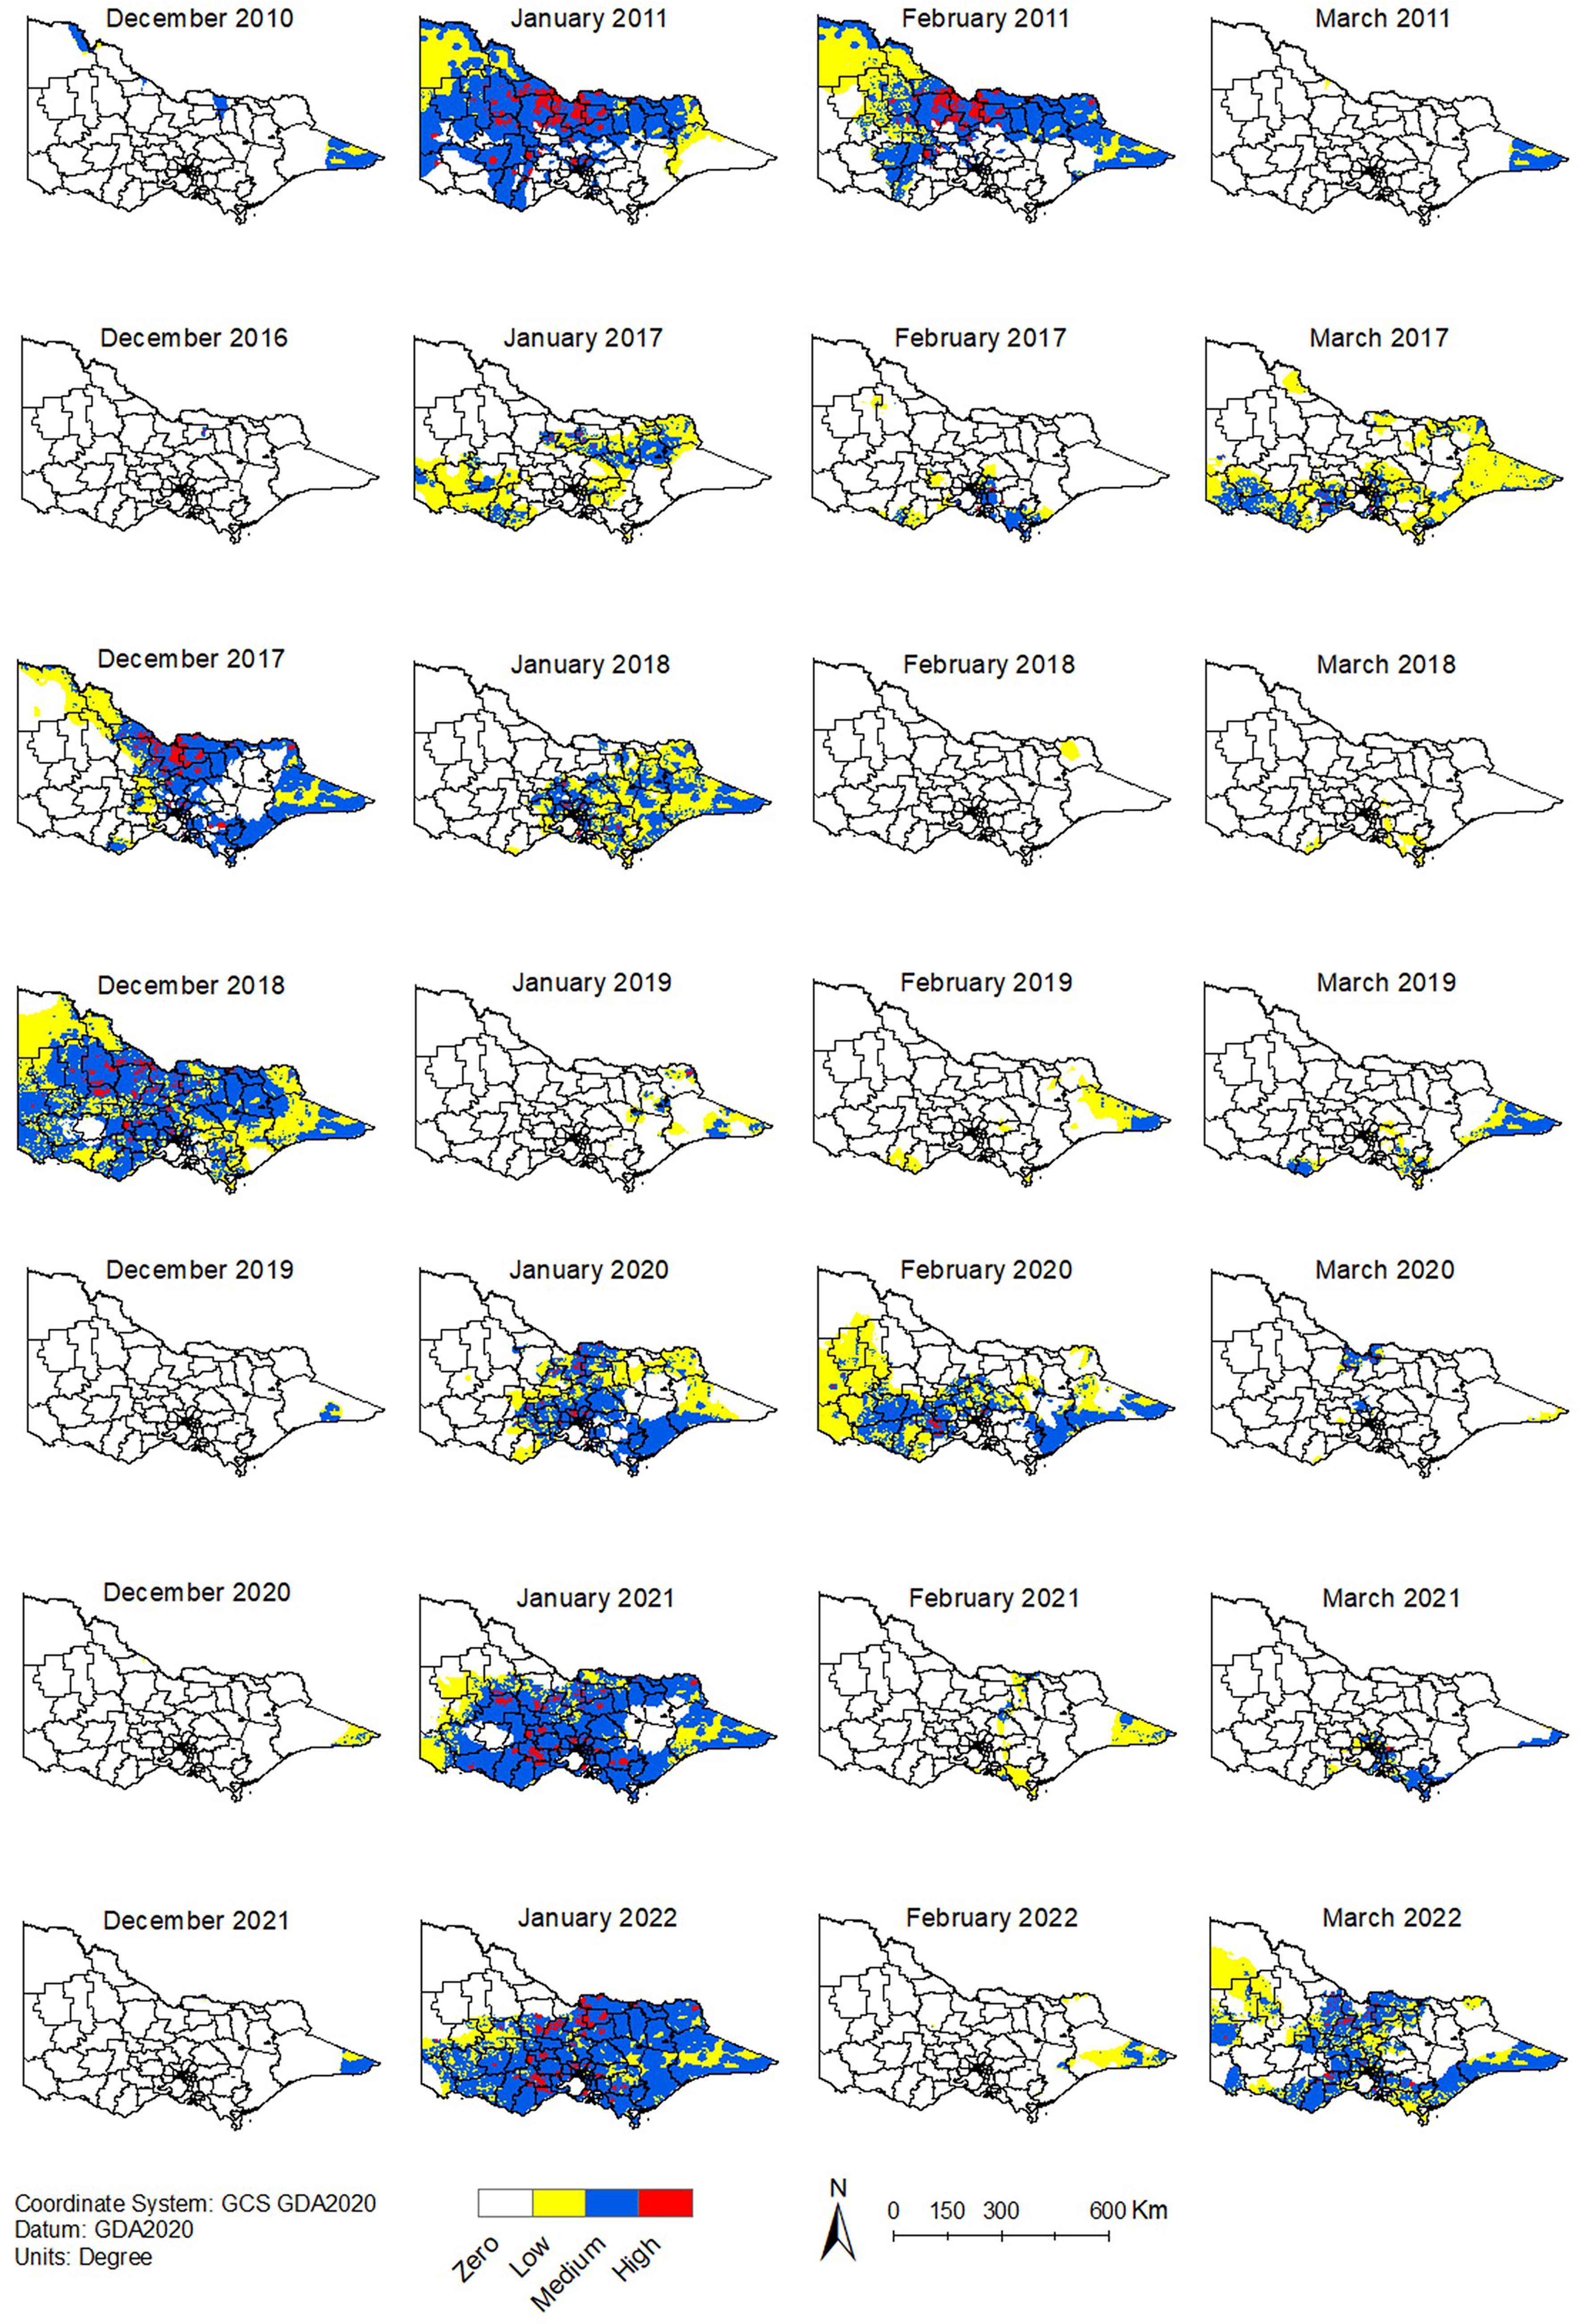
The areas with suitable climates of MVEV and JEV delineate the risk areas since the model excluded areas with unsuitable climates (Figures 2 and 3). The state of Victoria showed areas with high climate suitability in both outbreak years, specifically in January and February 2011 and January and March 2022 (Figures 2 and 3). Furthermore, this analysis showed that every year from 2016 to 2022, at least 1 summer month had more high-risk areas than historically of MVEV and JEV influenced by the presence of suitable climate (Table 3). Additionally, five summer seasons presented 2 months with more high-risk areas than historically for both viruses, including the 2 outbreak years, namely 2010–2011, 2017–2018, 2019–2020, 2020–21, and 2021–2022 (Table 3).
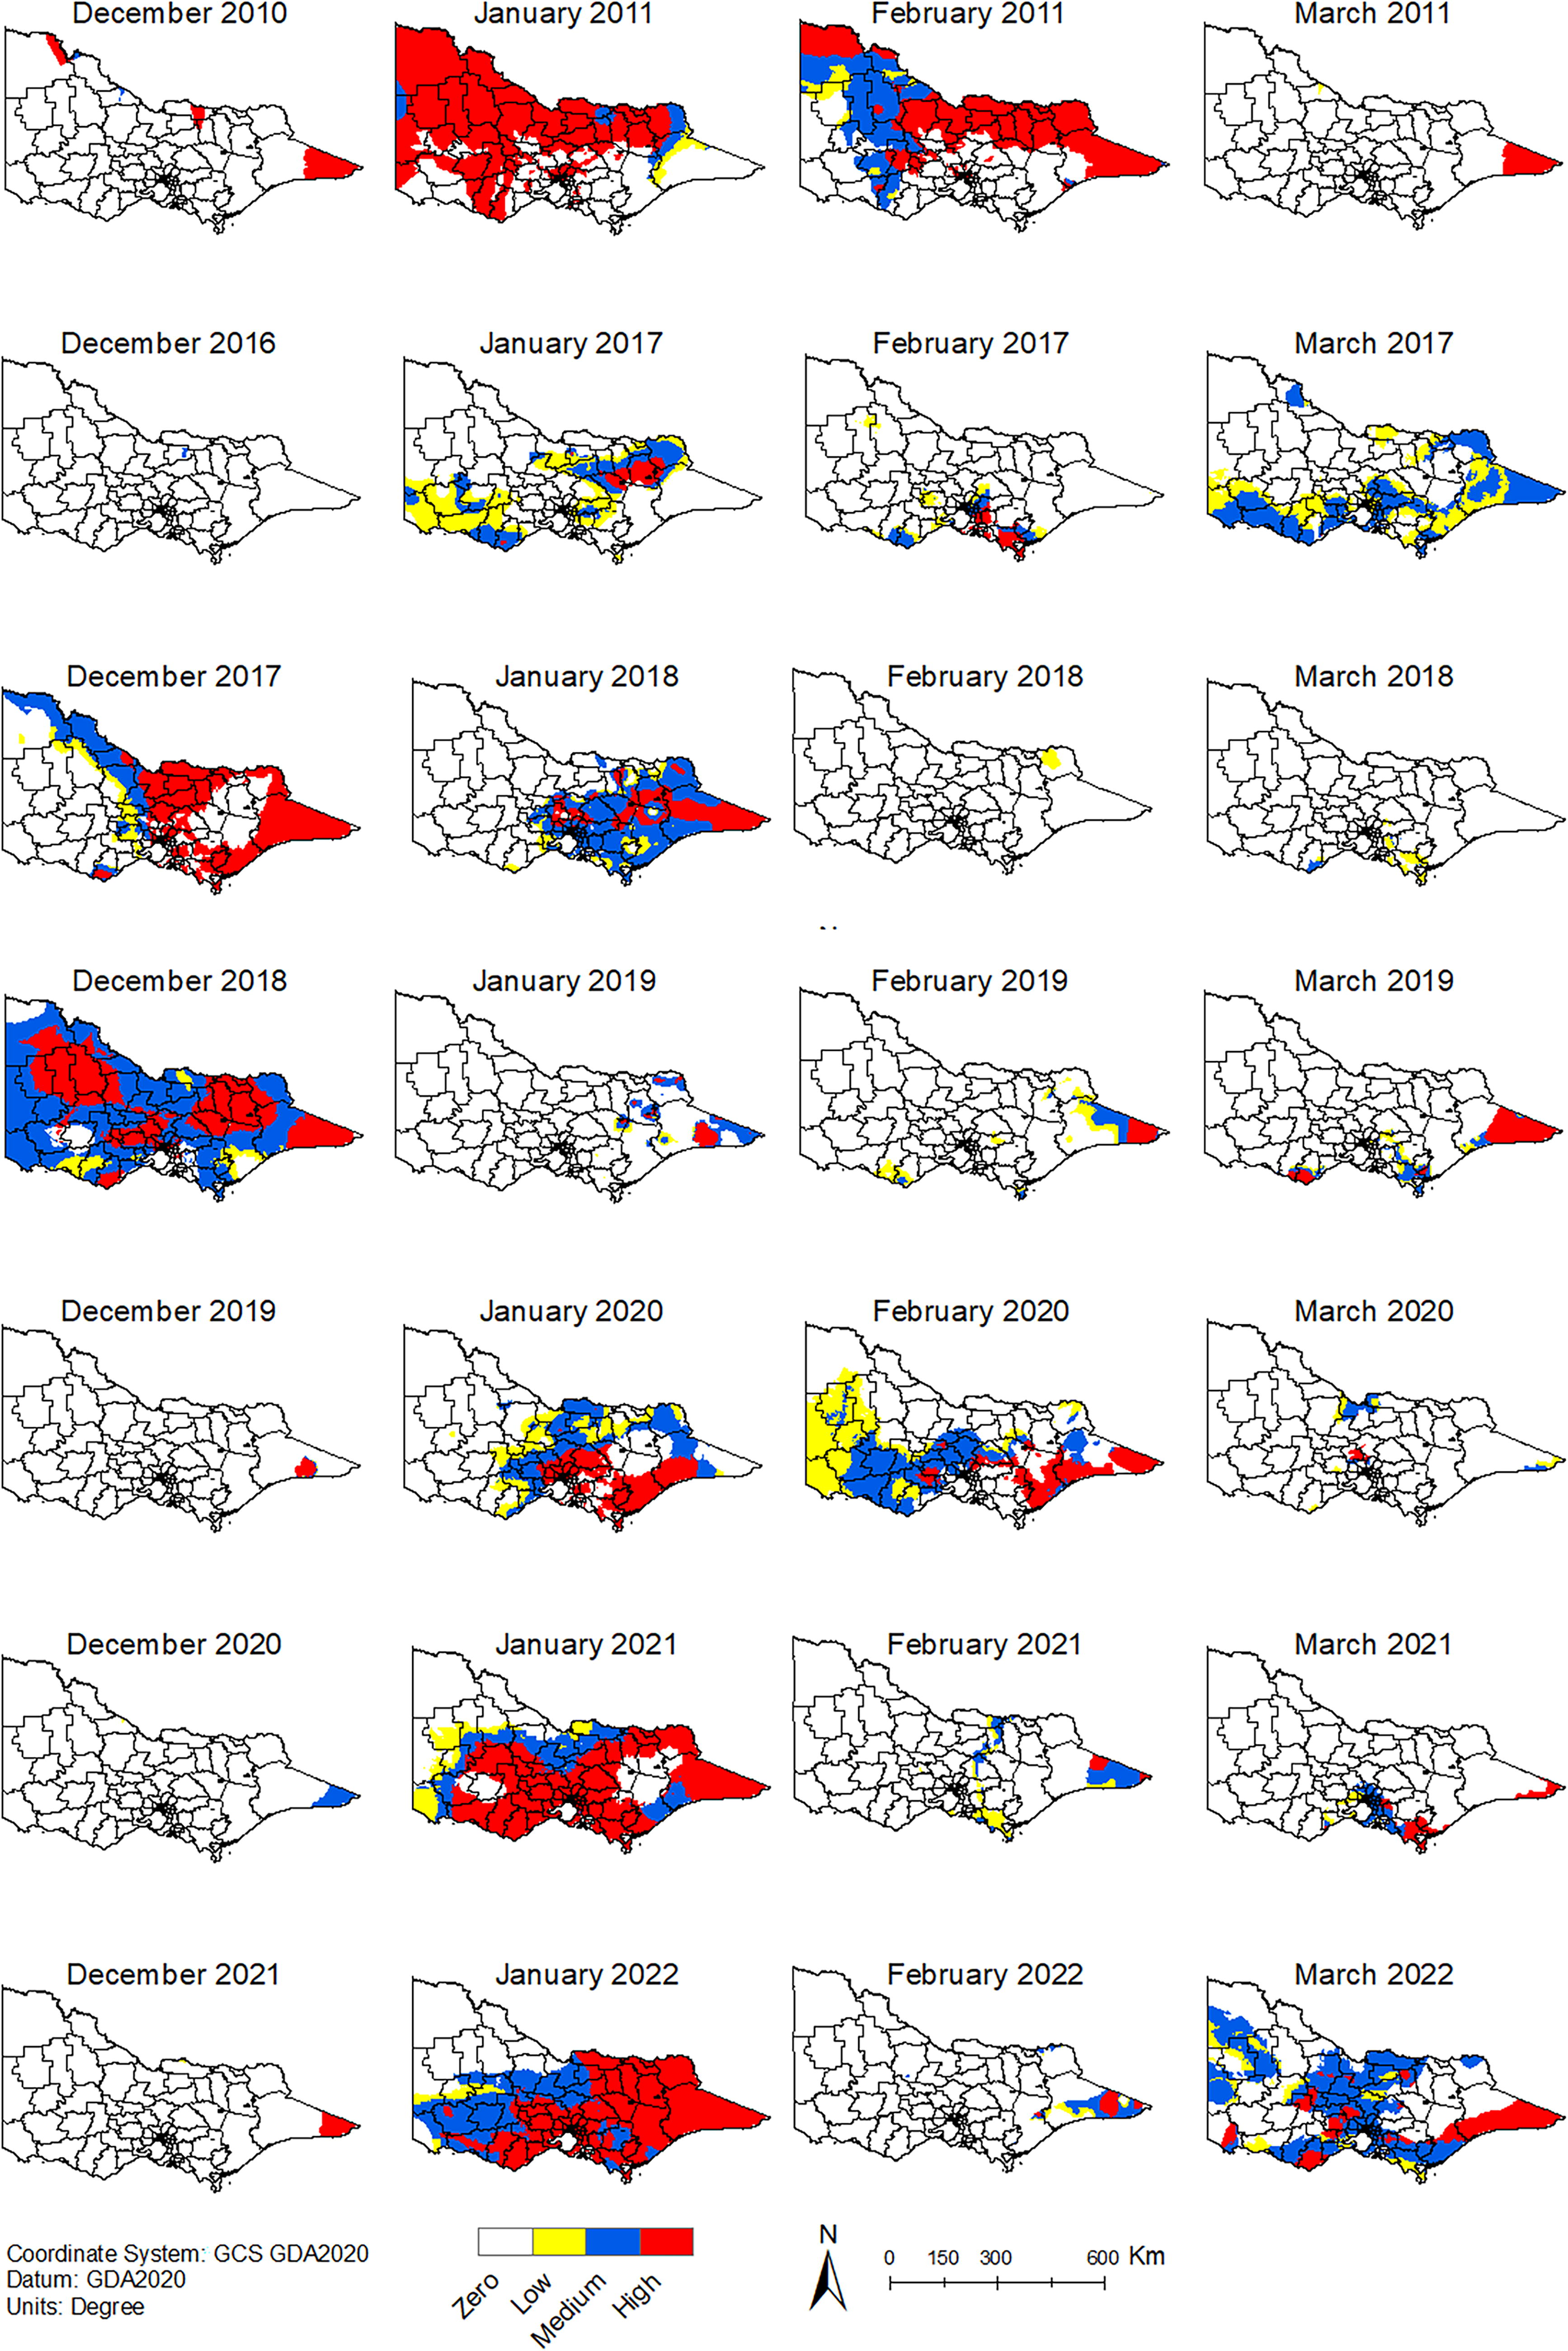
Monthly climate suitability of MVEV from December to March. Inner divisions represent the Local Government Area (LGA) boundaries. White represents unsuitable climate conditions. The years 2011–2012 to 2015–2016 were excluded to simplify the visualization of the maps.
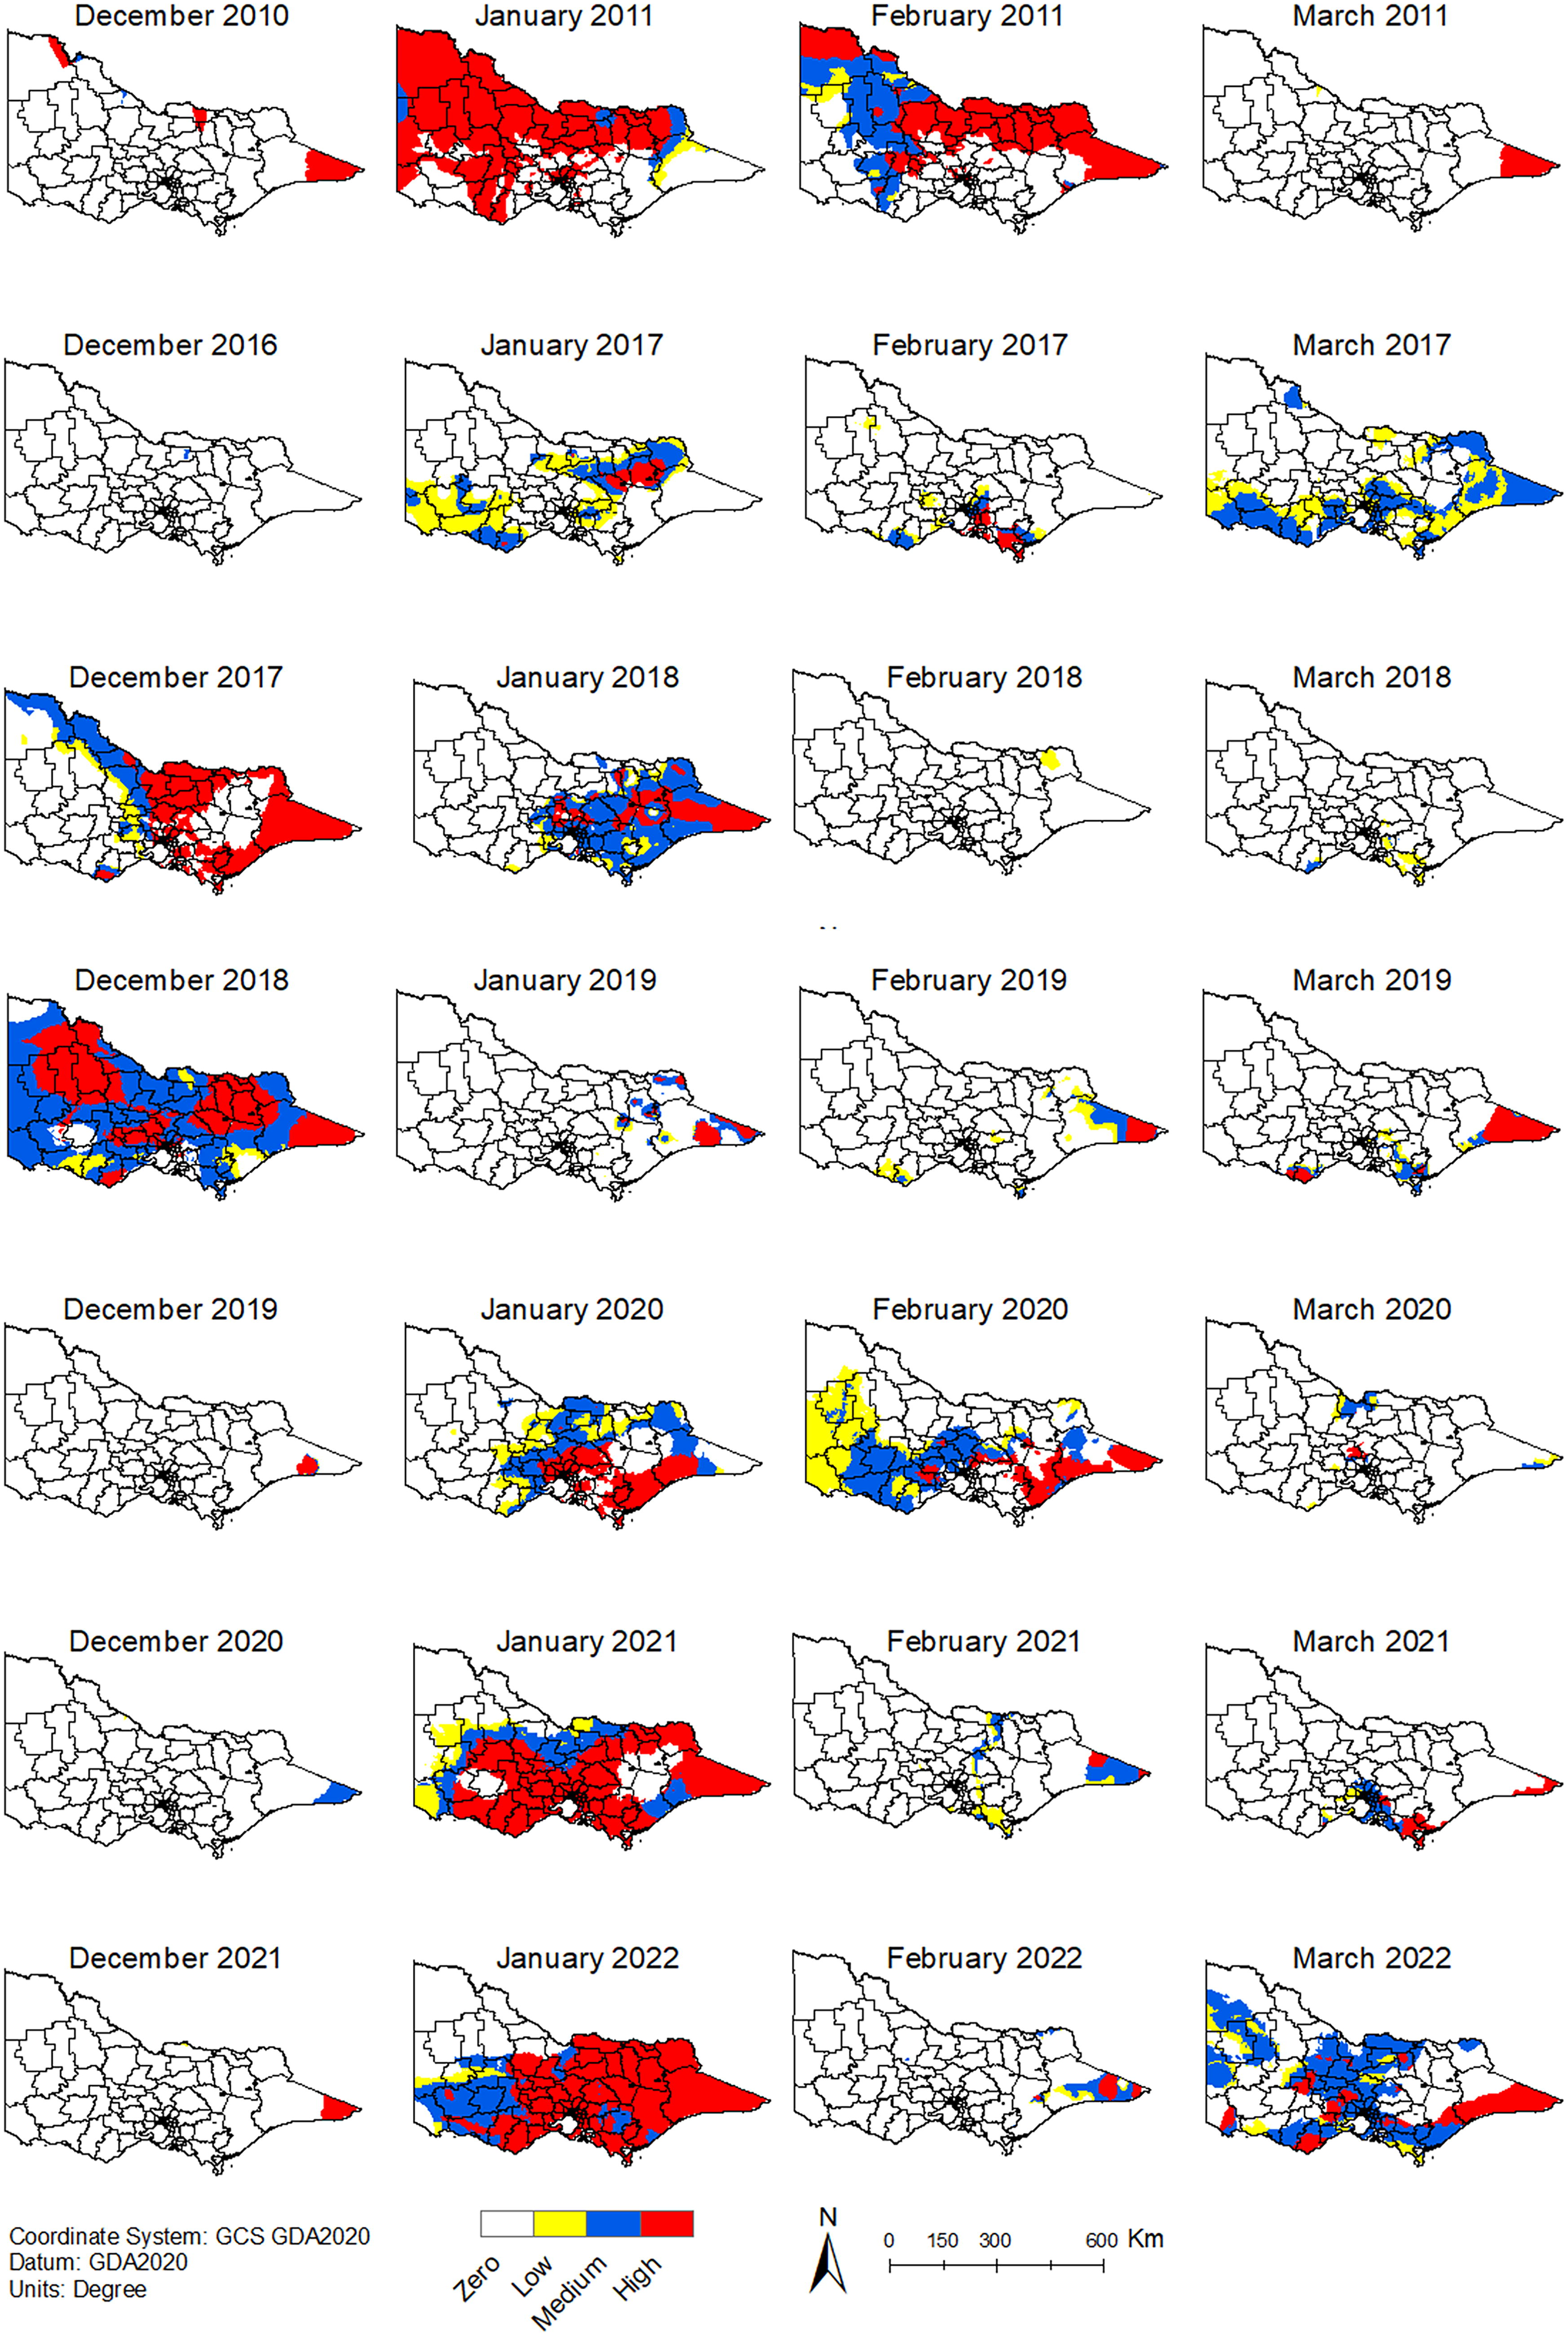
Monthly climate suitability of JEV from December to March. Inner divisions represent the LGA boundaries. White represents unsuitable climate conditions. The years 2011–2012 to 2015–2016 were excluded to simplify the visualization of the maps.
Monthly Percentage of MVEV and JEV High-Risk Areas from December to March in Victoria, Australia
Outbreak years are marked in bold.
JEV, Japanese encephalitis virus; MVEV, Murray Valley encephalitis virus.
January was the most frequent month with more high-risk areas than historically of MVEV and JEV during the period under analysis (Table 3). Remarkably, the percentage of high-risk areas in January 2021 was similar to that in January of both outbreak years, 2011 and 2022 (Table 3). The risk in January 2011 extended to northern and western parts of Victoria (Figures 4 and 5), and the risk in January 2021 and 2022 spanned the southern, western, eastern, and central parts of the state (Figures 4 and 5).
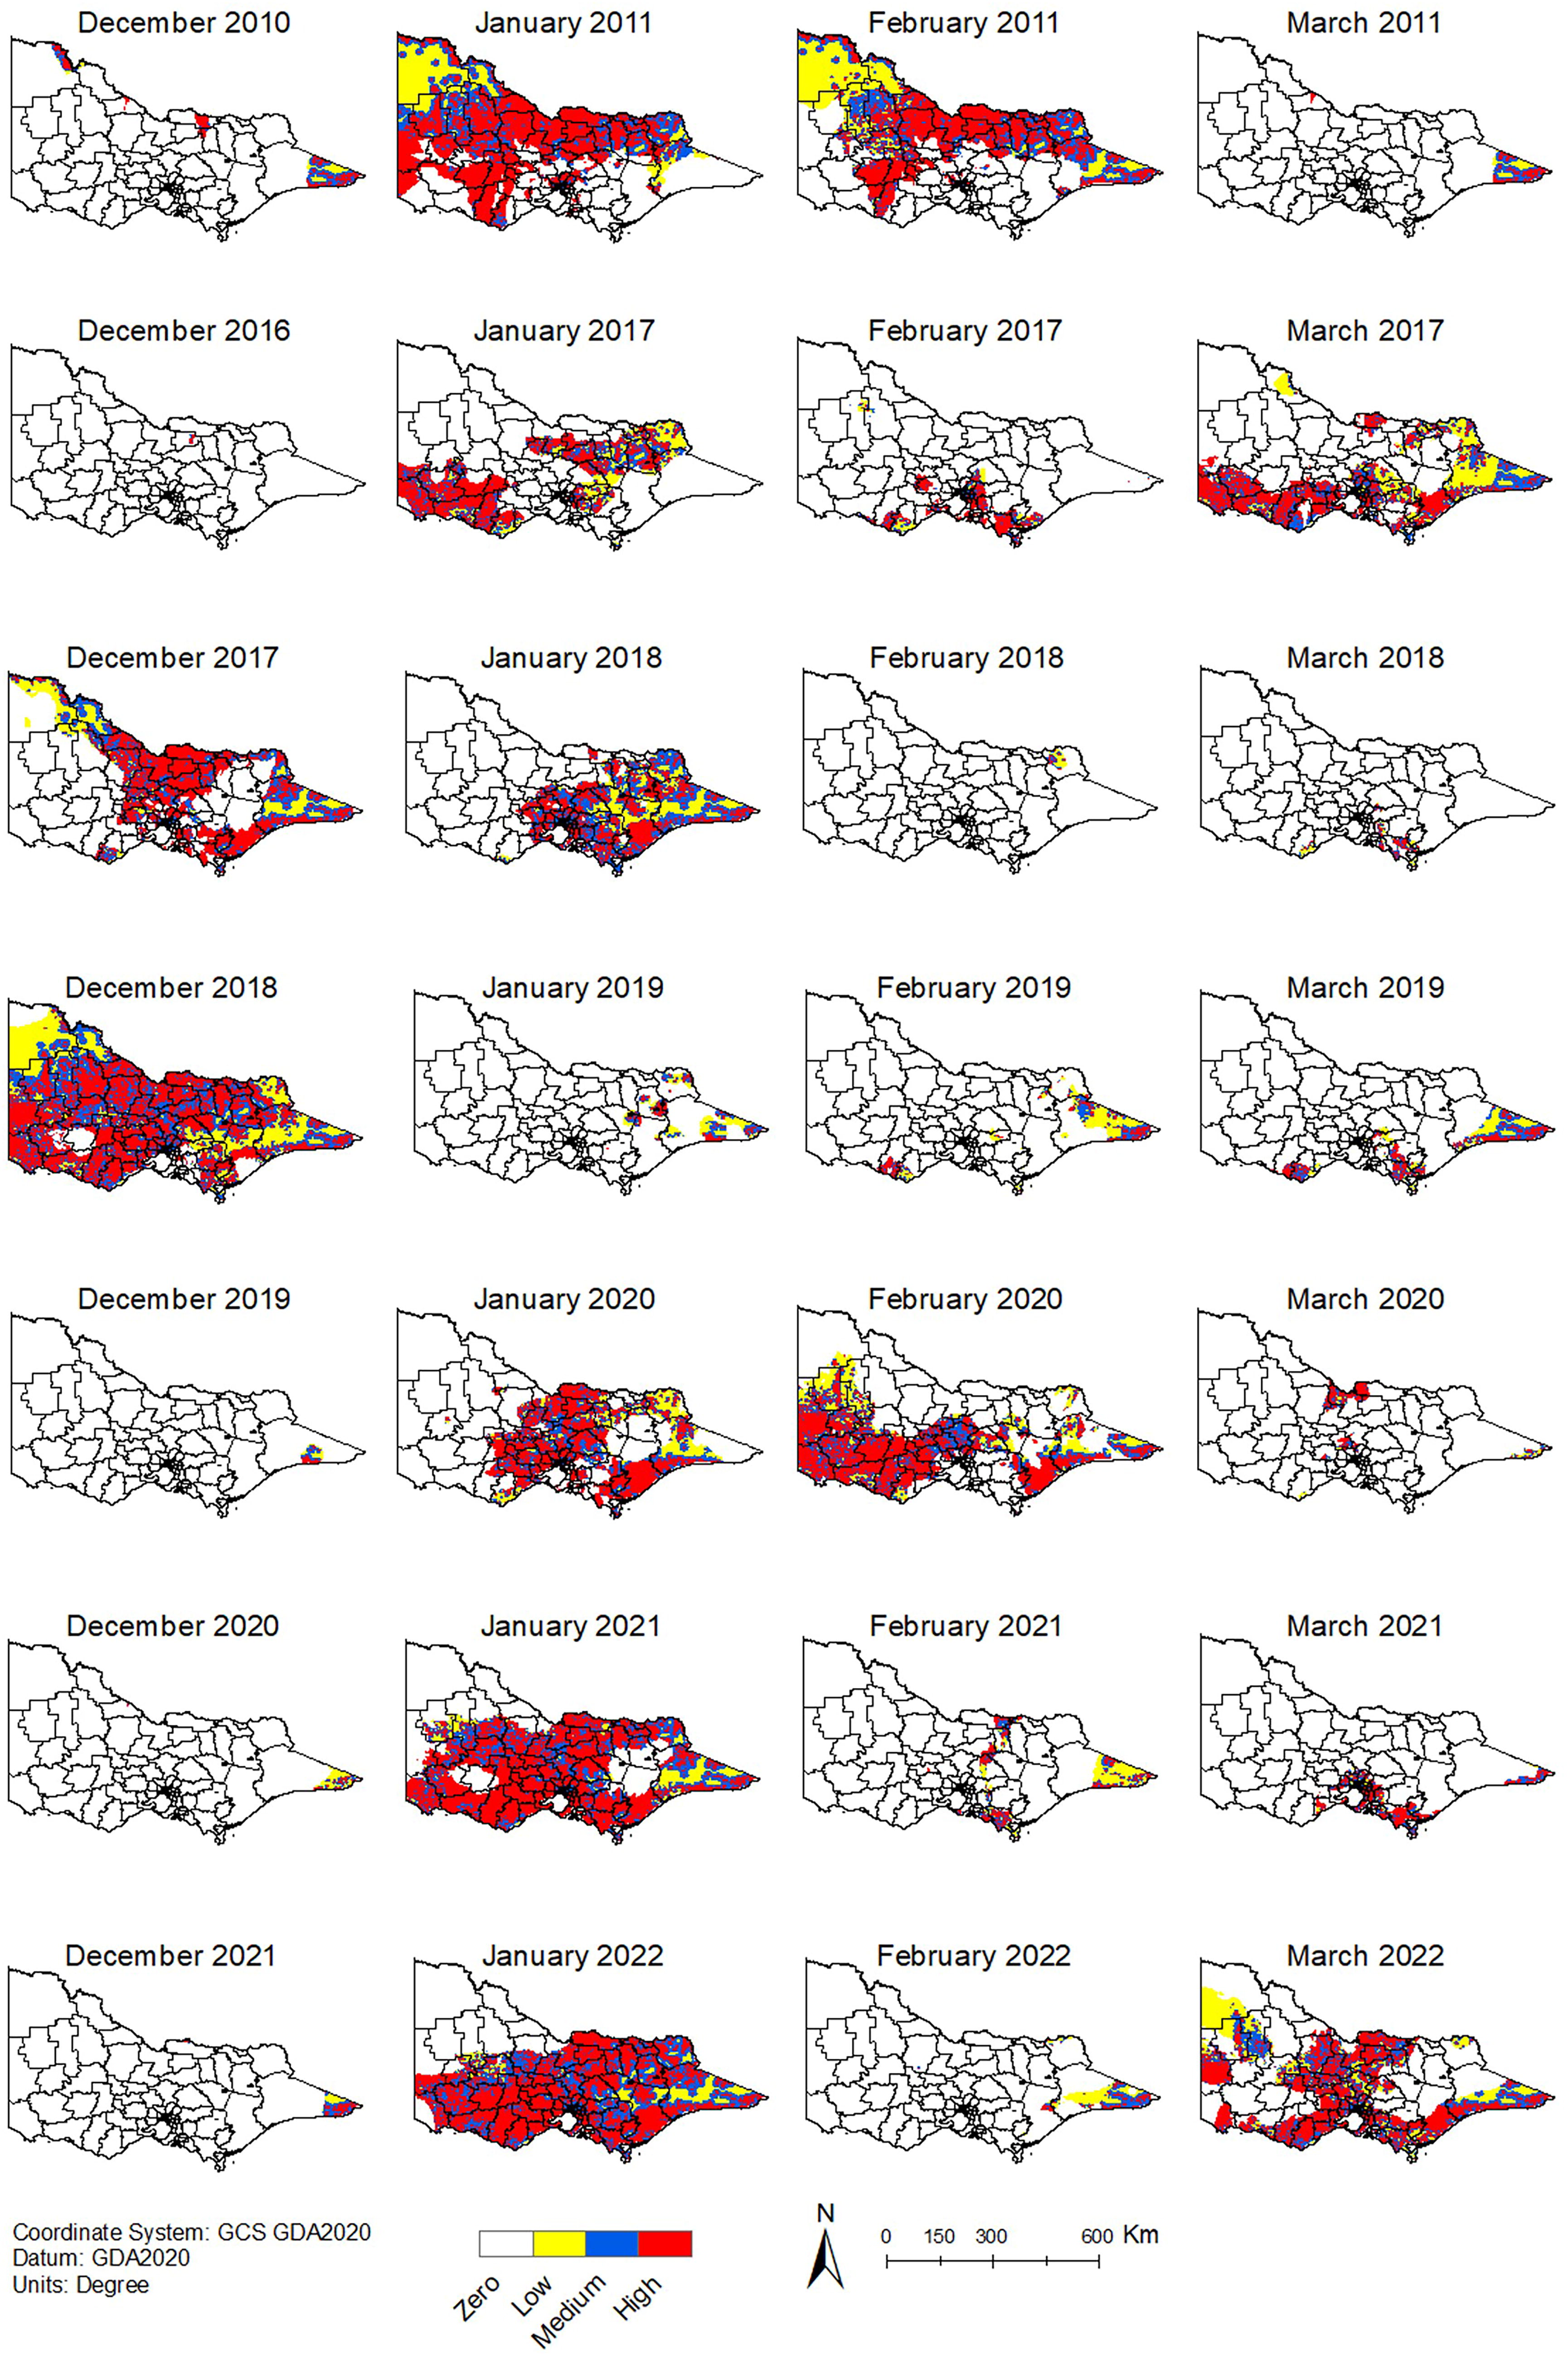
Monthly risk maps for MVEV during the summer months. Inner divisions represent the LGA boundaries. The years 2011–12 to 2015–16 were excluded to simplify the visualization of the maps. MVEV, Murray Valley encephalitis virus.
Monthly risk maps for JEV during the summer months. Inner divisions represent the LGA boundaries. The years 2011–2012 to 2015–2016 were excluded to simplify the visualization of the maps. JEV, Japanese encephalitis virus.
Discussion
Populations in southeastern Australia remain immunologically naïve to MVEV and JEV, and outbreaks of these viruses could potentially cause a public health emergency (Mackenzie et al., 2022; Williams et al., 2013). In a climate change context, the risk of MVEV and JEV influenced by climate suitability needs further investigation. The AHP with the experts’ opinions in weighting the factors affecting the climate suitability and risk of MVEV and JEV allows to arrive at a consensus on what factors are more influential over the others. This enables an integrative approach by combining climate factors to determine climate suitability and climate with non-climatic factors to delineate potential risk areas. To the best of our knowledge, this study is the first to analyze the climate suitability and risk of MVEV and JEV in the state of Victoria, Australia, during outbreak and non-outbreak years.
According to the expert panel, precipitation was the most influential factor on the climate suitability for MVEV, weighted at 68 percent, showing a similar result as the JEV experts’ assessment (Flores Lima et al., 2024). This outcome coincided with the extended areas with high precipitation suitability during both outbreak years, showing more highly suitable areas than historically in 2 of the 4 summer months. These findings are consistent with previous studies highlighting precipitation as an essential trigger for MVEV and JEV outbreaks (Broom et al., 2001; Mackenzie et al., 2022; Roche et al., 2013). Nonetheless, non-outbreak years with high precipitation suitability, such as the summers of 2011–2012 and 2014–2015, did not present more high-risk areas than historically, suggesting that both temperature and rainfall might need to reach a certain threshold to create the necessary climate suitability. This aspect is particularly important in the context of climate change, with expected warmer temperatures and less but more concentrated rainfall (The State of Victoria Department of Environment, Land, Water and Planning, 2019) that could increase the climate suitability for MBFs in some areas of Victoria.
On the contrary, the consensus arrived at by the expert panel categorized the minimum temperature as the third influential factor in the climate suitability of MVEV, whereas, for JEV the minimum temperature was ranked as the second (Flores Lima et al., 2024). This assessment was in accordance with the highly suitable areas for minimum temperature observed in the JEV outbreak in 2021–2022 but not in the MVEV outbreak in 2010–2011. Additionally, the geographic extent of highly suitable areas for maximum temperature did not increase in either outbreak year compared with historically, suggesting that this climate condition might not have influenced past outbreaks. Furthermore, the dissimilar opinions between the experts on the level of influence of the minimum and maximum temperature on the risk of outbreaks (Flores Lima et al., 2024) indicate the uncertainties that still exist around the climate suitability needed to trigger outbreaks.
During the non-outbreak years, there was at least 1 summer month with more high-risk areas than historically every year from 2016 to 2021. Furthermore, 3 non-outbreak years, 2017–2018, 2019–2020, and 2020–2021 showed 2 summer months with more high-risk areas than historically. Notably, December 2018 and January 2021 showed a similar percentage of high-risk areas to the outbreak years. These results suggest that the risk of outbreaks influenced by climate has been consistently present in Victoria during the summer months since 2016, indicating that certain areas of the state have required preparedness for MVEV and JEV since that time. Complex interactions between climatic and non-climatic factors are needed for an outbreak to occur (Roche et al., 2013) as well as the presence of other non-climatic factors, such as bird migration events (Department of Health, 2023), which might have influenced the absence of the viruses during non-outbreak years. The complexity of assessing and anticipating the risk of MVEV and JEV outbreaks challenges public health preparedness for unexpected events. Nonetheless, the AHP framework with the experts’ participation can be a first assessment to translate the potential climate suitability and risk into a decision-making tool to help map what areas might be at risk influenced by a suitable climate. This assessment is achieved by engaging experts in determining the relative weights of a set of criteria to guide the decision-making process under an uncertain environment. The AHP is a decision-making tool that combined with GIS can further enhance the predictive performance by incorporating expert opinions in weighing the significance of the risk factors (Vaidya & Kumar, 2006). This aspect has been considered advantageous over automated methods as it allows for contextual knowledge and expert insight to inform the analysis (Abdallah et al., 2024). Therefore, this methodology approach could present beneficial applications in understanding the risk of MBFs in a given geographic area and projecting the future risk of MBFs in a climate change context.
Results highlight that conditions similar to the 2021–2022 outbreak have been present in the state of Victoria, particularly in the summer of 2017–2018 and 2018–2019, when regions exhibited high climate suitability driven by the minimum temperature and precipitation. Since warmer minimum temperatures have previously been associated with JEV transmission (Li et al., 2023; Zhao et al., 2014), these results suggest that the state of Victoria have been exposed to JEV risk prior to the 2022 outbreak. While the risk of JEV influenced by the set of factors considered in this study has been present in Victoria, the emergence of the virus in 2022 might have been influenced by additional factors, such as the spread of infected mosquitoes, bird migration, and the transport of infected hosts by human movements (Mackenzie et al., 2022; Misra & Kalita, 2010; van den Hurk et al., 2009). Furthermore, the absence of MVEV in 2022 might have been influenced by the competition between MVEV and JEV for vertebrate hosts and the feeding preferences of Cx. annulirostris (van den Hurk et al., 2019). The complex aspects driving the risk underscore the need for additional efforts in understanding the future risk of MBFs such as MVEV and JEV under a climate change context.
The presence of suitable climates for MBFs in temperate regions could be exacerbated by climate change (Kamal et al., 2018). The favorable climate suitability of MVEV and JEV may also indicate potential risk for other flaviviruses that share vectors and hosts. Such is the case of West Nile virus (WNV) (Beltz, 2021a). which has been spreading into temperate regions worldwide influenced by climate change (D’Amore et al., 2023; Erazo et al., 2024). Since Victoria has the presence of suitable vectors and hosts for WNV (Jansen et al., 2013; Webb et al., 2016), authorities should be vigilant and assess the future risk under different climate change scenarios.
There are limitations to the present study. First, the analysis spanned 12 summer seasons, including 2 years when significant outbreaks occurred, to analyze the climatic suitability for MVEV and JEV. However, this time frame might not be sufficient to establish commonalities between outbreaks and non-outbreak years, potentially limiting the outcome of this study. Second, the risk layer did not include an exhaustive list of factors affecting the risk of MVEV and JEV; hence, the risk areas cannot directly correlate to the occurrence of outbreaks. Next, the experts’ opinions by weighting factors reflect professional opinions to form a consensus view on climate suitability and risk of MVEV and JEV. While this can help fill the gap between the understanding of what conditions are needed to trigger outbreaks and the future risk of MVEV and JEV, the inclusion of other factors, such as land use, urbanization, and extreme weather events, could improve the resolution when mapping the risk.
Conclusion
This study showed that the state of Victoria had areas with highly suitable climates for MVEV and JEV during the 2010–2011 and 2021–2022 outbreak years, influenced by precipitation and both precipitation and minimum temperature, respectively. Furthermore, the state of Victoria has been experiencing highly suitable climate conditions for MVEV and JEV during the summer months in non-outbreak years, potentially exposing regions of the state to the risk of outbreaks. Considering that favorable climate conditions for these viruses have been present in the state, it is critical to assess the risk of other flaviviruses under a climate change context. The AHP with an expert panel can help translate the potential climate suitability and risk of flaviviruses determined by the experts’ opinions into a decision-making tool as a first assessment of what areas might be at risk of outbreaks. The outcomes of this investigation are a step forward in understanding the potential risk of MVEV and JEV driven by climate in temperate regions of Australia.
Footnotes
Authors’ Contributions
M.F.L.: Investigation, formal analysis, methodology, project administration, visualization, writing—original draft, and writing—review and editing. R.F.: Supervision and writing—review and editing. J.C.: Supervision and writing—review and editing.
Ethics Approval Statement
The Deakin Human Ethics Advisory Group HEAG (HEAG-H 184_2022) granted ethics approval to conduct the survey. Participants were delivered a plain language statement and a consent form. All participants involved in this study provided written informed consent.
Author Disclosure Statement
The authors do not have any conflicts of interest to declare.
Funding Information
Deakin University HDR funds and a Deakin University Postgraduate Resrach Scholarship (DUPRS) International funded this project.
References
Supplementary Material
Please find the following supplemental material available below.
For Open Access articles published under a Creative Commons License, all supplemental material carries the same license as the article it is associated with.
For non-Open Access articles published, all supplemental material carries a non-exclusive license, and permission requests for re-use of supplemental material or any part of supplemental material shall be sent directly to the copyright owner as specified in the copyright notice associated with the article.