
Abstract
Nitrogen (N) footprint assessments have served as tools for sustainability, research, and education at institutions of higher learning by connecting institutional activities and resource consumption with environmental impacts through the lens of the N cycle. The Nitrogen Footprint Tool (NFT) Network consists of colleges, universities, and research institutions that have committed to assessing and reporting their own N footprints while contributing novel research and feedback that improves footprinting tools and methods. Institutions in the network since its inception in 2014 initially calculated their N footprints using the Excel-based NFT. In 2017, institutions began using the web-based Sustainability Indicator Management & Analysis Platform (SIMAP), which integrates the institution's N footprint with a carbon footprint. In this article, the N footprint results generated by the NFT are compared to those generated by SIMAP for six of the seven institutions that made up the first cohort of the NFT Network. A comparison, of how the changes in methodology between platforms and the changes that occurred at the institution level affected the results, and yield insights into the numerous factors that influence N footprint assessments. The accuracy of the results of an N footprint using the Excel-NFT have been improved by SIMAP. Key factors include updates to emissions factors used in SIMAP, reductions in emissions due to institution sustainability efforts, and improved data collection methods by participating institutions. The NFT Network recommends using SIMAP for institutional N footprint data tracking, goal setting, and reporting. Several best practice recommendations for using the tool for N tracking are proposed.
Introduction
Background
Tracking the environmental sustainability of an entity is essential to determining appropriate strategies to reduce environmental impact. One popular way to do this is through use of environmental footprint tools. These tools quantify losses to the environment as a result of resource use and activities of an entity (e.g., an individual) (Leach et al., 2012), an institution (Castner et al., 2017a; Leach et al., 2013), community (Dukes et al., 2020). Two popular environmental tools measure carbon (C) and N footprints (Leach et al., 2013).
Footprint indicators have become increasingly important for institutions of higher education, which make use of a variety of them, including those for N and C. Footprint indicators allow institutions to track environmental impacts on a year-to-year basis, set reduction goals, and educate students and stakeholders about their environmental impact. Institutions have used footprint indicators to establish a baseline, measure progress, and set attainable reduction goals (Castner et al., 2017b; Lambrechts et al., 2014; Leary et al., 2017, Messenger et al., 2021).
The N footprint offers a novel sustainability lens to institutions because it is an indicator that has widespread environmental effects (Erisman et al 2013; Galloway et al., 2013); N footprints measure the total amount of reactive N (Nr) that is released to the environment as a result of an entity's activities and resource consumption. Nr is necessary to produce food and sustain life. However, too much Nr can cause a cascade of detrimental environmental effects such as smog, acid rain, forest die back, eutrophication, biodiversity loss, stratospheric ozone depletion, and enhanced greenhouse effects (Galloway, 2003). Food and energy are the primary categories of consumption contributing to the N footprint across different scales, from individual to country-level footprints. As was reported in Castner et al. (2017a), this applies to academic institutions as well, that is, for most institutions food consumption is the largest contributor to their N footprint.
The NFT Network was established in 2014, with US Environmental Protection Agency funding, as a group of academic institutions collaborating to improve institution scale N footprint tools and to conduct novel research on institution N footprints. The seven institutions making up the first cohort were: Brown University, Colorado State University, Dickinson College, Eastern Mennonite University, the Marine Biological Laboratory, the University of New Hampshire, and the University of Virginia. All seven institutions initially calculated their footprints using the Excel-based Nitrogen Footprint Tool (NFT). There were also two additional cohorts making a total of 21 institutions over the course of the length of the project (July 2014 through June 2020).
In 2017, the collaboration between the NFT Network based at the University of Virginia and the Sustainability Institute at the University of New Hampshire created a new web-based assessment platform, the Sustainable Indicators Management and Analysis Platform (SIMAP), that could assess C (including all greenhouse gas emissions) and N footprints simultaneously. The new platform updated the methodology used to calculate institution N footprints, making improvements based on experience gained from the NFT Network, and streamlining the data collection process to integrate better with the C footprint. Combining these footprints into one platform allows for institutions to get a broader view of environmental impacts and sustainability measurements. The SIMAP platform provides accessibility to both C and N footprint tools and flexibility in tracking, and allows for collaboration among different sectors of an institution in order to provide necessary data for education, management, and assessment.
Overview and Primary Questions
This article is an update to Castner et al. (2017a), which reported the N footprint results of the first NFT Network cohort. This article compares the N footprint results from the NFT Excel tool and results from the SIMAP assessment platform, the changes in methodology across institutions as they moved their data into the SIMAP platform, and the implications of the updated and improved results for an institution's N footprint calculation.
This article addresses the following questions: 1.) How has the N footprint calculation methodology changed from the Excel-based NFT to SIMAP? 2.) How have the institutions' results changed as a result of utilizing the SIMAP platform? 3.) How have individual institutions responded to the change from the NFT-Excel to the SIMAP platform?
Methods
Changes from the NFT Excel Tool to SIMAP Platform
In the switch from the Excel-based NFT to the web-based SIMAP platform, numerous improvements and enhancements were completed. These improvements included updating emissions factors, establishing consistent methodology to align with the C footprint protocols, and the addition and recategorization of several emissions sources not previously included in the NFT-Excel tool. Changes for several sources were minimal and only included updating emissions factors while others were altered to align with C-footprint methodology or added as a result of new data. Tables 1–4 show components of the NFT-Excel tool and SIMAP platform and outlines. The N footprint emission sources were categorized into the same scopes as the C footprint. Scope 1 includes direct emissions from owned or controlled sources (Table 1). Scope 2 includes indirect emissions from purchased electricity, heating, cooling, or steam (University of New Hampshire Sustainability Institute, 2018) (Table 2). Scope 3 includes all other indirect emissions (see Table 3). Sinks includes practices institutions are using to create a net reduction in worldwide carbon emissions and nitrogen losses such as offsets, non-additional sequestration, and compost.
Improvements Made for Changes from the NFT-Excel to SIMAP, Organized by Scope
Improvements Made for Changes from the NFT-Excel to SIMAP, Organized by Scope
Improvements Made for Changes from the NFT-Excel to SIMAP, Organized by Scope
Improvements Made for Changes from the NFT-Excel to SIMAP–Sinks
Background at Each Institution
The institutions represented in this study are the same as those included in Castner et al. (2017b), excluding Dickinson College. Each of these institutions transitioned from the Excel-based NFT to the web-based SIMAP platform. It is important to note that each institution is different in size, population, and purpose, among other characteristics. These institutional differences provide a broad view of N footprint results and provide a snapshot of the types of institutions that can use SIMAP for internal tracking and comparison purposes.
Institutions included in this analysis were: University of Virginia, UVA (Charlottesville, VA), University of New Hampshire, UNH (Durham, NH), Colorado State University, CSU (Fort Collins, CO), Marine Biological Laboratory, MBL (Woods Hole, MA), Brown University (Providence, RI), and Eastern Mennonite University, EMU (Harrisonburg, VA). The largest institution by full-time equivalents (FTE) of combined faculty, staff, and students is CSU with about 41,500, followed by UVA (about 38,000), UNH (about 19,000), Brown (about 14,000), EMU (about 1,600), and the smallest, MBL (about 250). EMU, Brown, and MBL are private institutions while UVA, CSU, and UNH are public. Both CSU and UNH are land grant universities; CSU has the larger agricultural operation. UVA also includes a medical center.
Methodologies used to gather data at each institution varied. The most diverse data collection methodology across institutions is the category food. UVA and MBL track 100 percent of food purchases by weight at all dining locations (Leach et al., 2012; Messenger et al., 2021); EMU scales data based on two months of purchasing and annual meals served; CSU collects food data only from Housing and Dining Services (Kimiecik et al., 2017); UNH collects 85 percent of food dollars spent and scales up to determine the other 15 percent; and Brown scales up based on 50 percent of food data collected. All six institutions included compost as an offset from their overall emissions.
The six institutions use a variety of on-campus stationary energy sources in addition to purchased electricity. All institutions used standard factors included in SIMAP to estimate N emissions from on-campus energy generation. Institutions used the market-based (UVA and MBL), location-based (Brown and EMU), or custom utility emissions factors (CSU) to calculate their purchased electricity N losses. UNH had zero purchased electricity emissions due to the power generated from their on-site cogeneration plant.
Inclusion of scope 3 categories varied by institution. All institutions tracked commuter miles traveled; UNH, EMU, CSU, Brown, and MBL also track business airline travel.
Several institutions adopted C or N footprint reduction goals throughout the time of the tracked emissions. N footprint reduction goals have been adopted by UVA (30% by 2030), CSU (5% Housing and Dining Services reduction), and Brown (25% by 2025). UNH and EMU are in the process of setting N footprint reduction goals. UVA, CSU, Brown, UNH, and EMU all have C footprint reduction strategies in place.
Comparison of NFT and SIMAP Results
Each institution contributed one set of results from an NFT assessment and one set from a SIMAP assessment. The assessment years calculated in each platform are not the same due to availability of data and to show the most accurate representation of each institution's current tracking; therefore they cannot be directly compared to show changes resulting solely from the change in assessment tool methods or tools used by the institutions for tracking changes over time. However, many institutions report that changes in data collection methodology made the biggest impact on the difference in results.
Results are not intended to be compared across institutions as they are different in many ways. Instead, results are shown as an aggregation of the six institutions in the two different assessment platforms. Footprint results were evaluated in terms of total footprint, by scope and by source. Since categorization of sources changed between the NFT Excel tool and SIMAP platform, how this change affected the results based on the source is also shown.
Results
There are three primary reasons that these institutions have different results for their N footprint calculation from SIMAP and from the NFT. The first is attributable to improved data collection due to both improved data formatting in SIMAP and to more streamlined data collection processes implemented by the institutions. Second, N footprint results changed due to improvements in the calculator, including updated emission factors and improved categorization of emission sources. Third, the actual N footprint changed because of improved efficiencies and sustainability efforts made by the institutions to reduce their N and C footprints. Four of these six institutions agree that improved data collection at individual institutions made the biggest impact on their institutions' N footprints (MBL, CSU, Brown, and EMU). The largest change in the UNH and UVA footprints were due to improvements in emissions-factor methodology in the new platform.
Streamlined Data Collection Integration of the N footprint with the C footprint enables streamlined data collection, allowing institutions to utilize the same dataset for both footprints. The data collection guidelines for SIMAP are more robust and consistent than those for the NFT. This effect can be seen in the changes in food purchasing data. In previous NFT calculations, most institutions used scaling factors to estimate the total food purchasing based on a small dataset. In SIMAP calculations, institutions are able to either enter a complete food purchasing dataset or use more precise scaling factors. Data for on-site fuel use, purchased utilities, and transportation were streamlined due to the overlap with the C footprint: SIMAP uses datasets for energy that are regularly collected and maintained for campus carbon emissions reporting.
Improvements in the Calculation Method
Two primary types of improvements were made in the calculation method in the shift from NFT to SIMAP: updated emission factors and shifts in source categories to align with C footprints. Emissions factor updates resulted in significant shifts for the representation of utilities and transportation data. Besides updated emission factors, the NFT tool and SIMAP platform use different categorizations to represent the same data. The additional sources included in SIMAP provide additional granularity as well as improved compatibility with the platform's C footprint reporting methodology.
N Footprint Changes
The input data used by the institutions in this study changed over different reporting years due to actual changes in institutional consumption and use (food, fuels, utilities, etc.) and improved efficiencies due to sustainability efforts. Across all institutions the N footprints results from SIMAP were lower than those calculated in the NFT.
As shown in Figure 1, the NFT results represent the initial N footprint assessments published in Castner et al. (2017a), while the SIMAP results represent later N footprint assessments. Source categories represented on the graph have been modified from the output of the NFT and SIMAP platform and aggregated into categories as follows: Food represents the food category from SIMAP and the food production category from the NFT. Utilities is the sum of on-site utilities, cogenerated electricity, cogenerated steam, and other on-campus stationary, and transmission and distribution (T&D) losses for SIMAP. The utilities category represents the NFT utilities source category, which includes purchased utilities and on-site generation. The transportation and commuting category is the sum of on-site transportation; faculty, staff, and student commuting; directly financed air travel, other directly financed travel, and study abroad travel sources for SIMAP. Transportation and commuting represents the transportation source category from the NFT. Wastewater represents the wastewater category from SIMAP and the Food Consumption category from the NFT. Fertilizer and animals represents the fertilizer and animals source category from SIMAP and combines the separate fertilizer and research animals source categories from the NFT.
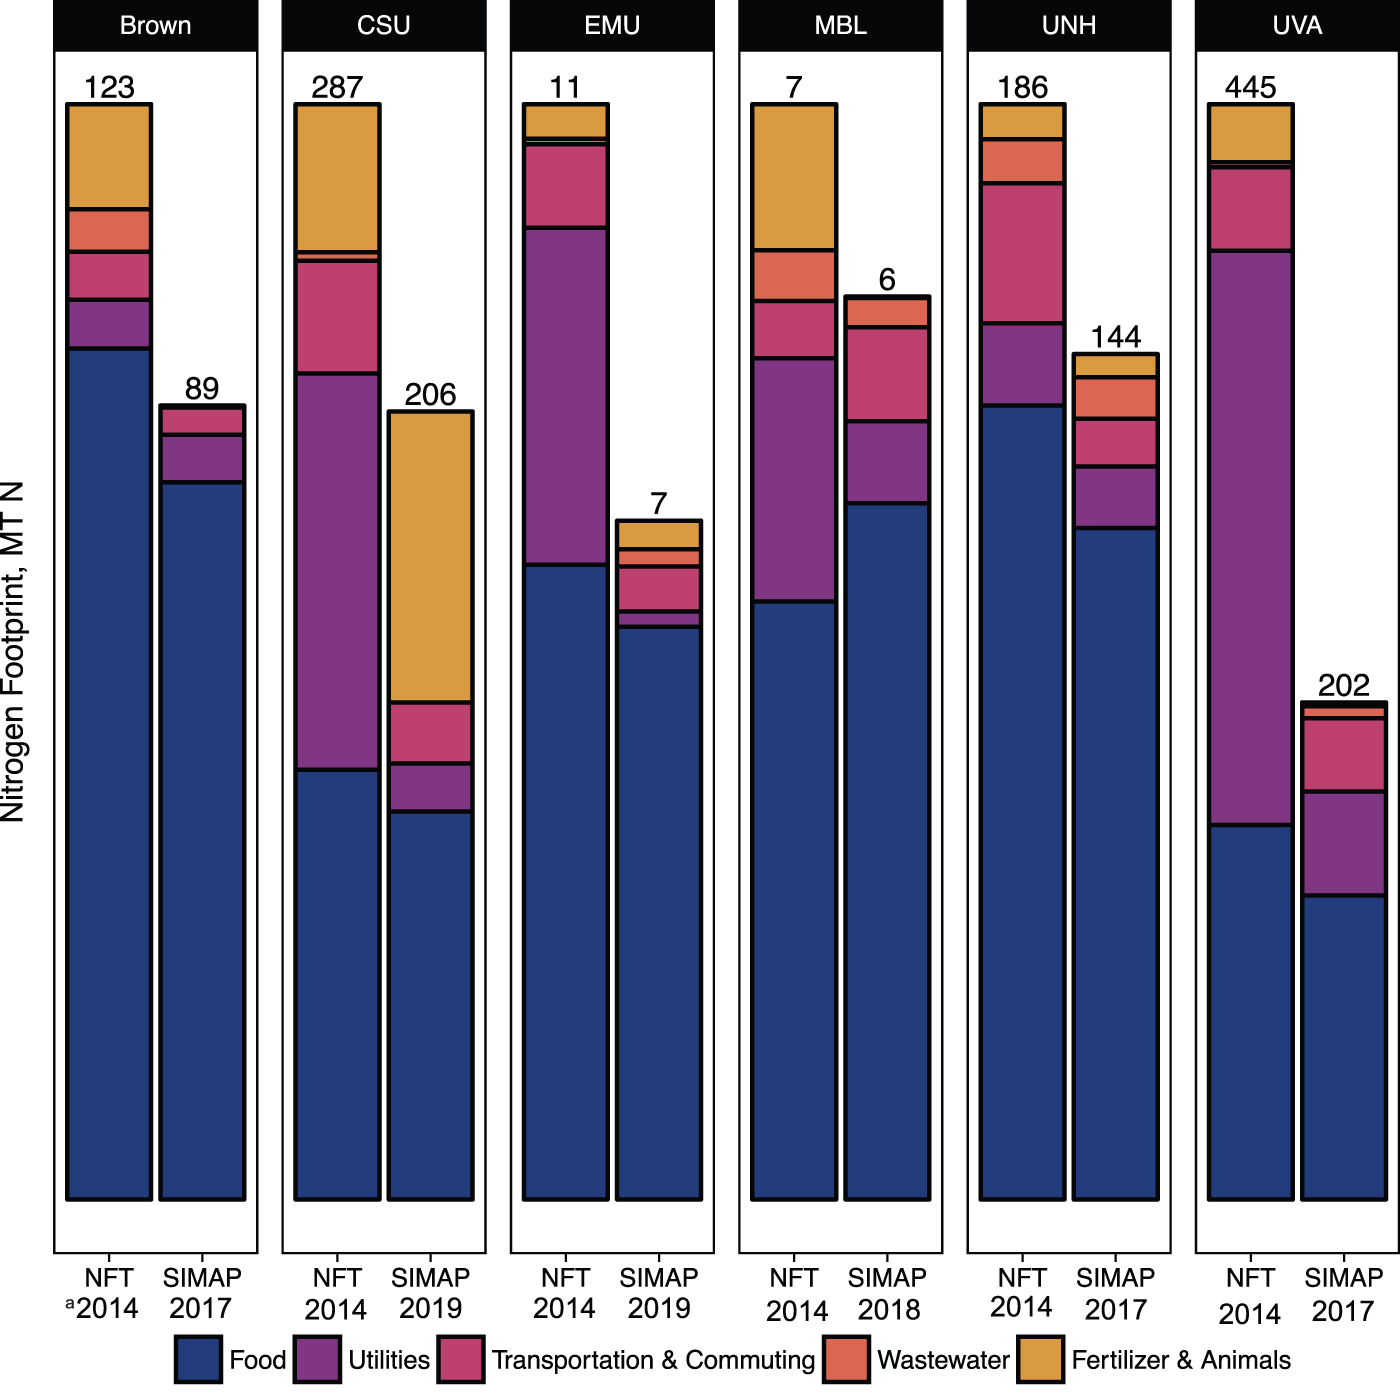
NFT and SIMAP results by source category for each institution
The N impacts of utilities were reduced in SIMAP results compared to the NFT, reflecting both the updated emission factors and actual changes in fuel type and consumption. As an example of actual changes to utility N emissions, utility providers track, report, and update emissions factors annually, reflecting the fuel mix of their generation. As utilities decrease the use of coal, both C and N emissions are declining in parallel. Therefore, the N footprint of purchased electricity reflects both the quantity purchased and the regional fuel mix used to determine the emission factor.
Food remains the dominant category as a percentage of the total footprints, averaging 72 percent of the total for the seven institutions (Figure 1). This was a proportional increase from the average food results in the NFT at 50 percent of the N footprint, although absolute values decreased. This result highlights how improved N footprint reporting in SIMAP continues to call attention to the importance of food within an institution's footprint.
Transportation was an aggregate category in the NFT assessment and was split into several categories in SIMAP: direct transportation and faculty, staff, and student commuting. Comparison of the aggregated travel categories in SIMAP with the NFT transportation category showed only small changes for each of the institutions, indicating that these calculations remained relatively consistent across the platforms. SIMAP added the categories directly financed air travel, other directly financed travel, and study abroad air travel to the N footprint. Almost all of the six institutions in this assessment included financed travel or study abroad travel to their N footprints in SIMAP, but these categories were small additions (less than 1 MT N and less than 1 percent of the total footprint).
The novel methodology for the wastewater category in SIMAP makes the results difficult to compare with the closest NFT analogue, which is the food consumption category. The NFT food consumption category calculates emissions based on the amount of food purchased and consumed on campus and applied wastewater treatment factors, while the SIMAP wastewater category calculation uses the volume of wastewater treated. However, the N footprint results from the NFT for food consumption and those from SIMAP for wastewater were remarkably similar.
In the NFT results, the research animals category was a significant emissions source for MBL, Brown, CSU, and UVA. In the NFT calculation, fertilizer use and research animal categories were separated, and the research animals footprint included N emissions caused by feed production. The fertilizer and animals category in SIMAP was a large component for the CSU N footprint because the system bounds represented by SIMAP were broader than those used for the NFT calculation: in the SIMAP calculation, CSU added fertilizer used on crops and included standing stock of animals and livestock waste. In SIMAP, the animals category is constrained because it only captures direct, scope 1 animal emissions and no longer captures the N emissions from the production of feed for research animals (scope 3).
The most drastic changes reflected in the comparison of N footprint results from the NFT and SIMAP were the result of actual changes in N emissions, updated emission factors, and updates to the categorization and inclusion of certain source data. The SIMAP N footprint results continue to highlight the proportional importance of food in an institution's N footprint while showing more granular results for the other categories.
Discussion
Transitioning from NFT-Excel to SIMAP
The six institutions in this study provided feedback over the course of the transition from the Excel-based NFT to web-based SIMAP platform to inform how each of them were impacted by the changes. Some institutions had changed their data collection and calculation processes. For institutions using SIMAP to calculate both their C and N footprints, the new platform eliminated duplicate efforts to collect data and reduced the potential for errors made in entering data separately. The SIMAP platform allows multiple users to access and adjust data simultaneously, a very important feature for most institutions where students, staff, and faculty are all gathering and managing datasets for C and N footprints. The six identified institutions found the ability to visualize the robust datasets in a web-based platform to be essential to sustainability action within their institutions.
Having a shared platform allows for stakeholders to access and understand the N footprint. The platform's features have enabled more research efforts and student involvement to become a part of the N footprint tracking process. Overall, the tracking process has become clearer and more streamlined using the SIMAP guidelines and platform. In aggregate, these improved features in SIMAP have enabled institutions to set and easily track N footprint reduction goals.
While transitioning to the SIMAP platform has helped many institutions to feel more confident about their footprint calculation, at the same time, these institutions agree that their footprint estimates are only as good as their data collection methods. Consistency in calculations can be achieved by defining clear system boundaries for both footprints and recording collection methods, and by standardizing internal calculations. New institutions planning to use SIMAP should keep this in mind when working to collect and enter data into the platform. Building and maintaining relationships with stakeholders such as dining service organizations and facilities management has been key in the success of footprint tracking at these institutions, as well as connecting with the SIMAP community to ask questions and share resources.
Results of N Footprint Calculations
The transition to SIMAP brought improved results for several reasons. As seen in Table 1, several emissions factors were updated to align with the C footprint. The virtual nitrogen factors (VNFs) were also updated to the most current calculations (Leach et al. 2021). VNFs represent the amount of Nr lost to the environment in the food production process and not contained in the final food product (Leach et al., 2012). Compost was added as a credit to the overall N footprint rather than embedded within the food category. The emission factor updates affected the N footprints for all institutions. The emission factors in SIMAP are reviewed annually and updated as needed, along with improvements to methodology and calculator guidelines. The ability to collaborate and the ease of use within the web-based platform have increased accuracy. The web-based platform enables estimates for inputs and goal setting. These features were lacking in the Excel-based version.
Additional changes in individual institution methodologies contributed to the evolving results for many institutions. For example, improvements in food data collection and scaling (UVA, MBL, and EMU) improved the accuracy of the calculations. Many institutions expanded their system boundaries to add new categories included in SIMAP, such as student air travel (UNH, EMU, Brown, MBL). As data collection becomes more accurate and data availability becomes more robust, footprint calculations are bound to evolve and change.
While these changes are for the better, it can be confusing for stakeholders to understand all of the factors affecting the footprint calculations. Communicating these changes to stakeholders is essential. SIMAP allows an institution to keep notes on its data collection methodologies and system bounds, a key strategy for data transparency and consistency. Emissions factors may change from year to year; they may also change to improve methodology, which will often affect the absolute footprint values of any given year.
Future of the N Footprint
All six institutions plan on continuing to track their N footprints through the SIMAP platform for future years. All institutions have found it easier to streamline the process of the data collection and entry within SIMAP, making it easier to complete tracking calculations more efficiently. For the institutions that have set or are planning to set reduction goals (UVA, CSU, Brown, EMU, UNH), the SIMAP platform is essential for tracking the effect of applied reduction measures and/or developing scenarios. MBL is currently looking to reduce the N footprint of their institution through low-cost and low-effort strategies rather than setting a goal and is utilizing SIMAP to develop and model the impact of these strategies on the institution's footprint (Messenger et al., 2021).
Using SIMAP to evaluate both C and N footprints has allowed these institutions to have a more complete picture of the environmental sustainability of their institutions. At all institutions, using the N footprint alongside the C footprint has brought attention to the importance of food. Food production is the major portion of all institutions' N footprints (Castner et al., 2017a; Leach et al., 2013), similar to both individual (Leach et al., 2012; Liang et al., 2016; Shibata et al., 2014) and community N footprints (Dukes et al., 2020). By tracking food purchases, sustainability offices, faculty, staff, and students were in contact with dining offices, sharing data, and in some cases, suggesting ways to reduce the N and C footprints of dining.
SIMAP has facilitated the collaboration among institutions' tracking N by creating a Nitrogen Working Group of SIMAP, which expanded on the NFT Network, facilitating discussions about both calculation and communication of the N footprint. Future integration of indicators will continue to improve the effectiveness of strategies to reduce the environmental impact at these institutions and beyond. The SIMAP platform is a foundation for institutions to think beyond single indicators to make environmental sustainability decisions.
Conclusions
Transitioning from the NFT- Excel based tool to the integrated SIMAP platform has improved the overall user experience of the six institutions discussed in this article by providing them with the ability to track their C and N footprints in one platform. The more streamlined data tracking process, updated emissions factors, and individual institution methodology improvements have given several institutions enough confidence in their datasets to begin to set footprint reduction goals. Continuing to use the SIMAP platform to track footprints could help these and other institutions to address environmental concerns and meet sustainability goals.
This study provides one of the first analyses of institution N footprints calculated using the SIMAP platform. Analysis of the results shows that the breadth of updates to the N footprint methodology aligns with the C footprint. In the future, other footprints such as phosphorous, water, and the ecological footprint could be added to the SIMAP platform using a similar process to align the footprint methodologies. As SIMAP users continue to utilize the N footprint capabilities, more institutions can be added to this analysis to strengthen the diversity of institutions included. These institutions can use the SIMAP platform to calculate their footprints and further collaborate by joining working groups to learn from each other and make substantial steps forward in the reduction of N pollution.
Footnotes
Funding Information
The work of the Nitrogen Footprint Tool Network was supported by Cooperative Agreement No. 83563201 awarded by the US Environmental Protection Agency.
Author Disclosure Statement
No competing financial interests exist.