
Abstract
Background:
Noninvasive ventilation (NIV) is a primary treatment for patients with acute hypercapnic respiratory failure. Mask choice is fundamental in the success of NIV. Mask design can influence the fit, comfort, and venting of the instrumental dead space. A new mask has been designed to reduce effect of anatomical dead space by washing out the airway of expired gases at end expiration. The aim of this investigation was to use computational fluid mechanics to model upper airway washout with different NIV mask designs.
Methods:
A 3D-printed head that represents the face and upper airways was used to construct 3D air space maps to be analyzed by computer simulation software when an individual is using each mask design. The 3D-printed head was mounted on a desktop lung simulator, measuring air flow and pressure at the mask and at the tracheal level during noninvasive therapies. Computational fluid dynamics was used to simulate air flow and CO2 distribution within the airway geometry and used to predict the impact of mask design on CO2 distribution within the upper airways.
Results:
The models predict distributions of CO2 through the upper airway geometry and show that because of the washout of expired gas in the nasal cavity, the novel mask improved CO2 concentrations at end expiration compared with conventional NIV. In simulations where the mouth and nasopharynx were both open, a 44% decrease in CO2 in the nasal cavities and a 28% decrease in CO2 over the entire upper airway geometry was predicted to result from this washout.
Conclusions:
Mask design can influence CO2 clearance in the upper airway. NIV with airway washout resulted in more CO2 clearance from the airway compared with a conventional NIV mask. Improved CO2 clearance may facilitate improved alveolar ventilation and subsequent gas exchange.
Introduction
Noninvasive ventilation (NIV) is an evidence-based treatment for patients with acute hypercapnic respiratory failure. 1 NIV aims to improve gas exchange, reduce the work of breathing, and has been demonstrated to reduce endotracheal intubation, stay, and in-hospital mortality. 2 Despite its efficacy, NIV failure is common, which leads to escalation in support and invasive mechanical ventilation. 3 Reasons for failure are multifactorial, including disease severity, associated comorbidities, timing of therapy, 3 ventilator settings, and interface choice. Interface choice is an easily modifiable risk factor that plays an important role in both tolerance and efficacy of NIV therapy. 4 Poor interface choice can result in leaks, 5 claustrophobia, 6 and pressure injury. 7
To improve the tolerance of NIV, interface manufacturers have focused on mask comfort. Introducing technology in the silicone seal to allow interfaces to better conform to the patient's face, changing the mask frame to reduce the overall size profile of the mask on the face and improved venting to reduce instrumental dead space. 8 However, none of these NIV technology solutions have considered anatomical dead space during NIV and the impact on gas exchange, a primary aim of NIV therapy.
High-flow nasal cannula (HFNC) is an alternate flow-based respiratory support 9 –11 delivering heated and humidified air with or without additional oxygen via a nasal canula interface. One of the mechanisms of action of HFNC is the clearance of expired air from the anatomical dead space in the upper airway reducing rebreathing of expired gas high in CO2 and increasing alveolar ventilation. 12 –14 As a flow-based therapy, pressure support is limited to between 4.8 cm H2O and 12.2 cm H2O, which may not be sufficient for some patients. 15
This new NIV mask has been designed to deliver pressure support up to 30 cm H2O and combines flow to washout the upper airway of expired air at the end of expiration. This upper airway washout is facilitated by the seal and venting design, which encourages the gas flow in the mouth and out the nose, reducing dead space in the oral and nasal cavity in mouth breathing patients and primarily in the nasal cavity in nose breathing patients. 16
Computational fluid dynamics (CFD) is a well utilized tool to understand flow in the upper airway. 17 This technique uses computer simulations to analyze how fluids (like gases) move within a defined geometry, such as the upper airway. The physics of fluid movement is defined by mathematical equations that predict how anatomy of the upper airway and/or mask design may influence air and gas movement within the airways.
The aim of this investigation was to use CFD based on anatomically correct airways to model upper airway washout with different NIV mask designs.
Methods
A 3D-printed head, which was created in a previous study investigating flow phantoms 18 and has been used in previous simulation studies, 19 was used to define the anatomy of the upper airways and face for testing on a physical lung simulator and for the construction of a CFD model of the transport of air and CO2 in the airways. This head was derived from a computed tomography (CT) scan of a single male subject with his mouth open.
Physical testing was conducted on a lung simulator to inform CFD models of air flow in the upper airways. The relationship between air pressure and flows was investigated using an artificial lung (TestChest lung simulator, Organis, Switzerland), which reflects human respiratory function in normal and diseased lungs. 20 –23 The artificial lung software was under respiratory system resistance and compliance parameters that reflect a lung with COPD. The head and airway derived from CT were 3D-printed using stereolithography with VisiJet SL Clear. This 3D-printed head and airway were attached to the artificial lung to provide a realistic upper airway resistance. The masks being tested were fitted to the 3D-printed head with anatomical airway to simulate normal wear. The model was ventilated with a ventilator (V60, Phillips, Pittsburgh, USA) set to an expiratory positive airway pressure of 7 and an inspiratory positive airway pressure of 12. Two masks were tested: a conventional NIV mask (F&P Visairo, RT077, Fisher & Paykel Healthcare, Auckland, New Zealand) and an NIV mask with airway washout (NIV with AW, F&P OptiNIV, ONIV117, Fisher & Paykel Healthcare, New Zealand). The masks only differ in the seal and venting design (Fig. 1). At 10 cm H2O, the venting flow was ∼20 L/min more in the mask with airway washout to help facilitate washout of the upper airway.
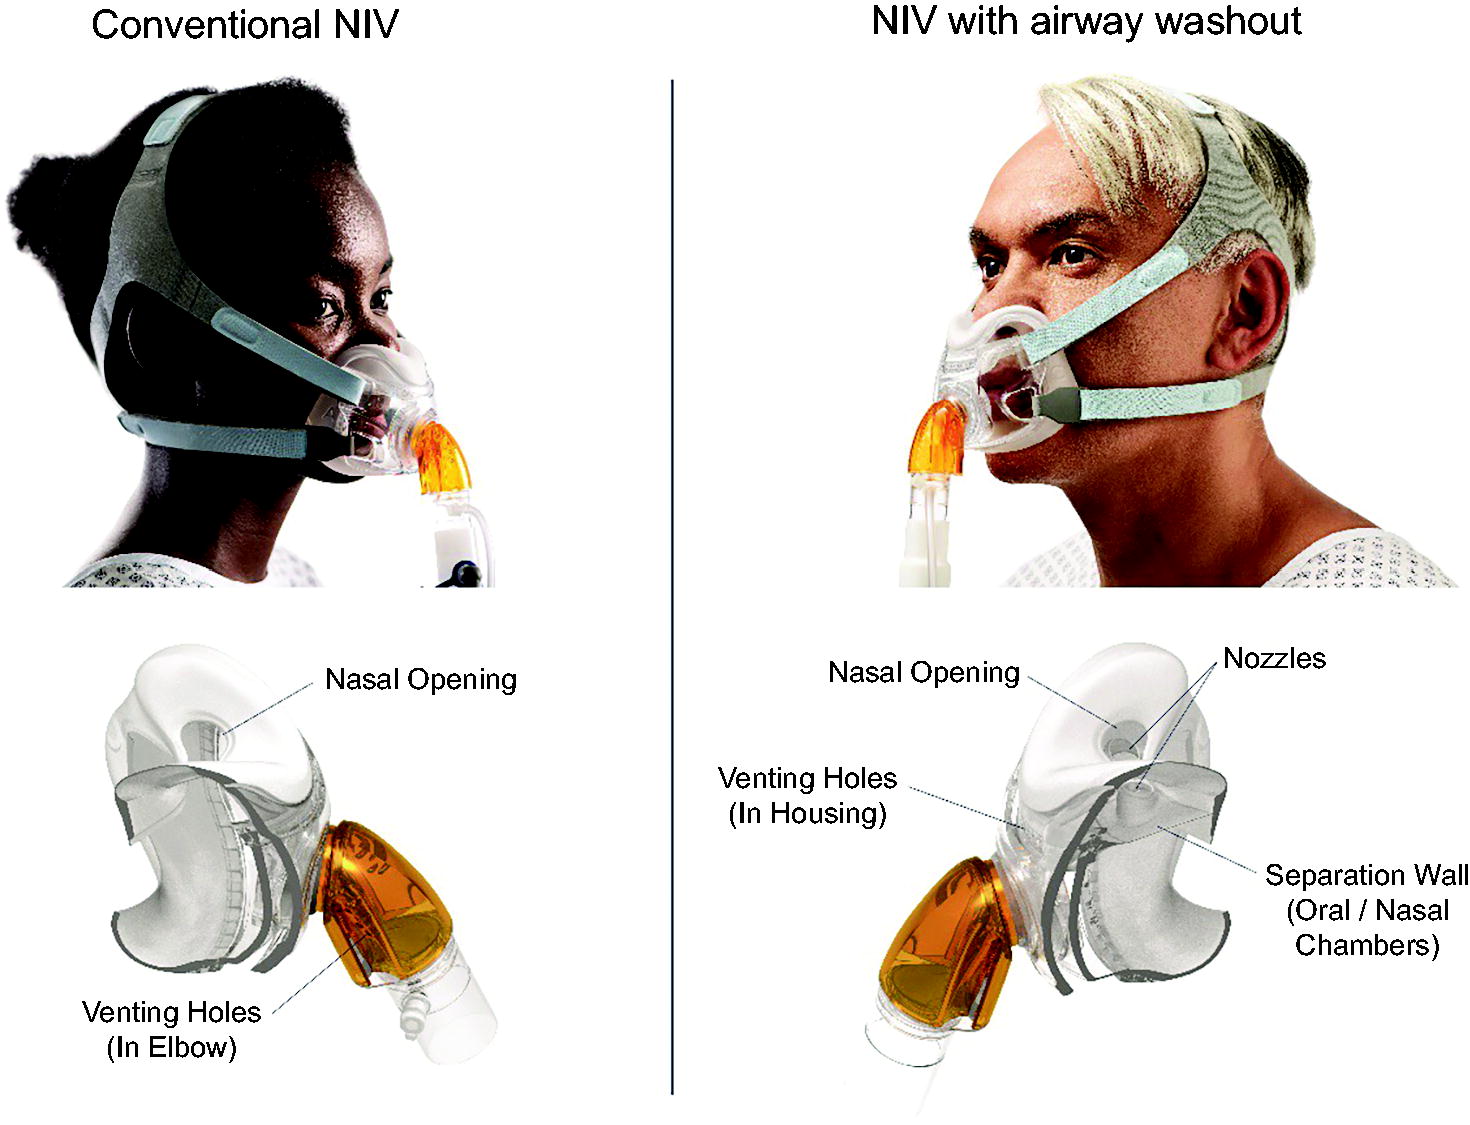
Conventional NIV mask (F&P Visairv, RT077, Fisher & Paykel Healthcare, New Zealand) and a NIV mask with airway washout (NIV with AW, F&P OptiNIV, ONIV117, Fisher & Paykel Healthcare, New Zealand). The masks only differ in the seal and venting design. NIV, noninvasive ventilation.
A flow meter (TSI4040, TSI incorporated, USA) and pressure transducer (Alicat, Scientific Inc, USA) were placed between the ventilator and the mask inlet and at the trachea of the airway model. A respiratory profile monitor (Respironics NM3 Phillips, USA) with CO2 sensor (Capnostat 5. Phillips, USA) and data acquisition box (National Instruments Corporation, USA) was used to monitor tidal volume and respiratory parameters related to the ventilated lung. A schematic of the experimental set up is provided as Supplementary Figure S1.
The artificial lung’s COPD profile was used, which included elevated airway resistance and lung conditions that prolong the final expiration. Settings for this profile were as follows: Spontaneous breathing rate 25 breaths/min, chest wall compliance 98.07 mL/cm H2O, total compliance 49.03 mL/cm H2O, airway resistance Rp50, lower inflection point 15.3 cm H2O with compliance below this at 117.68 mL/cm H2O, upper inflection point 51.0 cm H2O with compliance above this 41.19 mL/cm H2O.
The 3D printed-head and upper airway model, with each NIV mask attached, was scanned using CT (Siemens SOMATOM Definition Flash 128 Dual Source scanner, Germany) to provide a 3D map of the airways with their connection to each mask. These CT scans were segmented using ITK-snap
24
to produce a 3D map of the air spaces, including those internal to the masks and which reflect the fit of the mask to the head. These 3D air space maps were exported as surface renderings in STLl file format. These surface renderings were manipulated in Blender software (version 3.3.1, Blender Foundation) to create scenarios to simulate different breathing routes. In humans, air flow between the nasal and oral cavity is influenced by the position of the soft palate and the pressure being delivered. In the model, nasal and oral cavity was either left open or occluded by blocking either the nasal (preventing flow at the level of the soft palate) or oral cavity (closing the mouth). This resulted in geometric descriptions of the air spaces within each NIV mask, and the upper airway in the following six scenarios: Conventional NIV mask – nasal and oral cavity open; Conventional NIV mask – nasal cavity open, oral cavity blocked; Conventional NIV mask – nasal cavity blocked, oral cavity open; NIV with airway washout (NIV with AW) mask – nasal and oral cavity open; NIV with AW mask – nasal cavity open, oral cavity blocked; NIV with AW mask – nasal cavity blocked, oral cavity open
Scenarios 1 and 4 (nasal and oral cavity open) match directly to the physical bench simulations conducted on the artificial lung with the 3D-printed head and upper airway model.
Finally, the air space maps were imported into ANSYS ICEM to create a computational mesh for the numerical simulations. A computational mesh describes the 3D volume of the anatomy of interest (in this case, the air spaces within the mask and airways), and provides a description of this anatomy in a form that can be interpreted by a computer simulation tool. An octree volume filling algorithm was used to create a tetrahedral volume mesh describing the positive air space relief. Smaller elements were introduced at the vents to each NIV mask to ensure an accurate description of these small features, which act as outlets to the model.
CFD was simulated using a commercial simulation software Ansys CFX5 (Ansys Inc, R1 2020) The simulations considered two components, air and CO2. Simulations were conducted by applying measured flow from the physical lung simulator (Section 2.1), as boundary conditions at the inlet to the mask apparatus, and at the trachea. A steady state model at peak inspiratory flow as conducted to assess mesh convergence with meshes of approximately 1 × 10⁶, 2 × 10⁶, and 3 × 10⁶ elements. Transient simulations were conducted over 20s of representative data, with timesteps of 0.005 s and interpolation between measured data conducted within Ansys CFX5. Transient simulations were performed initially using a range of timesteps (with 0.01 s being the largest), to assess numerical stability and temporal convergence. The solution was considered to be converged once the root mean squared residuals for mass and momentum was less than 10−4 or a maximum of 100 coefficient loops were conducted at a timestep. Air was considered to be incompressible because the velocity of air in the airways was much lower than the speed of sound. An SSG Reynolds stress turbulence model was employed with a scalable wall function and a turbulence intensity of 5% for initialization. 25,26 Air was modelled as a humidified ideal gas with dynamic viscosity of 1.8 × 10⁻⁵ kg/ms.
Inhaled air was assumed to contain 0.04% CO2 and expired air was assumed to contain 5.3% CO2.19 Inhaled gas temperature was assumed to be 31°C and exhaled gas temperature 37°C, which showed only small thermal effects in simulations, consistent with prior modelling. 27 Fluid velocity magnitude (and direction perpendicular to the inlet/outlet) was prescribed at the trachea and the inlet to the mask tubing, based on measured values from the desktop simulator as a time varying function. This allowed driving pressure predicted by the CFD model to be verified against measured air pressures at similar locations. Outlet boundary conditions were applied at the vents in the masks, with atmospheric pressure conditions outside the mask. Pressure was initialized to 1 atm, CO2 (fresh air content) was initialized to 0.04%, and velocity was initialized to zero, through the whole geometry. An initialization procedure was applied such that inlet and thorax flow velocities were increased linearly from zero to their end-expiratory values prior to initiating simulations of breathing cycles. At least five breathing cycles were simulated, with confirmation that the model had reached a between breath steady state determined by comparing end-inspiratory and end-expiratory simulations in subsequent breaths.
Results
The pressure differential between the mask’s inlet and the trachea measured with the test chest set up was compared with the predicted pressure differential (mouth minus trachea pressure) of the model during both peak inspiration and peak expiration.
During peak inspiration, the pressure is higher at the masks than at the trachea. The pressure differential was highly variable, measuring between 0.51–1.53 cm H2O consistently in both masks. The predicted pressure differentials at peak inspiration were 1.13 cm H2O and 0.524 cm H2O in the NIV with AW and conventional NIV masks, respectively.
For the NIV with AW mask, the peak expiratory pressure at the mask was lower than that at the trachea. The measured pressure differential was 0.51–1.02 cm H2O, which compares with a predicted difference of 0.489 cm H2O. For the Visairo mask, the measured pressure differential ranged from 0–0.2 cm H2O, with a slightly higher pressure at the mask inlet than the trachea. This compares with a predicted pressure differential of 0.071 cm H2O.
As verification that predicted pressure profiles show values within the expected range during inspiration and expiration, an example of NIV with AW mask inlet pressure is provided as Supplementary Figure S2. Measured pressures show a progressive decrease over expiration, which in simulated pressure profiles, driven by a relatively constant flow difference between mask and trachea, was relatively constant. However, despite this difference, the overall resistance of the system was consistent between predicted and measured states, indicating an adequate comparison between predicted and measured behaviors.
Figure 2 shows end-expiratory CO2 profiles through the upper airway and through a cross-section of the nasal cavity with the conventional NIV mask and NIV with AW mask with the oral and nasal cavity open. With the NIV with AW mask, there was continuous flow through the mouth and nasal cavity during expiration, increasing CO2 washout compared with the conventional NIV mask, where CO2 washout did not occur in the upper airway.
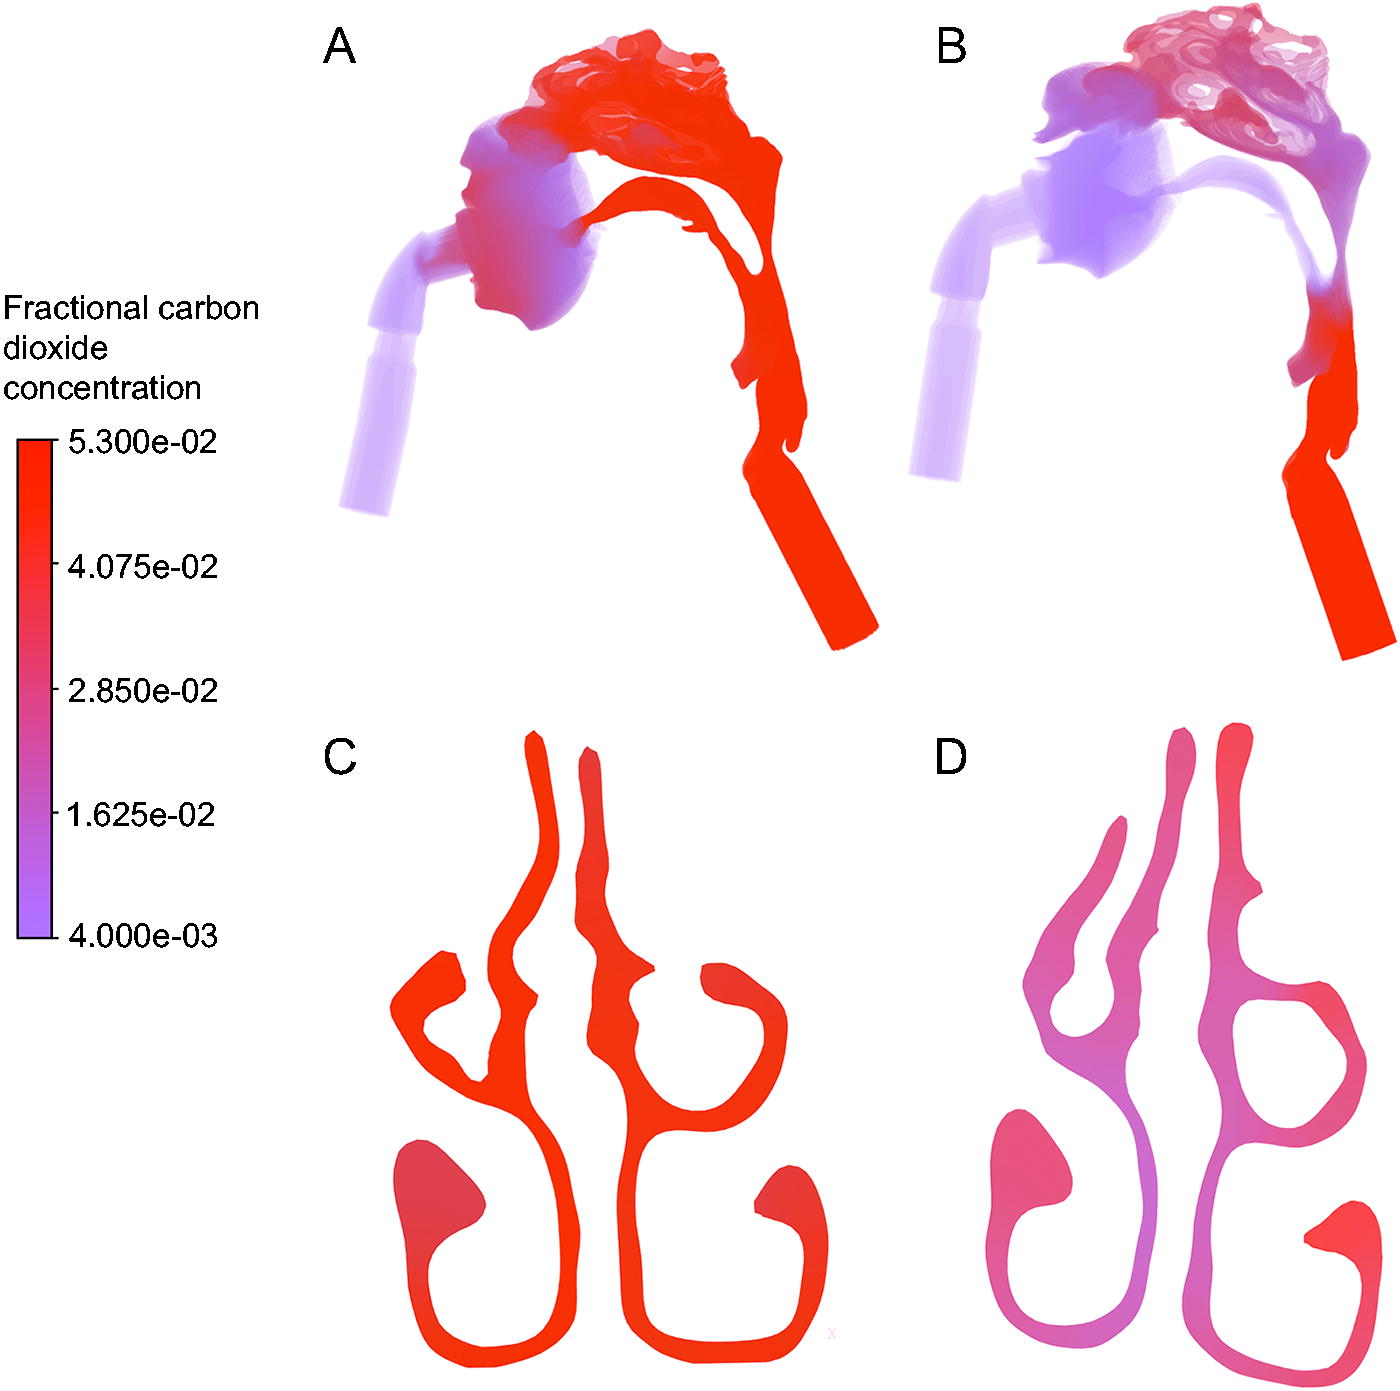
Fractional CO2 profiles in simulated geometries at the end of expiration. CO2 over the whole geometry is shown for
Mean CO2 concentration was calculated over the nasal cavity at end expiration by including the volume of these cavities within a 3D sphere, centered at the apex of the model geometry and with a radius of 4.6 cm. Figure 3 shows the mean fraction of CO2 rich expired air in this volume, except in simulations in which the nasal cavity was closed (where flushing of the nasal cavity does not occur). This fraction reflects that at the end of expiration 90% of the air in the nasal cavities was exhaled (CO2 rich) air when using the conventional NIV mask (visualised in Fig. 2C), compared to 46% using the NIV with AW mask (visualised in Fig. 2D). Increased washout of CO2 in the NIV with AW mask therefore persists even when the mouth is closed, as quantified in Figure 3. Distributions of CO2 within the nasal cavity show clear differences between masks, with increased mixing of fresh and expired air in the NIV with AW mask (provided as Supplementary Figure S3). This suggests that the NIV with AW mask promotes flushing of the upper airway and mixing of air in the nasal cavity.
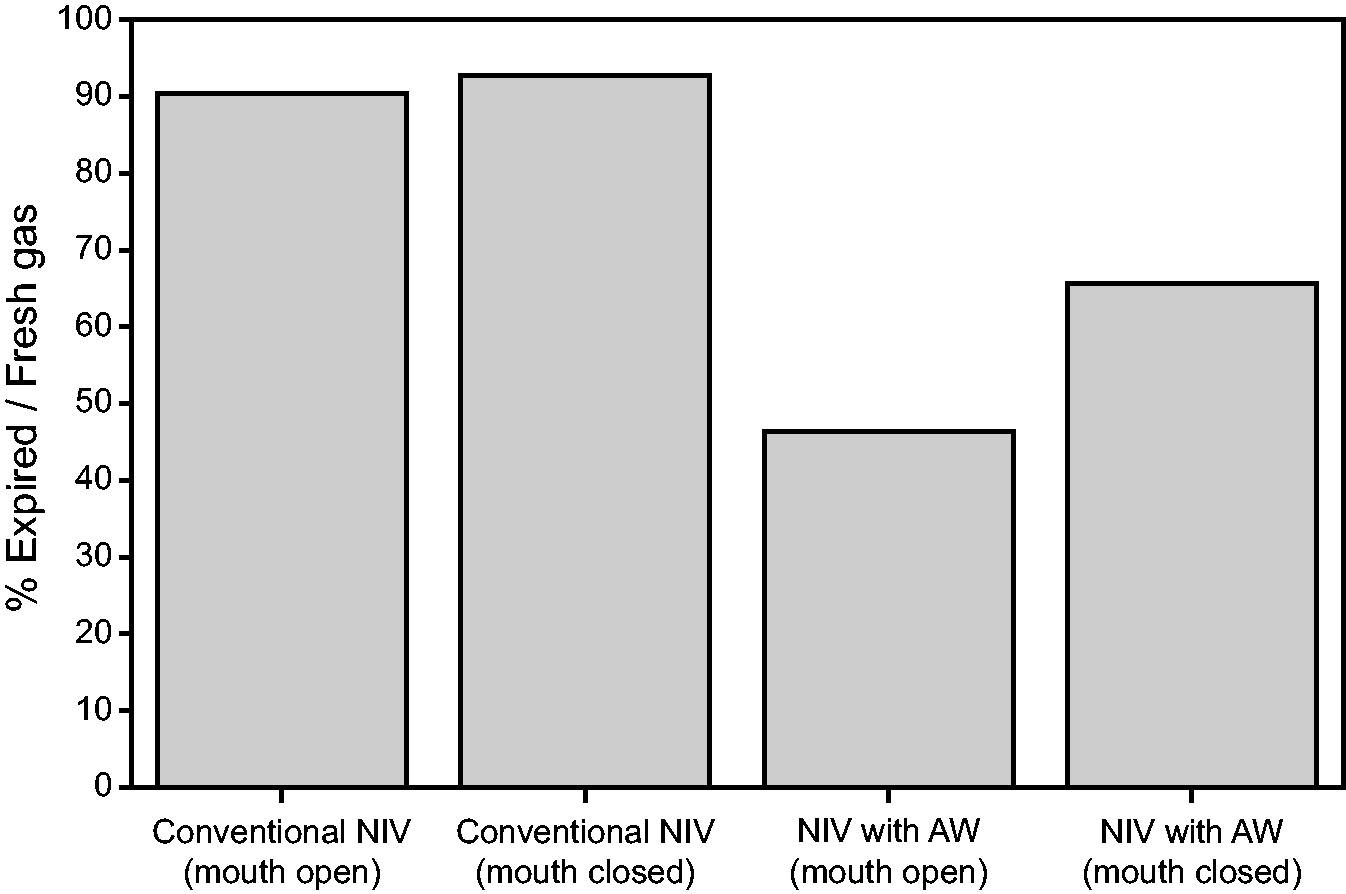
Quantification of percentage expired air compared with fresh air in the nasal cavity at end expiration in scenarios 1 (conventional NIV with oral and nasal cavity open), 2 (conventional NIV with oral cavity closed and nasal cavity open), 4 (NIV with airway washout [AW] with oral cavity and nasal cavity open), and 5 (NIV with AW with oral cavity closed and nasal cavity open).
Figure 4 shows the fraction of CO2 rich expired air in the whole airway geometry from mask swivel to the trachea for each simulated scenario at end expiration. This shows that the CO2 concentration is lower at end expiration for NIV with AW than conventional NIV in each case assessed. Although both scenarios with the nasopharynx closed (scenarios 3 [conventional NIV]) and 6 [NIV with AW]) showed CO2 washout in the nasal cavity, secondary to nasopharyngeal closure, as fresh humidified air will not be inspired unless the nasopharynx opens during inspiration.
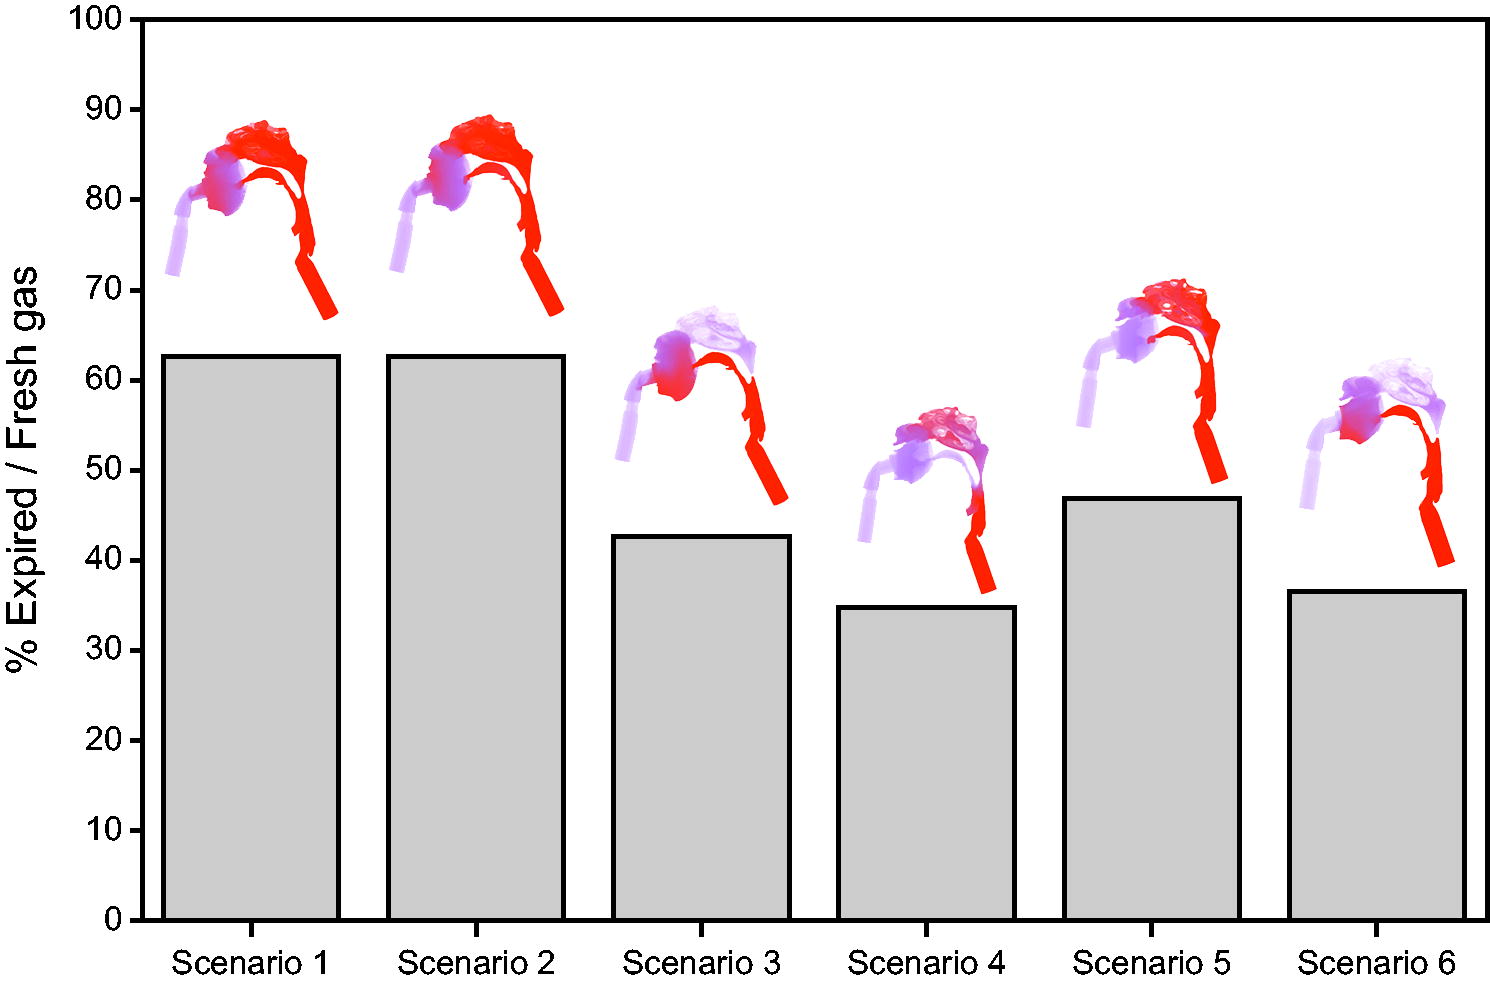
Quantification of percentage expired air compared with fresh air in the whole geometry at end expiration, with images of the geometry colored by CO2 concentration overlayed (red = expired air, purple = fresh humidified air). Conventional NIV (Scenarios 1–3) exhibits higher CO2 concentrations than NIV with airway washout (Scenarios 4–6). Scenarios 3 (conventional NIV) and 6 (NIV with airway washout) show CO2 washout in the nasal cavity; this is because nasopharynx closure and fresh humidified air will not be inspired unless the nasopharynx opens during inspiration.
Figure 5 shows the fractional CO2 concentration at the trachea over the course of inspiration (defined as the average CO2 concentration in the plane defining the trachea outlet). At the start of inspiration, the concentration of CO2 in the trachea was at the concentration of exhaled air (5.3%). However, by mid-inspiration, fresh air had reached the trachea (mixed with residual expired air present through the anatomical dead space), and by end-inspiration, primarily fresh air was inhaled. The simulations of NIV with AW mask with the oral and nasal cavities open had the lowest predicted CO2 concentrations at the trachea through the whole of inspiration. Conventional NIV with oral and nasal cavity open had the highest CO2. The CO2 concentrations mid-inspiration were higher for the NIV with AW mask than for the conventional NIV with the nasal cavity closed, but by the end of inspiration, less CO2 was contained in all NIV with AW simulations when compared with conventional NIV.
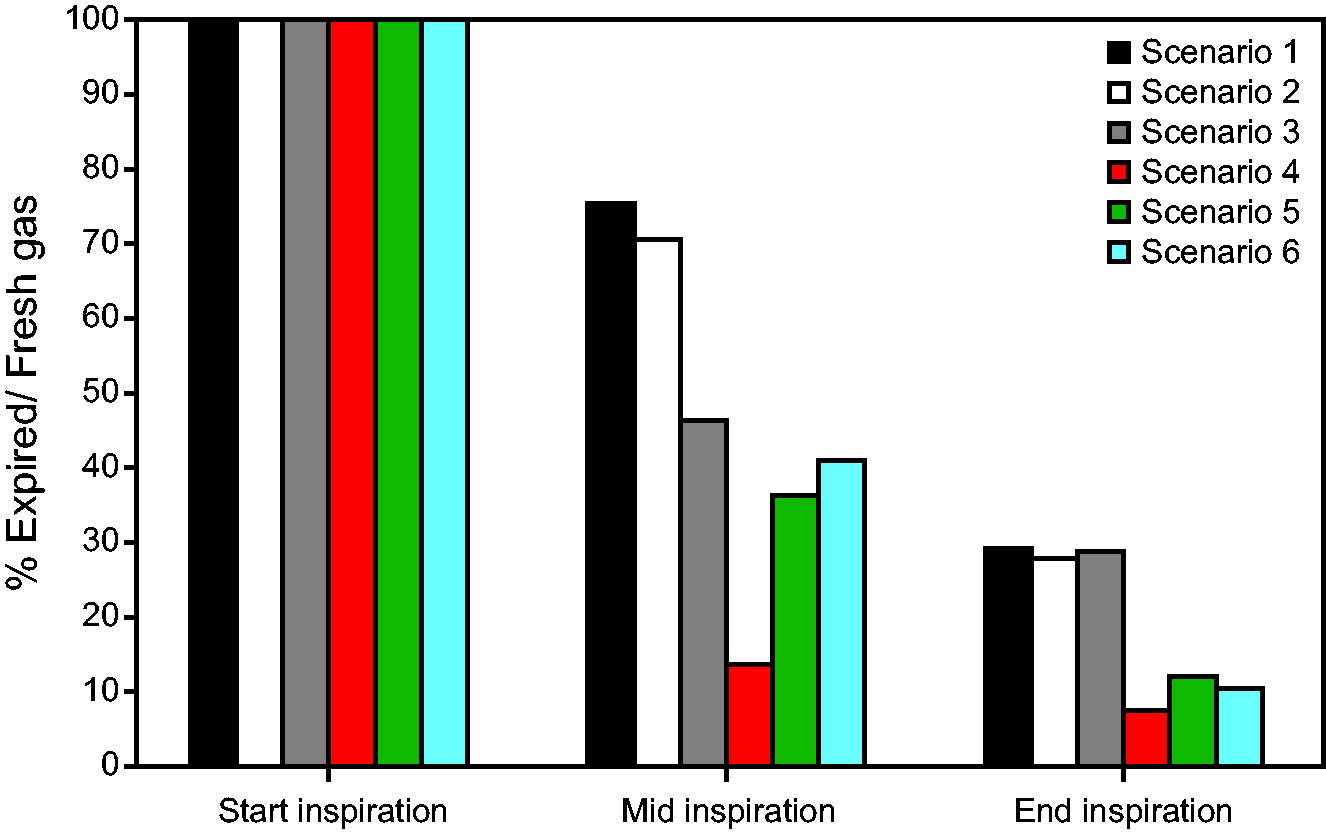
The fractional CO2 concentration at the trachea over the course of inhalation, showing start inspiration, where expired air resides at the trachea (CO2 concentration = 5.3%) in all cases, and mid-/end-inspiration as fresh air is inhaled. At the start and end of inspiration, there is a relatively uniform CO2 concentration at the trachea but there is variation at mid-inspiration. There is no overlap in the distribution of CO2 predicted at the trachea at mid- or end-expiration when comparing scenario 1 with scenario 4 (oral and nasal cavities open) or scenario 2 with scenario 5 (nasal cavity open, oral cavity closed), but scenarios 3 and 6 (nasal cavity closed, oral cavity open) are comparable at mid-inspiration.
Discussion
This study investigated the mechanisms of action of a new mask designed to deliver NIV with airway washout compared with a conventional NIV mask using CFD. We simulated air flow in an anatomically accurate upper airway. A physical model of the upper airway geometry was used to measure airway resistance, pressure, and flow with the artificial lung under conditions reflective of a COPD patient, which allowed verification of the simulated flow resistances in the same geometry.
Simulations showed that under baseline conditions with the nasal and oral cavity open, CO2 washout is facilitated by the design of the NIV with AW mask. In particular, the location of the vents and seal design in the mask encourage flow in the mouth and out the nose, washing out expired gases from the airway while providing pressure support. On the contrary, the lower placement (near the mask inlet) of vents in the conventional mask led to mixing of expired and fresh air predominantly in the mask rather than the upper airway. Overall, simulations and measurements suggested similar flow resistance in both the conventional mask and NIV with AW mask but improved CO2 washout in the NIV with AW mask. Schematics of the suggested mechanisms of CO2 washout are shown in Figure 6.
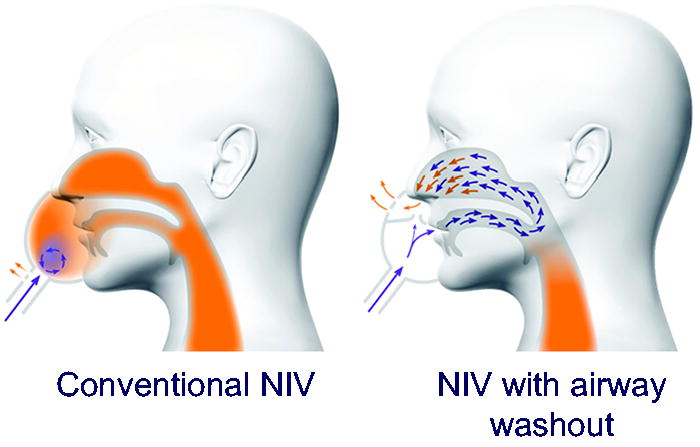
Schematics of proposed mechanisms of action between conventional NIV and NIV with airway washout (AW). The location of seals and venting in the NIV with AW mask design encourages fresh air through the oral cavity, clearing the nasal cavity of expired air reducing rebreathing of air high in CO2. In a conventional NIV mask, mixing occurs primarily in the mask.
Patients experiencing acute respiratory failure often show signs of distress, such as an abnormal breathing frequency, gasping for air, and using accessory muscles in the neck and chest to help them breathe. As ventilation improves with therapy, the patient may close their mouth. We conducted simulations to understand airway washout in all potential breathing scenarios. To facilitate CFD, we did not simulate a dynamic opening and closing of the mouth or soft palate, rather assuming that either the nasal or oral cavity was blocked through the whole breath as a worst-case scenario. In the situation that the nasal cavity was open and the oral cavity was blocked, simulating nose breathing only, the design of the NIV with AW mask still facilitated washout of expired air in the nasal cavity prior to air leaving the mask via the venting. CO2 rebreathing was reduced in the NIV with AW case compared with the conventional NIV case. When the nasal cavity was blocked and oral cavity was open, simulating mouth breathing only with a closed soft palate preventing flow into the nasal cavity, performance of the conventional NIV mask and NIV with AW mask were comparable in terms of CO2 washout, as mixing of fresh and expired air was restricted primarily to within the mask in both cases.
Anatomic dead space is a volume of air that does not participate in gas exchange, specifically the volume of air located in the upper airway, trachea, bronchi, and terminal bronchioles. Anatomic dead space results in approximately 30% of normal tidal volume being expired air rich in CO2 and low in O2 compared with ambient air. 28 NIV with airway washout aims to clear the upper airway of expired air, reducing the volume of the anatomic dead space and improving alveolar ventilation.
Other respiratory support solutions have investigated the impact of reducing anatomic dead space in patients with respiratory failure. In mechanically ventilated patients, tracheal gas insufflation (TGI) introduces fresh gas with a catheter into the endotracheal tube, resulting in turbulence at the tip of the catheter and enhanced gas mixing in the regions near the catheter tip, contributing to washing out the anatomical dead space. Clinically TGI has improved gas exchange in subjects with respiratory failure and COPD by reducing hypercapnia and arterial CO2 values. 29 –31
Similarly, HFNC delivers humidified gas up to 60 L/min through an open cannula, clearing the nasal cavity of expired air and decreasing rebreathing in a flow- and time-dependent manner. Measurements of inspired CO2 demonstrates reduction in CO2 rebreathing. 32 HFNC is the recommended first line of noninvasive respiratory support for patients with acute hypoxemic respiratory failure and is associated with a reduction in dyspnea and breathing frequency and better overall oxygenation and comfort compared with conventional oxygen therapy. 33,34 To enhance dead space clearance and pressure delivery, an asymmetric cannula has been developed. The asymmetric cannula has one small and one large nasal prong, which creates a small pressure differential between the nasal cavities and a pattern of flow from the large prong to the small prong. 35 The asymmetric design results in a reduction in minute ventilation and work of breathing with no change in PaCO2 , indicating increased ventilatory efficiency compared with conventional HFNC. 36 As a flow-based therapy, HFNC cannot deliver the same pressure support as NIV.
NIV is a standard of care for patients with hypercapnic respiratory failure, and the addition of airway washout to increase the efficiency of NIV may be useful in reducing escalation to endotracheal intubation. Patients who need aggressive CO2 management, have compromised alveolar ventilation, require lung-protective strategies, or small tidal volumes may be better managed with NIV with airway washout.
Limitations
The simulations were conducted in a single anatomic geometry, which may not be reflective of a whole population in terms of airway size and structure. In order to simulate different breathing routes, the oral or nasal cavity was blocked over the whole nasal cycle. Breathing route and the position of the soft palate would be dynamic. The impact that this would have on the model was not investigated. The head and airway model used in bench testing is derived from a CT scan of an adult male who does not have COPD. The model is a ridged smooth plastic and does not account for potential expansion and contraction, texture of human tissue, mucus or potential inflammation in a COPD patient airway. Only a single pressure setting was testing in the models, not investigating if the airway washout is modified in a flow-dependent manner. The simulations assume NIV is delivered with room air. Preliminary simulations were conducted that include humidity within a water-air mixture, as would be the case in a ventilated patient. The addition of humidity results in a small increase in the resistance in the system but does not significantly impact carbon dioxide distributions, and so was not included in this modelling. The upper airway model is derived from a CT scan of an adult male who does not have COPD. These limitations can be investigated in future studies.
Conclusions
Compared with a conventional NIV mask, the NIV with AW mask was able to washout the upper airway in the CFD model, resulting in more efficient clearance of CO2. This anatomic washout is facilitated by the seal and venting design.
Footnotes
References
Supplementary Material
Please find the following supplemental material available below.
For Open Access articles published under a Creative Commons License, all supplemental material carries the same license as the article it is associated with.
For non-Open Access articles published, all supplemental material carries a non-exclusive license, and permission requests for re-use of supplemental material or any part of supplemental material shall be sent directly to the copyright owner as specified in the copyright notice associated with the article.