
Abstract
Background:
We sought to investigate the short- and long-term effects of prone positioning (PP) on ventilation/perfusion matching in patients with ARDS using contrast-enhanced electrical impedance tomography (EIT).
Methods:
EIT measurements were performed in 18 mechanically ventilated subjects with ARDS before PP (supine position [SP]), 1 h after turning subjects to PP (PP1), 3 h after PP (PP3), 9 h after (PP9), 16 h after PP (PP16; the end of PP), and 3 h after returning to the supine position (Re-SP3).
Results:
The
Conclusions:
Oxygenation remained improved or maintained throughout the 16-h duration of PP. Ventilation is susceptible to immediate gravitational effects; however, changes in blood flow may occur later after 9 h, which supports prolonged PP treatment. The shunt continuously decreases, but no significant changes were observed for dead space.
Trial registration:
ClinicalTrials.gov, NCT04725227. Registered on January 25, 2021.
Introduction
The use of the prone positioning (PP) offers numerous physiologic benefits in patients with ARDS. 1 –6 Historically employed as rescue therapy for refractory hypoxemia, PP has become the standard of care for ARDS after the identification of survival benefits involved with this patient population. 7 –9 The definitive determination of the optimal duration for PP sessions remains elusive, with recommendations ranging from 12 to 16 h per day or more. 10,11
Recently, studies employing electrical impedance tomography (EIT) have demonstrated the impact of PP on pulmonary ventilation/perfusion matching in both “classic” ARDS and COVID-19-associated ARDS patients.
6,12
–14
In addition, previous research has shown that the ratio of arterial partial oxygen pressure to fractional concentration of inspired oxygen (
The objective of this physiological study was to further elucidate the longitudinal impact of PP on regional ventilation/perfusion matching and distribution of ventilation and perfusion over time using EIT.
QUICK LOOK
Current knowledge
Prone positioning confers significant physiological advantages in the management of ARDS, with its mortality-reducing efficacy substantiated by robust evidence from randomized controlled trials. This intervention has consequently been established as a standard therapeutic intervention for moderate-to-severe ARDS cases, as delineated in current critical care guidelines.
What this paper contributes to our knowledge
Using electrical impedance tomography, this study characterized the physiologic influence of prone position (PP) on the ventilation/perfusion matching over time in subjects with ARDS. Ventilation was susceptible to immediate gravitational effects of PP; however, changes in blood flow occurred after 9 hours of PP. Oxygenation remains improved or maintained throughout the 16-h duration of prone positioning. The shunt continuously decreases, but no significant changes are observed in dead space.
Methods
Subjects
The present prospective study was approved by the Institutional Ethics Committee of the hospital (NO. B2019-230R) and conducted in the ICU of Zhongshan Hospital, Fudan University. This study was registered on clinicaltrials.gov (NCT04725227). All patients were enrolled following written informed consent.
Mechanically ventilated patients with moderate to severe ARDS from March 2022 to December 2022 in our department were included (defined as
Study protocol
The baseline characteristics of subjects were collected upon enrollment, which included age, height, weight, assessment of Acute Physiology and Chronic Health Evaluation II (APACHE II) score at ICU admission, determination of ARDS etiology, and
Arterial blood gas (ABG) analysis results, end-tidal expiratory carbon dioxide pressure, ventilator parameters, and hemodynamic parameters including heart rate (HR), central venous pressure, and mean arterial pressure (MAP) were recorded at various time points: before PP (SP), 1 h after turning subjects to PP (PP1), 3 h after PP (PP3), 9 h after PP (PP9), 16 h after PP (PP16; the end of PP), and 3 h after returning to the supine position (Re-SP3). Subjects were deeply sedated and paralyzed under synchronized intermittent mandatory ventilation mode. The ventilator settings were standardized for all subjects during all study time points: tidal volume set between 6 mL/kg or less of predicted body weight, at a constant inspiratory flow set to 60 L/min, driving pressure maintained at 15 cm H2O or lower, and breathing frequency adjusted to maintain pH levels between 7.35 and 7.45. PEEP was titrated by EIT during decremental PEEP trial with steps of 2 cm H2O from 20 to 0 cm H2O after a lung recruitment maneuver of 40 s × 40 cm H2O continuous positive airway pressure, as previously described previously. 16 The PEEP was adjusted at six different time points.
EIT data
The EIT belt was positioned around the chest wall at the fourth or fifth intercostal space and connected to the EIT monitor (PulmoVista 500; Dräger Medical, Lübeck, Germany). Technical specifications for EIT have been previously documented.
17
The EIT signals were captured at a frame rate of 50 Hz. Following a baseline recording of EIT data for 5 min, we conducted an end-inspiratory breath-hold lasting 20 s. A bolus of 10 mL of 5% NaCl solution was manually injected via the central venous catheter at 2 s after occlusion onset. The rapid injection, completed within less than 2 s, resulted in a typical first-pass kinetics impedance dilution curve through the pulmonary circulation.
18
The analysis of EIT data was conducted using a customized software developed by MATLAB (MathWorks, Natick, MA). EIT ventilation maps were calculated by averaging the tidal variations (impedance change between expiration and inspiration) over five consecutive respiratory cycles. Based on the analysis of ventilation maps, the following parameters were calculated:
19
Pixels were categorized as nonventilated if pixel ventilation was ≤ 10% of the highest pixel-level value in the ventilation map measured in that subject. The percentage of ventilated pixels in the gravity-dependent regions of interest (ROIs) with equal heights (ROIs: ROI 1, ROI 2, ROI 3, and ROI 4 from ventral to dorsal regions), or ROI 3 + ROI 4 for the dorsal regions.
The EIT perfusion maps were generated by calculating the slope of the impedance curve after saline bolus injection, with exclusion of cardiac regions. The following parameters were calculated:
19
The relative pixel-level perfusion: the steepest (maximal) slope of the temporal EIT signal deflection during the saline bolus injection in each pixel was normalized to the overall detected signal, resulting in the calculation of relative pixel perfusion. Pixels were categorized as perfused if pixel perfusion was ≥ 10% of the highest measured pixel-level value in the perfusion map. The percentage of perfused pixels in each ROI.
By integrating the pixel-level data of ventilation and perfusion, we computed the following parameters: Dead space-EIT percentage, which represents the proportion of ventilated but nonperfused pixels to the total number of pixels that are either ventilated and/or perfused; Shunt-EIT percentage, indicating the ratio of perfused but nonventilated pixels to the total number of pixels classified as ventilated and/or perfused; Matched region percentage, denoting the percentage of pixels that are both ventilated and perfused out of the total number of pixels that are either ventilated or perfused.
Figure 1 shows the ventilation and perfusion matching images of representative patients at SP, PP3, PP9, PP16, and Re-SP3 measured using EIT.
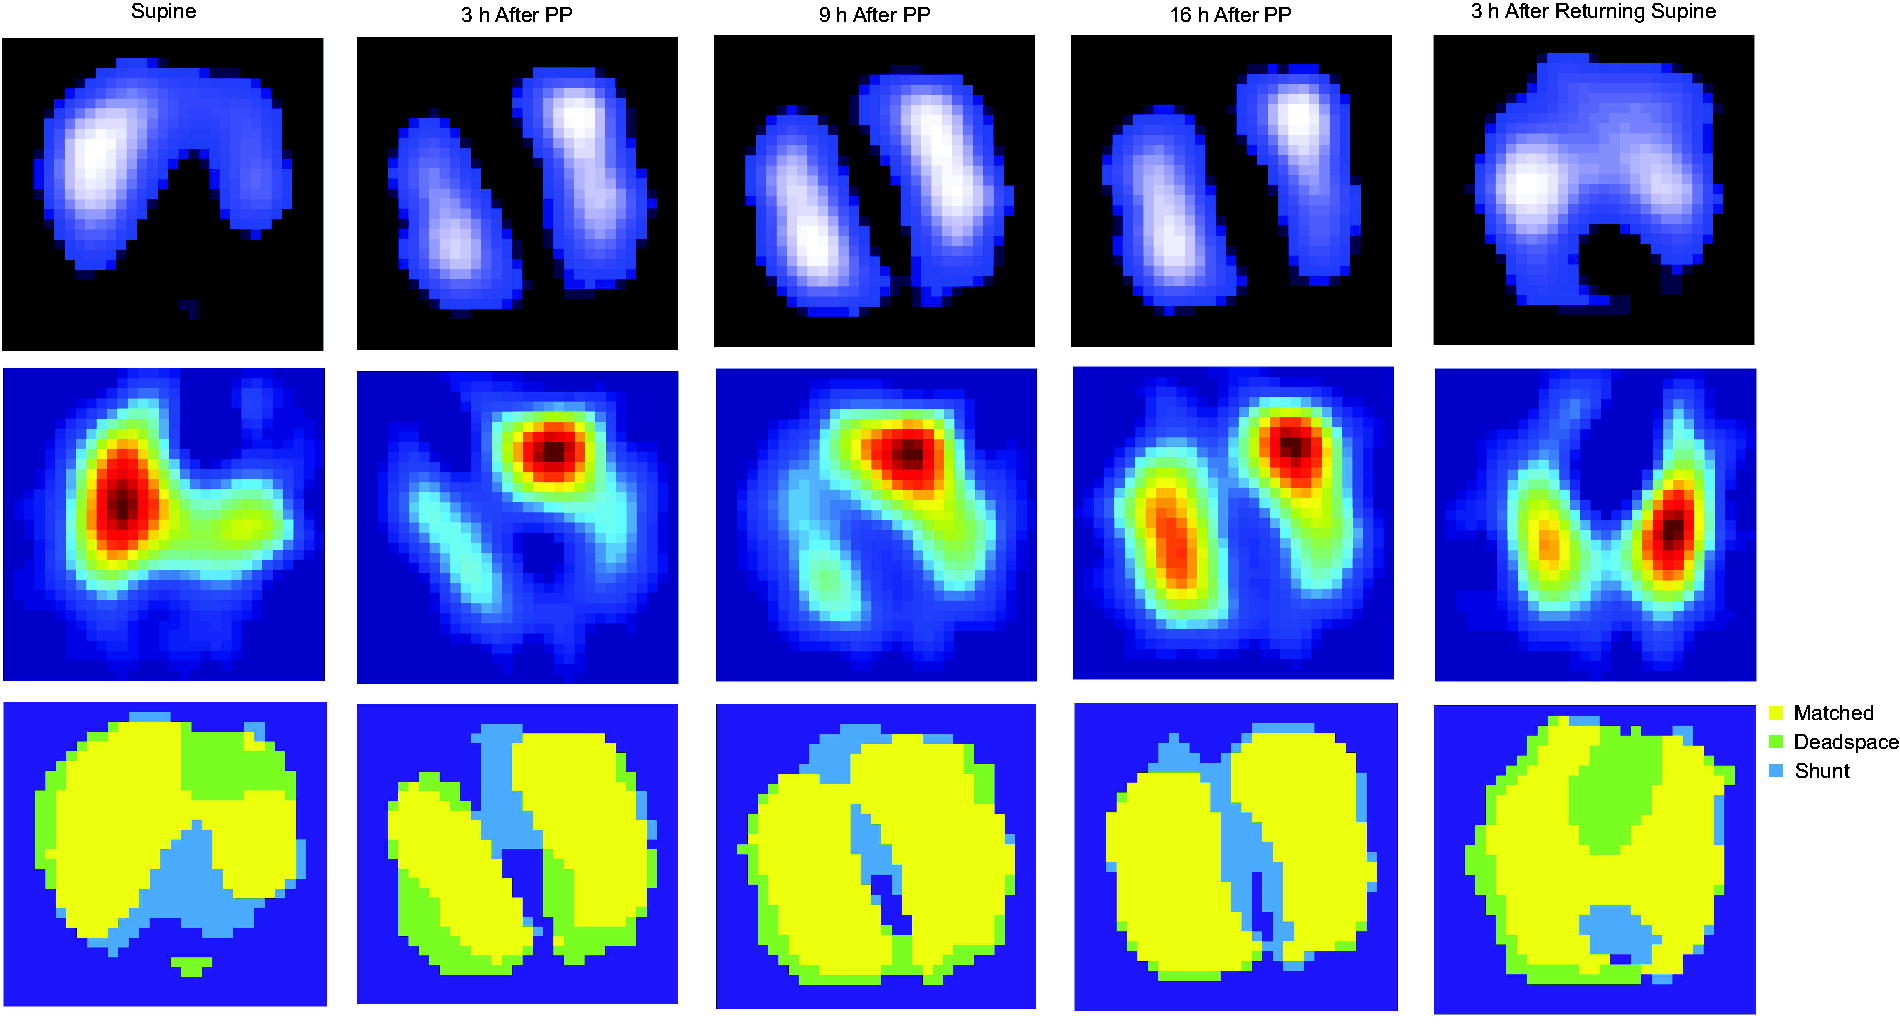
Ventilation and perfusion measured by electrical impedance tomography (EIT) in a representative subject at different time points. Top map: image of the ventilation distribution. Middle map: image of perfusion distribution. Bottom map: obtained by integrating ventilation and perfusion maps. The yellow area indicates matched units that are both ventilated and perfused, whereas blue area indicates only perfused units and the light green area indicates only ventilated units.
Statistical analysis
The sample size for this study was determined based on a pre-post repeated measures design, with an expected effect size of 1.7 derived from previous studies, 20,21 a significance level of 0.05, and a power of 0.8, resulting in a required sample size of approximately 15 participants. Considering an anticipated attrition rate of 20%, the final calculated sample size was 18. Statistical analysis was performed via SPSS 26.0 (SPSS, Chicago, Illinois) and Prism 8 (GraphPad Software, San Diego, CA). All continuous variables were subjected to the Shapiro–Wilk test for normality. Data were presented as mean ± SD if normality was met, or otherwise as median and interquartile range. To test the effect of the time points on the variables, Mauchly’s test was performed for sphericity and repeated measures ANOVA was applied with post hoc Bonferroni’s multiple comparisons. When the violation of sphericity occurred (ie, Mauchly’s test P < .05), the Greenhouse–Geisser method was used for correction. All statistical tests were two-tailed, and P < .05 was considered statistically significant.
Results
Subject characteristics
A total of 18 subjects with ARDS were included (17 males and 1 female, age 72 ± 9 years with an average body mass index [BMI] of 21.5 ± 3.3 kg/m2; Table 1). The average APACHE II score at ICU admission was 19 ± 9. Nine subjects (50%) had moderate ARDS and 9 (50%) had severe ARDS. All subjects underwent continuous PP with the average duration being 15.42 ± 1.8 h.
Subject characteristics
Data are shown as n (%), mean ± SD, or median (IQR).
APACHE II, Acute Physiology and Chronic Health Evaluation II.
Clinical parameters regarding respiratory and hemodynamic status at SP, PP1, PP3, PP9, PP16, and Re-SP3 were assessed and compared (Table 2). The
Evolution of
Effects of prone position ventilation on respiratory, gas exchange, and hemodynamics
ABG, arterial blood gas; HR, heart rate; SBP, systolic arterial blood pressure; MAP, mean arterial pressure.
CRS, respiratory system static compliance = VT/(P plat – total PEEP) from the analysis of ventilation tracings during occlusions.
VT, tidal volume; Pplat, plateau pressure.
P value by one-way analysis of variance (ANOVA) for repeated-measures.
versus SP, P < .05.
versus PP1, P < .05.
versus PP3, P < .05.
versus Re-SP3, P < .05.
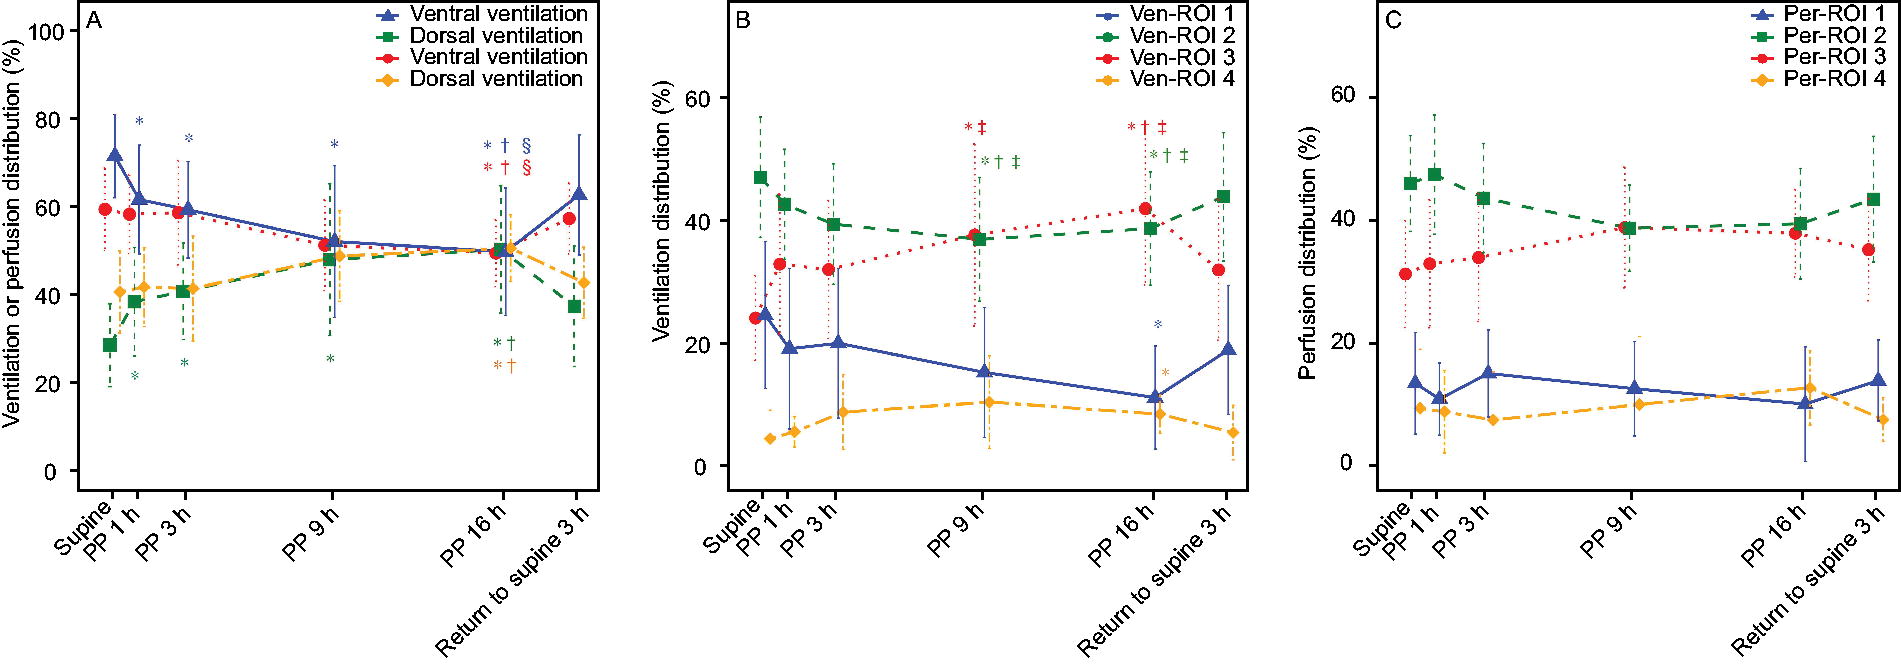
EIT-based measurements regarding lung ventilation and perfusion at the indicated time points were presented in Table S1. Compared with SP, dorsal ventilation significantly increased at PP1 (Fig. 3A), and this trend continued as the duration PP increased, with even more ventilation observed at PP16 compared with PP1. In contrast, ventral ventilation decreased significantly at PP16. Dorsal and ventral perfusion remained stable during the first 3 h of PP but started showing changes thereafter; dorsal perfusion began to increase, while ventral perfusion started decreasing from PP9 onward until reaching significance at PP16 (Fig. 3B). Similarly, the tendency was also presented on the scale of the four ROIs (Fig. 3C). Ventral ventilation and perfusion were greater at Re-SP3 compared with PP16. The perfusion distribution tended to align with the SP state, while the ventilation distribution differed from that of SP.
Comparisons of ventilation and perfusion distribution (%) in the ventral and dorsal regions
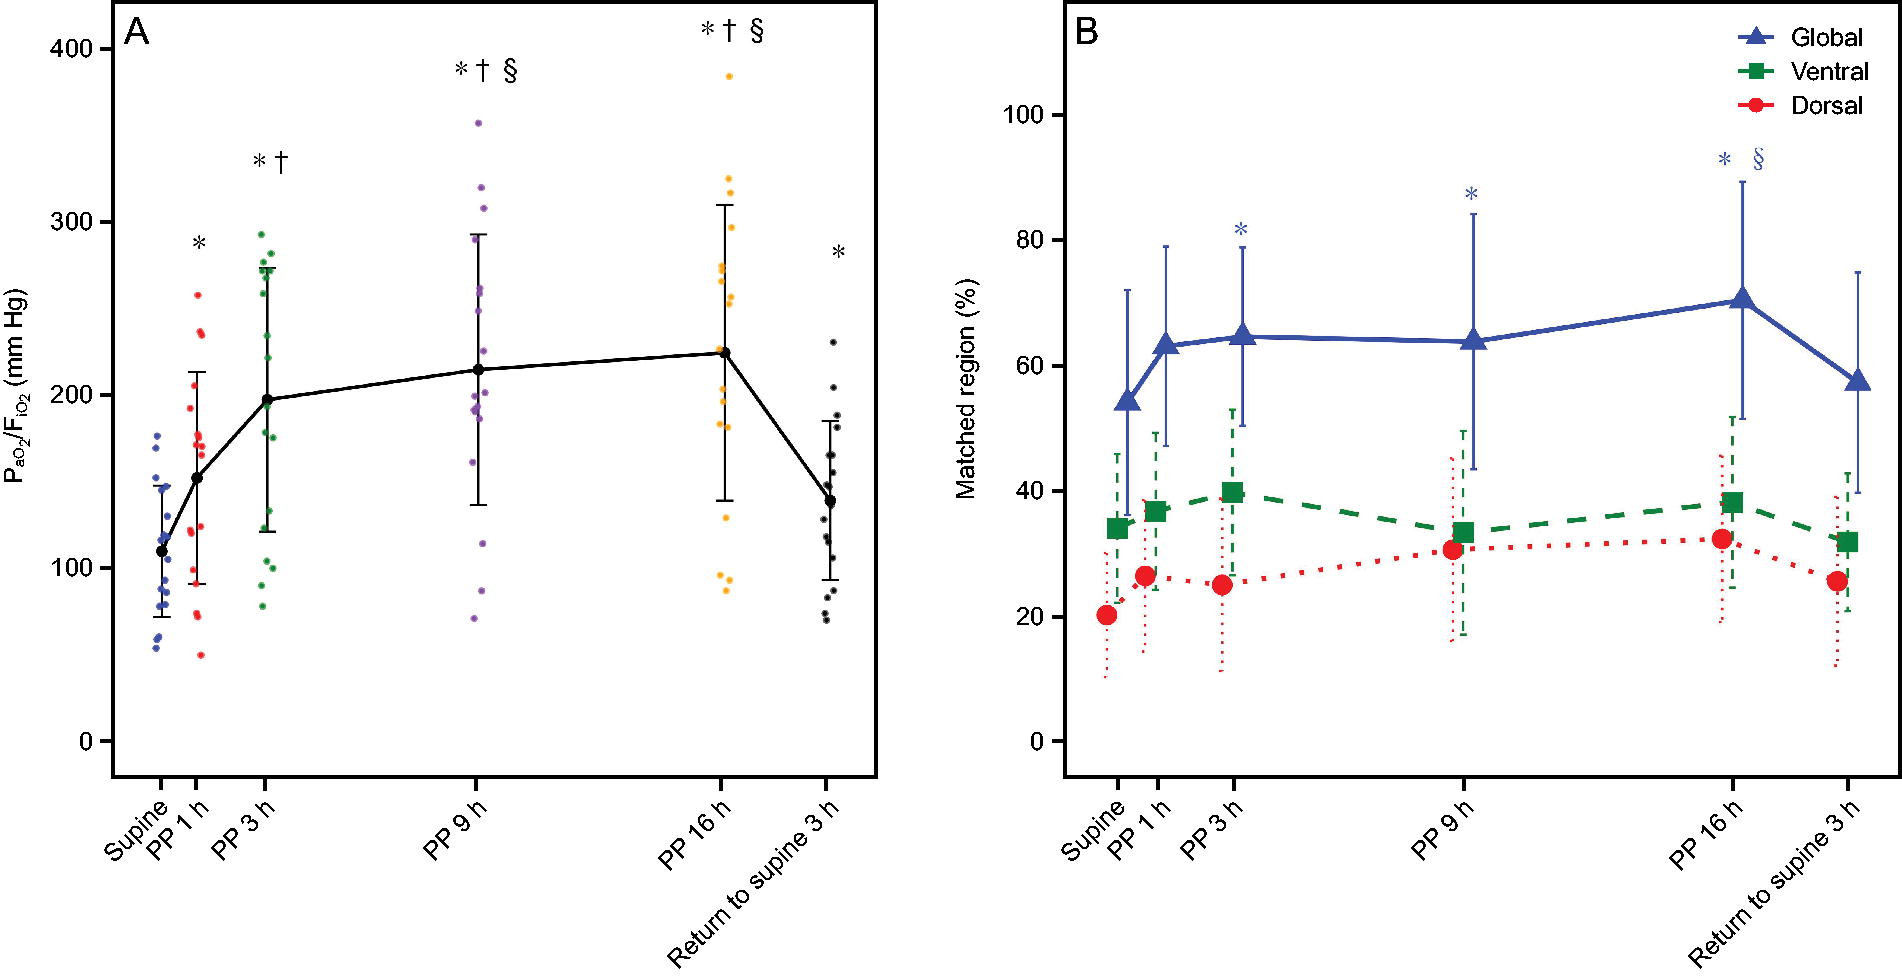
Based on EIT measurements, the global matched region percentage significantly increased with PP duration (P = .004, Fig. 2B). Similarly, there was a notable enhancement in the global matched region percentage observed at PP3 when compared with SP. Less matched region percentage was observed at Re-SP3 than at PP16 (57.33 ± 17.65 vs 70.52 ± 18.98, P = .030). Intriguingly, global Shunt-EIT percentage significantly decreased with PP duration, primarily occurring in the dorsal area (Fig. 4A). Dead Space-EIT percentage remained almost the same during PP administration (Fig. 4B). Moreover, the GI index of ventilation progressively decreased from PP1 to PP16 (P < .001, Supplementary Table S1). More detailed results regarding other subgroup analysis are presented in Supplementary Figures S3–S4.
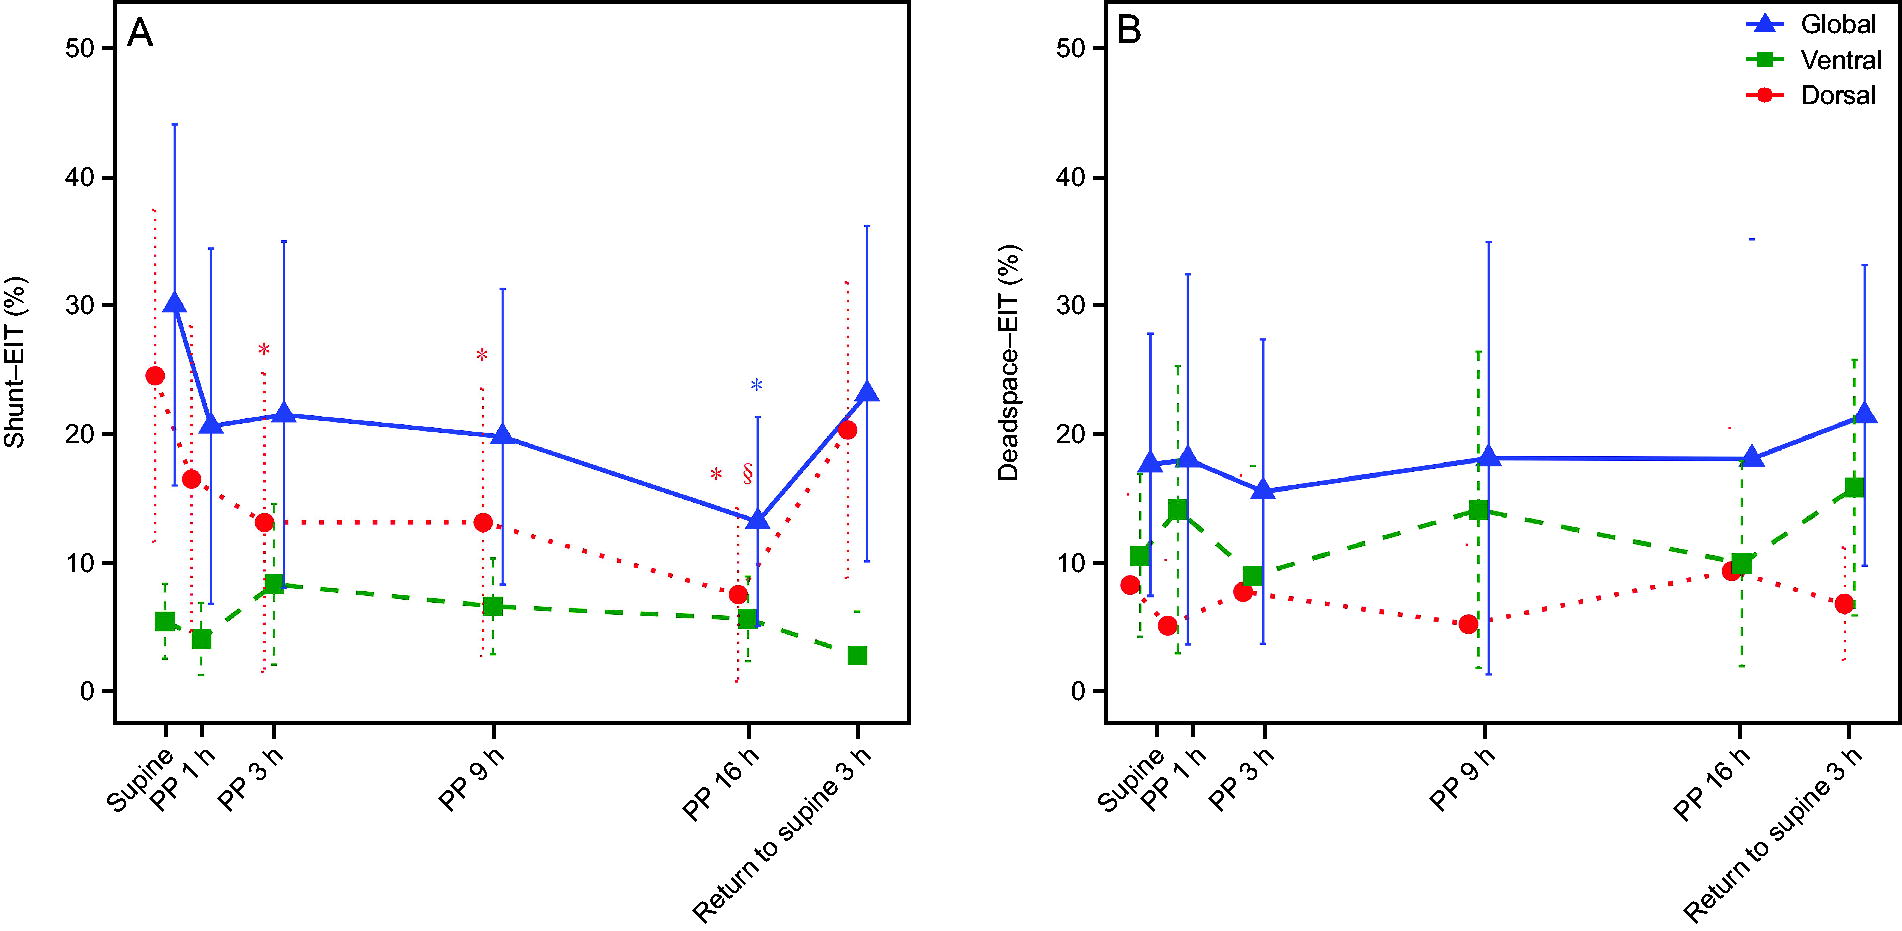
Evolution of shunt-EIT (%) and dead space-EIT (%) in the global, ventral, and dorsal regions, at SP, PP1, PP3, PP9, PP16, and return to supine 3 h (
Discussion
This study characterized the physiologic influence of prone position on the ventilation/perfusion matching over time in classical subjects with ARDS. The main findings can be summarized as follows: 1)
In this study, the transition to the prone position after 1 h resulted in immediate and significant change in pulmonary ventilation distribution. The susceptibility of lung ventilation to gravity primarily stems from the physical properties of gas. Furthermore, this gravitational or lung opening effect exhibits a temporal influence, as evidenced by persistent changes in pulmonary ventilation distribution throughout PP. By expanding underinflated or collapsed posterior airways and reducing anterior alveolar overinflation, the prone position promotes a more homogeneous distribution of ventilation. 22 –24
In contrast, factors such as the anatomical morphology of the pulmonary vascular bed and resistance predominantly affect pulmonary blood flow distribution. Mechanical compression, pressure gradient, and hypoxic constriction play important roles in determining pulmonary vascular resistance while being minimally impacted by alterations in gravity. 25 Notably, we observed alterations in blood flow at PP. Moreover, from PP9 to PP16, there was a continued increase in blood flow distribution. Although after returning to supine position after 3 h (Re-SP3), the blood flow was altered. Various factors contribute to enhanced blood flow distribution (such as alterations in diaphragm shape, changes in hypoxic pulmonary vasoconstriction, and differential nitric oxide production across lung regions), 26 –28 resulting in improved matching, less shunting, and further enhancement of oxygenation.
Matched region percentage increased constantly over time during PP, whereas the shunt-EIT percentage demonstrated a continuous decrease, particularly in the dorsal shunt region. Our data did not reveal any significant changes in dead space-EIT percentage with variations in PP, which could potentially be attributed to the approximately 6 cm H2O PEEP value we employed, and it was titrated based on EIT measurements. Perier et al reported that lung aeration improved and dorsal pulmonary perfusion remained unmodified after 3 hours of PP in COVID-19-associated ARDS. 12 In contrast, a case study found that both ventilation and perfusion changed after transition from SP to PP within 1 h in a patient with acute respiratory failure secondary to SARS-CoV-2019. 29 Another clinical study reported that pronation for 30 min resulted in decreased fraction of ventilated nonperfused units and reduced dead space/shunt ratio in ventral lung regions of patients with COVID-19-associated ARDS. 13 Previous research has demonstrated that prolonged prone ventilation increases dorsal ventilation and perfusion in the lung, which results in improved ventilation/perfusion matching and, consequently, oxygenation. 6 The efficacy of PP may vary among individuals. Therefore, it is advisable to consider utilizing the PP whenever feasible, provided that hemodynamic stability allows and there are no absolute contraindications. In addition, for awake PP, it may be meaningful to investigate changes in blood flow influenced by spontaneous breathing and determine the optimal timing for adopting this position.
In the moderate ARDS group, early oxygenation improved significantly in the prone position, but this improvement leveled off in the middle and late stages (Figure S3). In severe ARDS, the PF ratio gradually improved with longer PP, possibly due to further increases in matching areas during the later stages. In the low recruitability group, PF continued to improve noticeably during PP, whereas in the high recruitability group, PF showed little improvement in the middle and late stages (Figure S4). This may be because shunt changes were significant in the early prone phase for the high-recruitability group but became less noticeable over time. These changes are related to the underlying pathophysiology of ARDS. Different PP strategies may be appropriate for different patient subgroups. For example, in moderate ARDS or highly recruitable ARDS, reducing the duration of PP may help lower the risk of complications, such as pressure ulcers. In contrast, patients with low recruitability or severe ARDS may require prolonged PP. Further studies are needed to explore these strategies.
We acknowledge some limitations of the study. First, the single-center study was conducted on a limited number of subjects in 10 months, which restricts the generalizability of the findings. Second, there were fewer female participants than male participants, which may have led to a reporting bias. Third, ventilator parameters were adjusted between time points according to clinical requirements, which may be a confounding factor, but they are consistent with lung-protective ventilation strategies. Fourth, although the EIT assessment was conducted at the six indicated time points, including during SP, PP, and after resupination, it failed to fully capture the longitudinal effects of PP, as the assessment missed the 12-h mark post-PP. Fifthly, EIT measures only a fraction of lung function by projecting the three-dimensional distribution of ventilation/perfusion onto a two-dimensional image, thereby limiting its ability to assess the entire spectrum of ventilation/perfusion matching in the lung. 30 Moreover, cardiac output was not measured in these subjects. The potential impact of PP on cardiac output may influence oxygenation and ventilation/perfusion matching. Further work with EIT may help clinicians to understand better the physiologic features of PP and the optimize clinical use of the technique.
Conclusions
Oxygenation remained improved or maintained throughout the 16-h duration of PP. In the prone position, ventilation is susceptible to immediate gravitational effects; however, changes in blood flow may occur from PP9 to PP16, which also provides some support for prolonged periods in this position. The shunt continuously decreased, but no significant changes were observed in dead space. It is possible that EIT titrated the PEEP setting, resulting in low overexpansion and minimal dead space.
Footnotes
Acknowledgments
The authors thank all the subjects for their participation in this study.
Author Disclosure Statement
The authors have no potential conflicts of interest to declare.
Research data were previously presented by Yuxian Wang at the American Association for Respiratory Care Congress 2023 on November 7, 2023, in Nashville, Tennessee, United States.
Funding Information
This research was supported by Open Project of State Key Laboratory of Respiratory Disease (SKLRD-OP-202321), Shanghai Municipal Health Commission Fund (GWVI-11.1-14), Shanghai Committee of Science and Technology (No. 21MC1930400), Shanghai Health Commission Clinical Research Project (202240334), Shanghai Key Laboratory of Lung Inflammation and Injury and Youth Fund of Zhongshan Hospital, Fudan University (No. 2024ZSQN48).
The study was performed in the intensive care unit of Zhongshan Hospital, Fudan University, Shanghai, China.
Supplementary Materials
Supplementary Figure S1
Supplementary Figure S2
Supplementary Figure S3
Supplementary Figure S4
Supplementary Table S1
References
Supplementary Material
Please find the following supplemental material available below.
For Open Access articles published under a Creative Commons License, all supplemental material carries the same license as the article it is associated with.
For non-Open Access articles published, all supplemental material carries a non-exclusive license, and permission requests for re-use of supplemental material or any part of supplemental material shall be sent directly to the copyright owner as specified in the copyright notice associated with the article.