
Abstract
Background:
Mechanical power (MP) is useful for predicting the outcomes of attempts to liberate patients from mechanical ventilation. MP is computed based on measured variables derived to determine the power in joules required to breathe while receiving mechanical ventilation. The main objectives of this study were to calculate a cutoff value of MP that would predict successful liberation and to determine the prediction rate of liberation success based on this cutoff value.
Methods:
This was a single-center retrospective study. Data from 110 tracheostomized subjects receiving mechanical ventilation were analyzed. We divided subjects into two groups based on ventilator liberation outcome. Confounding factors in subject background were adjusted using propensity score matching (PSM). Statistically significant differences in MP at tracheostomy and liberation success between liberation success and failure groups were examined. We calculated the MP cutoff value for successful liberation using the area under the curve of the receiver operating characteristic (ROC) and its corresponding prediction rate of liberation success.
Results:
The number of subjects in the successful liberation group was 79 and that of the failed liberation group was 31. The MP cutoff value and corresponding prediction rate for liberation success were 256.5 J/min (area under the curve-ROC = 0.839) and 92.2%, respectively. After PSM, the low MP group (n = 36), divided based on the MP cutoff value, had a significantly higher liberation success rate than the high MP group (n = 36), with an odds ratio of 19.95 (CI 3.95, 91.23, P < .001).
Conclusions:
MP at tracheostomy was a strong predictor of successful ventilator liberation, and the prediction rate of liberation success based on the MP cutoff value was shown to be very high. We recommend that patients with low MP be actively considered for liberation. In contrast, those with high MP should continue weaning while simultaneously making early transfer arrangements if liberation is unsuccessful.
Introduction
Although mechanical ventilation can potentially save lives, its nonphysiologic respiratory assistance and the presence of an artificial airway can lead to various complications. 1,2 Weaning protocols should be implemented in all hospitals and acute care facilities for all mechanically ventilated patients to expedite their liberation from mechanical ventilation. Decisions regarding the continuation of mechanical ventilation require the early prediction of the success or failure of mechanical ventilator liberation (hereafter referred to as “liberation”) to avoid unnecessary stress on patients unfit to wean and to liberate those fit to wean without undue delay. Previous studies have been conducted to predict liberation outcomes. 3 –5 Early prediction of liberation success may be guided by both subjectively and objectively measured parameters—such as the rapid shallow breathing index (RSBI), 3,5 tidal volume, 5 and work of breathing (WOB). 1
Mechanical power (MP) is a measure that quantitatively captures energy transfer from the mechanical ventilator to the patient’s respiratory system. 6 –8 MP is a composite calculation that includes conventional indices of liberation, such as breathing frequency (f), tidal volume (VT), driving pressure (DP), and PEEP. 9,10 It is considered helpful for predicting liberation outcome. 6 The predictive accuracy of MP for liberation outcomes is higher than that of conventional indices, such as the RSBI. 10 Standardized MP, based on both lung compliance and body size, has an even higher predictive accuracy than pure MP. 10,11
Previous studies on MP have focused mainly on intubated patients, 7,10 with limited research on its role as a predictor of weaning success in tracheostomized patients. There is very little research on MP as a predictor of weaning success outside of patients with an endotracheal tube.
Data from subjects with tracheostomies are limited, but Ghiana et al reported on the usefulness of MP to predict liberation outcomes in long-term mechanically ventilated patients with tracheostomy. 6 Their study measured MP after subjects were transferred from acute care to weaning centers. The Evidence-Based Guidelines for Weaning and Discontinuing Ventilator Support recommend that tracheostomy be considered early after confirming the need for long-term ventilatory support and stable mechanical ventilation. 12 Tracheostomy performed 2–3 weeks after orotracheal intubation is widely accepted in current clinical practice, although its optimal timing remains debatable. 2,13 Therefore, MP measurement at tracheostomy as a predictor of liberation outcome could be considered useful. However, to the best of our knowledge, we could not find any previous studies on MP measurement at tracheostomy as a predictor of liberation outcome. 6,10,11 This study aimed to calculate the cutoff value of MP at tracheostomy for predicting successful liberation, clarify the prediction rate of liberation success based on this value, and assess the liberation success rate at each quartile of MP.
QUICK LOOK
Current knowledge
In recent years, several reports have suggested that mechanical power (MP) is a valid indicator for liberation from mechanical ventilation. However, most studies focused on intubated patients and used MP as an extubation criterion. Predicting these patients’ liberation outcomes early while maintaining high predictive accuracy is ideal, but the optimal timing for assessing MP remains undefined.
What this paper contributes to our knowledge
Within our limited conditions, we could identify subjects who would undergo successful ventilator liberation with a probability of 92% using the MP cutoff value at the time of tracheostomy. Therefore, MP at tracheostomy is valuable for predicting liberation outcomes from subsequent mechanical ventilation. Conversely, it may identify patients with a low likelihood of successful liberation, providing early decision-making support for transfer arrangements and other considerations.
Methods
This was a single-center, retrospective observational cohort study conducted at a hospital in Japan. Subjects in the study were aged ≥20 years and received mechanical ventilation. All subjects underwent tracheostomy placement during their acute hospital stay in the ICU or high care unit (HCU) or both (hereafter referred to as “ICU and/or HCU”), from November 14, 2019, to April 24, 2024. We excluded patients who underwent tracheostomy before admission, those who discontinued weaning because of social reasons—such as prioritizing hospital transfer arrangements—and those who did not meet the criteria for starting to wean at the time of tracheostomy. Supplementary Figure S1 shows the subject selection flow chart.
We divided the subjects into 2 groups (success and failure) based on liberation outcomes at discharge or transfer, including those discharged owing to death. We defined liberation success as the status of a subject undergoing tracheostomy who could continuously discontinue mechanical ventilation for ≥48 h without clinical or laboratory signs of respiratory failure at the point of discharge (including death or transfer). We defined liberation failure as using mechanical ventilation at discharge (including death) or transfer to other facilities.
Each subject was weaned according to the institutional protocol, guided by the evidence-based guidelines published by Boles et al (Supplementary Fig. S2). 1 Primary physicians or nurses changed the ventilator settings. We defined the initiation of weaning after tracheostomy as switching to pressure support ventilation (PSV) or a T-tube 1 following the procedure. The ventilation mode in the protocol was standardized to pressure control–continuous mandatory. Settings, such as inspiratory pressure (also known as DP under pressure control ventilation), were gradually reduced, and the mode was switched to PSV if the criteria for weaning discontinuation were not met. PEEP was adjusted appropriately based on the PEEP table from the ARDS Network (low-PEEP version). 14 Subsequently, pressure support was gradually reduced under PSV, and the subject was switched to a T-tube after meeting the criteria for ventilator withdrawal. 1 Comprehensive support during weaning included active nutritional therapy and physical therapy, whereas sedative use was avoided. The Puritan Bennett PB980 (Medtronic, Dublin, Ireland) and Savina300 (Dräger, Lübeck, Germany) were used in the ICU and/or HCU and general wards, respectively.
We retrospectively collected subject information from November 14, 2019, to April 24, 2024, from the electronic medical records. Each item needed was primarily obtained on the day of the tracheostomy. For MP, data within 24 h before or after the procedure were used if data for the day were unavailable. Additionally, we excluded data within the first 3 h postoperatively, considering the effects of sedatives and neuromuscular blocking agents during tracheostomy. We recorded sex, age, height, weight, body mass index (BMI), obesity (BMI ≥ 25 kg/m2), predicted body weight (PBW), smoking status, Acute Physiology and Chronic Health Evaluation II (APACHE-II), 15 medical history, ICU and/or HCU admission type (emergency or nonemergency), history of cardiopulmonary arrest before tracheostomy, indication for tracheostomy, failed extubation evaluations (defined as failure to meet the criteria for both the spontaneous breathing trial [SBT] 1 and cuff-leak test 16 [hereafter SBT with cuff-leak test] on 2 or more occasions before tracheostomy), history of re-intubation within 48 hours after extubation, duration of mechanical ventilation and sedation before tracheostomy, and Glasgow coma scale score. We obtained the ventilator setting data: DP, setting of f, peak inspiratory pressure, PEEP, VT, minute volume, compliance (C), RSBI, and FIO2 .
The primary outcome was the relationship between MP standardized by PBW (hereafter MPPBW) and the success rate of liberation. MP was calculated using the simplified formula for pressure control ventilation by Becher et al
17
MPPBW was calculated by dividing MP by PBW, 10 where PBW was calculated as 50 + 0.91 (height − 152.4 cm) for men and 45.5 + 0.91 (height − 152.4 cm) for women. 14 To assess the WOB imposed on respiratory muscles during the evaluation, MP was measured during spontaneous breathing. 6,10
Based on liberation outcomes, we classified the subjects into success and failure groups and verified the differences in each variable between them. Our study design utilized the 2020 ventilated subject data from our collaborating research facilities to estimate the sample size. Of the 814 subjects who received mechanical ventilation during the study period, univariate analysis was performed on 110 cases (13.5%) that met the eligibility criteria (Supplementary Fig. S1).
Student t test (Welch’s test for unequal variances) and Mann–Whitney U test were used for normally and non-normally distributed continuous data, respectively. The chi-square test (Fisher exact test if expected counts were <5) was used for categorical variables.
We conducted propensity score matching (PSM) with matching and covariate adjustment to account for confounding factors for liberation outcome in the subject background’s clinical characteristics and weaning-related parameters. The objective variable was whether the MPPBW at tracheostomy was higher or lower than the cutoff value for liberation success, and the explanatory variable was the liberation outcome. A logistic model was used in this study, which utilized sampling without replacement. Each case was matched to one control using nearest neighbor matching in a 1:1 ratio, with a caliper width of 0.2 used for the matching process. There are no missing values for any variables included in the logistic regression model for PSM. The PSM was conducted following the Standards of Reporting of Observational Studies in Epidemiology guidelines, and the detailed results regarding adherence have been described in Supplementary Table S2. 18
The area under the curve of the receiver operating characteristic (ROC) was calculated to determine the cutoff value for successful liberation. To ascertain the prediction rate of successful liberation, the actual success rate of liberation for subjects falling below the MPPBW cutoff value was computed.
To conduct sensitivity analysis, we utilized a Cox proportional hazards model, considering successful liberation as the event, applied to the PSM data combined with a follow-up period.
In addition, we assessed the liberation success rate corresponding to each MPPBW value. The MPPBW quartiles were classified as quartile 1 (Q1), Q2, Q3, and Q4 for <25%, ≥25% and <50%, ≥50% and <75%, and ≥75%, respectively. Subsequently, the liberation success rates were evaluated in each group.
Data analysis was performed using R version 4.4.1 (R Core Team, 2024), and the significance level was set at <0.05. This study was conducted following the ethical principles of the Declaration of Helsinki and approved by the Ethics Committee of the Research Ethics Review Committee for Life Science and Medicine Involving Human Subjects, University of the Ryukyus (Approval No. 23-2220-00-00-00).
Results
The estimated sample size was 42. Univariate analysis was performed on 110 subjects (13.5%) that met the eligibility criteria from the 814 patients who received mechanical ventilation during the study period (Supplementary Fig. S1). The mean age was 69.5 ± 15.0 years, with 80 (72.7%) being men and 79 (71.8%) achieving successful liberation. On the day of tracheostomy, age, APACHE-II, history of chronic respiratory diseases, and duration of mechanical ventilation before tracheostomy showed statistically significant differences. However, other items, such as the failure of SBT with cuff-leak test, showed no statistically significant differences (Table 1).
Subject background on the day of tracheostomy
Continuous variables are presented as mean ± standard deviation or median (interquartile range); categorical variables are presented as numeric values (%).
Student t test.
Welch t test.
Mann–Whitney U test.
Chi-square test.
Fisher exact test.
BMI, body mass index; CPA, cardiopulmonary arrest; APACHE II, Acute Physiology and Chronic Health Evaluation II score; SBT, spontaneous breathing trial; HCU, high care unit; MPPBW, predicted body weight–Mechanical power; RSBI, rapid shallow breathing index; DP, driving pressure; C, Compliance.
The area under the curve-ROC of MPPBW for liberation success was 0.839 (95% CI 0.75–0.91), with an estimated MPPBW cutoff value of 256.5 J/min. When age, APACHE-II scores, history of chronic respiratory diseases, and duration of mechanical ventilation before tracheostomy, which were considered confounding factors for liberation outcome, were input into the PSM model, 72 cases (36 in each group) were matched. A comparison of data before and after PSM has been shown in Supplementary Table S1. After PSM, no items related to clinical characteristics and weaning-related parameters of the subject background showed statistical significance differences (Supplementary Fig. S3). The liberation success rate was the only statistically significant difference between the groups. The liberation success in the low MPPBW group was higher than in the high MPPBW group (77.7% vs 33.3%, P < .001). The odds ratio for liberation success with low MPPBW was 19.0 (95% CI [3.95, 91.23], P < .001) (Table 2).
Relationship between MPPBW and success of mechanical ventilator after propensity score matching
This result was adjusted for subjects’ background factors—age, APACHE-II, history of chronic respiratory disease and duration of mechanical ventilation before tracheostomy—using propensity score matching.
Low MPPBW means of under success of MPPBW cutoff value (≦256.5 J/min), whereas high MPPBW means of above the value.
Categorical variables are presented as numeric values (%).
Chi-square test.
Liberation success, success of liberation from mechanical ventilator; MPPBW, predicted body weight–mechanical power; OR, odds ratio; APACHE II, Acute Physiology and Chronic Health Evaluation II score.
A Cox proportional hazards model using successful liberation as the event was applied to the PSM data and the follow-up period for sensitivity analysis. The estimated hazard ratio for MPPBW was 3.5, achieving 5% significance. Intergroup comparisons for all variables included in the hazard model for the sensitivity analysis are detailed in Supplementary Table S3.
Of the 110 subjects, 64 fell below the MPPBW cutoff value and 59 achieved liberation success. The predicted rate of liberation success based on the MPPBW cutoff value was 92.2%. The liberation success rates for MPPBW quartiles were 100%, 85.2%, 60.7%, and 40.7% for Q1 (<185 J/min), Q2 (≥185, <247 J/min), Q3 (≥247, <303 J/min), and Q4 (≥303 J/min), respectively. Figure 1 shows the success rate of ventilator liberation by interquartile range of MPPBW.
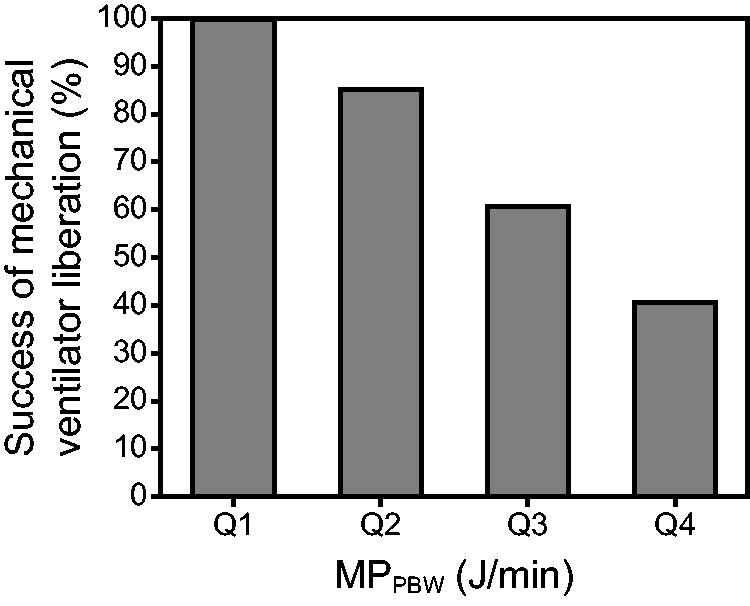
The success rate of mechanical ventilator liberation by the interquartile range and a cutoff value of MPPBW. MPPBW (J/min) was categorized into Q1: <185, Q2: ≥185, <247, Q3: ≥247, <303, and Q4: ≥303. The minimum and maximum values of MPPBW were 115 and 816 J/min, respectively. MPPBW, predicted body weight–mechanical power.
Regarding clinical outcomes, the failure group had significantly higher rates of in-hospital death (3.8% vs 61.3%, P < .001), ICU and/or HCU stays (22 [12.0–30.5] vs 14 [10.0–20.5] days, P = .02), and days of weaning after tracheostomy (28.0 [14.0–43.5] vs 5.0 [2.0–13.0] days, P < .001), among others. Regarding the respiratory index, the MPPBW at tracheostomy in the failure group was higher than in the success group (316.4 [279.1 − 420.1] vs 227.7 [170.6 − 256.1] J/min, P < .001). f, minute volume, RSBI, PaO2 /FIO2 , DP, and C were also significantly higher in the failure group. PEEP was not statistically significant different between groups.
Discussion
Studies have highlighted the need to standardize the discontinuation of mechanical ventilation in patients who are orally intubated and whose disease has been treated. 12,19 In an editorial, Hess emphasized that extubation should immediately follow a successful SBT. 19 The population in this study would have had a different pathophysiology. The chronic critical illness catabolism syndrome associated with neuromuscular consequences of prolonged mechanical ventilation and resultant diaphragmatic dysfunction would necessitate a gradual process of reconditioning. Previous studies have revealed that extending mechanical ventilation by 18–69 h can cause diaphragm atrophy, 20 leading to further prolongation of mechanical ventilation and subsequent reduction in liberation success. 21 Our study partially referenced these considerations. MP can, therefore, serve as an indicator of the likelihood of liberation success even in those with chronic critical illness and the need for prolonged mechanical ventilation. Estimating liberation success rates corresponding to the MPPBW cutoff value at tracheostomy might be a reliable predictive indicator of the outcome of liberation post-tracheostomy. Many studies on MP have been conducted, but most have focused on investigating the relationship with the mortality rate. 7,10,22 In addition, most studies investigating liberation outcomes focused on intubated subjects, 7,10 with only a few studies targeting tracheostomy subjects, wherein MP was measured at later stages. 6 To our knowledge, previous studies have yet to address the timing of MP evaluation for predicting liberation outcomes in long-term ventilated subjects. 6,10,11 This study validates the utility of MP as a predictive indicator for liberation outcomes at the early stage when the patient’s condition is stable, specifically at tracheostomy.
In the univariate analysis, we observed statistical differences between the liberation success and failure groups. Previous studies have identified age, 4 severity, 4,10 history of chronic respiratory disease, 4,11 and duration of mechanical ventilation before tracheostomy 2,5 as risk factors for liberation failure. Age-related causes, 23 differences in the residual function of respiratory muscles, including the diaphragm, and differences in thoracic mobility have been demonstrated to affect each variable of the MP, 6,8 such as DP, VT, f, and PEEP. 7 We consider these variables to be confounding factors for our study results. We, therefore, adjusted for subject background using PSM. After adjusting for confounders, we found the liberation success rate in the low MP group to be significantly higher than that in the high MP group, with a difference of as much as 19 times higher in the low MP group. This study found that the lower the MPPBW, the higher the liberation success rate. This finding was consistent with previous studies targeting both intubated 10 and tracheostomized subjects. 6 These results suggest that MPPBW at tracheostomy may be an independent predictor of subsequent liberation success. The results aligned with previous studies even when MP was assessed at tracheostomy. 6,10,11
In our analysis, subjects who died while on mechanical ventilation were classified as having failed weaning. To focus on successful liberation as a specific event, a sensitivity analysis was conducted to omit these subjects. The hazard ratio calculated was 3.5, indicating statistical significance. Although this ratio is lower than the odds ratio of 19 derived from the logistic regression model, a lower MPPBW correlates with an increased probability of successful release in the survival time analysis.
In our study, there was no significant difference between liberation success and failure for failed SBT with cuff-leak test. However, several studies reported SBT failure as an independent factor for liberation failure. 1,6 Our results differed from previous studies. In our evaluation for extubation before tracheostomy, we considered both SBT 1 and airway assessments, such as the cuff-leak test, as a single category to evaluate the possibility of extubation. This evaluation approach may explain the differences in our findings.
Hess and MacIntyre advocate for rapid extubation rather than weaning, emphasizing prompt elimination of ventilator support by addressing the underlying disease. 12 In contrast, delays in weaning and SBT resulting from a conservative approach by clinicians and unnecessary extension of mechanical ventilation through gradual weaning may reduce liberation success in patients who can be successfully liberated. 19
Our study found that subjects whose values fell below the MPPBW cutoff value for liberation success (<256.5 J/min) and those in the low MPPBW groups—Q1 (<185 J/min) and Q2 (≥185, <247 J/min)—had liberation success probabilities of 92.2% and 85.2–100%, respectively. We suggest considering active liberation efforts for patients where the MPPBW is low at the Q1–Q2 level or below the cutoff value. For subjects with MPPBW at the Q4 level or significantly above the cutoff value, we recommend continuing weaning while simultaneously carrying out early transfer arrangements if liberation is unsuccessful. Among mechanically ventilated patients, 47% experience dyspnea 24 and weaning accounts for 40–66% of the total ventilated days. 25,26 MPPBW might help select patients requiring aggressive weaning and considering early transfer coordination at the tracheostomy stage.
Traditionally, esophageal pressure monitoring has been required for WOB evaluation, which is essential for weaning. This complex and invasive technique is difficult to use in routine practice. Conversely, even SBT, the current global standard for weaning techniques, requires trying ventilator withdrawal or changing ventilator settings to PSV. 1 Thus, although traditional liberation evaluation involves a process of trial and adjustment based on existing evidence, evaluation using MP offers the advantages of being safe, inexpensive, and easily implemented clinically, 7,10,11 without the need for challenging ventilator withdrawal or setting changes. MP at tracheostomy might indicate the potential for future liberation success. According to Hess, active attempts for ventilator weaning using SBT rather than gradual weaning are desirable. 19 SBT is particularly effective in patients with a low MPPBW at tracheostomy. Therefore, the number of days required for unnecessary mechanical ventilation is expected to decrease further.
Exploring the factors that caused a significant difference in MPPBW values at tracheostomy is important for determining the approach to clinical respiratory care. Among the components of the MPPBW, f and DP were significantly higher in the liberation failure group, whereas C was significantly lower. PEEP was the only respiratory index with no significant difference between the 2 groups. These factors contribute to the significant between-group difference in MPPBW. High-intensity mechanical ventilation is associated with poor clinical outcomes. 27 Managing mechanical ventilation with low f, VT, and DP prevents lung injury and supports early liberation. This approach aligns with conventional lung protection strategies, such as a VT of 6 mL/kg and a plateau pressure of ≤30 cm H2O, 14 and reports of increased mortality risk with a high DP (>14 cm H2O). 28 Considering that C = VT/DP, normal C is necessary to achieve low DP and low VT. However, improving C can be challenging. In this study, the VT target was set at 6–8 mL/kg, avoiding high VT. In contrast, the failure group had a decreased C of 33 ± 13.2 mL/cm H2O, requiring compensatory higher DP to maintain the target VT. Gattinoni et al reported that a 10–20% change in elastance corresponds to a 5–10% change in MP, and the rate of change in elastance is greater than that of airway resistance. 7 This underscores the importance of improving low C in clinical practice. Although challenging, interventions such as thoracentesis or optimizing PEEP settings to prevent alveolar collapse or overexpansion can improve C. Such approaches can help reduce DP and MP while increasing liberation success rates.
Our study has several limitations. First, owing to its retrospective design and being a single-center study, our findings are confined to assessing the value of MP for ventilator liberation based on past data from a limited patient population and mechanical ventilation settings. Consequently, to generalize the findings, further validation through larger, multi-center studies with a prospective design is necessary. Second, although our weaning protocol specified predetermined procedures, the extent of ventilator liberation time extension was left to the attending physician’s discretion. This may have influenced outcomes, such as the number of weaning days after tracheostomy. However, the primary outcome of this study—the association between MP and final liberation success—was unlikely to have been affected by the protocol. Future research should focus on prospective studies with a strict weaning protocol that includes continuous weaning unless the criteria for cessation based on SBT are met. Third, we did not exclude patients with neuromuscular disorders who may lack full compensatory respiratory function, 1 potentially compromising MP accuracy and underestimating liberation failure risk. Conditions affecting ventilation, oxygenation, and airway resistance may act as confounding factors for MP. As neuromuscular disorders accounted for <5% of our study population, their impact on results is likely minimal. Further investigation is needed into the influence of primary diseases and underlying conditions on MP.
This study might assist physicians involved in respiratory care, nurses coordinating hospital transfers, and other health care professionals involved in mechanical ventilation management. The usefulness of MP is important in countries like Japan, where weaning centers and respiratory therapists are less common. 29
Conclusions
With our limited patient population and specific mechanical ventilation conditions, the cutoff value of MPPBW was a predictor of liberation success at tracheostomy, with a prediction rate of 92.2%. Similarly, the quartile MPPBW showed clinical utility. Evaluation based on MPPBW at tracheostomy may be able to guide clinical decisions regarding continuous mechanical ventilation and patient management, potentially improving outcomes and optimizing resource allocation.
Footnotes
Acknowledgments
We thank all the researchers, health care professionals, and subjects involved in this study.
Author Disclosure Statement
The authors have no conflicts of interest to disclose.
Funding Information
No funding was received for this article.
Supplementary Material
Supplementary Data
Supplementary Figure S1
Supplementary Figure S2
Supplementary Figure S3
Supplementary Table S1
Supplementary Table S2
Supplementary Table S3
References
Supplementary Material
Please find the following supplemental material available below.
For Open Access articles published under a Creative Commons License, all supplemental material carries the same license as the article it is associated with.
For non-Open Access articles published, all supplemental material carries a non-exclusive license, and permission requests for re-use of supplemental material or any part of supplemental material shall be sent directly to the copyright owner as specified in the copyright notice associated with the article.