
Abstract
Calorie restriction (CR) extends life span in mammals and delays the onset of age-related diseases, including cancer and diabetes. Drugs that target the same genes and pathways as CR may have enormous therapeutic potential. Recently, genome-scale data on the responses of human cell lines to over 1,000 drug treatments have become available. Here we integrate these data with gene expression signatures of CR in mouse liver to generate a prioritized list of candidate CR mimetics. We identify 14 drugs that reproduce the effects of CR at the transcriptional level.
Introduction
Because of these limitations, there is a pressing need for faster and higher-throughput surrogate assays to help identify and prioritize new drug candidates for health span extension. A promising alternative to direct screening of life span is expression-based screening for calorie restriction (CR) mimetics. 3 –6 CR is one of the most reproducible and effective life span interventions; it extends life span in model organisms from yeast to mammals and delays the age of onset for many diseases of aging, including cancer and diabetes. 7 Thus, drugs that mimic CR at the transcriptional level may be of great therapeutic value. 8 In an expression-based screen, mice are treated with drug, tissue samples are taken, and gene expression changes measured using microarrays and compared to those induced by CR. Recent screens found that the drugs metformin and resveratrol reproduce many gene changes seen with CR. 4,9,10
In this work, we develop an in silico version of expression-based drug screening for CR mimetics that allows us to test hundreds of drugs at once. We collect nine previously published transcriptional signatures of CR in mouse liver and screen each one against the Connectivity Map, 11 a public resource containing genome-scale data on the responses of human cell lines to over 1,000 drug treatments. We then conduct a meta-analysis and identify 14 drugs that consistently rank among the top CR mimics across multiple studies.
Materials and Methods
Code
Code for all analyses was written in R 2.13.0. Several Bioconductor 2.8 packages were used; we normalized raw Affymetrix CEL files with affy, 12 used limma 13 to identify differentially expressed probesets, and converted mouse IDs [array-specific, GenBank, or Mouse Genome Informatics (MGI)] to human HG-U133A probeset IDs for Connectivity Map analysis using annotationTools. 14 The drug–drug network was visualized using NAViGaTOR 2.2.1. 15
Drug–drug interaction network
We downloaded the DN drug–drug interaction network, where two drugs share an edge if they share a common mode of action, from Mode of Action by NeTwoRk Analysis (MANTRA). 16
Acquiring transcriptional signatures of CR
We collected gene signatures of CR from published studies. 3,4,17 –22 Our analysis pipeline differed depending on whether the source publications made their raw data available, as described below.
Identifying differentially expressed genes from raw microarray data
For publications where Affymetrix CEL files were available, 4,17,18 we reanalyzed the raw data to derive lists of genes significantly up- or downregulated following CR. We normalized CEL files using the robust multiarray averaging (RMA) method 23 implemented in affy, 12 and identified differentially expressed probe sets using the empirical Bayes method in limma. 13
Curating differentially expressed gene lists from published papers
For publications where no raw Affymetrix data were available, 3,19 –22 we downloaded lists of genes reported by the authors to be differentially expressed (in paper text, tables, or supplementary materials). Where fold change and false discovery rate (FDR)-corrected P values were available, we used these data to filter gene lists.
For both types of signature, we removed genes with FDR values greater than 0.05 and (positive or negative) fold change less than 1.25, sorted the remaining genes by FDR, and retained only the top 250 upregulated and the top 250 downregulated genes for further analysis.
Connectivity map analysis of CR signatures
Mapping mouse CR signatures to human probeset IDs
We mapped mouse gene IDs to human Affymetrix HG-U133A IDs for connectivity map analysis following previously established protocols.
11
First, mouse CR signature genes were mapped to Entrez Gene IDs using either the org.Mm.eg.db Bioconductor 2.8 library (for GenBank or MGI identifiers) or Affymetrix annotation files Mouse430_2.na31.annot.csv or MG_U74Av2.na32.annot.csv (for probeset IDs). Mouse Entrez Gene IDs were then mapped to human Entrez Gene IDs using homologene.data (release 65;
Acquiring drug connectivity scores for CR signatures
For each CR signature, mean connectivity scores for 1,309 drugs were calculated as previously described
11
using data on 6100 drug treatments downloaded from Connectivity Map build 02 at
Meta-analysis of drug-response data
Combining ranked lists of drugs to identify CR mimetics (ranked connectivity scores)
We adapted the Rank Product method 24 to identify drugs that consistently mimic CR at the transcriptional level. For each drug, we calculated the product of its ranks in all CR signatures.
Computing p-values
We randomly permuted the assignment of connectivity scores to drug treatments for the 6100 instances, recalculated mean connectivity scores and drug ranks for 1309 drugs in each signature, and calculated randomized rank products 10,000 times to estimate p-values and false discovery rates.
Results
Transcriptional signatures of CR
We obtained nine transcriptional signatures of CR in mouse liver by collecting and analyzing data from eight previous publications (we collected two signatures from Tsuchiya et al., 18 one for wild-type and one for dwarf mice). The mice used to generate the CR signatures came from both sexes and a variety of ages and genetic backgrounds, and CR mice consumed between 56% and 70% of the calories of the matched control group, depending on the study. For each mouse CR signature, we constructed an orthologous human signature made up of Affymetrix HG-U133A probe IDs for Connectivity Map analysis (see Materials and Methods). For each human CR signature, we calculated mean connectivity scores for the 1,309 drugs in the Connectivity Map collection. 11 Connectivity scores ranged between −1 and 1; a high, positive mean connectivity score indicates that drug treatment reproduces many of the gene changes with CR. For each human signature, we then constructed a ranked list of drugs based on the connectivity scores.
Meta-analysis identified 14 candidate CR mimetics
We combined the nine ranked lists of drugs into a single matrix and identified drugs that were consistently highly ranked across signatures using the Rank Product method 24 (see Materials and Methods). At a false-discovery rate cutoff of 25% (corresponding to unadjusted p values < = 0.0026), we found that 14 drugs significantly mimic the CR response in mouse liver (Fig. 1A).
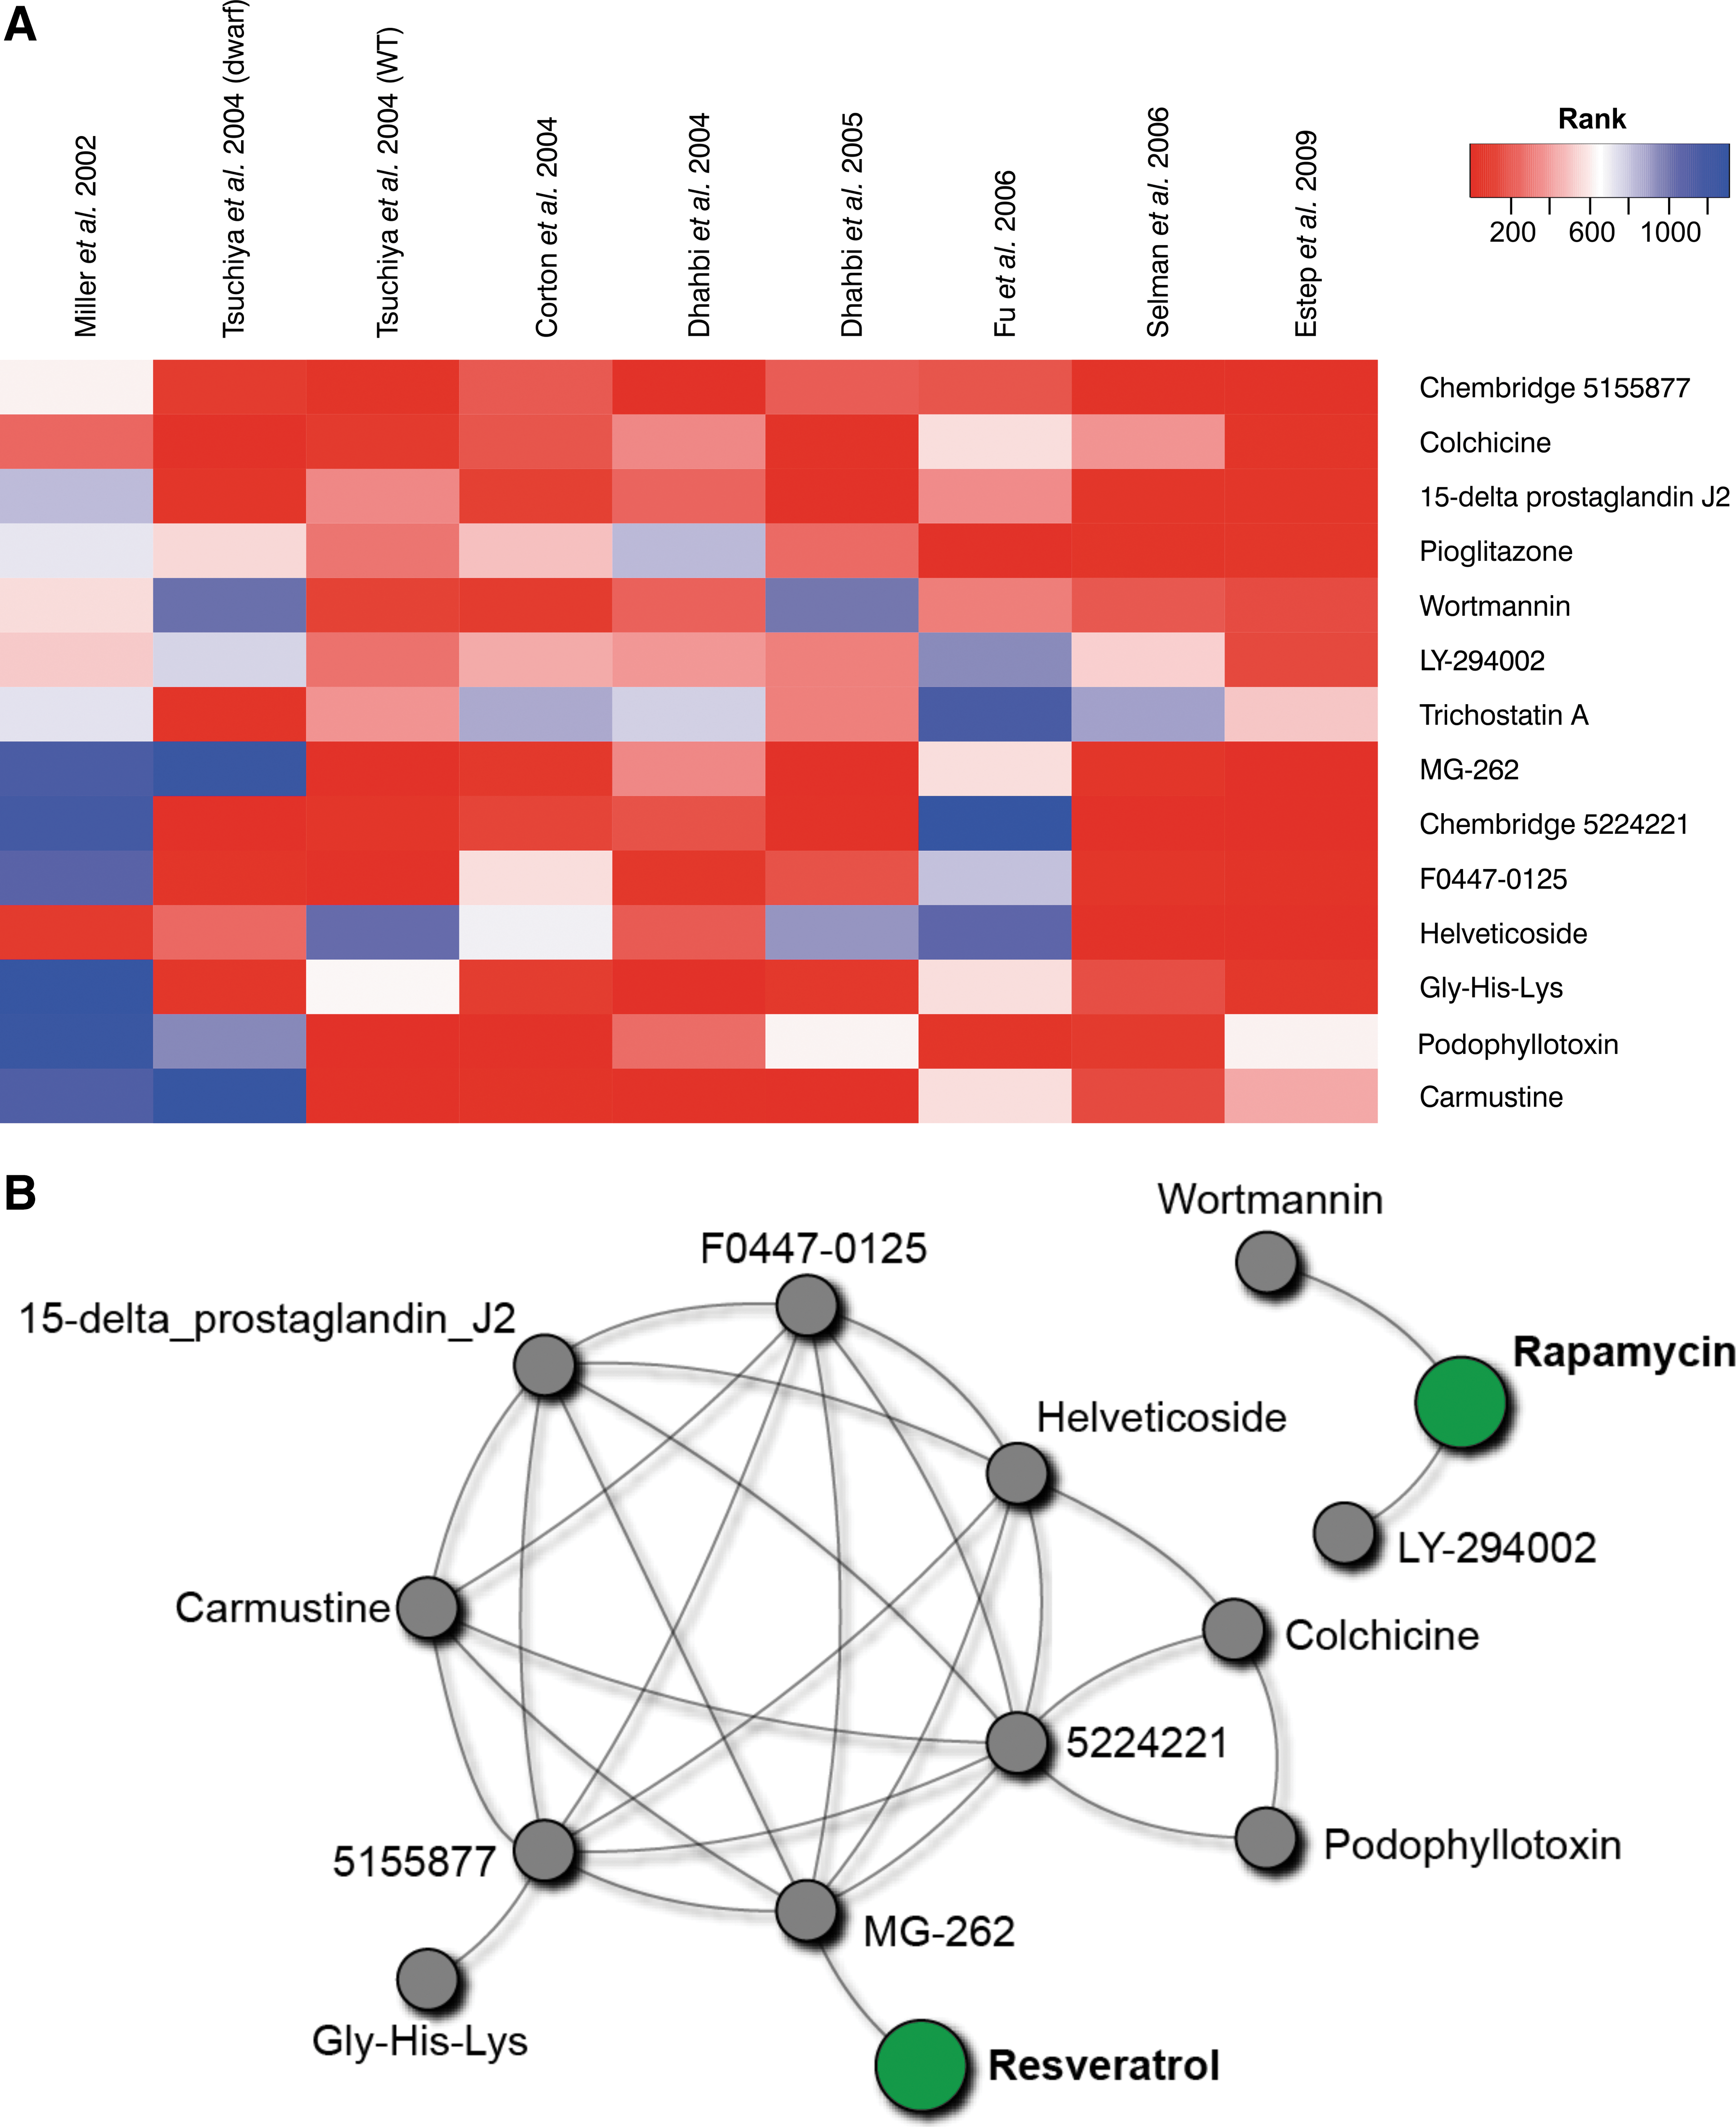
Fourteen drug treatments significantly mimic the effects of CR on hepatic gene expression. (
Although most signatures were consistent, i.e., gave high ranks to most of the significant drugs (Fig. 1A), two signatures stood out (the two leftmost columns); these corresponded to the earliest signature included in this study 20 and the signature derived from dwarf mice on a CR diet. 18 These two relative outliers highlight the usefulness of meta-analyses that identify consistent trends.
Many of the significant drugs show overlapping modes of action (MoA); 10 of 14 form a connected component in the MoA drug–drug interaction network (downloaded from MANTRA 16 ) where two drugs were joined by an edge if both drug treatments induced significantly similar gene changes (Fig. 1B). We also queried the network with the three best-known longevity therapeutics (metformin, rapamycin, and resveratrol) and found that one of the drugs identified in our screen have MoA similar to resveratrol, and two to rapamycin (Fig. 1B).
Significant drugs (Fig. 1A) are indicated for a wide variety of diseases. For example, pioglitazone is a prescription drug used to treat type 2 diabetes; 25 colchicine is used to treat gout; 26 MG-262 is a proteasome inhibitor with anti-inflammatory effects in the heart; 27 and Gly-His-Lys can activate wound repair. 28 Three of the drugs have been previously linked to aging: the PI3K inhibitors wortmannin and LY-294002 and the anti-diabetes drug pioglitazone increase lifespan in Drosophila. 29,30 Other drugs, such as the Chembridge compounds 5155877 and 5224221, are not yet well characterized in terms of their biological effects.
To our knowledge, none of the significant drugs identified in this study has yet been evaluated as a CR mimetic; they should be prioritized for further analyses and biological validation.
Discussion
Whereas few drugs have been directly tested for their effect on mouse life span, over 1,000 drugs have been characterized in terms of their effects on gene expression, and these data are in the public domain. We have applied this resource to identify 14 drugs that have similar transcriptional signatures to CR in mouse liver.
Several dozen other transcriptional signatures of CR are publicly available, mostly in mouse and rat, but some in primates, including a few in humans. We plan to follow up our pilot study in mouse liver by conducting in silico expression-based screening on the full set. Expression-based screening can also be applied to other life-extending treatments for which microarray response data are available, to see, for example, which compounds induce the gene changes seen in long-lived Ames or Snell dwarf mice (versus wild-type).
Longevity drugs have great potential to help treat the diseases of aging, yet few such drugs are known. Ours and similar approaches that leverage the large quantity of public data on drugs and mammalian aging can accelerate the identification and development of new longevity therapeutics.
Footnotes
Author Disclosure Statement
The authors have no conflict of interest to disclose.
Acknowledgments
This work was supported in part by Ontario Research Fund (GL2-01-030), Canada Institutes for Health Research (BIO-99745), the Canada Foundation for Innovation (CFI #12301 and #203383), the Canada Research Chair Program, and IBM to I.J., and the Ontario Ministry of Health and Long Term Care. The views expressed do not necessarily reflect those of the OMOHLTC.