
Abstract
Background:
Curcumin and quercetin are the two important flavonoids that are being used as food ingredients across the globe. They also possess many pharmacological activities such as anti-inflammatory, anticancer and antidiabetic activity. The combination of both these phytoconstituents is available in the market. However, there is lack of any suitable analytical method reported for their simultaneous estimation in food as well as pharmaceutical products. Hence, there is a need to develop a simultaneous method for them.
Objectives:
The study aims to develop and validate a simple high-performance liquid chromatography (HPLC) method for the simultaneous determination of curcumin and quercetin.
Method:
Gradient elution was carried out in ACN and GAA (2% v/v) for 15 min wherein the ratio of ACN and GAA was varied from 40-60 v/v ACN: 60-40 GAA v/v from 0-5 min followed by 60-80 v/v ACN: 40-20 v/v GAA between 7- 10 min followed by 80 % ACN: 20 % GAA between 10-15 min. The flow rate was kept 1 mL/min and detection wavelength at 395 nm. The method has been validated according to International Conference of Harmonization (ICH) Q2 (R1) guidelines with respect to specificity, system suitability, accuracy, precision, and robustness. The developed method was further used for the determination of curcumin and quercetin in different herbal extracts, marketed formulations containing these drugs and developed self-nano emulsifying drug delivery system (SNEDDS).
Results:
The method was linear in the concentration range of 50-250 ng mL-1 for curcumin and 800-1600 ng mL−1 for quercetin, respectively. The limit of detection (LOD) and limit of quantification (LOQ) were 11.76 and 35.6 ng mL−1 for curcumin, respectively, while LOD and LOQ for quercetin were 32.94 and 99.76 ng/mL−1, respectively. The percentage recovery that was found to be in the range of 95-105% with relative standard deviation less than 2% indicating the accuracy and precision of method for both the drugs. Further, the validated method was found specific to detect presence of both the drugs in extracts, marketed formulations and developed SNEDDS.
Conclusions:
The developed method showed excellent specificity, linearity, accuracy and precision. Thus, it can be further explored to detect curcumin and quercetin in biological samples as well as other marketed formulations.
Introduction
Curcumin and quercetin are the two important flavonoids that have gained consideration in the last 30 years for their antidiabetic, antioxidant, and anti-inflammatory effects. Several clinical and preclinical studies have shown the potential effect of these two flavonoids in the treatment of different diseases such as arthritis,1 diabetes,2,3 cancer,3 cardiovascular diseases,4,5 and bacterial infections.6,7 Numerous actions of curcumin are linked to its various activities on the glycogen synthase kinase 3-beta (GSK-3β) pathway.8 Mechanisms of action of quercetin are pleiotropic and involve the inhibition of intestinal glucose absorption, insulin secretory, and insulin-sensitizing activities as well as improved glucose utilization in peripheral tissues.9,10 Moreover, both the drugs act on different pathways that are involved in diseases such as diabetes, cancer, neurodegenerative diseases, and inflammation. These pathways include regulation of adenosine 5′ monophosphate-activated protein kinase (AMPK), peroxisome proliferator-activated receptor gamma (PPAR-γ), phosphoinositide 3-kinase-protein kinase B, c-Jun N-terminal kinase (JNK), and Janus tyrosine kinase-signal transducer and activator of transcription (JAK-STAT) pathways.11–16 Many high-performance liquid chromatography (HPLC) methods either in pharmaceutical products or in biological samples are reported in the literature for the determination of curcumin alone,17,18 quercetin alone,19,20 curcumin with other drugs,21,22 and quercetin with other drugs.23 Since, both curcumin and quercetin have been used in many polyherbal formulations as a health supplement for the management of obesity,24,25 improving immunity,26 adenomatous polyposis,27 and so on. The combination of both these drugs is available in the market as Vimerson Health in combination with bromelain.28 Hence, there is a need to develop a simultaneous method for quercetin and curcumin. Very few methods for simultaneous estimation of curcumin and quercetin have been reported.29–31 Advanced methods such as ultraperformance liquid chromatography-mass spectrometry (UPLC MS-MS) have been used for simultaneous determination of curcumin and quercetin in rat plasmas. However, this method is complex and requires costly instrumentation.29 Moreover, the HPLC method has been reported for the simultaneous determination of curcumin and quercetin. Thus, the limitation of this method is a long run time (20 minutes).30
This current study is aimed to develop and validate a simple, economic, rapid, sensitive, and gradient HPLC method for the simultaneous determination of curcumin and quercetin. The developed method has been successfully applied to determine the concentrations of curcumin and quercetin in various plant extracts, extract-based marketed formulations, and in-house formulated self-nano emulsifying drug delivery systems (SNEDDSs).
Experimental
Materials, Reagents, and Pharmaceutical Products
Curcumin was purchased from HiMedia (Mumbai, India). Quercetin hydrate was purchased from Molychem (Mumbai, India). HPLC grade ACN and GAA were purchased from Rankem (Maharashtra, India). Propylene glycol (PG), Tween 20, 80, polyethylene glycol (PEG) 200, 400, and 600, Span 80, sesame oil, soyabean oil, groundnut oil, cottonseed oil, almond oil, eucalyptus oil, mustard oil, olive oil, and castor oil were purchased from Central Drug House (CDH) (New Delhi, India). Labrafac® PG, Labrafil® M1944CS, Lauroglycol® FCC, Labrasol®, and Transcutol® P were received as a gift sample from M/s Gattefosse (Mumbai, India). Capmul® MCM was obtained as a gift sample from M/s Abitec Corp. (Mumbai, India). Turmeric formula capsules were purchased from Organic India (Lucknow, India). Haridra capsules were purchased from Himalaya herbal healthcare (Bangalore, India). Curpin capsules were obtained from Vaibhav Herbal (Amritsar, India). Haldi immunity enhancer capsules were purchased from Ayush Pharmaceuticals (Kangra, India). Haridra Khanda extract was purchased from Dabur (New Delhi, India). Haridra Khand powder extract was purchased from Wilson Drugs and Pharmaceuticals (Himachal Pradesh, India). Different quercetin extracts (onion, pudina, ajwain, amla, chebula, ginger, green tea, nutmeg, pepper, pomegranate, and tulsi) were gifted from Himalaya herbals (Bangalore, India).
Spectral Analysis
Each drug sample (curcumin and quercetin) and their mixture (10 µg mL–1 each) were prepared in ACN, and it was scanned for the determination of absorption maxima (UV-1800, Shimadzu, Japan) in the range of 200-600 nm against ACN as blank. In addition to that the solution of their physical mixture was also scanned in the same range.
Analytical Method Development
The analytical method was developed by using an HPLC system (Shimadzu LC-20AD Prominence, Japan) with a photodiode array detector (SPD-M20A) and a Rheodyne injector (7725i) equipped with an LC20AD pump. Statistical acquisition, recording, and chromatographic integration were achieved using LabSolutions version 5.82. Analysis and separation have been done on the C18 column with a length of 250 mm, an internal diameter of 4.6 mm, and a bead size of 5 µm. Gradient elution was carried out using 2% GAA and ACN as the mobile phase. The mobile phase consisted of GAA (2% v/v) and ACN in a gradient elution. The flow rate was set at 1 mL min–1 in a gradient mode, and the injection volume was set at 20 µL for all samples.
Preparation of the acetic acid solution
In the method development, a 2% v/v solution of GAA was used as one of the components of the mobile phase. It was prepared by adding 2 mL acetic acid in 1000 mL distilled water, and the final pH was then checked by using a pH meter. The solution was degassed using vacuum filtration (0.45 µm nylon membrane filter) and ultrasonication. Ultrasonication was carried out for 10 minutes using a Labman-ROHS (China) sonicator.
Preparation of the stock solution for curcumin and quercetin
Curcumin and quercetin (10 mg each) were weighed and transferred into a 100-mL volumetric flask. To this, 20 mL of ACN was added to dissolve the drugs. Then, the final volume was adjusted to 100 mL using ACN. This was labeled as solution A. The concentration of both curcumin and quercetin was 100 µg mL–1 in solution A.
Preparation of the working solution
One milliliter aliquot from solution A was withdrawn and transferred into a 10-mL volumetric flask (labeled as solution B), and the final volume was made up to 10 mL with ACN to give a working solution of curcumin (10 µg mL–1) and quercetin (10 µg mL–1). From solution B, an aliquot of 1 mL was withdrawn and transferred to another flask (labeled as solution C), and the final volume was made up to 10 mL to give a working solution of 1 µg mL–1 for both the drugs.
Preparation of sample dilutions for curcumin and quercetin
Ten volumetric flasks with a capacity of 10 mL were taken and labeled as D1, D2, D3, D4, D5, D6, D7, D8, D9, and D10. The flasks D1-D5 and D6-D10 were used to prepare dilutions of curcumin and quercetin, respectively. Accurately measured volumes of 0.5, 1, 1.5, 2, and 2.5 mL from flask C were transferred in flasks D1, D2, D3, D4, and D5, respectively. The final volume of each flask was made up to 10 mL to produce final concentrations of 50, 100, 150, 200, and 250 ng mL–1 for curcumin. To prepare serial dilutions for quercetin, accurately measured volumes of 0.8, 1, 1.2, 1.4, and 1.6 mL from flask B were transferred to flasks D6, D7, D8, D9, and D10. The volume in each flask was made up to 10 mL to produce final concentrations of 800, 1000, 1200, 1400, and 1600 ng mL–1 for quercetin. The samples were further analyzed on HPLC for different parameters of validation.
Method development and optimization
Due to the significant variance in the chemical and physical properties of curcumin and quercetin, various mobile phases and elution methods were initially tried in order to have both eluents on the same chromatogram. The mobile phase composition and the gradient elution used in the optimized method have been decided based on sensitivity and selectivity as well as suitable chromatographic parameters of the developed peaks in terms of peak shape, peak purity, peak sharpness, tailing factor, and resolution between the two peaks. The mobile phase was used as a solvent for all samples to confirm least noise and to eradicate any undesirable solvent peaks. Various trials were carried out in order to find better chromatographic conditions. The concentration of curcumin and quercetin for developing the analytical method was 10 µg mL–1.
In trial 1, the isocratic mode of elution was carried out using ACN and formic acid (0.1% v/v) in the ratio of 60:40 v/v as the mobile phase. In trial 2, gradient elution in ACN and water was carried out for 20 minutes, wherein the ratio of ACN and water was kept at 35:65 v/v for 4 minutes followed by 35-80 v/v:65-20 v/v between 4 and 8 minutes and 80 v/v:20 v/v between 8 and 20 minutes. In trial 3, isocratic elution was carried out using ACN and orthophosphoric acid (OPA, 0.1% v/v) in the ratio of 50:50 v/v as the mobile phase. In trial 4, isocratic elution was carried using CAN and GAA (2% v/v) in the ratio of 60:40 as the mobile phase. In trial 5, gradient elution in ACN and GAA (2% v/v) was carried out for 15 minutes, wherein the ratio of ACN and GAA was varied from 40 to 60 v/v ACN:60-40 GAA v/v from 0 to 5 minutes followed by 60–80 v/v ACN:40–20 v/v GAA between 7 and 10 minutes followed by 80% ACN:20% GAA between 10 and 15 minutes.
Method Validation
The optimized method for the simultaneous estimation of curcumin and quercetin has been validated as per ICH Q2 (R1) guidelines32 for evaluating system suitability, specificity, precision, accuracy, linearity, range, LOD, LOQ, and robustness.
System suitability
System suitability parameters such as theoretical plate number, tailing factor, resolution between curcumin and quercetin peaks, and height equivalent to theoretical plate (HETP) for both drugs were calculated by injecting a blank mobile phase followed by six replicates of 250 ng curcumin–quercetin mixture onto the HPLC system.33
Linearity and range
The range was selected for both the drugs starting by injecting the minimum concentration of both the drugs (10 ng mL–1). After selection of the range, different dilutions of curcumin (C1, C2, C3, C4, and C5) and quercetin (Q6, Q7, Q8, Q9, and Q10) were injected onto the HPLC system. Five injections of each concentration (C1, C2, C3, C4, and C5) were plotted on a curcumin calibration curve. Similarly, 5 injections of each concentration (Q6, Q7, Q8, Q9, and Q10) were plotted on a quercetin calibration curve. The slope, intercept, and correlation coefficient of the calibration curves (peak area vs concentration) were determined to ensure linearity of the analytical method.33
Accuracy study
An accuracy study was performed based on absolute recovery at three levels, ie, 80, 100, and 120% of the mid concentration of the calibration curve (i.e., 150 ng mL–1 for curcumin and 1.2 µg mL–1 for quercetin). These levels were labeled as lower quantified concentration (LQC), medium quantified concentration (MQC), and high quantified concentration (HQC). In the case of curcumin, LQC, MQC, and HQC were 120, 150, and 180 ng. In the case of quercetin, LQC, MQC, and HQC were 960, 1200, and 1440 ng. The accuracy was expressed in terms of percentage recovery of curcumin and quercetin from the solution. The study was carried out six times, and mean data were recorded. Percentage absolute recovery was calculated by following equation:33
Precision studies
A precision study was carried out in two steps, namely, repeatability and intermediate precision. Repeatability was carried out by injecting six injections at three levels, i.e., LQC, MQC, and HQC, simultaneously within a day, whereas intermediate precision was carried out in two steps. In step 1, interday study was carried out by injecting LQC, MQC, and HQC samples six times each for three different days. In step 2, interanalyst study was carried out by injecting LQC, MQC, and HQC samples six times each prepared by three different analysts under the same experimental condition.33 The mean data were recorded, and percentage relative standard deviation was calculated.
Determination of LOD and LOQ
LOD and LOQ for curcumin and quercetin were calculated from the linear regression equation based on the standard deviation of the intercept and the slope using equations (2a) and (2b), respectively,33
Robustness
Deliberate minute variations in the chromatographic conditions such as the flow rate and wavelength have been made. These variations were also assessed for resolution between curcumin and quercetin peaks, number of theoretical plates, and tailing factor.33
Method specificity and applicability
Quantification of quercetin and curcumin in herbal extracts and marketed formulations
For evaluating the applicability of the developed method, each extract of quercetin (onion, pudina, ajwain, amla, chebula, ginger, green tea, nutmeg, pepper, pomegranate, and tulsi) (100 mg) was weighed and dissolved in 10 mL of ACN taken in a test tube. Similarly, each marketed formulation of Curcuma longa extract containing curcumin was dissolved in ACN to produce the final concentration of 5 µg mL–1. Each sample was vortexed (CM 101 CYCLO MIXER, REMI, India) for 5 minutes. After that, it was kept as such for 24 hours with intermediate vortexing and sonication. After 24 hours, each sample was centrifuged (REMI CM-12 PLUS, India) for 20 minutes at 9262g for the removal of the undissolved powder from saturated solutions. The supernatant from each sample was removed and filtered through a syringe filter and then injected onto the HPLC system to analyze the peak of curcumin and quercetin present in extracts.
Drug loading in SNEDDS
In addition to this, drug loading of developed SNEDDS formulation loaded with curcumin and quercetin was also evaluated using this simultaneous method.
Formulation of SNEDDS
For preparing liquid SNEDDSs of curcumin and quercetin, 1 mL of the isotropic mixture was prepared using Lafrafill M1944CS, Capmul MCM, Transcutol P, Labrasol, and Tween 80. Curcumin and quercetin (each 5 mg) were added and dissolved in the isotropic mixture. The isotropic mixture was vortexed (CM 101 CYCLO MIXER, REMI, India) for 5 minutes. It was sonicated (Labman-ROHS, China) for 5 minutes and then centrifuged (REMI CM-12 PLUS, India) for 20 minutes at 9262g for the removal of the undissolved drug from the saturated solution. The supernatant from the isotropic mixture was removed and diluted to 500 mL with distilled water kept on a magnetic stirrer. The sample with a concentration of 10 µg mL–1 was filtered through a syringe filter and then injected onto the HPLC system to analyze the peak of curcumin and quercetin in SNEDDS formulation. The standard was prepared by dissolving 10 mg of each drug in 100 mL ACN. From this stock solution (100 µg mL–1), 1 mL was taken and diluted to 10 mL to produce the standard with a concentration of 10 µg mL–1 for curcumin and quercetin each. This solution was further injected onto the HPLC system to analyze the peak of standard curcumin and quercetin. The percentage drug loading was evaluated using the following equation:34,35
Specificity studies
The effect of excipients used in the formulation was determined. The specificity study was carried out in order to check any possible interaction of excipients with the drugs. Each solubilizer and excipient (Tween 80, Labrafil M1944CS, Transcutol P, Labrasol, and Capmul MCM) to be used for the formulation of SNEDDS (100 µL) was diluted with either ethanol or hexane depending upon the solubility and then injected on the HPLC system. The specificity of the proposed HPLC method for the determination of curcumin and quercetin has been established by injecting the mobile phase and placebo SNEDDS solution into the HPLC system.
Results and Discussion
Selection of UV Wavelength
Curcumin has an absorption maxima around 425 nm,36 and quercetin has absorption maxima at 370 nm.37 From the UV results, the absorption maxima of quercetin were found to be around 365 nm, and the absorption maxima of curcumin were found to be 420 nm. The isobestic point of both the drugs in combination is found to be at 395 nm as depicted in Fig. 1. The method development and validation for both the drugs were done at 395 nm.
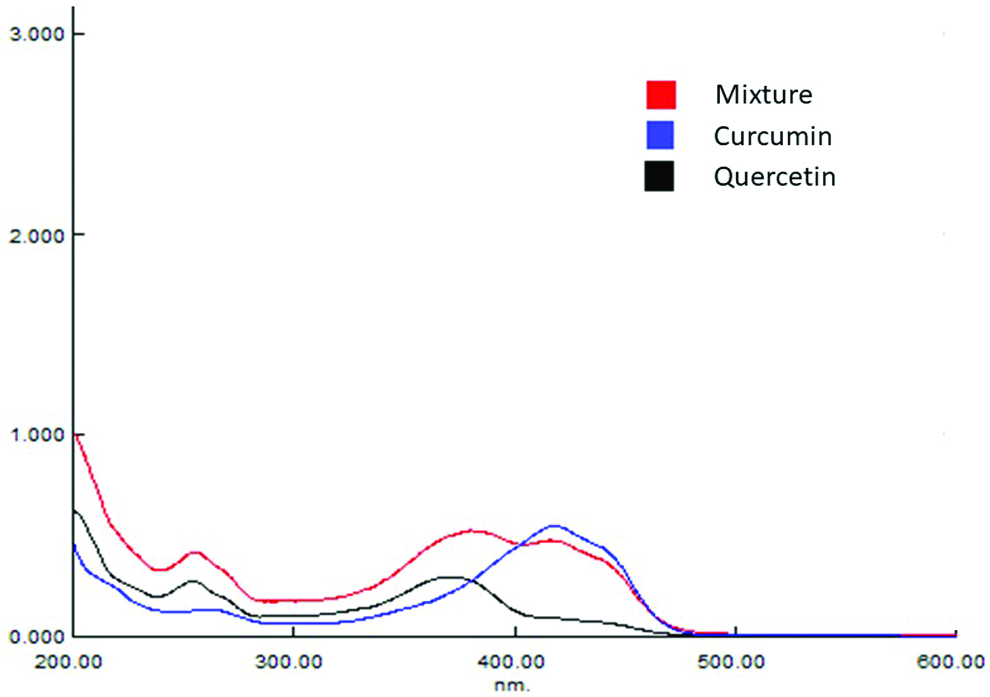
Isobestic point of curcumin and quercetin.
Method Development and Optimization
In trial 1, retention times for quercetin and curcumin were found to be 3. 4 and 7.2 minutes, respectively. However, the peaks showed broadening and shouldering. Hence, the method was not considered for further validation. In trial 2, the method was rejected since the peak of quercetin was not sharp due to broadening. In trial 3, retention time for quercetin and curcumin was 4.1 and 14 minutes, respectively, which was too long. So this trial was also rejected. Trial 4 was rejected since the peak shape of quercetin was not good due to observed fronting and curcumin was not eluted until 20 minutes. Trial 5 (Table 1) was chosen for further method validation as the peaks were sharp with no tailing or fronting. Furthermore, the theoretical plate value for curcumin and quercetin in this method was 56,626 and 3297, which was above 2000. HETP for curcumin and quercetin was 2.64 and 45.49, respectively. The tailing factor for both the drugs was less than 2. The peaks of both curcumin and quercetin for the developed method are given in Fig. 2.
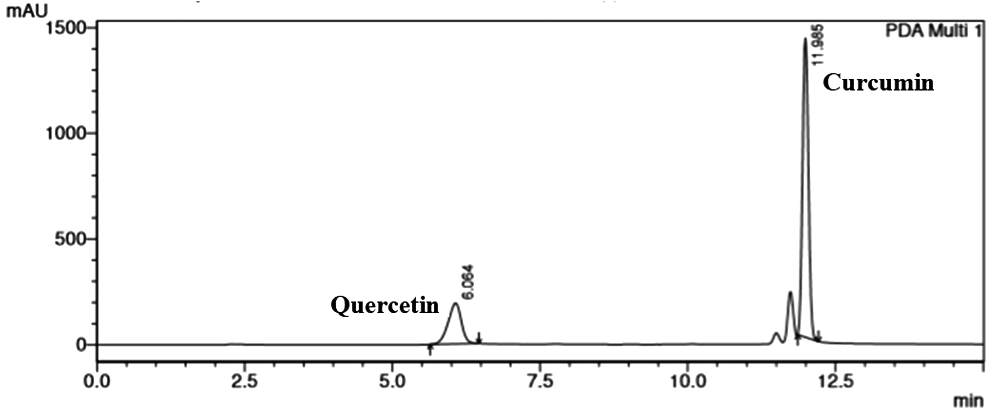
Optimized HPLC chromatogram of curcumin and quercetin.
Optimized gradient elution for simultaneous estimation of curcumin and quercetin.
System Suitability
The obtained results of hexaplicate injections for both the drugs exhibited that the limits tested were within the acceptable range. Curcumin and quercetin were repeatedly retained and well separated at 6.1 and 11.9 minutes, stating very good resolution between both peaks with relative standard deviation percent (% RSD) of the recorded retention times <0.2 to specify excellent repeatability of replicate injections on the integral HPLC system used; the tailing factor for both curcumin and quercetin peaks never exceeded 2 in all peaks, demonstrating good peak regularity (acceptance limit is <2); and the number of theoretical plates were always >2000 in all chromatographic runs, ensuring good column efficacy throughout the developed separation process. It is important to note that very small two peaks at 11.3 and 11.5 minutes were also observed along with the peak of curcumin belonging to its other forms, namely, curcuminoid A and B, however, with very low amount. Results are presented in Table 2.
System suitability results for curcumin and quercetin.
Linearity and Range
The calibration curves created for both quercetin (Fig. 3A) and curcumin (Fig. 3B) were linear in the specified ranges of 800-1600 ng mL–1 for quercetin and 50-250 ng mL–1 for curcumin. The correlation coefficient (r 2) for curcumin was noted as 0.9989 with the linear regression equation Y = 89.43x + 418.5. Similarly, for quercetin, the curve r 2 was noted as 0.9991 with a linear regression equation Y = 32.537x + 5997.2. The rationale for developing linearity at different ranges for curcumin and quercetin was based on their linearity. A good regression coefficient (r 2) was observed for curcumin in the range of 50-250 ng mL–1, but for quercetin, it was not observed in this range. Hence, a higher value of range was selected for quercetin.

Calibration curve of (
Accuracy
Accuracy of the developed HPLC analytical method was assessed by calculating percentage recovery that was found to be in the range of 95-105% with RSD less than 2% indicating the accuracy of method for both the drugs (Table 3).
Accuracy study results for curcumin and quercetin.
SD, standard deviation; RSD, relative standard deviation.
Precision
The results of interday and intraday studies were carried out by injecting LQC, MQC, and HQC. The peak areas separately found for curcumin and quercetin were repeatable and precise over three successive days. The results for both intraday and interday findings ensure the high repeatability and precision of the developed method where all data were expressed in % RSD, which was always under the acceptance limit (% RSD < 2). Results for intra- and interday precision for curcumin and quercetin are given in Table 4.
Precision study results of curcumin and quercetin.
N, response of number of replicates of study conducted; SD, standard deviation; RSD, relative standard deviation; A, analyst.
LOD and LOQ
The LOD was 11.96 and 32.94 ng mL–1 for curcumin and quercetin, respectively, whereas, the LOQ was 35.6 and 99.76 ng mL–1 for curcumin and quercetin, respectively.
Robustness
There were no significant changes noticed upon varying some of the parameters of the chromatographic conditions confirming that the method is robust to small deliberate changes applied in terms of the flow rate and wavelength. In all cases, curcumin and quercetin peaks were symmetric (tailing factor < 2) and were well separated (resolution > 2). The % RSD of curcumin and quercetin retention times were <1 confirming the robustness of the developed analytical method to small changes. Results for robustness are presented in Table 5.
Robustness study of curcumin and querectin.
Method Applicability
The applicability of the method has been confirmed where the optimized conditions were applied to detect the presence of curcumin and quercetin in different quercetin extracts and marketed formulations of curcumin. The representative chromatograms of quercetin peaks in extracts and curcumin peaks in marketed formulations are shown in Supplementary Figs. S1 and S2, respectively. Furthermore, the amount of curcumin and quercetin present in these extracts has been calculated and shown in Table 6 (curcumin) and Table 7 (quercetin). It is important to note that the concentrations of curcumin present in the extracts of Allium cepa (onion) and Mentha arvensis (pudina) are below the LOQ of curcumin. The applicability of the developed method was also checked in our formulated SNEDDS. The respective peaks of curcumin and quercetin from the SNEDDS formulation are presented in Supplementary Fig. S3. The method was further used to calculate drug loading.
Amount of curcumin in different extracts.
Amount of quercetin in different extracts.
The drug loading in the case of quercetin was found to be 96 ± 1.21%, whereas in the case of curcumin, it was found to be 99.9 ± 1.01% when loaded into L-SNEDDS.
Specificity
The absence of excipient peaks used to formulate SNEDDS in the chromatogram of curcumin and quercetin indicated the selectivity of the developed method. The chromatograms for the blank samples of these excipients are given in Supplementary Fig. S4.
Conclusion
In this study, an attempt has been made to develop an RP-HPLC method for simultaneous estimation of curcumin and quercetin. The method was successfully developed and complied with all method validation parameters such as linearity and range, precision, and accuracy. In addition to this, the method was successfully applied to quantify the presence of curcumin and quercetin in various extracts, marketed formulations, and SNEDDSs, which indicated toward selectivity and sensitivity of the developed method. The obtained positive outcomes of this study indicated that the developed method can be further explored to quantify these drugs in biological samples during the preclinical or clinical studies.
Footnotes
Acknowledgments
The authors are thankful to The Himalaya Drugs Company, Bengaluru, India, and Vasu Research Centre, Vadodara, Gujarat, India, for providing gift samples of extracts.