
Abstract
Background:
The expression of noncoding RNAs (ncRNAs) is closely related to breast cancer progression. However, there is no systemic analysis of ncRNAs in breast cancer diagnosis of the blood circulatory system. Herein, we aimed to collect all the evidence to test the potential role of ncRNAs as novel biomarkers in human breast cancers.
Methods:
We used a comprehensive search strategy to search relevant literature in the Web of Science, PubMed, and Embase databases from January 2012 to April 2021. The correlation of ncRNAs expression in serum, plasma, or blood circulatory system and the diagnostic accuracy of breast cancer (BC) markers were analyzed. We assessed the methodological quality of each study using the Quality Assessment of Diagnostic Accuracy Studies-2. Statistical analysis was performed using the STATA (version 12.0), Meta-Disc (version 1.4), and Review Manager (version 5.3) software.
Results:
This study analyzes the ncRNAs expression data of BC patients and healthy specimens’ blood from 2,120 patients in 29 publications (40 studies). The pooled sensitivity, specificity, and area under the curve (AUC) values were 0.81, 0.83, and 0.89, respectively. Subgroup analyses showed that the expression of ncRNA (micro RNA [miRNA], circular RNAs [circRNA], and long noncoding RNAs [lncRNA]) in the blood circulatory system (blood, plasma, and serum) of BC was more prone to be detected in miRNA group and subtype of BC (human epidermal growth factor receptor 2 [HER2]) group, with a high value of the sensitivity and AUC.
Conclusions:
The blood circulatory system (blood, plasma, and serum) of miRNAs, circRNAs, and lncRNAs detection may be useful for diagnosing breast cancer, particularly in the miRNA group and HER2 of breast cancer. Further studies are needed to identify the value of these ncRNAs as novel markers in clinical.
Background
Breast cancer is the most common cancer and is the second leading cause of cancer death among women worldwide, and the breast cancer incidence rate increased every year, but the death rate continues to decline.1,2
Molecular stratification based on gene expression profiling revealed that breast cancers could be classified as five subtypes: luminal A and B, human epidermal growth factor receptor 2 (HER2)-enriched, basal-like, and normal-like, which mostly corresponded to hormone receptor and HER2 status. The largest cluster is dominated by estrogen receptor positive (ER+) and/or progesterone receptor (PR+) tumors (70% of patients) and has frequently two subgroups (luminal A and B), both dominated by the expression of genes normally expressed by luminal breast epithelial cells (hence called luminal breast cancers). The subgroup named luminal B generally has a lower expression of ER and PR and a higher expression of genes involved in mitosis and cell proliferation (e.g., Ki67).
The other main cluster is enriched for hormone receptor-negative tumors and often has two subgroups. One is dominated by ER−, PR−, and HER2− tumors [triple-negative breast carcinoma (TNBC)] (15%), showing expression of genes typical of myoepithelial/basal epithelial cells, such as basal cytokeratins, and thus named basal-like tumors.3–6 The other group is often dominated by the high expression of HER2-related genes (called HER2-enriched group) (15–20%). A fifth group of tumors has gene expression similar to patterns found in normal breast tissue samples and was, thus, called normal like.
The most frequently mutated and/or amplified genes in the tumor cells are TP53 (41% of tumors), PIK3CA (30%), MYC (20%), PTEN (16%), CCND1 (16%), ERBB2 (13%), FGFR1 (11%), and GATA3 (10%), as reported in a series of early breast cancers.7 It is curable in ∼70–80% of patients with early-stage, nonmetastatic disease. Advanced breast cancer with distant organ metastases is considered incurable with currently available therapies. Increased survival is due to the dramatic shift in the screening methods, early diagnosis, and breakthroughs in treatments.7
Molecular biomarkers play an increasingly important role in cancer diagnosis and management. The discovery and use of specific prognostic and predictive biomarkers have enabled the application of targeted precision therapies to specific molecular subgroups of patients likely to gain benefit. Additionally, the use of biomarkers can allow for the identification of patients with a favorable prognosis who can safely be spared from unnecessary overtreatment. In advancement toward precision medicine, the field of cancer biomarker discovery has rapidly expanded over the last few decades.
Currently, there are a few serum markers used in breast cancer clinical diagnosis. Some studies have identified as possible breast cancer markers, the proteins CA 15-3 and CA 27-29, and carcinoembryonic antigen (CEA), which implicated in cell adhesion, immunity, and metastasis.8 These kinds of carcinoma antigens are not useful in the early detection of breast cancer. With advances in high-throughput technology, some noncoding RNAs (ncRNAs) can be detected and differentially expressed in the blood circulatory system of breast cancer patients.
The emergence of ncRNAs as crucial regulators of gene expression is associated with various cancers.9 The ncRNA is a functional RNA molecule that is transcribed from DNA but no or limited protein-coding potential. The large family of ncRNAs comprises diverse regulatory RNAs, including microRNA (miRNA) spanning 19–25 nucleotides in length, long noncoding RNAs (lncRNAs) with over 200 nucleotides base long, and recently discovered circular RNAs (circRNAs) formed by back-splicing and more stable than other ncRNAs.10 Currently, about 30,424 mature microRNAs have been reported, and more than 2,500 mature miRNAs have been discovered in mammalian systems.11 Many studies observed elevated levels of miRNAs in the circulation from breast cancer patients, such as miR-21,12 miR-20b-5p,13 miR-34a,14–16 miR-133a,17,18 miR-145,19 miR-181a,20 miR-424,21 miR-801,22,23 and so on.24–35 According to the GEN-CODE analysis, 27,817 transcripts originating from 15,931 genes can be identified as lncRNAs.36 Tumor suppressor lncRNA usually deregulated in the development of diseases. lncRNA such as H19, HOTAIR, XIST, FAM83H-AS1, and ATB were abnormally expressed in breast cancer patients’ serum compared with control.37,40 CircRNAs exist in exosomes and plasma, and 343 differentially circRNAs were expressed in the plasma.41 Their expression profiles are specific in different stages of cancer.42 A vast number of circRNAs have been discovered in different types of cancer and activated in either inhibiting tumor progression or promoting tumorigenesis.43,44 Therefore, these three kinds of ncRNA signatures from cancer and metastases have been used to classify different types of cancer, representing potential biomarkers for diagnosis, prognosis, and therapy.
Therefore, we conducted this meta-analysis to explore the relationship between miRNAs, lncRNAs, and circRNAs expression in the circulatory system and breast cancer diagnosis and determined if ncRNAs (miRNAs, lncRNAs, and circRNAs) expression has diagnostic and clinicopathological significances in breast cancer patients.
Methods
This manuscript adheres to PRISMA guidelines (Supplementary Table 1).
Characteristics of the included studies
SEN: sensitivity; SPE: specificity; AUC: area under the ROC curve.
Search strategy
Sources of studies included the databases of the Web of Science, PubMed, and Embase for the studies of diagnostic value of blood ncRNAs, including miRNAs, circRNAs, and lncRNAs in breast cancer, which published in the English language up to April 10, 2021. We searched keywords as (“breast cancer” or “mammary cancer” or “breast tumor” or “mammary tumor” or “breast carcinoma” or “mammary carcinoma” or “breast neoplasms” or “mammary neoplasms”) and (“blood” or “serum” or “plasma” or “circulating”) and “RNA” and “area under the Curve of ROC (AUC).”
Inclusion and exclusion criteria
The following criteria were used for the articles in this meta-analysis ( Fig. 1).

Flowchart of inclusion studies.
These studies met the following inclusion criteria:
The expression of miRNAs, circRNAs, or lncRNAs in breast cancers was detected. Sample size, sensitivity (SEN), specificity (SPE), positive likelihood ratios (PLR), negative likelihood ratios (NLR), and AUC data were available. Case–control was available in the studies. Studies on miRNAs, circRNAs, or lncRNAs from the blood, serum, plasma, or circulating of breast cancer patients were analyzes. Research articles and conference abstracts were included.
Consequently, studies were excluded ground on the following criteria:
Studies in humans. Not English writing studies. Lack of SEN and SPE data studies. Lack of control group studies. Studies of RNA-seq databases. Reviews, case reports, letters, or meta-articles.
Data extraction
We extracted the data from the included studies.
In these studies, data to be extracted include first author, publication year, blood specimen type, name of ncRNAs, and patient origin. We focused on the level of sensitivity, specificity, and AUC, and the expression of miRNAs, circRNAs, or lncRNAs, and collected much information such as the sample size, cut-off value, and reference gene.
The clinicopathological characterized data of the patients were assembled, including gender, age, tumor size, tumor number, ER, PR, HER2, tumor node metastasis (TNM) stage, lymphatic metastases, and Ki67 in breast cancer patients.
Statistical analysis
Data analysis and statistical software STATA (version 12.0), Meta-Disc1.4, and Review Manager (version 5.3) were used to analyze the diagnostic value. The pooled SEN, SPE, PLR, NLR, diagnostic odds ratio (DOR), and AUC of miRNAs, circRNAs, and lncRNAs were calculated the diagnostic value for cancers from each study. We analyzed the statistical heterogeneity by Q test, I square (I2), and Tau square (T2). A two-sided P < 0.05 was considered statistically significant. We used the random-effect model (DerSimonian-Laird) for higher heterogeneity (I2 > 50%), when I2 < 50% using the fixed-effect model (Mantel-Haenszel). Metaregression was performed to analyze the potential sources of heterogeneity. If tau-square less than 0.04 was defined as mild, 0.04 to 0.14 was moderate, and it was severe when higher than 0.40.45 The Deek’s funnel plot asymmetry was used to test the publication bias.
Results
Search and description of studies
The flow diagram for the literature research process is shown in Fig. 1. All the diagnostic values of ncRNAs in BC patients were collected and evaluated. A total of 2,120 BC blood specimens and 1,538 healthy specimens’ blood individuals from 40 studies (29 articles) published from January 2012 to April 2021 were included in this meta-analysis (Table 1 and Supplementary Table 2).
Expression of the most frequently altered ncRNAs in BC detected by the qRT-PCR
Among the 40 studies, 34 studies explore the association with 57 miRNA expressions, 1 study investigated one circRNA, and the other five studies focused on five lncRNA. In terms of samples, blood specimens from whole blood, plasma, and serum, and the sample size from 10 to 177. All studies used quantitative real-time polymerase chain reaction (qPCR), except one study that used absolute RT-qPCR. Histopathological grading information was provided in all studies. Twenty-four studies showed that 32 miRNAs upregulated in breast cancers, 12 studies reported that nine miRNA expressions were downregulated, and five studies showed that one lncRNA downregulated and four lncRNAs upregulated. One study showed that one circRNA upregulated in breast cancer (Table 2). The endogenous reference, quantitative method, and cutoff values are not uniform in all studies.
The difference between the expression of ncRNAs and clinic-pathological factors is shown in Table 3, including tumor size, TNM stage, lymphatic metastasis, tumor invasion, ER, PR, HER2, and Ki67.
The clinicopathological features associated with ncRNAs expression
Besides, all the studies independently scored the included studies based on the Quality Assessment of Diagnostic Accuracy Studies-2 (QUADAS-2) score system (Review Manager), including patient selection, index tests, reference standard, and flow and timing.46 We assessed the domains for risk of bias, which should answer as “yes,” “no,” or “unclear,” and a phrase such that “yes” indicates a low risk of bias. Moreover, the first three domains are also assessed in terms of concerns about applicability, which should rate as “low,” “high,” or “unclear,” and the “unclear” category should be used only when insufficient data are reported.
Detailed results of the QUADAS-2 assessment are provided in the Supplementary Fig. 1. All studies showed a risk of bias because thresholds for index test positivity had been predefined, and all the patients had the same reference standard. Forty documents included in the gold standard but did not mention whether or not to use the blind method. All of them had relatively high quality in the Supplementary Fig. 1, indicating the relatively reliable foundation of our analysis.
Meta-analysis
Forty studies involving three types of RNA with 2,120 BC patients investigated the diagnostic value of ncRNAs as the biomarkers of cancer, and a meta-analysis of the SEN, SPE, PLR, NLR, DOR, and AUC for ncRNAs was plotted in the breast cancer diagnosis. We chose the random-effects model to analyze the inconsistency (I2 = 99.95% > 50%). The pooled SEN was 0.81 (95% confidential interval (CI): 0.77-0.85) ( Fig. 2A), SPE was 0.83 (95% CI: 0.77-0.87) (Fig. 2B), PLR was 4.67 (95% CI: 3.4-6.4) (Fig. 2C), NLR was 0.23 (95% CI: 0.18-0.29) (Fig. 2D), DOR was 21 (95% CI: 13-32) (Fig. 2E), and AUC value was 0.89 (95% CI: 0.85-0.91) (Fig. 2F). Then, the funnel plots implied that publication bias does not affect the result (P = 0.35) (Fig. 2G). These results indicated a relatively moderate diagnostic accuracy of ncRNA in the detection of cancer patients blood.
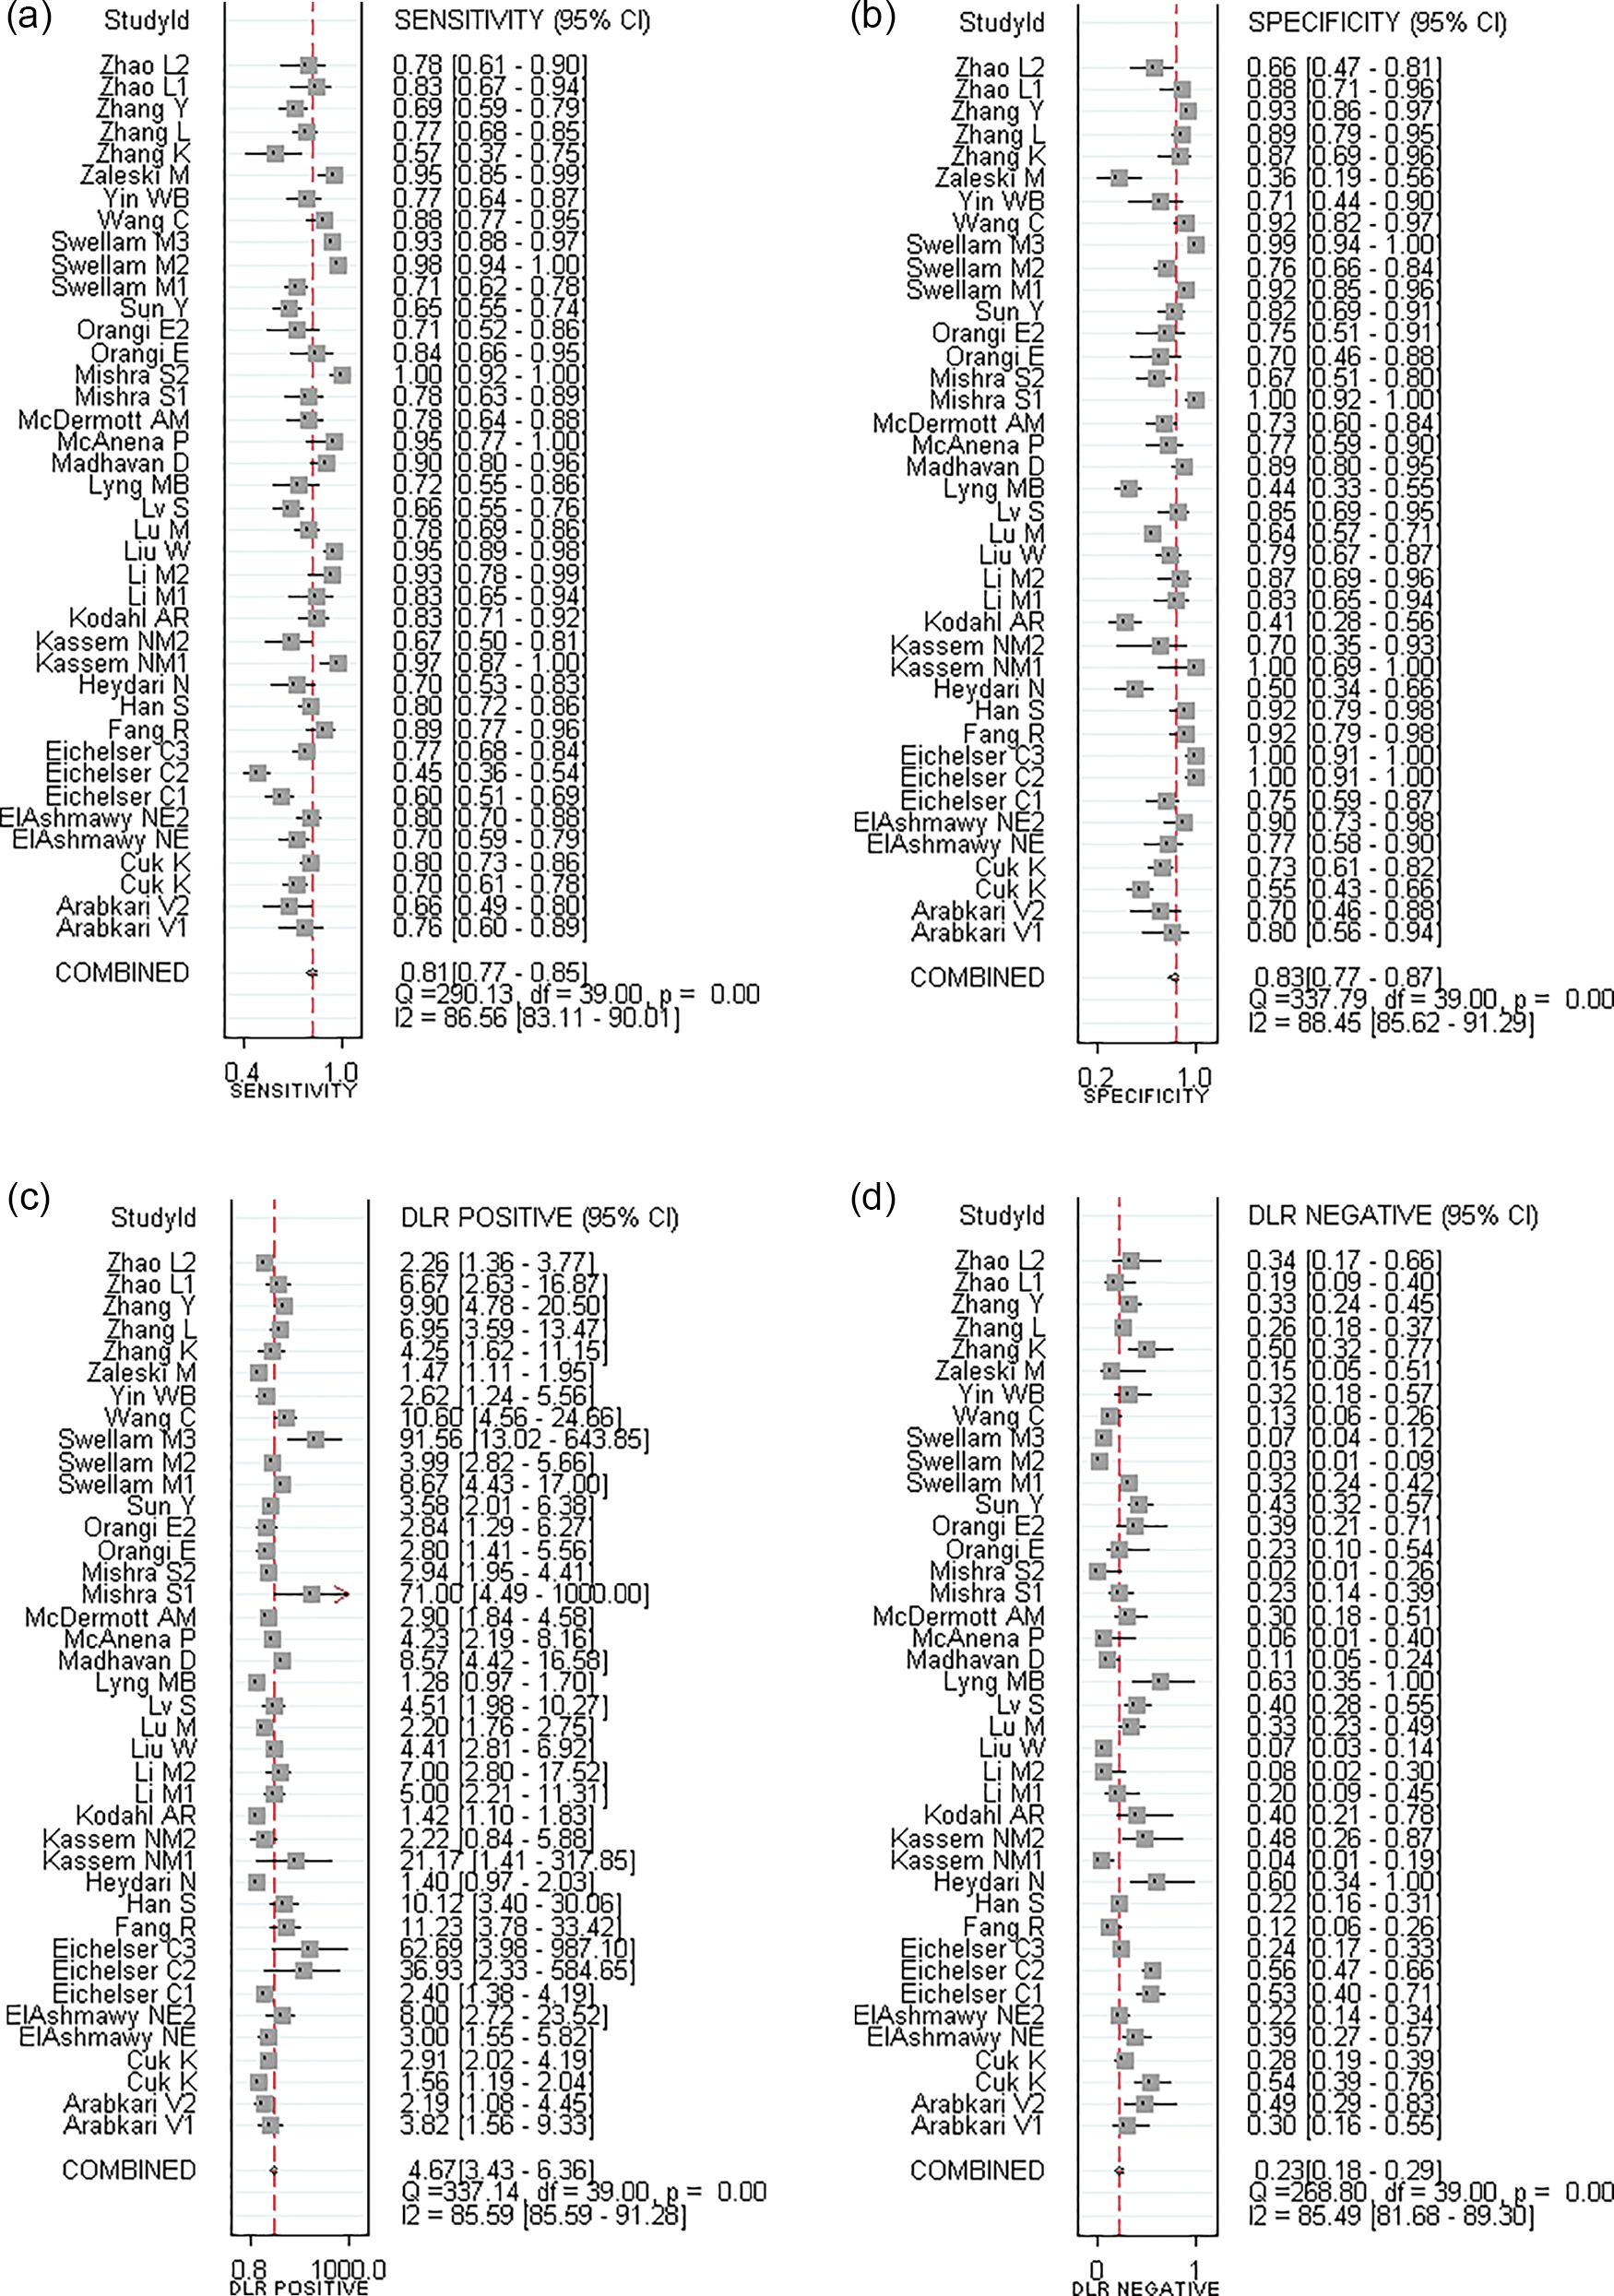
The results of meta-analysis in all studies for BC diagnosis. The forest plots of (A) SEN, (B) SPE, (C) PLR, (D) NLR, (E) DOR, and (F) AUC. (G) Funnel plot to evaluate publication bias. (H) Bivariate boxplot to detect the heterogeneity.
Metaregression analyses
Analysis result of diagnostic threshold includes the following, the spearman correlation coefficient is –0.017 less than 0, and P value is 0.919 more than 0.05. It indicates that the heterogeneity is not caused by threshold effect.
This study used metaregression (Meta-Disc) to find the potential sources of heterogeneity, including the TNM stage, lymphatic metastasis (tumor invasion), subtypes of BC (ER, PR, and HER2), invasion, ethnicity (Asian), types of blood samples, or ncRNA. Metaregression analysis was performed for each exclusion by decreasing P value, Table 4. The result suggested that the subtype of BC (HER2) and types of ncRNA (miRNA) were the major cause of heterogeneity. There are only 16 studies reported the association of expression of ncRNA with clinicopathological features. The significant association with HER2 (P = 0.012) and miRNA (P = 0.016), but not with ER (P = 0.625), PR (P = 0.802), blood (P = 0.697), TNM (P = 0.393), invasion (P = 0.973), and Asian (P = 0.486) is shown in Table 4. Among them, P value of the HER2 and miRNA groups is lower than 0.05; it implied that HER2 and miRNA groups may be the reason for the heterogeneity.
Metaregression noncoding RNAs associated with TNM stage, subtype of BC (ER, PR, and HER2), invasion, Asian, types of blood samples, or ncRNA
Studies = 40.
Add 1/2 to all cells of the studies with zero.
We also show the construction of a bivariate boxplot, which is a useful tool for the detection of heterogeneity for each study (Fig. 2H). There are six studies not located in the boxplot, including six miRNAs (Eichelser C2, miR-93; Eichelser C3, miR-373; Mishra S1, miR-195-5p; Mishra S2, miR495; Swellam M2, miR222; Zaleski M, miR34a). We further excluded these six studies and found by influence analysis and detection in Table 5. After exclusion, the level of SEN, SPE, DOR, NLR, and PLR shows a little change. The results confirmed that these six studies were not the cause of heterogeneity.
The value of SEN, SPE, PLR, NLR, DOR, AUC, and study number in different groups
Therefore, we performed a subgroup analysis for the expression of ncRNAs in HER2 and miRNA groups.
Subgroup analysis
Types of ncRNA (miRNA)
Among the 40 studies, 34 studies explored the association with 57 miRNA expressions. Thirty-four studies involving 1,855 patients investigated the diagnostic values of ncRNAs as the biomarker association with metastasis or invasion, and the meta-analysis of the SEN, SPE, DOR, and AUC was plotted, using a random-effects model (I2 > 50%). The pooled SEN ( Fig. 3A), SPE (Fig. 3B), PLR (Fig. 3C), NLR (Fig. 3D), DOR (Fig. 3E), and AUC values (Fig. 3F) were 0.83 (95% CI: 0.78-0.87), 0.83 (95% CI: 0.76-0.88), 4.79 (95% CI: 3.36-6.86), 0.21 (95% CI: 0.16-0.28), 22.88 (95% CI: 13-38), and 0.89 (95% CI: 0.86-0.92), respectively. Also, the funnel plot suggested that the publication bias had no significant impact on assessment (P = 0.57) (Fig. 3G).

The results of meta-analysis in subgroup of the studies for ncRNA association with type of ncRNA (miRNA). The forest plots of (A) SEN, (B) SPE, (C) PLR, (D) NLR, (E) DOR, and (F) AUC. (G) Funnel plot to evaluate the publication bias.
Subtypes of BC (HER2)
Six studies including 345 patients evaluated the expression of ncRNAs as diagnostic biomarkers for the subtype of BC (HER2) with significant differences (P value less than 0.05). The meta-analysis of the SEN, SPE, PLR, NLR, DOR, and AUC was performed for ncRNA association with TNM stage. The random-effects model was used for analysis (I2 > 50%). The pooled SEN ( Fig. 4A), SPE (Fig. 4B), PLR (Fig. 4C), NLR (Fig. 4D), DOR (Fig. 4E), and AUC values (Fig. 4F) were 0.83 (95% CI: 0.66-0.93), 0.90 (95% CI: 0.79-0.95), 8.29 (95% CI: 3.8-18.05), 0.19 (95% CI: 0.08-0.41), 44.75 (95% CI: 12.46-160.78), and 0.94 (95% CI: 0.91-0.95), respectively. The funnel plot suggested that publication bias had no significant effect on diagnostic assessment (P = 0.11) (Fig. 4G).

The results of meta-analysis in subgroup of the studies for ncRNA association with subtype of BC (HER2). The forest plots of (A) SEN, (B) SPE, (C) PLR, (D) NLR, (E) DOR, and (F) AUC. (G) Funnel plot to evaluate the publication bias.
Other subgroup analysis
Other groups, although not the cause of heterogeneity, were also analyzed using meta-analysis, including TNM stage, invasion, ethnicity (Asian), source of samples (plasma or serum), and subtype of BC (PR or ER). Using random effect models, the pooled SEN, SPE, PLR, NLR, DOR, and AUC values list in Table 5.
In all of the above subgroups, the ER group shows a high level of SEN value, and the HER2 group shows high level of SPE and AUC values.
Discussion
There is no meta-analysis on the expression of ncRNAs in the blood system of breast tumor patients by now. In this study, we collected studies on the expression of ncRNAs in blood system of breast tumor patients from 40 studies, including 32 miRNAs,12–19,21–26,28,30,34,40 four lncRNAs,37–39 and one circRNA44 upregulated, and 12 miRNAs19,20,27,29,32,33,35 and 1 lncRNA40 downregulated. In this meta-analysis study, the diagnostic value of ncRNAs was evaluated as biomarkers for breast cancer in blood, serum, and plasma. As for the overall ncRNAs expressions, the pooled SEN, SPE, PLR, NLR, DOR, and AUC values were 0.81 (95% CI: 0.77-0.85), 0.83 (95% CI: 0.77-0.87), 4.67 (95% CI: 3.4-6.4), 0.23 (95% CI: 0.18-0.29), 21 (95% CI: 13-32), and 0.89 (95% CI: 0.85-0.91), respectively. Among all ncRNAs that were investigated in this study, miRNA-34a showed sufficient diagnostic accuracy (AUC: 0.995; SEN: 0.974; SPE: 1) in plasma of BC patient.
The above results showed that ncRNAs indicated diagnostic biomarkers for breast cancer. However, it should be noted that there was substantial heterogeneity in the pooled estimates. We performed the metaregression based on the variables, including clinicopathological features, heterogeneity boxplot, source of samples (plasma or serum), ethnicity (Asian), and subtype of BC (PR or ER). The value of SEN, SPE, PLR, NLR, DOR, and AUC is listed in Table 5. When we excluded six studies out of heterogeneity boxplot, the value of SEN, SPE, and AUC changed limitedly.
Two groups of tumors evaluated repeatedly, which were divided into two subgroups: MiRNA, and HER2 group. The miRNA group included 34 studies, and only six studies were excluded. This indicates that the ncRNAs in peripheral blood detection are mainly focused on miRNA and few studies on other kinds of ncRNAs. On the one hand, circRNA was discovered later; on the other hand, miRNAs were found in many forms in peripheral blood, with small miRNAs, which were easy to be secreted into peripheral blood. The maximum AUC value of HER2 group was 0.94, indicating that the detection effect of ncRNA in the HER2 group was better, and lncRNA was the main detection factor, accounting for 67%. The level of AUC for the ER group is 0.92, and the highest SEN level was 0.89. However, it is general in PR group among the subtype of BC. These samples in all the studies were taken from three sources: blood, plasma, and serum. Whole blood contains the plasma, white blood cells, and red blood cells. Plasma is the liquid, cell-free part of blood that has been treated with anticoagulants, and the serum is the liquid part of blood after coagulation, devoid of clotting factors as fibrinogen. Therefore, the ncRNA extracted from the whole blood included extracellular and intracellular RNAs. Based on the source of samples, such as blood, plasma, and serum, the value of SEN, SPE, and AUC was no significant difference between these three subgroups.
Additionally, miRNAs and circRNAs are abundant in the circulating.47 Therefore, the amount of ncRNA extracted from different components is not the same. Serum for ncRNAs screening is suitable for breast cancer detection.48 Only one study compared the level of miRNA-155, CA 15-3, CEA, and tissue polypeptide specific antigen (TPS) in serum from a breast cancer patient, when before surgery, after surgery, and after chemotherapy.34 The level of miR-155 increased after surgery and decreased to the preoperative level after chemotherapy; other molecular markers showed no change trend. It has implied that we can use the serum level of miRNA as an indicator for chemotherapy treatment response. Especially in the postoperative treatment of patients, circulating miRNA might evaluate the therapeutic and toxicity effects in breast cancer patients.49 Endocrine therapy is the most effective treatment for ER+ breast cancer, but high rates of hormone resistance limit its effectiveness during treatment.50 For the past several years, ncRNAs have also gained attention as the putative regulators of tamoxifen resistance. Several reports have documented evidence from in vitro, in vivo, or both studies, as well as from the evaluation of clinical samples, to showcase the power of ncRNAs as mediators of tamoxifen resistance and the predictors of disease relapse.51 A significant limitation of using circulating miRNAs as biomarkers is their low abundance.52
Recent studies about meta-analysis indicated that the high lncRNA BCAR4 (breast cancer antiestrogen resistance 4) expression was associated with poor overall survival in cancer patients, including cervical cancer, gastric cancer, colon cancer, osteosarcoma, nonsmall cell lung cancer, excepted breast cancer.53 Other studies have focused on the diagnostic role of long ncRNA (lncRNA) in the tumorigenesis and development of breast cancer.54 These studies have confirmed the value of lncRNAs in tumor diagnosis from different sides. These demonstrate that some kinds of ncRNAs (lncRNA, miRNA, and circRNA) have a great value in clinical cancer diagnosis.
A meta-analysis is a statistical method for combining the results of different studies on the same topic, and it may resolve conflicts among studies.55 As an analysis of analyses, meta-analysis is to be distinguished from reanalysis of primary data either to confirm original findings or to answer new questions.56 It cannot exceed the limits of what is reported by primary researchers. Without access to the original data of reported trials, meta-analysis can neither overcome the bias of underpowered trials toward overstatement of the size of main treatment effects nor the tendency for such trials to falsely conclude that there were no statistically significant adverse events.56 In meta-analysis, the patients in the individual studies can be substantially different concerning diagnostic criteria, geographic region, and the time when the trial was conducted, among other factors.57 Moreover, some including studies usually exclude unevaluable patients. Therefore, the published results tend to overestimate real treatment benefits.58 The heterogeneity variation among studies is due to dissimilarity in the results of individual studies.
Due to the differences of within-study in the cutoff value, there were dissimilarities in the results. By using metaregression, the result suggested that the TNM stage was the primary cause of heterogeneity. The patients of disease severity were not completed. The disease severity of patients was not mentioned.
Breast cancer is a leading cause of death worldwide, and the main reason is the lack of useful biomarkers in early detection. The high prevalence of breast cancer motivates the development of better screening and diagnostic technologies. Serum and plasma are the most common sample for circulating miRNA and other ncRNA detection by qRT-PCR because of tissues not suitable for mass IHC screening. Serum markers were less well established in breast cancer; the most widely used serum markers in breast cancer are CA15-3 and CEA. Other markers include BR27.29 (also known as CA27.29), tissue polypeptide antigen (TPA), and TPS, and also used detection. Nevertheless, these markers’ sensitivity and specificity are low.59
It is a challenge to establish an accurate and reliable panel of circulating miRNAs, circRNAs, and lncRNAs for breast cancer diagnosis, prognosis, and prediction of treatment response. Despite some advances, there is still a significant clinical need for the development and validation of novel biomarkers with higher sensitivity, specificity, and clinical utility.
Conclusion
The circulating level of miRNAs, circRNAs, and lncRNAs for breast cancer diagnosis may be sufficient. However, more clinical data will be needed in the future.
Footnotes
Acknowledgments
Not applicable.