
Abstract
Background:
MicroRNAs (miRNAs) are an emerging class of non-coding endogenous RNAs that participated in multiple cellular processes, including cell differentiation, proliferation and signaling/signal transduction. We would like to scrutinize the contribution for miRNAs in the differentiation and caudalization during neural differentiation.
Methods:
We used well-established protocols to differentiate NTERA-2 (NT2) and human embryonic stem cells (hESCs) into neural progenitor. Bioinformatical analysis were performed to identify pathways regulated by miR-10 family during neural differentiation and caudalization.
Results:
Directed differentiation of NT2 cells under retinoic acid (RA) treatment resulted in profound changes in the HOX cluster gene patterns as expected, resulting in elevation of miR-10 family members embedded within HOX clusters. Loss of function experiments confirmed that downregulation of miR-10a and -10b impaired RA-induced NT2 differentiation and caudalization, with decreased expression of neural markers. In addition, overexpression of miR-10a alone in hESCs drove the caudalization of human neural progenitor cells towards the hindbrain fate. Of note, nuclear receptor corepressor 2 (NCOR2) was identified as the crucial target responsible for the expression of miR-10 family and their action on neural caudalization. Bioinformatical analysis further found that miR-10 incurred dynamic mitochondrial regulation in hESCs-derived neural progenitors.
Conclusions:
Our results drilled into the unexplored epigenetic control by miR-10 in regulating RA-induced neural caudalization. It was believed that such alteration in progenitor cell fate was the result of miR-10 which regulated HOX cluster expression and mitochondrial network along neural differentiation.
Introduction
The formation of large cortex with great complexity in human and nonhuman primates is a critical developmental milestone tightly related to proliferative and/or neurogenic potential of progenitor cells.1 The development of neural tube depends on local patterning signals to define axis; therefore, selectively modulating these signals can differentiate the human embryonic stem cells (hESCs) cultures into any desired neural types. Human embryonic and induced pluripotent stem cells are readily accounted as stable surrogate research tools to recapitulate in vivo conditions for neural development,2 and these hESCs-derived neural cultures are useful in high-throughput drug or microRNA (miRNA) screens to devise appropriate treatment strategies for the complexity in primate-specific neural development defects and neurodegenerative diseases.
Given the abundance in nervous system and their specific expression patterns within different neural cell types during development, miRNAs have emerged as powerful components of the regulatory machinery involved in neural development and homeostasis.3 Dysregulation of miRNA expression was commonly associated with pathophysiological processes, such as cancer, diabetes, and other metabolic complications.4–6 The best-known examples are brain-specific miR-124a and miR-132, both of which were proposed to regulate the RE1 silencing transcription factor that mediates neuronal identity and neuronal morphogenesis.7 In addition, the brain-specific miR-134 that localized to the synapto-dendritic compartment of rat hippocampal neurons was reported to regulate the size of dendritic spines.8
NTERA-2 (NT2) is a clonally derived, pluripotent human embryonal carcinoma cell line adopted as a classical in vitro model to study human neurogenesis due to its succinct tendency to derive neural progenitors under retinoic acid (RA) treatment. These hyperproliferative cells have a tendency to derive into terminally differentiated post-mitotic neuron as judged by their morphology and expression of neural markers under RA treatment in vitro.9,10 Notably, this RA induction protocol heavily influenced the current design of all neural differentiation protocols from human pluripotent stem cells.11 Yet, depending on RA, the single neural morphogen rendered it a difficulty to modulate neural axis patterning, renouncing the utility of this cell line in studying spatiotemporal cues. Nonetheless, it was believed that RA induced NT2 differentiation via an intermediate progenitor state, but little is known about the involvement of miRNAs for its subsequent fate determination.
In this study, we found that RA treatment induced a programmable population of NT2 neural progenitor cells before commitment along the rostro-caudal axis, finetuned by the extent of HOX cluster opening with or without the expression of miR-10 members embedded therein. In the adult CNS brain, rostral is the direction pointing toward the anterior part of the brain, while caudal points toward the posterior part of the brain, both terms of which refer to the opposite ends of the neural tube during early development. We found that repression of miR-10a and miR-10b prevented their coerced action in driving floor plate (FP) caudalization. Similarly, aberrant overexpression of miR-10a in hESCs resulted in early commitment of their derived FP progenitors to a hindbrain terminal post-mitotic fate instead even under directed differentiation into midbrain neurons through a devised protocol.
Within both neurogenic processes, nuclear receptor corepressor 2 (NCOR2) was identified as a target for miR-10a, as evidenced by the luciferase reporter assay and western blotting. The repression of NCOR2 instigated a feed-forward commitment loop for the sustained expression of miR-10 family. Furthermore, sustained overexpression of miR-10a mitigated changes in mitochondrial functions in these hESC-derived FP progenitors. Since mitochondrial dysfunction is implicated in neurodegenerative diseases, our study bridges a missing gap between congenital neural miRNA dysregulation and propensity toward neurodegeneration.
Materials and Methods
Human ESC line H1 (WA01) was produced by Jones and coworkers.12 Fresh or frozen cleavage stage human embryos, produced by in vitro fertilization for clinical purpose, were donated by individuals after an informed consent and after institutional review broad approval. The line was made commercially available from WiCell Research Institute, Inc.
Cell culture and differentiation
Cell lines NT2 and HEK293T of human origins were all obtained from the American Type Culture Collection (Manassas, VA, USA). Passage number of the two cells was from P10 to P20. The cells were cultured in Dulbecco’s modified Eagle’s medium (DMEM) containing 10% FBS, 100 IU/ml penicillin, and 100 μg/ml streptomycin at 37°C in 5% CO2. The human ESC line H1 was maintained with mTeSR medium (05870, StemCell Technologies, Vancouver, BC, Canada) on Matrigel matrix (354277, Corning, NY, USA)-coated plates and passaged using 2X Dispase (STEMCELL) enzyme when it reached 80% confluency. The passage number of H1 used in all the experiments was from P5 to P10.
miRNA mimics/inhibitors transfection and virus production
The mimics control, miR-10a or miR-10b mimics, inhibitor control, and anti-miR-10a or anti-miR-10b inhibitor were purchased from GenePharma (GenePharma Co., Ltd., Shanghai). Transfection of miRNA mimics/inhibits was performed using Lipofectamine RNAiMAX transfection reagent (Life Technologies) according to the manufacturer’s instruction. The pSicoR-Ef1a-mCh-Puro was a gift from Bruce Conklin (Addgene # 31845).13 The pSico was a gift from Tyler Jacks (Addgene plasmid # 11578).14 The AAV-pgk-Cre was a gift from Patrick Aebischer (Addgene viral prep #24593-AAVrg). Sequence of miR-10a was subcloned into pSicoR and pSico vector for virus production. Lentivirus and AAV were prepared as described previously.5 The virus transduction efficiency was determined by titrating HEK293T with increasing amounts of virus.
Neuronal differentiation of hESCs
The in vitro differentiation was achieved following a previous published protocol with minor modifications.15 In brief, hESCs were digested by Accutase (BD Corning) and seeded onto Matrigel-coated plates at a density of 5 × 10⁴/cm2. After 2 days of culture, the mTeSR medium was replaced by FP induction medium [KSR (knockout serum replacement) medium: knockout DMEM (Gibco) containing 15% KSR (Gibco), 1% GlutaMax, 1% MEM nonessential amino acid (NEEA; 100X; Gibco), 10 µM 2-mercaptoethanol; N2 medium: DMEM/F12 containing 1% N2 (100X, Gbico), 1% GlutaMax, 1% MEM NEAA, 10 µM 2-mercaptoethanol] for 11 days.
RNA isolation and real-time PCR
Total RNA, including miRNAs, was isolated using Trizol reagent (Invitorgen, USA) according to standard protocol. The concentration and quality of all RNA samples were evaluated using Nanodrop 2000 (Thermo Fisher Scientific, USA). Reverse transcription PCR was performed using PrimeScriptTM Reverse Transcriptase kit (Takara, Japan). Real-time PCR analysis was performed in an ABI ViiA 7 Real Time PCR System (Applied Biosystem, Thermo Fishier Scientific) using SYBR Green Real Time PCR kit (Applied Biosystems, Life Technologies, USA). Relative expression of target genes was normalized to glyceraldehyde 3-phosphate dehydrogenase (GAPDH), analyzed by the 2–△△Ct method and given as ratio compared with the control. For miRNA expression analysis, RNA was reversed-transcribed with Taqman Universal Master Mix II, without UNG (Thermo Fisher Scientific, USA). RNU6B was used as an endogenous control for the normalization of miRNAs. Standard deviation of at least three measurements was calculated. The sequence of each primer is shown in Supplementary Tables S1 and S2.
Fluorescence imaging
The cultured cells were plated on coverslips and fixed in 4% formaldehyde for 15 min at room temperature (RT) and then washed with PBS for three times. The fixed cells were then permeabilized with 0.2% Triton X-100 in PBS for 30 min and then blocked with 2% goat serum for 1 h at RT. Subsequently, cells were incubated with primary antibodies [anti-FOXA2 (Abcam), anti-LMXA1 (Millipore), anti-TUBB3 (Sigma), anti-MAP2 (Abcam), anti-OTX1/2 (Abcam), and anti-NESTIN (Abcam)] overnight at 4°C. Coverslips were then washed and incubated for 1 h at RT with secondary antibodies including anti-rabbit IgG (coupled with Alexa Fluor 568/488 Life Technologies) and anti-rabbit IgG (coupled with Alexa Fluor 568/488, Life Technologies). Nucleus was stained using Hoechst 33342 (Abcam). After that, the coverslips were mounted on glass slides with mounting buffer (Sigma-Aldrich). Photos were captured using Nikon Live Cell Imaging System Ti-E inverted Fluorescence Microscope. Details of antibodies used were shown in Supplementary Table S3. For mitochondria staining, coverslips were rinsed using PBS and loaded using 100-500 nM of MitoTracker Green FM (Thermo Fisher Scientific, USA) for 15 min. Dyes were diluted in warm PBS from a 1 mM stock in dimethyl sulfoxide. Coverslips were rinsed for 15 min in PBS at RT. Loading parameters were optimized for assessing fluorescence intensity and localization.
Luciferase receptor assay
The 3’-UTR sequences of NCOR2 transcript variant 1 were amplified with primers to incorporate into pSiCheckTM-2 dual luciferase reporter vector and were verified by sequencing. For the luciferase reporter assay, wild type vectors or NCOR2 3’-UTR vectors were transiently co-transfected with miRNA mimics, inhibitors or NC vector into HEK293T cells. Luciferase activity was measured 48 h post-transfection using Dual-Luciferase® Receptor Assay System (Promega). Renilla luciferase activity was normalized with firefly luciferase activity. The final normalized luciferase activity was normalized by 3’-UTR/NC control.
Protein extraction and western blotting
Cells were lysed in ice-cold radioimmunoprecipitation assay buffer (RIPA buffer) containing 2% protease inhibitors and incubated on ice for at least 2 h. The lysates were centrifuged at 12,000 rpm, and supernatant were collected. Western blotting was performed following standard protocol using primary antibodies overnight and then incubated with secondary antibodies conjugated with horseradish peroxidase and visualized using ECL detection kit (K-12045-D20, Advansta, Menlo Park, CA, USA). The protein band intensities were quantified using ImageJ software. The information of antibodies is listed in Supplementary Table S3.
Chromatin immunoprecipitation assay
Chromatin immunoprecipitation was performed using Pierce™ Magnetic ChIP Kit (ThermoFisher, USA). Briefly, NT2 cells were cross-linked by 1% formaldehyde for 20 min and were stopped with 0.125M glycine for 15 min, followed by three washes in PBS. The cells were then resuspended in isotonic buffer supplemented with 1% NP-40 to isolate the nuclei. The nuclei were then resuspended in ChIP buffer and sonicated of 10 cycles of 15s “ON” and 30s “OFF.” After sonication, chromatin was incubated using H3K4me3 (#9751S, Cell signaling Technology), H3K9me3 (ab8898, abcam), and H3K27me3 (#9733S, Cell signaling Technology) antibodies overnight at 4°C on a rotator. Immunoprecipitated complexes were successively washed using washing buffer provided in the kit. All washes were performed at RT on a rotator. After reversing the cross-links, DNA was purified according to the manufacturer’s instruction.
RNA sequencing and data analysis
Genome sequence (version hg19) was downloaded from UCSC (The University of California, Santa Cruz) genome browser. All raw reads were mapped to human hg19 genome using Tophat (v2.1.1)16 with default parameters. Normalized expression value (reads per kilobase per million mapped reads) was calculated by Cufflinks (v.2.2.1)17 using RefSeq gene as reference annotation. Genes with more than 1.5-fold change and false discovery rate (FDR) < 0.05 were used to identified transcriptional modules. The results were visualized with CummeRbund,18 ggplot,19 and pheatmap20 in the R environment. Differentially expressed genes were then subject to Gene Ontology (GO) enrichment analysis and functional annotation using DAVID21 and Reactome software.22
Statistical analysis
Statistical analysis was performed using GraphPad Prism Software®. All data were presented as mean ± standard error of three or more independent replicates. Data were assessed by Student’s t test and one-way analysis of variance test. The P < 0.05 was considered statistically significant.
Results
miR-10a and miR-10b expressions and HOX cluster profiling during RA-induced differentiation of NT2 cells
To explore the functional role of miR-10 family in neural differentiation, we adopted the classical RA-induced NT2 differentiation as the prototype model. Cell morphology showed a successful neuronal differentiation of NT2 cells with RA treatment for 15 days ( Fig. 1A). Pan-neuronal markers including TUBB3, NESTIN, NURR1, and MAP2 were significantly induced in these differentiated cells, as evidenced by the immunostaining and qRT-PCR (Fig. 1B and C).

Expression profiling of HOX cluster and miR-10 family during RA-induced differentiation of NT2 cells. The NT2 cells were exposure to 10 μM RA for 15 days, samples were collected at day 0, 5, 10, and 15 days. (A) Morphology of NT2 cells along neural differentiation upon RA treatment. (B) Immunostaining of TUBB3 and NESTIN in differentiated NT2 cells observed at day 15. (C) mRNA expression levels of selected neural markers during RA-induced differentiation by qPCR. (D) Dynamic expression profile of selected HOX cluster genes during RA-induced neural differentiation. (E) 2D-structue and sequence of miR-10a and miR-10b in different species. (F and G) A dose- and time-dependent induction of miR-10a and miR-10b expressions during RA-induced NT2 differentiation. All data were represented as mean ± SEM, n = 3. *P < 0.05, **P < 0.01, and ***P < 0.001. RA, retinoid acid; HOX, homeobox; qPCR, quantitative polymerase chain reaction. TUBB3, tubulin beta 3 class III; NESTIN,neuroepithelial stem cell protein; NURR1,nuclear receptor related 1; NKX2.1, NK2 homeobox 1; MAP2, microtubule-associated protein 2.
HOX genes are evolutionary highly conserved gene family, which is responsible for driving the differentiation of tissue stem cells toward their respective lineages.23,24 They determine the anterior-posterior body axis in bilateral organisms and influence the developmental fate of cells. To characterize the profile of HOX gene expression during NT2 differentiation, we probed the essential HOX clusters in NT2 cells exposure to RA for different period. Sequential opening of HOX cluster along the anterior-posterior axis was observed in NT2 cells during RA-induced neuronal differentiation (Fig. 1D).
The miR-10a and miR-10b were two important miRNAs found embedded in the proximity of HOXB4 and HOXD4 gene loci, respectively. Indeed, the gene location and mature sequences of miR-10a and miR-10b are generally conserved among mammalian species including human, mouse, and rat (Fig. 1E). In fact, having only a subtle discrepancy in one nucleotide outside the seed sequence between these two miRNAs highly suggested that miR-10a and miR-10b likely share their downstream-targeting profiles (Supplementary Fig. S1). In our study, we found that RA increased the expression of these two miRNAs in both time- and dose-dependent manner during RA-induced NT2 differentiation (Fig. 1F and G).
Suppression of miR-10a and miR-10b expressions resulted in impairment of RA-induced NT2 differentiation
To investigate the roles of miR-10a and miR-10b in RA-induced NT2 differentiation, we performed loss of function experiments and evaluated the morphology of NT2 cells. As shown in Fig. 2A, the miRNA expression levels were significantly reduced by anti-miR-10a (50.12% reduction, P = 0.009) and anti-miR-10b (28.54% reduction, P = 0.0199). Cells in which the expression of miR-10a and miR-10b was reduced showed impaired differentiation, with a reduction of neurites length and increased cell cluster numbers when compared to the control group (Fig. 2B). In addition, the role of miR-10a and miR-10b in neural differentiation was further demonstrated by evaluating their effect on neural markers expression. NT2 cells treated with miR-10a and miR-10b antagonists resulted in impaired neural differentiation, as evidenced by the reduction of pan-neuron makers such as TUBB3, NESTIN, NURR1, NKX2.1, and MAP2 in response to RA treatment (Fig. 2C–E). In summary, our results demonstrated that both miR-10a and miR-10b mediated RA-induced neural differentiation, as evidenced by the neurite outgrowth and neural marker expression.

Loss of miR-10a and miR-10b impaired RA-induced neural differentiation in NT2 cells. (A) The expression level of miR-10a and miR-10b was reduced by their corresponding miRNA antagonists. (B) Morphology of RA-induced NT2 cells was impaired by experimental inhibition of miR-10a and miR-10b expressions. (C) The mRNA expression levels of pan-neuro markers observed at day 15 in each group. Immunostaining (D) and western blot (E) of neural markers observed at day 15 in RA-induced NT2 cells. Semi-quantity of protein levels of TUBB3, NESTIN, and MAP2, normalized to GAPDH. All data were represented as mean ± SEM, n = 3. *P < 0.05, **P < 0.01, and ***P < 0.001.
Overexpression of miRNA-10a and miRNA-10b caudalized neural progenitor cells
The RA-induced caudalization is reported to be associated with suppression of telencephalon, formation of open and enlarged neural tube in the region of midbrain, hindbrain, and spinal cord.25 To investigate the functional role of miR-10a or miR-10b in NT2 cells patterning, we generated lentiviral vectors enabling the overexpression of miR-10a upon the action of Cre.14 NT2 cells were transfected with these vectors and selected by the green fluorescent protein (GFP) markers using the flow cytometry, named NT2/pSico-miR-10a. To investigate the role of miR-10a in caudalization of NT2-derived neural cells, we infected the NT2/pSico-miR-10a cells with AAV-pgk-Cre at day 6 and differentiated these cells toward FP under a modified protocol ( Fig. 3A); cells were then analyzed at day 15 of differentiation. We found that NT2 cultures overexpressing miR-10a displayed reduced gene expression of midbrain (dopaminergic neuron) markers including TH (–80.52%, P = 0.0035), NURR1 (38.19% reduction, P = 0.034), and DAT (62.76% reduction, P = 0.0004), whereas TPH (3.93-fold, P < 0.0001), FEV (1.98-fold, P = 0.0071), and SLC6A4 (3.72-fold, P < 0.0001), which are expressed directly caudal of hindbrain (serotonergic neuron) markers during neural development, were upregulated (Fig. 3B and C).

Overexpression of miR-10a affected caudalization of neuronal progenitor cells. (A) Schematic overview of the workflow showing that NT2 cells were transfected with lentiviral vectors followed by 5 days of differentiation. AAV-pgk-cre was added to the medium to activate miR-10a expression at day 6 during differentiation, and cells were analyzed at day 16. (B and C) The mRNA expression levels of midbrain and hindbrain markers in NT2 cells with or without miR-10a overexpression. (D) Modified protocol for human ESCs (H1 cell) differentiation into floor plate progenitors. (E) Immunostaining of midbrain markers LMX1A and OTX1/2 as well as pan-neuron markers MAP2 in H1 cells observed at day 11. (F–I) The mRNA expression levels of midbrain and hindbrain markers were analyzed in H1 at day 11. The MB markers LMX1A and OTX2 decreased, while the HB markers GBX2 and NKX2.2 increased. All data were represented as mean ± SEM, n = 3. *P < 0.05, **P < 0.01, and ***P < 0.001. ESC, embryonic stem cell; FGF, fibroblast growth factor; SHH, sonic hedgehog; KSR, KO serum replacement; TGFβ, transforming growth factor beta; CHIR, CHIR99021; LDN, LDN193189; NEEA, non-essential amino acids; β-ME, 2-mercaptoethanol. TH, tyrosine hydroxylase; DAT, dopamine active transporter; TPH1, trytophan hydroxylase gene 1; FEV, fifth ewing variant; solute carrier family 6 member 4; LMX1A, LIM homeobox transcription factor 1 alpha; OTX2, orthodenticle homeobox 2; GBX2, gastrulation brain homeobox 2; NKX2.2, NK2 homeobox 2.
The effect of miR-10a on neural caudalization was also examined in human ESC cells (H1). H1 cells stably overexpressed miR-10a (H1/pSicoR-miR-10a), which was selected by puromycin and then differentiated into neuronal FP according to a modified protocol (Fig. 3D).15,26 Remarkably, we observed that cultures overexpressing miR-10a displayed reduced gene expression of the ventral midbrain markers LMX1A (38.67% reduction, P = 0.0281 at day 5 and 54.33% reduction, P = 0.0362 at day 11) and OTX2 (12.56% reduction, P = 0.1371 at day 5 and 59.11% reduction, P < 0.0001 at day 11) (Fig. 3E–G), whereas GBX (10.32-fold, P = 0.0019 at day 5 and 14.30-fold, P < 0.0001 at day 11) and NKX2.2 (3.72-fold, P < 0.0001 at day 11), which are expressed directly caudal of the hindbrain organizer, were upregulated (Fig. 3H and I). FOXA2, the progenitor marker of FP, was significantly reduced by miR-10a (Supplementary Fig. S2), suggesting the role of miR-10a in regulating differentiation and caudalization during neurogenesis. In addition, we found that HOX cluster genes accounted for caudalization of hindbrain such as HOXA1, HOXA2, HOXB1, and HOXB3 were also upregulated by the overexpression of miR-10a during early differentiation stages (Supplementary Fig. S3).
miR-10a drove caudalization though targeting NCOR2
The miRNAs have the potential to regulate multiple target genes, thus controlling complex signaling networks. To identify targets of miR-10a which mediated the neural differentiation and caudalization, a bioinformatics approach based on miRNA data integration was performed. Integrative analysis of common predicted targets from three databases (miRbase targets, Targetscan, and DIANA) was clustered ( Fig. 4A). Among the top candidates clustered from these three databases, NCOR2 was of high interest as the expression was suppressed by miR-10a overexpression in NT2 cells (44.05% reduction, P = 0.0033, Fig. 4A).

miR-10 negatively regulated NCOR2. (A) Intersection analysis among three microRNA target prediction databases enriched NCOR2 as potential target of miR-10 family. Overexpression of miR-10a reduced the mRNA expression level of NCOR2 in differentiated NT2 cells. (B) Complimentary sequences to the seed regions of miR-10a within the 3’ UTR mRNA of NCOR2 conserved among different species (left). Luciferase reporter constructs containing 3’ UTR of human NCOR2 and miR-10a construct were co-transfected into HEK293T cells, and the luciferase activity was normalized to the activity of β-galactosidase. (C) Protein expression level of NCOR2 in NT2 cells with or without Cre recombinase. (D) Knockdown of NCOR2 phenocopied the effect of miR-10a on neuronal caudalization. (E and F) Knockdown of NCOR2 caused a feedback induction of miR-10a and miR-10b expression in NT2 cells. (G and H) Chromatin immunoprecipitation of H3K4me3 and H3K27me3 at the sequence proximal to miR-10a and miR-10b showed decreased H3K27me3 modification, while H3K4me3 was increased. All data were represented as mean ± SEM, n = 3. *P < 0.05, **P < 0.01, and ***P <0.001.
To find out whether miR-10a target the 3’-UTR of NCOR2, we cloned the 3’-UTR region of NCOR2 into a luciferase report vector. Co-transfection of miR-10a mimics with these reporters in HEK293T cells resulted in strong reduction (53% reduction, P = 0.0013) in the activity of the reporter constructs, as compared with the groups transfected with control mimics (Fig. 4B). Further qPCR and western blot confirmed the downregulated expression of NCOR2 in NT2 cells (Fig. 4C and Supplementary Fig. S4). To further investigate the involvement of NCOR2 in miR-10a/b-regulated caudalization, we then transfected the H1 cells with siNCOR2 duplex oligos. We found that siNCOR2 phenocopied the overexpression of miR-10 family; siNCOR2 reduced the expression of midbrain markers while increased the expression of hindbrain markers in the differentiated H1 cells (Fig. 4D), suggesting that miR-10a potentially target NCOR2 to regulate FP caudalization.
Moreover, NCOR2 (also known as SMRT, silencing mediator for retinoid and thyroid hormone receptors) appears to recruit histone deacetylases to DNA promoter regions, suppressing the retinoid acid response element upstream to miR-10a.27 RA caused the dissociation of NCOR2 and activated the transcription of miR-10a&b during neural differentiation. We then transfected the NT2 cells with siNCOR2 along the RA treatment and found that downregulation of NCOR2 maintained miR-10a at a high expression level when compared to group treated with RA alone (Fig. 4E and F). Therefore, RA induced the transcription of miR-10a, which specifically target the 3’-UTR of NCOR2, resulted in the downregulation of NCOR2. The decreased NCOR2, in turn, facilitates to maintain high expression of miR-10 family members.
As dynamic histone modification was reported during neural differentiation, we then further investigated whether RA-induced sequential expression of miR-10a/b was regulated by bi-valent histone modification. Western blot of three histone markers (H3K4me3, H3K9me3, and H3K27me3) showed that total histone modification markers were not significantly affected by RA during NT2 cell differentiation (Supplementary Fig. S5). However, when we further investigate the histone profile of sequence proximal to miR-10a/b using chromatin immunoprecipitation, it showed that RA caused a sustained change of H3K4me3 and H3K27me3 modification at sequence proximal to miR-10a/b in NT2 cells (Fig. 4G and H). H3K4me3 functions as activator to upregulate gene expression, while H3K27me3 exerts opposite effects. We found that RA triggered an induction of H3K4me3 while suppressed H3K27me3, which favored the expression of both miR-10a and miR-10b during neural differentiation.
miR-10a regulated mitochondrial function during neuronal differentiation in hESCs
Furthermore, to identify transcripts that are altered by miR-10 family in the differentiation process of human ESCs into neuron, we performed an experiment based on a short pulse of miR-10a overexpression, followed by RNA-seq and subsequent bioinformatic analysis. H1-miR-10a OE cells were differentiated toward FPs for 11 days with the modified protocol (Fig. 3D). Cells differentiated into 11 days were collected for RNA isolation and used for RNA-seq. The sequencing reads were mapped to human genome, scale-normalized and subsequently analyzed for differentially expressed transcripts. We found that miR-10a resulted in alteration of mRNA levels for most of the putative miR-10 targets ( Fig. 5A). High-confidence miR-10 targets in hESCs contained several neural-favored transcripts, which are likely to influence brain development and the mitochondrial network (Fig. 5B and C). GO analysis concordantly showed that most of the miR-10a targets were related to neurodegenerative diseases such as Parkinson’s disease, Alzheimer’s diseases, and Huntington’s diseases (Supplementary Fig. 6).
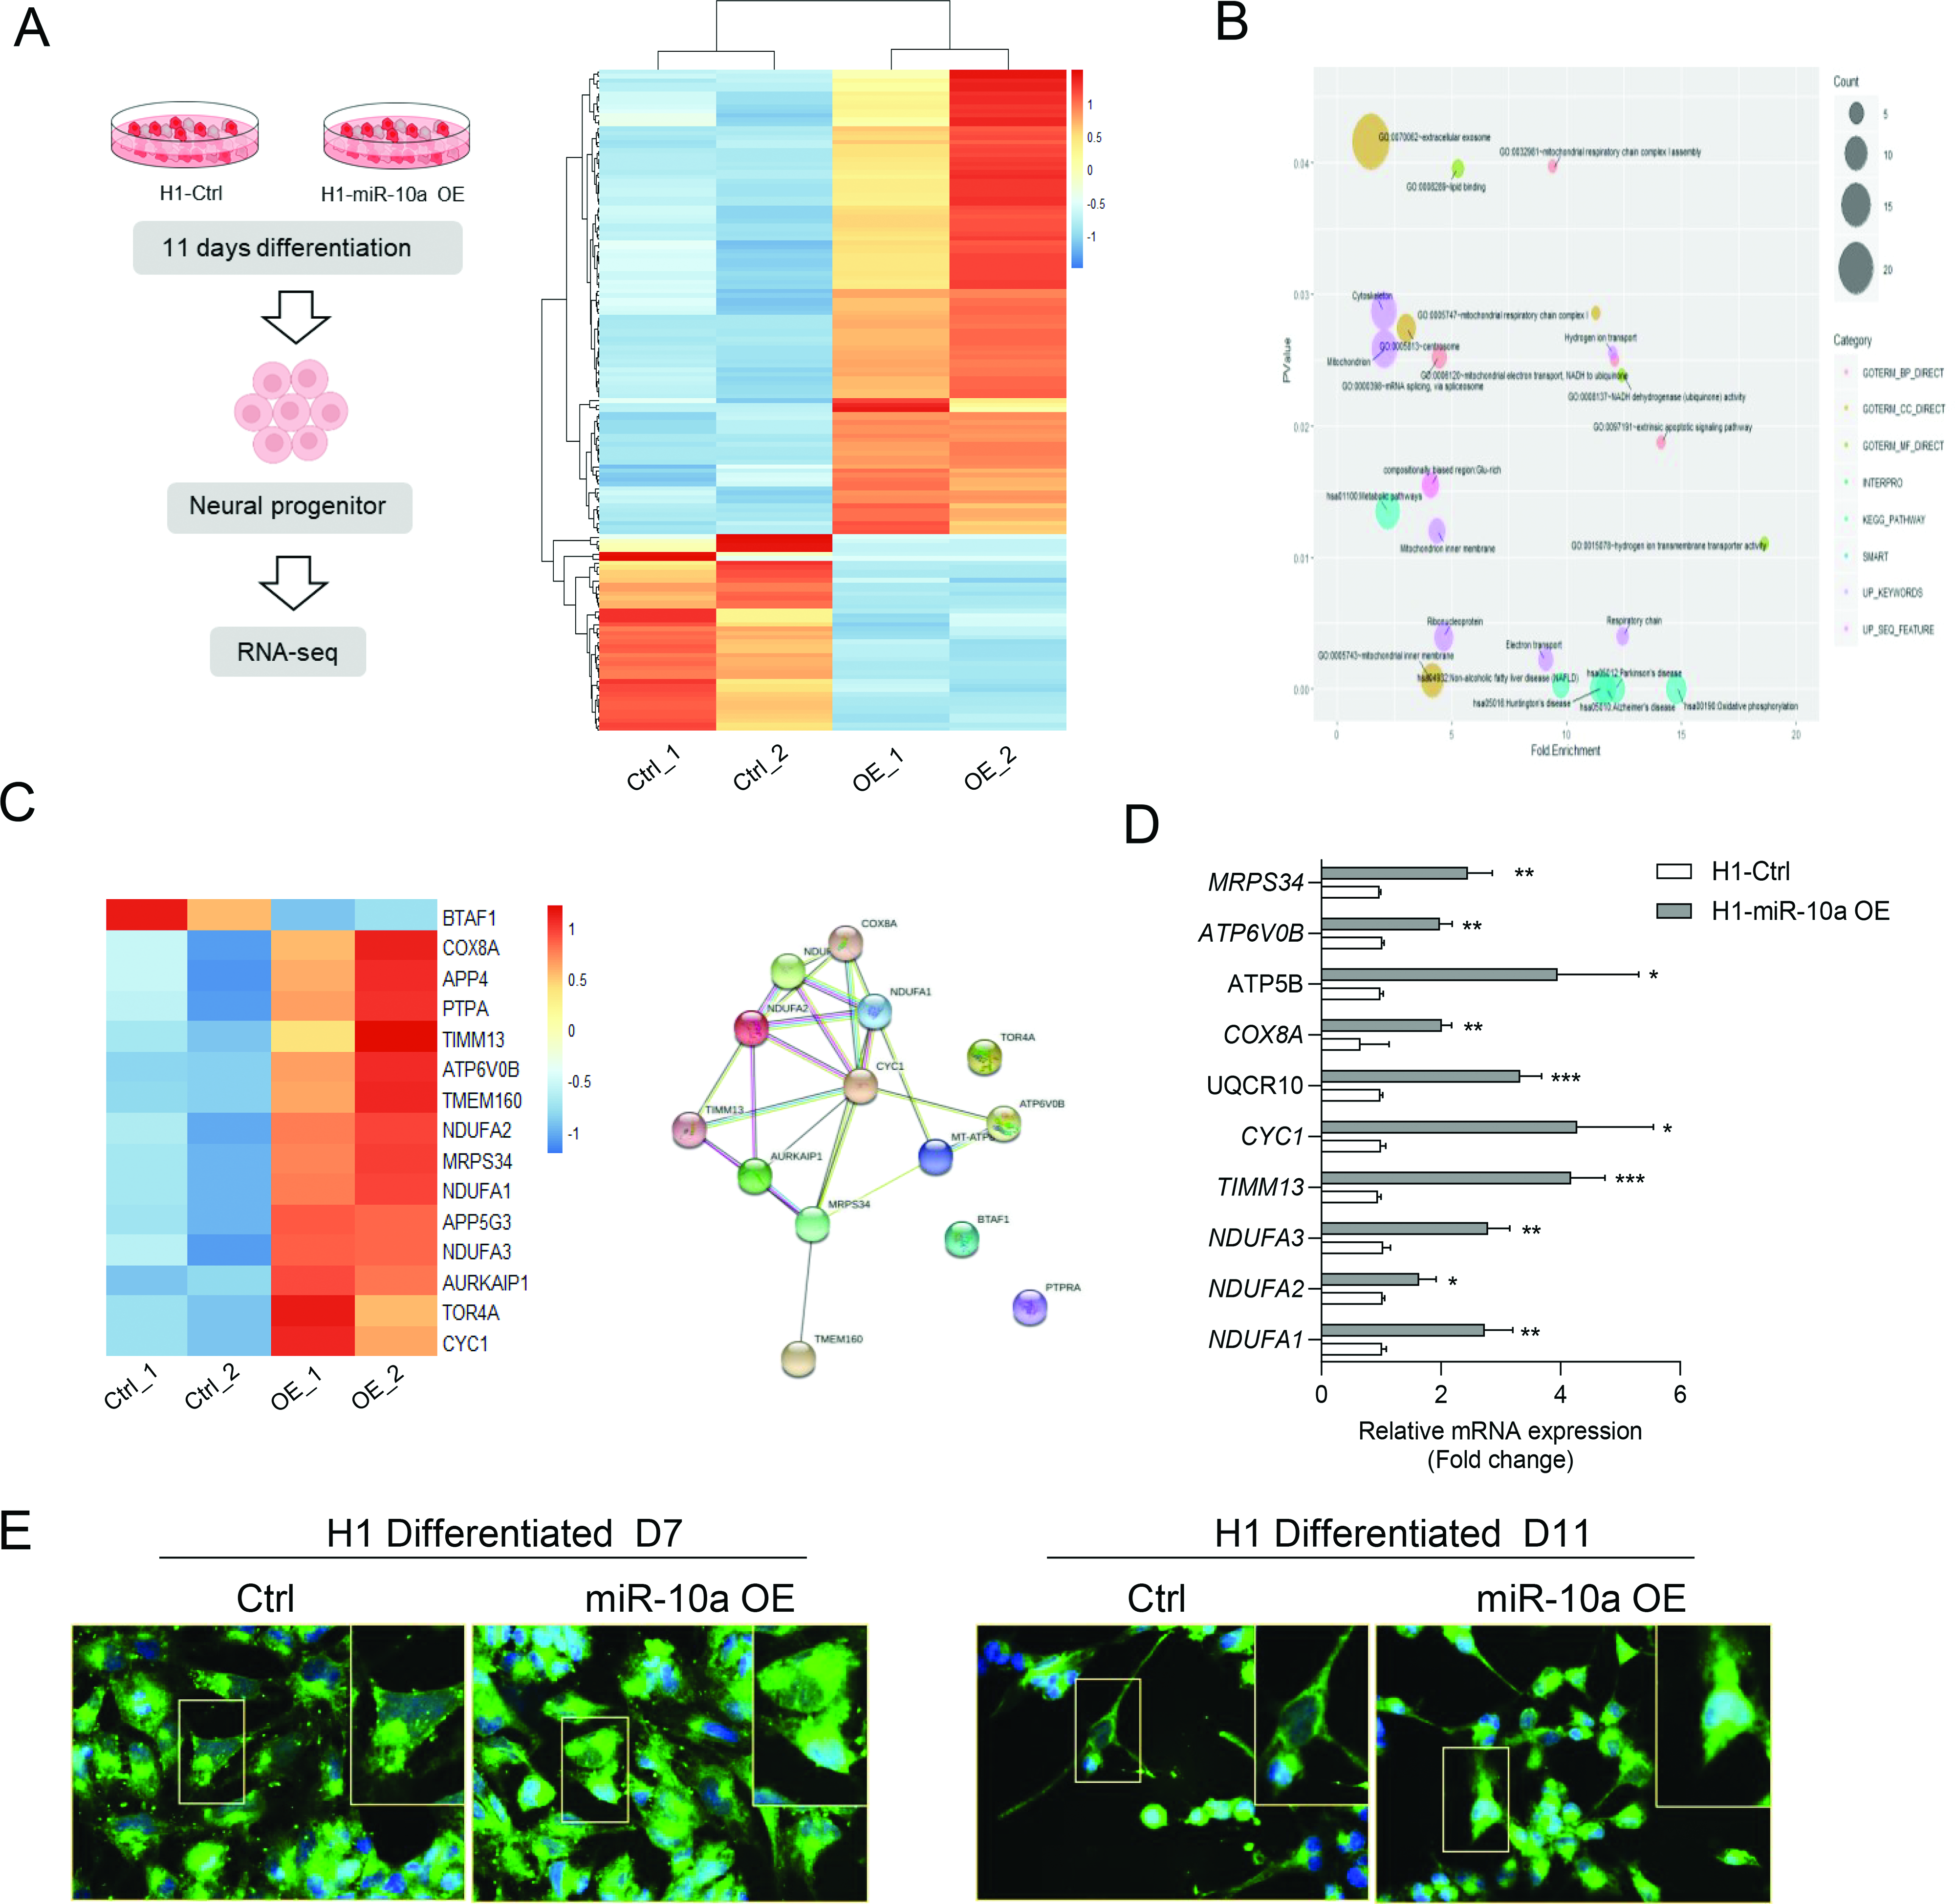
miR-10a regulated mitochondrial network during neural differentiation. (A) Schematic overview of the experiments. H1 cells with miR-10a overexpression were differentiated into floor plate progenitors according to previous protocol (left). Clustering images showing global gene expression profiles and relationship analyzed by hierarchical clustering (right). (B) Pathway enrichment analysis identified mitochondrial-associated processes regulated by miR-10a. (C) Expression profile of mitochondrial-associated genes from DEGs. (D) The mRNA expression levels of genes related to mitochondrial metabolism in differentiated H1 cells observed at day 11. (E) Representative images for mitochondria staining for H1-derived neural differentiation at day 5 and day 11, with or without miR-10a overexpression. All data were represented as mean ± SEM, n = 3. *P < 0.05, **P < 0.01, and ***P < 0.001. KEGG, kyoto encyclopedia of genes and genomes; DEGs, differential expressed genes. MRPS34, mitochondrial ribosomal protein S34; ATP6V0B, ATPase H+ transporting V0 subunit B; ATP5B, ATP synthase F1 subunit beta; COX8a, cytochrome C oxidase subunit 8A; UQCR10, ubiquinol-cytochrome c reductase; CYC1, cytochrome C1; TIMM13, translocase of inner mitochondrial membrane 13; NDUFA, NADH:ubiquinone oxidoreductase subunit A.
We also found that the overexpression of miR-10a resulted in upregulation of genes associated with mitochondrial regulation, such as NDUFA1/2/3, CYC1, and ATP6V0B, which are critical for the differentiation and patterning of brain neurons (Fig. 5D). Finally, given the important role of mitochondria in neural transmission and function, we evaluated the mitochondria morphology and amount using the MitoTracker dye in H1 cells differentiated into FP progenitors. miR-10a overexpression resulted in a higher intensity of mitochondrial signaling at both day 7 and day 11 along neural differentiation when compared to the control group (Fig. 5E), which is in line with the upregulation of mitochondrial metabolic association genes detected by qPCR.
Taken together, these data identify a large network of genes regulated by miR-10a in hESCs differentiating into FP progenitors. Modulation of miR-10a during differentiation initiated broad and complex regulatory network, including midbrain/hindbrain patterning via the regulation of NCOR2 and mitochondrial metabolism.
Discussion
In mammalian neural development, distinct classes of neural progenitors are specified by morphogen gradients for patterning precise anatomical location along the dorsal-ventral and anterior-posterior axes of the neural tube.28 Hox cluster, a family that comprises of 39 closely related genes, played an important role in patterning the neural tube, spinal cord, and branchial arches.29,30 In addition to the protein encoding Hox genes, some miRNAs such as miR-10, miR-196, and miR-615 are embedded within the Hox clusters in an evolutionarily conserved manner.31,32 Fox example, miR-10 family members (miR-10a and miR-10b) were found to be embedded in the HOXB and HOXD clusters, with a suppression effect on HoxB1a and HoxB3a in zebrafish.33 In our RA-induced neural differentiation cultures, we found that the expression of miR-10a and miR-10b was strongly correlated with neighboring Hox genes (Fig. 1D). The co-regulatory expression was in line with a previous report demonstrating a gradual surge of miR-10 expression along RA-induced smooth muscle cell differentiation.34
Modulation of miR-10 levels was reported to affect a large number of genes, resulting in broad transcriptional changes,35–37 suggesting its potential involvement in anterior-posterior patterning during normal development. In our models, we found that loss of miR-10a or miR-10b impaired RA-induced NT2 terminal differentiation, manifested with reduced expression of pan-neuronal markers. In addition, we demonstrated that miR-10a participated in caudalization of the neural tube by silencing NCOR2 in NT2- and H1-derived neural progenitor cells. This caudalization was further evidenced by the downregulation of midbrain specific genes and upregulation of genes specifically expressed in hindbrain (Fig. 3F–I).
NCOR2, a well-documented nuclear receptor transcriptional corepressor, was identified as a novel validated target of miR-10 family. It was reported to redundantly mediate the ability of RA to repress FGF signaling, affecting the development of midbrain-hindbrain boundary.38 As such, its regulated expression across this axis likely defined the gradual morphogenic changes conforming to the caudalizing actions of miR-10. We found that knockdown NCOR2 with siRNA showed an impaired differentiation and caudalization of neuron progenitor cells, probably reinstated the implicated role of NCOR2 in neural caudalization (Fig. 4D). In addition, a feedforward activation in miR-10 under RA treatment could be explained by the presence of consensus RA regulatory elements in the promoter regions of miR-10 family (Fig. 4E and F). The reinforcement of RA transcriptional control when NCOR2 is silenced would serve as an irreversible shunt from retrieving rostral identity.
The DNA and histone modifications, together with constraints imposed by nuclear architecture, contribute to the transcriptional regulatory landscape of the neuronal network.39 RA level seemingly corresponded to the histone modification within Hox cluster. Here, we examined the change of H3K4me3, H3K9me3, and H3K27me3 in the nearby sequence of miR-10 family with chromatin immunoprecipitation. The H3K27me3 repressive markers were downregulated around both the HOXB4 and HOXD4 region in which the miR-10 family members embedded correspondingly, where maximum H3K4me3 activation marker is observed by RA induction in NT2 cells along neural differentiation (Fig. 4G and H). These confirmed the epigenetic regulation of miR-10 family members in the neural differentiation, resulting in the shift from midbrain dopaminergic neuronal-like cells to attain hindbrain identity.
In addition, the significance of mitochondrial dynamics in neural development has been described in the animal brains. Disrupting genes accounting for mitochondrial respiratory and fission resulted in defects of brain development.40 Recent studies also demonstrated that mitochondrial morphological changes occurred from NSCs within the developing brain and adult brain.41 In our studies, we found that the overexpression of miR-10a altered signaling pathways related to neurodegenerative diseases and mitochondrial metabolism in hESCs-derived FP progenitors (Fig. 5B). Genes associated with mitochondrial respiration and energy metabolism were upregulated by miR-10a, showing an active status of mitochondria along neural differentiation (Fig. 5D and E).
In summary, exposure of NT2 cells to RA caused prominent changes in the expression of miR-10 family members, which is intertwined to the efficacy of differentiation and caudalization in neural progenitor cells. Moreover, the confirmation of NCOR2 as a direct target of miR-10 supports the emerging function of FGF signaling and bivalent histone marker changes in neural differentiation context of the neural tube during early embryonic development.
Conclusion
We investigated the role of miR-10 family members in FP caudalization in hESCs-derived neural tube and revealed that dynamic histone modification of miR-10 loci governed neural differentiation and caudalization. FP progenitors demonstrated differential mitochondrial gene expression with accelerated maturation under miR-10 overexpression, which corresponded to a terminal post-mitotic neuronal fate.
Footnotes
Acknowledgment
The pSicoR-Ef1a-mCh-Puro was a gift from Bruce Conklin (Addgene # 31845). The pSico was a gift from Tyler Jacks (Addgene plasmid # 11578). The AAV-pgk-Cre was a gift from Patrick Aebischer (Addgene # 24593).