
Abstract
Composite health indicators are valuable tools to assess population health over time and identify areas for intervention. This scoping review (ScR) aimed to map the literature describing comprehensive health-related metrics used to assess community health. The Arksey and O’Malley framework was used to conduct the ScR, using the following steps: identifying the research question, identifying relevant studies, charting the data, collating and reporting results. United States-based studies that developed/utilized a composite health index using geographic information system (GIS) mapping capabilities to assess community health at the county level or more granular were identified through literature searches conducted in PubMed and EMBASE databases. Literature searches identified 5112 articles; of these, 8 studies describing composite health indices were included. The number of indicators used in each index ranged from 4 to 75 (median: 22). Health outcomes, health behaviors, education, and economics were incorporated into most indices. High school graduation rate (n = 6 indices), health insurance status (n = 5), commute time, median household income, unemployment, and obesity rates (n = 4 each) were the most common indicators across indices. All indicators were derived from publicly available data sources, such as the American Community Survey and US Census Bureau. Although a limited number of community health indices were identified in the ScR, the indices included a broad range of indicators covering both health outcomes and factors contributing to health vulnerabilities. The public data sources and GIS integration of the indices provide potential for broad, insightful applications to various contexts across the United States.
Introduction
Holistic assessment of community health is important for several reasons, including understanding the health status of individuals within a particular area, evaluating program effectiveness, identifying potential health problems, measuring health trends over time, and making decisions about resource allocation. Given the multidimensional nature of health and its determinants, a summary measure of health comprised of several health-related indicators, could be utilized as an objective and standardized screening tool to gauge the general health of a community, or compare multiple communities to target areas for intervention. Although there are informative population health-related indices such as gross national health product, disability-adjusted life years, and healthy life expectancy, among others, these measures are typically available at the national or larger-scale population level. 1,2 Many of these indices do not provide information at the community level, including neighborhoods and census tracts. Some indices are also limited in scope as they do not capture information on broad aspects of health. Health risk scores (i.e., Charlson’s Comorbidity Index) based on administrative medical claims data also have limitations (i.e., selection bias and lack of a mental health component in some scores). 3 In addition, medical claim-related health indices, in some instances, are focused exclusively on reimbursement related risk-adjustment application or social factors. 4 As community-level health and its determinants can vary drastically across small geographic areas given differences in factors such as population distribution or other demographic characteristics, education, dietary patterns, and health care access, more granular health indices are needed for informed decision-making. Furthermore, despite the increasing incorporation of geographic information system (GIS) tools into analysis and visualization of health data, there is limited literature on the current state of science with regards to the utilization of GIS-based measures of health at the community level.
Several systematic and scoping reviews (ScRs) have been published regarding population-level health indices 1,5 ; however, no published reviews aimed to fully gauge the scope of the literature on community-level health indices were identified. Areas that need further clarity include the context and purpose of community health indices, methodology of development, rationale of included component indicators, and applications. The objective of this ScR is to map the available literature describing indices, scales, and other comprehensive health-related metrics (comprised of multiple indicators) used to measure and/or rank health at the community level.
Methods
A study protocol was developed and registered on Open Science Framework (https://osf.io/qup2g) on October 16, 2023, before initiating the ScR. The ScR was conducted in accordance with the framework proposed by Arksey and O’Malley and further refined by the Joanna Briggs Institute. 6,7 The Preferred Reporting Items for Systematic Reviews and Meta-analyses guidelines-extension for scoping reviews (PRISMA-ScR) 8 were followed in all aspects of the preparation, conduct, and reporting of this review.
Eligibility criteria
As recommended by the Joanna Briggs Institute,
7
the eligibility criteria used to determine relevant studies were organized by population, concept, and context: Population: Studies of United States resident populations were eligible. Concept: Relevant studies needed to develop or use a health-related index or measure that could be utilized to measure/rank the general health status of communities to be included. Context: The health-related indices examined in the studies had to be applicable to US communities at the county, zip code, census tract, or census block level with GIS mapping capabilities. Descriptive epidemiological studies including observational cohort studies, case control studies, cross-sectional studies, and ecologic studies and editorials or letters to the editor were included. Clinical trials, interventional studies, and conference abstracts were excluded. Furthermore, studies published before 2013 or in languages other than English were excluded.
Study identification, screening, and abstraction
An initial search was conducted to analyze the titles and abstracts of the resulting articles and refine the search terms. The final search strategy, conducted on October 16, 2023, is provided in Table 1, with a 10-year publication restriction. Study selection, including screening and data extraction, was conducted using DistillerSR software, 9 which resulted in a reproducible, transparent, and auditable process. One reviewer screened the titles and abstracts of the search hits using the predefined eligibility criteria. Two reviewers independently assessed the full text of the studies deemed relevant at the title and abstract stage; conflicts were resolved by consensus adjudication. Studies determined to be eligible by both reviewers were extracted in DistillerSR using an extraction form developed as part of the ScR protocol. Extracted data elements included: study characteristics such as study design, location, and eligibility criteria; research objectives; information on the index including purpose, methods of development, and health indicators used; and strengths, limitations, and lessons learned from the study as reported by the authors. One reviewer completed the initial data extraction and another reviewer checked the data elements for accuracy. A senior reviewer resolved any disputes. Bibliographies of relevant reviews were hand-searched for additional relevant articles that were not identified by the searches.
Literature Search Strategy
Wildcard used to include variations of the search term.
Results
Article identification
Figure 1 shows the PRISMA flow diagram, which details the study inclusion at each stage. Searches yielded 8794 hits; after deduplication, 5112 hits were screened at the title and abstract level. Screening of the abstracts against the study eligibility criteria resulted in 56 studies that were reviewed at the full-text stage; one additional study was added to the full-text review after checking the bibliographies of relevant review articles. Evaluation of these 57 articles at the full-text level resulted in exclusion of 49 studies: 34 did not use a community health metric, 10 studies were conducted in populations outside the United States, 3 analyzed spatial units larger than county, and 2 were review articles. In total, eight studies met the predefined eligibility criteria and thus were included in the review. 10 –17
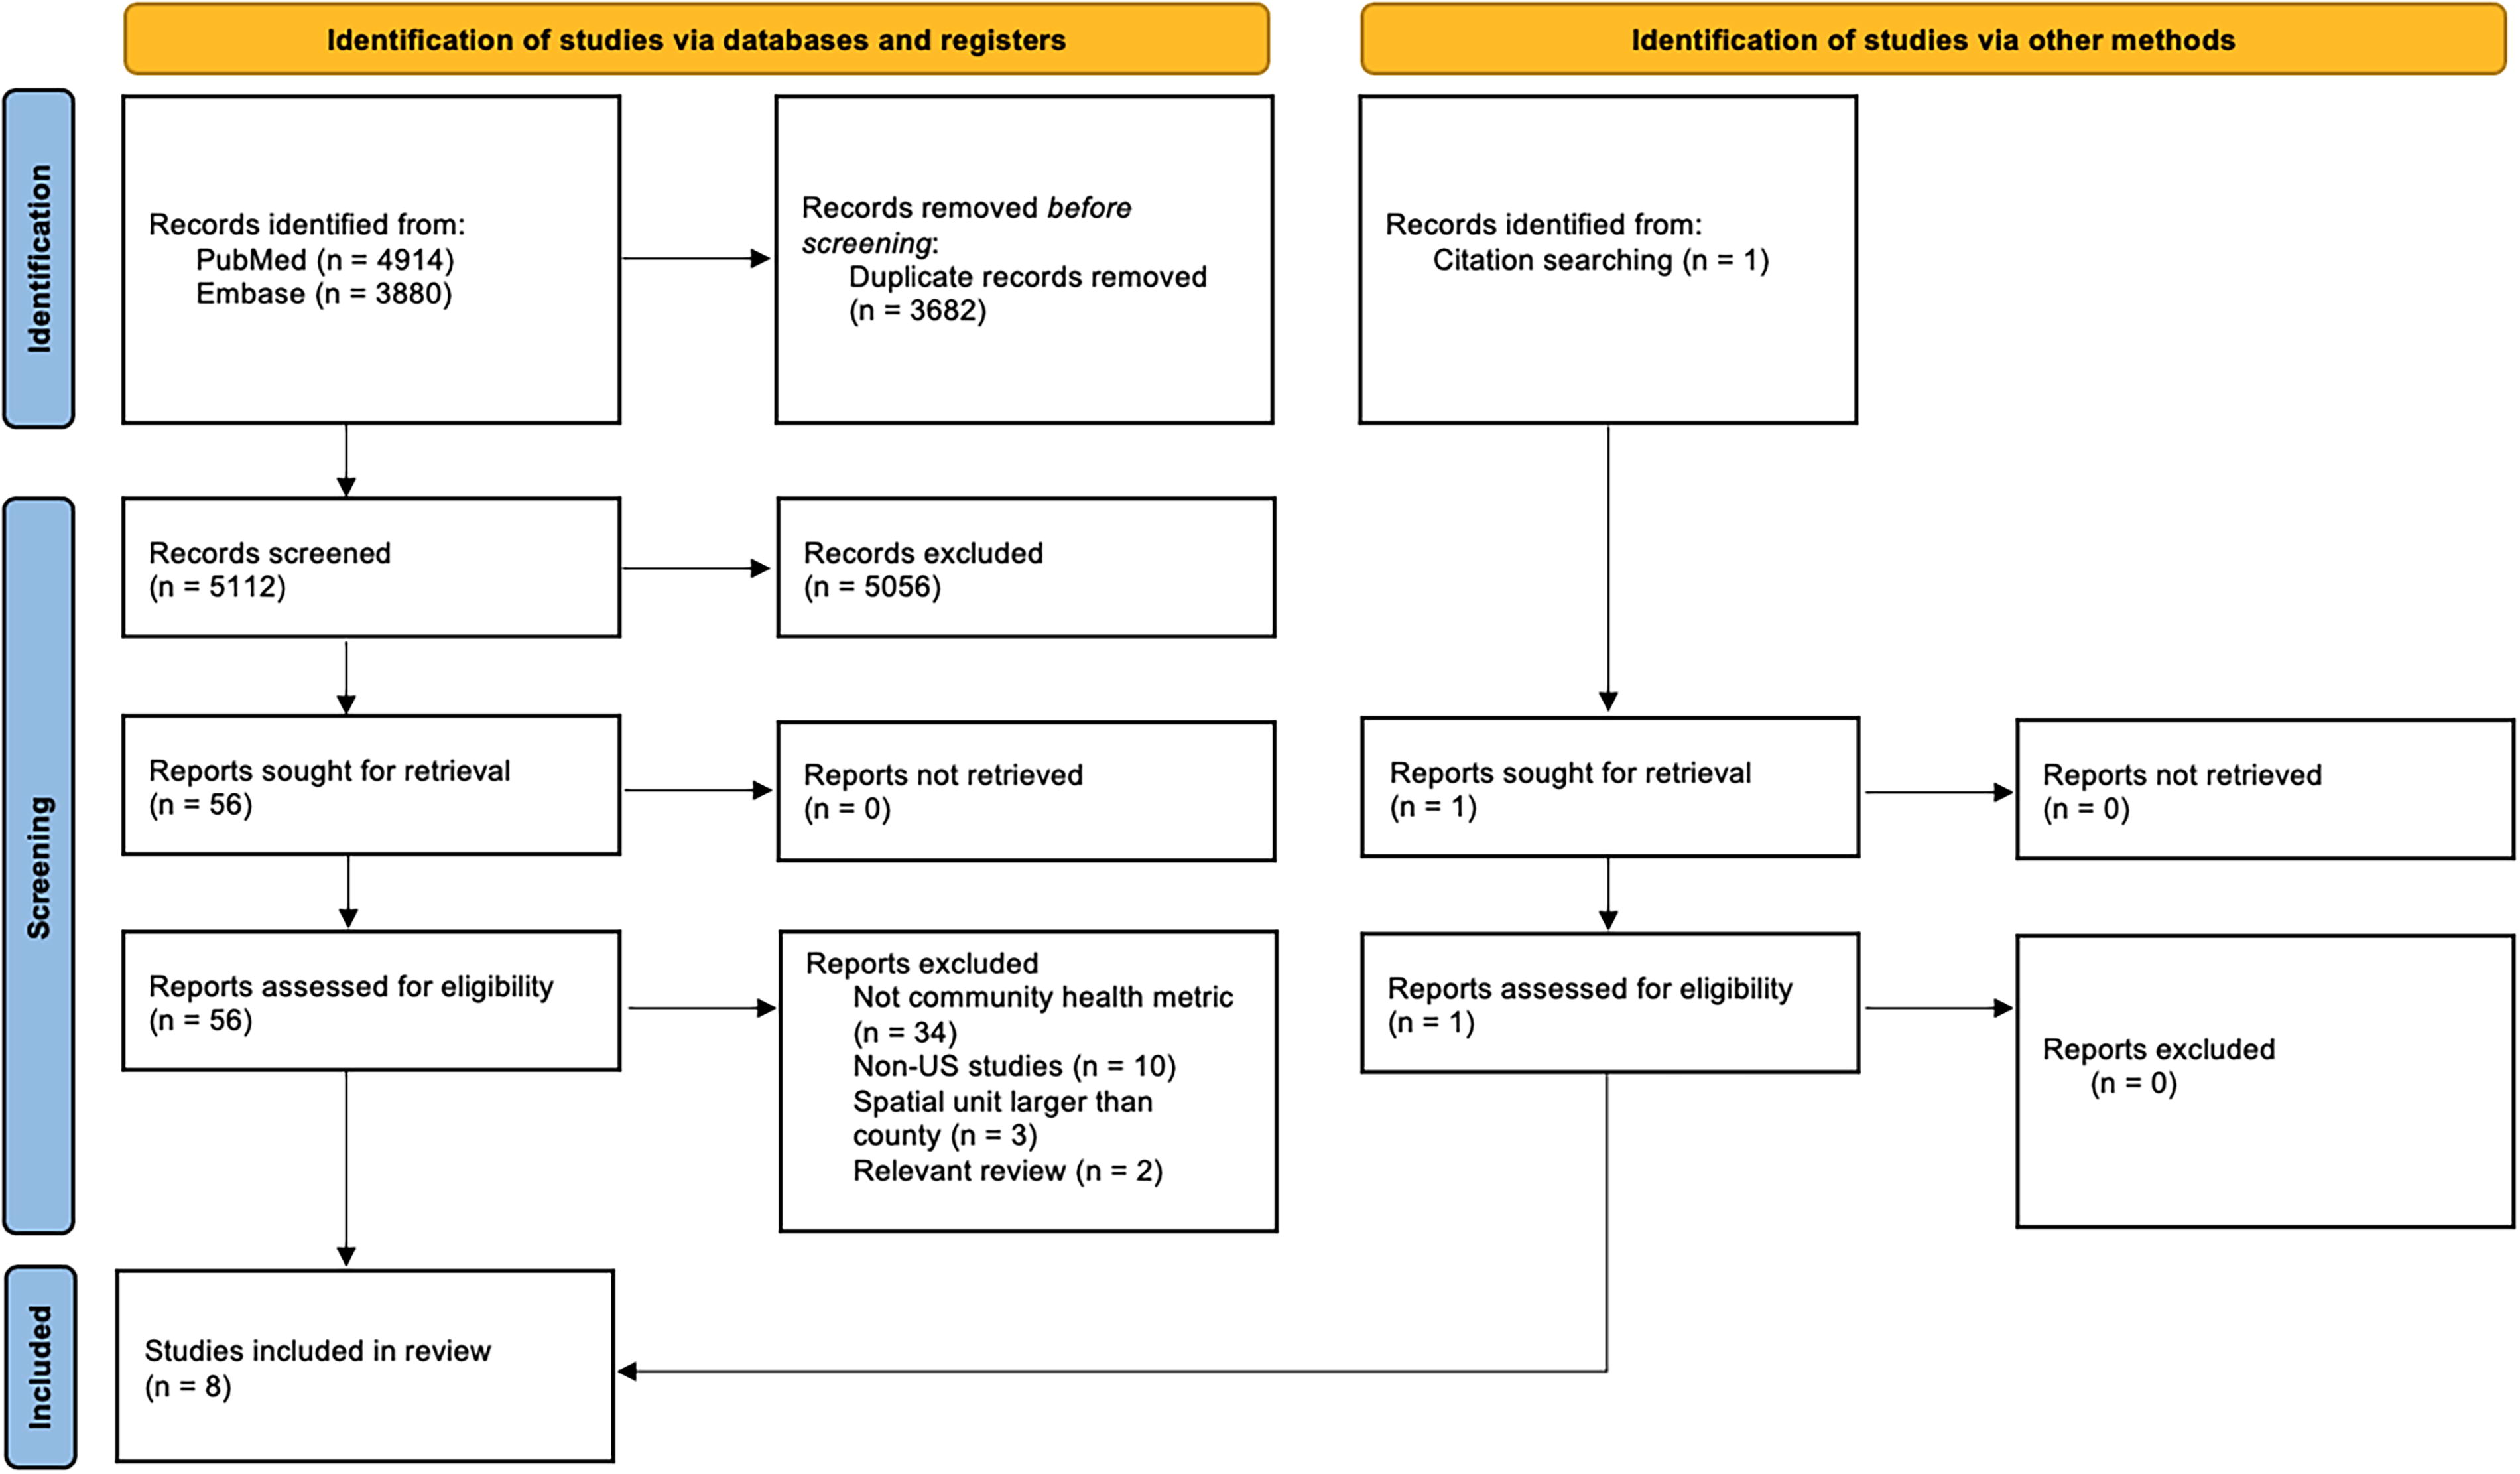
Study flow diagram.
Study characteristics
Characteristics of the included studies are presented in Table 2. Eight composite health indices were identified across the included studies. The spatial unit of analysis for each index was census tract (n = 3), zip code (n = 1), county (n = 3), or multiple geographic categories (e.g., county, census tract, and/or municipality; n = 1). Most of the indices were developed by the study authors as part of the study, but three studies used indices that had been developed and published previously. 14,16,17 We focused our review on indices based on populations and data from the United States. Three studies examined health across the nation, 13,14,17 whereas the remaining studies focused on one geographic area, such as Puerto Rico, 16 North Carolina, 11 Alaska, 10 Detroit, Michigan, 12 and New York, New York. 15
Characteristics of the Included Studies
Redlining was a program used by the Home Owners’ Loan Corporation in the 1930s that created maps to classify neighborhoods by perceived level of lending risks, where red was designated as most hazardous. Red areas included higher proportions of non-White residents.
ACS, American Community Survey; BRFSS, National Cancer Institute Behavioral Risk Factor Surveillance System; CDC, Centers for Disease Control and Prevention; FBI, Federal Bureau of Investigation; NCHS, National Center for Health Statistics; NOAA, National Oceanic and Atmospheric Administration; NVSS, National Vital Statistics System; STD, sexually transmitted disease; TB, tuberculosis; WONDER, Wide-ranging ONline Data for Epidemiological Research; UN, United Nations; US, United States; USDA, United States Department of Agriculture.
The number of indicators included in the indices varied widely with a range of 4–75 (median: 22) (Fig. 2). The categories of indicators included in each index are described in Table 3. The majority of indices included indicators for health behaviors (e.g., tobacco and alcohol use, lack of health insurance), health outcomes (rates of chronic diseases, obesity, life expectancy), economics (median income, poverty rate, unemployment), and education (percent graduated high school, adult literacy, child test scores). The most commonly included indicator was high school graduation rate (education), which was included in six of the eight indices. 11 –16 Measures of health insurance (health behavior) were included in five of the eight indices. 10 –12,14,15 Four of the indices included measures of commute time (transportation), median household income (economics), unemployment rate (economics), and obesity rate (health outcomes). 12 –15 Three indices included measures of life expectancy, diabetes rate (health outcomes), children in poverty, poverty rate (economics), adult smoking, physical activity, and rates of alcohol consumption (health behaviors). 10,16,17
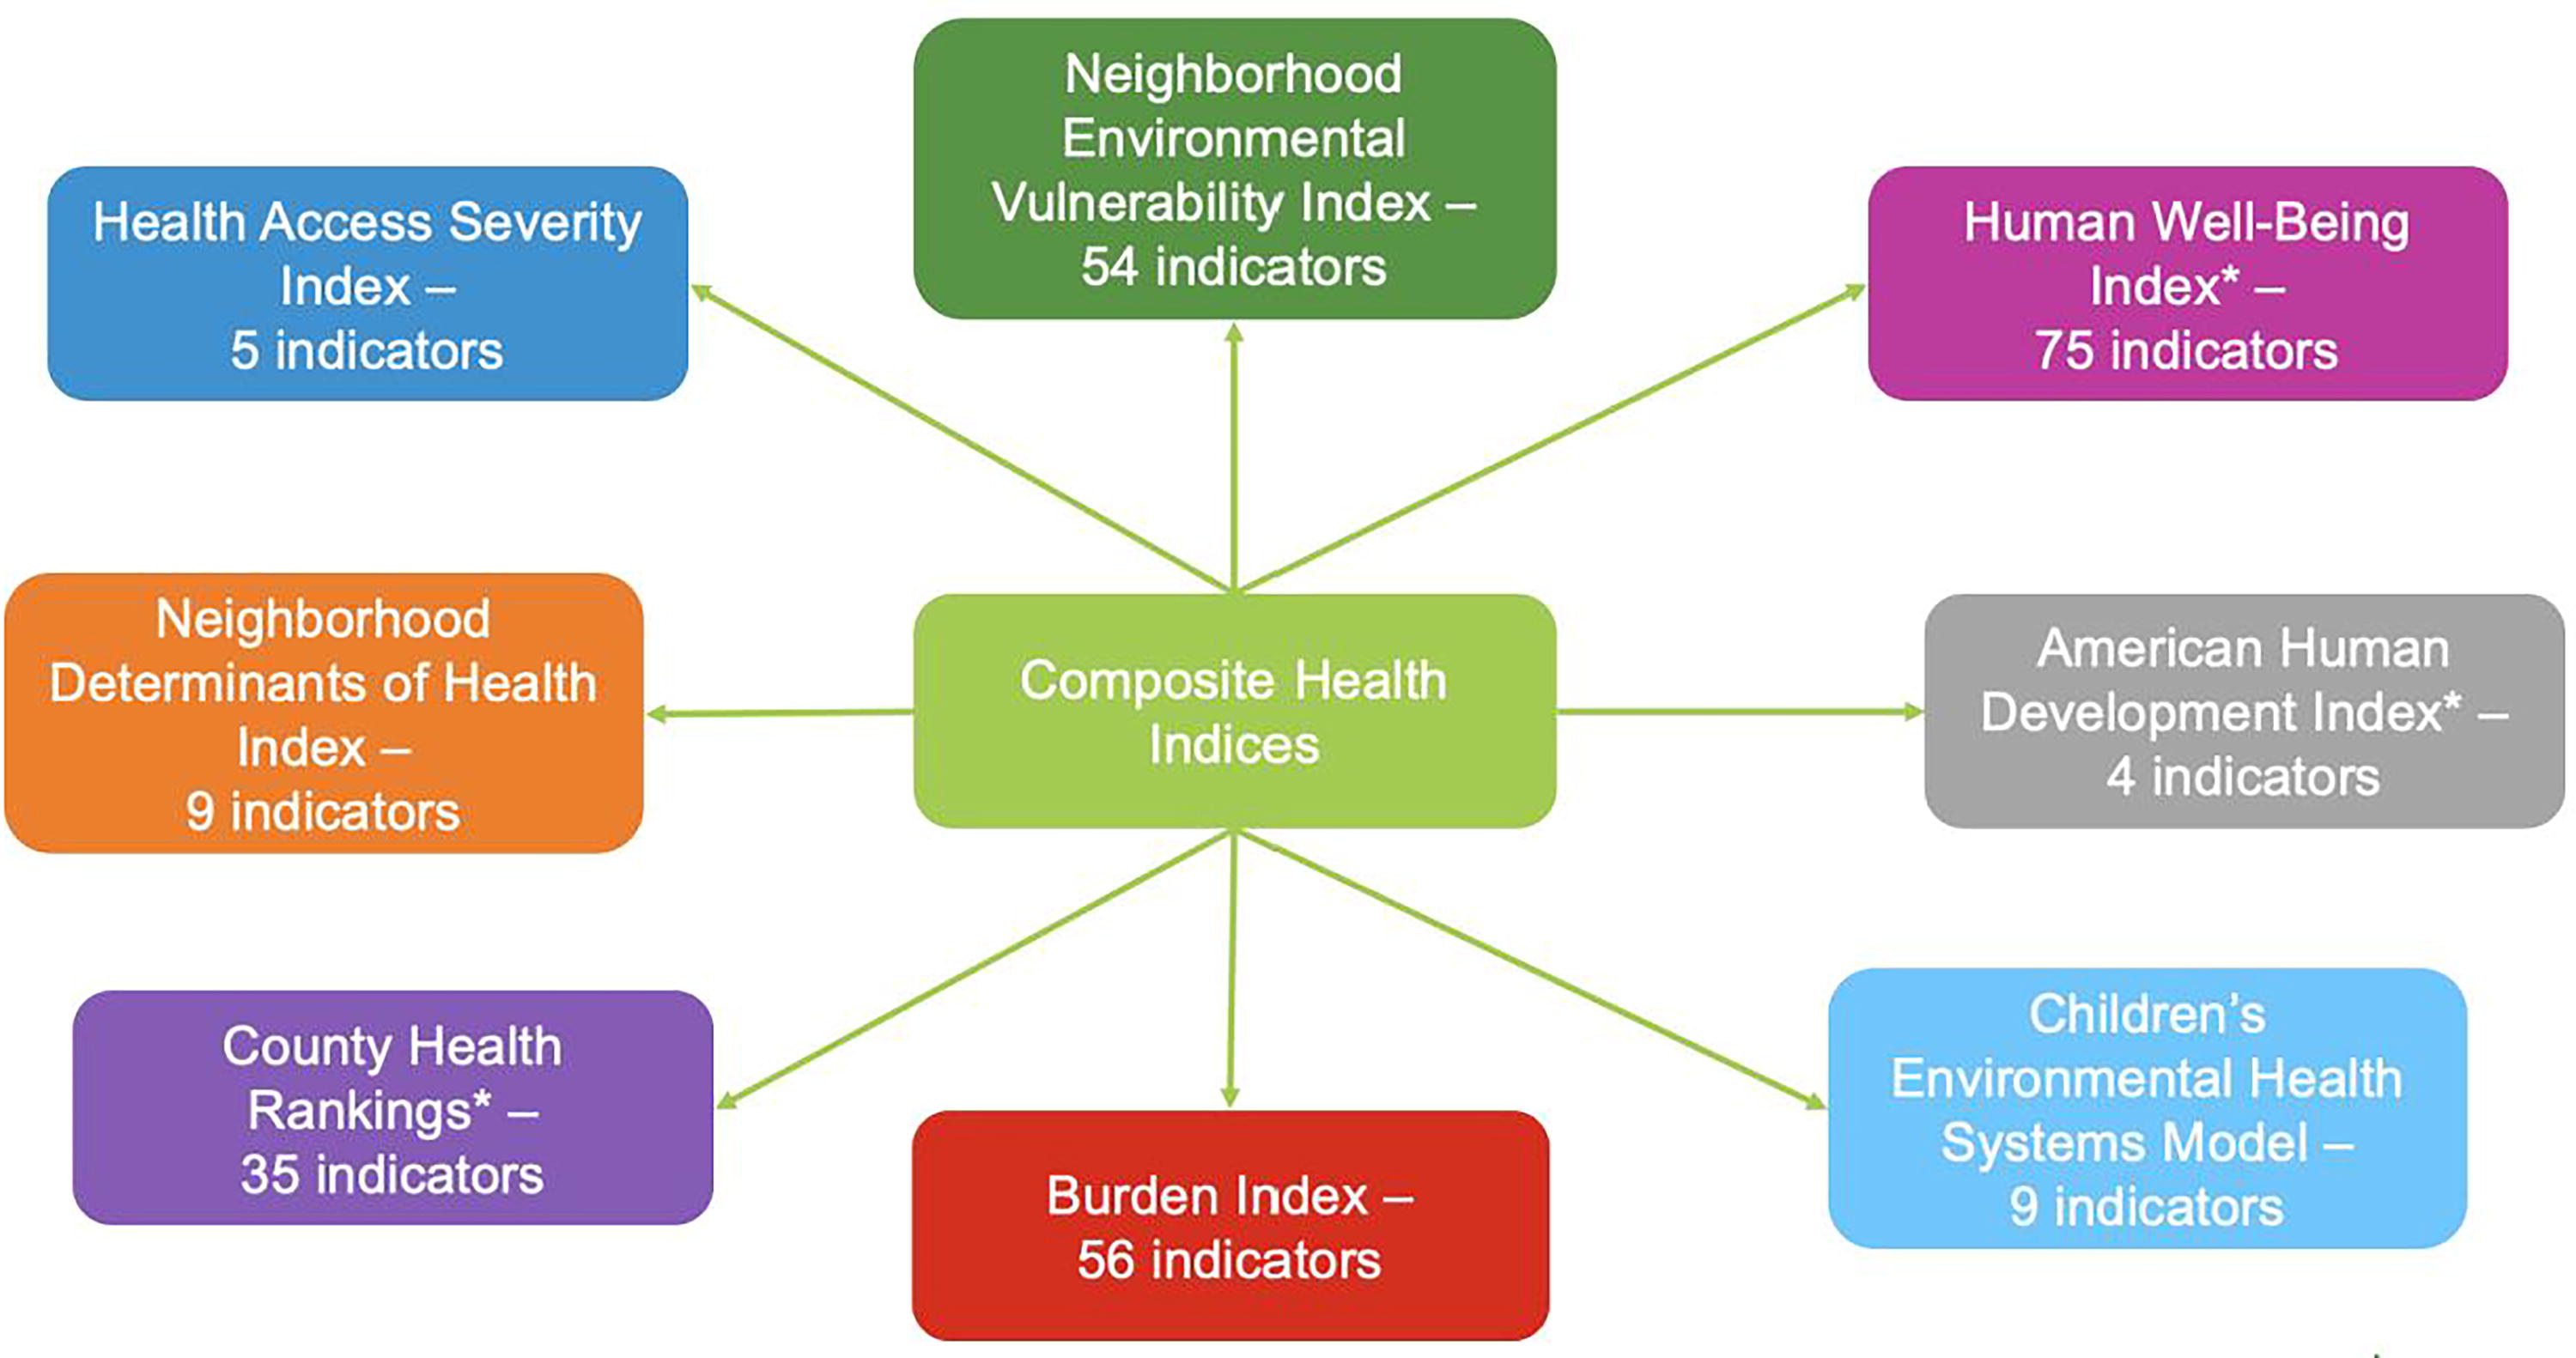
Variability in the number of indicators used for each index. *The methodologies for these indices were published previously.
Summary of Indicators Included in Each Index
The methodologies for these indices were previously published.
All of the included indices used indicators derived from data sources that were publicly available. The number of different data sources for each index ranged from 2 to 23 (median: 3.5). Several data sources could be applied nationwide (e.g., American Community Survey [ACS)], Behavioral Risk Factor Surveillance System [BRFSS], Centers for Disease Control and Prevention Wide-ranging ONline Data for Epidemiological Research [CDC WONDER]), while others were specific to certain regions (e.g., North Carolina Department of Environmental Quality, Puerto Rico Statistics Institute). Descriptions of each composite health index identified in this ScR are provided below.
Descriptions of identified composite health indices
The American Human Development Index (HDI) 17
The American HDI was developed in 2008 as part of the Measure of America project of the Social Science Research Council. 18 The most recent report of this project was released in 2018 with results from the previous 10 years of data. 17 Although the methods supporting this index do not appear to be published in the peer-reviewed scientific literature, they were published with the 2018 report. 19 The American HDI Index comprises three dimensions, all using US government data sources: health (life expectancy at birth), access to knowledge (net school enrollment for ages 3–24, degree attainment for those aged 25 and older), and living standards (median personal earnings for those aged 16 and up). First, a subindex was created for each of these three dimensions with minimum and maximum values (goalposts) chosen for each underlying indicator. The goalposts were determined based on the range of the indicator observed on all possible groupings and considering possible increases and decreases in years to come. These were then adjusted to achieve a balance in the final index. All three dimensions of the American HDI were weighted equally. The American HDI was calculated by taking the simple average of the health, education, and income indices. As all three components range from 0 to 10, the HDI itself also varies from 0 to 10, with 10 representing the highest level of human development.
Data utilizing this index are publicly available for use and are continually updated to monitor population health. Measure of America has published dozens of reports using this index on their website (https://measureofamerica.org/) since its inception in 2008 to continually monitor population health at various levels, including national, state, community, and topic-specific reports.
Burden Index 13
The Burden index was created to quantify the environmental burden of cancer across the United States at the county level using social determinants of health and population health indicators. The authors referred to the “environmental burden” as socioeconomic, demographic, and other contextual community indicators that may contribute to variations in cancer mortality rates by county. In total, 56 indicators were included in the final analysis, including data on poverty, income, food access, segregation, social capital, and demographic characteristics. Using principal component analysis, the large number of variables was reduced into groupings of correlated indicators (factors). These factors were added to calculate the final burden index for each county, with each factor weighted equally. Burden index values were categorized into very low, low, average, high, and very high burden, with higher values indicating higher burden and mapped across the United states, along with overall cancer mortality rates. The composite index and individual factors were regressed on the outcome of cancer mortality rates to determine what proportion of the variance in the rates was determined by the index as well as which specific factors explained the variance in cancer mortality by county. The authors found that the Burden index was significantly associated with cancer mortality rates. No other studies that used this index were identified in the peer-reviewed literature.
Children’s Environmental Health Systems Model 11
The Children’s Environmental Health Systems Model was created as a vulnerability index to evaluate children’s environmental health in North Carolina counties. The model included indicators chosen to represent different aspects of children’s environmental health, including physical environment (percent of homes built before 1979, number of Brownfield sites, number of Superfund sites), social environment (percent of children in poverty, percent of heads of household without a high school diploma, percent of children without health insurance), and health (percent of low birthweight births, percent of children under age 15 with asthma-related hospital discharges, percent of children under age 2 with elevated blood lead levels). Development of the model was based on the approach of the Toxicological Prioritization Index (ToxPi), 20 a free application funded by the Environmental Protection Agency (EPA) and the National Institutes of Health, which combines multiple geospatial features into vulnerability indices across various spatial scales. The approach allows researchers to combine indicators to address issues that are specific to the needs of a particular community. The ToxPi graphical user interface tool was used to normalize the data and calculate an index score for each county, weighting each indicator equally. A higher score indicated greater vulnerability. The scores were used in a hierarchical clustering analysis of counties with similar vulnerability and mapped using ToxPi GIS software. No other studies that used this index were identified in the peer-reviewed literature.
County Health Rankings 14
To understand to what extent the spatial heterogeneity in health outcomes is attributable to spatial heterogeneity in health factors or effects of neighboring counties across the United States, the County Health Rankings (CHR) data source was utilized. 14 The CHR is a publicly available database of county-level health outcomes and health determinants for every county in the United States developed by the University of Wisconsin Population Health Institute and the Robert Wood Johnson Foundation. 21 The CHR model characterizes both indicators of health and outcomes. In total, 35 health indicators were grouped into four domains—health behaviors, clinical care, social and economic, and physical environment. Each indicator was derived from a national data source such as the ACS or BRFSS, standardized into z-scores, and combined with weights predefined by the CHR model into composite scores for each of the four domains. Weighting of each indicator by the CHR was guided by multiple considerations, including a review of the literature around the impact of various factors on health outcomes, weights used by other rankings, author analyses of the variation of outcomes explained by each factor, and stakeholder engagement. 21 The outcome composite score included standardized z-scores for length of life (50% weight), low birthweight (20% weight), and poor/fair health, poor physical health days, and poor mental health days (each weighted 10%). Higher health outcome scores represented poorer health. In addition to the composite scores, county-level demographics were also considered in analyses, including race/ethnicity, sex, age, and population size. Geographically weighted regression models were used to assess the relationship between health outcome composite scores, health factor composite scores, and county demographics for each county. Geographic weighting meant that regression coefficients were allowed to vary spatially across counties.
The CHR publishes National Findings Reports each year, tracking aspects of health by county across the country (https://www.countyhealthrankings.org/findings-and-insights/county-health-rankings-reports). In addition, many studies have been published that analyzed CHR data on a variety of specific health outcomes. Some examples include examining factors that influence childhood overweight/obesity 22 or life expectancy changes, 23 or the relationship between incarceration rates and poor mental health. 24
Health Access Severity Index 10
The Health Access Severity Index (HASI) was developed to evaluate how GIS can be used to identify vulnerable populations with decreased access to health care in Alaska, and specifically, access to medical imaging. This analysis was designed for program planning of airship-based radiology services for underserved, remote communities. The HASI was comprised of two indices, the Health Severity Index and the Access Severity Index. Scores from the two indices were each grouped into grades of very low, low, medium, high, and very high severity, for which a higher grade indicated poorer health or access for a population of a given area. The Health Severity Index was created using publicly available data for life expectancy and percent uninsured, which were weighted equally. Average US life expectancy was designated as medium severity, with lower life expectancy corresponding to increasing severity. The average percent uninsured in Alaska was designated as medium severity, with higher uninsured percentage equating to higher severity. The Access Severity Index was produced using publicly available infrastructure variables including distance from roads (20% weight), health centers (30% weight), and hospitals (50% weight). Higher weight was given to the “distance to hospitals” measure because these facilities would be more likely to have medical imaging capability. Greater distance from these features indicated higher severity. The Health Severity Index score and Access Severity Index score (each weighted 40%) were combined with population density data (20% weight) for a final HASI (very low, low, medium, high, very high severity) for each zip code in Alaska.
Only one other published study used this index. Sachdev et al used the Access Severity portion of the index to plan medical airship landing sites for radiology services in Canada. 25
Human Well-Being Index 16
In 2015, the US EPA developed the Human Well-Being Index (HWBI) as a composite measure of economic, social, and environmental health. 26 The HWBI is composed of 80 indicators categorized into eight domains: connection to nature, cultural fulfillment, education, health, leisure time, living standards, safety and security, and social cohesion. The HWBI was adapted for analyses at the municipality level in Puerto Rico in 2017, 27 and finally downscaled to the census tract level to better understand how well-being on a neighborhood scale is impacted by environmental management activities. 16 Of the 80 indicators included in the original HWBI, 75 were utilized in the index adapted for Puerto Rico, with the remainder dropped due to lack of data. Only 9 of the 75 metrics had data available at the census-tract level, representing education, health, and living standard domains. The other 66 indicators were assigned municipal-level values, then interpolated to census-tract level. Data for each indicator were then standardized from a scale of 0.1–0.9, reversing relationships where necessary to maintain a positive increasing metric with increasing well-being (e.g., lower mortality, increased well-being). The standardized data were then averaged to calculate indicator scores, domain scores, and HWBI scores, weighting each indicator equally. A follow-up study using the Puerto Rican-specific HWBI of how the health of residents of the San Juan estuary-area of Puerto Rico was affected by ecosystem services was published by Yee et al. 28
Neighborhood Determinants of Health Index 12
The Neighborhood Determinants of Health Index (DOHI) was developed to examine health equity among Detroit neighborhood communities. The previously developed Detroit Urban Health Equity Assessment Tool (Detroit Urban HEART) was used to guide the selection of indicators to include in the index. 29,30 Eight indicators of health were included across four domains—economic growth (home ownership, occupied housing, income/employment), social and human development (high school education, children in poverty), governance (percentage with health insurance), and physical environment and infrastructure (airborne particulate matter with a diameter of <2.5 µm [PM2.5], commute time) by census tract. Quintiles were calculated for each variable then assigned scores ranging from 1 to 5. Quintiles with higher values received higher scores, with the exception of PM2.5, for which quintiles with lower values received higher scores to reflect less pollution. The scores for each individual variable were added to create the index score for each census tract. Higher index scores represented more favorable conditions ranging from 8 (low for all indicators) to 40 (high for all indicators). No other published studies were identified that utilized this index.
Neighborhood Environmental Vulnerability Index 15
An adaptable Neighborhood Environmental Vulnerability Index (NEVI) made up of multiple domains was created to characterize the patterns and magnitude of vulnerability in the diverse urban community of New York City. Development of the index was based on the approach of the ToxPi, 20 described above, which combines multiple geospatial features into vulnerability indices across various spatial scales. The NEVI was constructed using data from 2015 to 2019 ACS as well as the CDC PLACES Project. Literature searches were conducted to identify drivers of vulnerability to environmental pollution and group them into four domains, comprised of 24 subdomains and 54 area-level indicators. The domains included demographics, economic indicators, residential characteristics and density, and health behaviors, conditions, prevention practices, and insurance status. Data for each indicator were standardized by calculating z-scores. The four domains were weighted equally, and each subdomain was equally weighted within the primary domain. ToxPi graphical user interface was used to calculate the overall NEVI and domain-specific scores for each census tract. Final NEVI scores ranged from 0 to 1, with higher scores indicating greater vulnerability. The NEVI was subsequently used to assess the association between environmental vulnerability and pediatric asthma emergency visits by neighborhood in three US metropolitan areas. 31
Discussion
This ScR identified eight studies published in the last 10 years that described indices, scales, and other comprehensive health-related metrics (comprised of multiple indicators) used to assess and/or rank health at the community level in the United States. The number of inputs into these indices varied widely, with the majority of indices including indicators for health behaviors, health outcomes, economics, and education. Each of these indices measured community health at the county, zip code, census tract, or census block level with GIS integration capabilities.
The community health indices we included in our review had several features that are important in measuring community health status in various geographic areas. First, the information used in each index was gathered from publicly available data (e.g., US census data, BRFSS), which allows the indices to be applied in most community settings. The use of publicly available data also results in transparency and the ability for others to reproduce the indices calculated. However, granularity of analyses depends on the level of data available for use. Another strength was the customization aspect of these indices. Many of the indices used a weighted-variable approach to allow users to emphasize which variables are most important to their interests. With the option to customize, additional data can be incorporated as it becomes available. Third, the GIS aspect of these indices allows for broad application in different geographical contexts across the United States and enhances interpretation of the results with maps and visuals.
One of the important challenges with comprehensive health indices is availability of data at the scale necessary for local policy decision-making. While the use of publicly available data is a strength of these indices, there are limitations with using existing data. Yee et al found data more widely available at the state and county level rather than finer geographical units, making assessment of trends in health and well-being at more granular levels more difficult. 16 These data limitations can be overcome by imputing missing data, but this requires significant investments in data collection and computational model development. 11,14 Missing data can limit the interpretation of results by introducing nonresponse and selection bias into results generated by these indexes. 13 For example, Uong et al used the NEVI to characterize the magnitude and variability of factors that impact the association between environmental pollutants and health effects. 15 However, data limitations such as small population size or missing data necessitated the exclusion of some census tracts. This limited the applicability in “nonresidential” areas, such as prisons, which may be more vulnerable to health and environmental issues. Identification of vulnerable populations at granular levels such as census tract or zip code will require more investment in collection of high-quality data at these levels.
The quality of data included in the index is another key consideration of community health indices as poor-quality data would directly affect the interpretation of the results. Some quality of life and health behavior indicators, such as poor physical or mental health days, smoking, alcohol use, are obtained from self-reported data and/or model-based estimates, such as the BRFSS. 13,14,16 Although these data are not direct or validated measures of health indicators, they may represent the only available data source for a particular indicator, such as number of poor mental or physical health days or getting emotional/social support. Despite the limitations of these measures, it may be more beneficial to include them in community health indices to address particular aspects of potential health inequalities. For example, a cross-sectional analysis of the body mass index (BMI) of adolescent children found that self-reported height and weight were highly correlated with measured values. 32 Use of self-reported BMI data is likely far more cost-effective than medical chart review or physical examinations and results in reasonably reliable data. Comprehensive health indices must strike a balance between being cost-effective by using accessible information and using potentially limited resources to collect more robust data.
Community health is considered to be multi-factorial, but there is a lack of consensus on which indicators are most important or influential to include in a comprehensive health index to determine the health of a community, as demonstrated by the wide variation in the number and types of indicators included in the indices identified in this ScR. The number of indicators ranged from four in the American HDI 17 to 75 indicators included in the HWBI. 16 In the analyses using the CHR data, Tabb et al found that the health of a given county was influenced not only by health factors and outcomes in the county of interest, but also by those of neighboring counties. 14 With the wide variety of indicators included in each index, the proportion of indicators that were potentially “actionable” or “modifiable” measures that could be effectively changed over time also varied. Because of the diversity of inputs included into the various indices, each index may provide different insights into a community’s health and areas for actionable improvement. As more data continue to become available for public consumption, comprehensive health indices such as these will also need to evolve to consider the role additional factors play to provide a more accurate representation of community health and identification of areas for potential improvement.
Of the eight indices identified, only two have been used to actively monitor longitudinal health trends in communities by producing yearly reports as well as making their index data publicly available for analysis. 14,18 The others have been used for one-time analyses, despite being comprised of publicly available data that could be utilized in other communities, or to monitor a population’s health over multiple time periods. Additional research into the number and type of variables to include in a community health index is needed for a consensus on an index that is both useful in tracking community health over time as well as providing customization to the needs of each particular community.
This ScR had several strengths, including a transparent, reproducible methodology involving a priori registration of the study protocol, use of a standard PRISMA-ScR framework, and focus on the most recently available data. The search strategy allowed for identification of studies with varying definitions of health and that used a wide range of indicators. The ScR was able to capture indices that measured health at different community levels such as county, zip code, and census tract. This review also had some limitations. As this ScR was limited to studies of US populations, these findings may not be generalizable outside of the United States. Potentially relevant studies may not have been identified by our literature searches if terms related to health, indices or indicators were not used in the title or abstract or were published in non-English literature. Finally, while our broad search allowed for the identification of different types of health indices, it also resulted in a large number of irrelevant hits at the title and abstract stage to screen. Because the search strategy identified relevant indices described in the peer-reviewed literature space, proprietary and/or unpublished indices would not have been captured in this review.
The limited number of comprehensive indices available to address community health evaluated a broad range of indicators, which included not only health outcomes but also factors contributing to health vulnerabilities. The GIS aspect and publicly available nature of the data allow for broad applications to different US geographical contexts. Using these indices to perform a multifactorial assessment of community health patterns may help inform regional, state, and local policy strategies that aim to improve community health and reduce social inequities.
Footnotes
Authors’ Contributions
S.T.P.: Conceptualization, Methodology, Investigation, Writing—original draft preparation, Editing and reviewing. L.C.B.: Conceptualization, Methodology, Investigation, Writing—original draft preparation, Editing and reviewing. S.V.R.: Conceptualization, Writing—original draft preparation, Editing and reviewing. R.J.L.: Conceptualization, Writing—editing and reviewing. N.M.: Conceptualization, Methodology, Investigation, Writing—original draft preparation, Editing and reviewing.
Author Disclosure Statement
S.T.P., L.C.B., and N.M. are employees of EpidStrategies and received funding from
Funding Information
This work was funded by