
Abstract
The study objective was to evaluate the impact of the coronavirus disease (COVID-19) pandemic on pediatric blood lead testing in the United States. Clinical laboratory pediatric (ages <6 years) blood lead level (BLL) tests performed by Quest Diagnostics, January 2019–March 2022, were analyzed. Patients were categorized by age, by sex, and, through matching by ZIP code with US Census data, for race, ethnicity, pre-1950 housing, and poverty estimates. Over 2.8 million results from children (<6 years old) from all 50 states and the District of Columbia were included. Compared to March–May 2019, BLL testing was lower by 53.6% in March–May 2020 and lower by 14.6% in March–May 2021. Testing rebounded more for children in predominantly White non-Hispanic communities and among children living in communities, based on ZIP codes, with the least pre-1950 housing stock and lowest poverty rates. The proportion of children with BLL at or above the United States Centers for Disease Control and Prevention reference values of 3.5 and 5.0 µg/dL fell by 19% and 24%, respectively, in 2021 versus 2019. In conclusion, pediatric BLL testing has rebounded from sharp declines during the early pandemic period but unevenly. Declines in the proportion of children with elevated BLL should be interpreted with caution, as testing rebounds were less robust among communities with the highest risk of lead poisoning, notably communities with the oldest housing stock and higher poverty rates. More public health efforts are needed to address lead toxicity throughout the United States, especially in communities that did not experience a full rebound subsequent to the early COVID-19 pandemic period.
Introduction
Lead is ubiquitous in the environment and has known deleterious effects on the developing brain; thus, universal screening of blood lead for children at risk of lead toxicity is recommended by the United States Centers for Disease Control and Prevention (CDC) to facilitate early detection. 1 Routine health care, including pediatric blood lead testing, was initially suspended in the early stage of the coronavirus disease (COVID-19) pandemic, but routine health care slowly rebounded. 2 –4 Based on reports across the United States from 34 state health departments and two local health departments, there was a 34% decrease in the number of children under 6 years of age who received blood lead tests from January through May 2020 compared to the same time period in 2019. 5 Blood lead testing was further affected by the US Food and Drug Administration (FDA) recall of certain lead test lots performed on Magellan Diagnostics analyzers from September 2021 through March 2022. 6 Magellan Diagnostics resumed the distribution of LeadCare II test kits in February 2022 and LeadCare Plus and LeadCare Ultra test kits in October 2022. 6
Beyond 2020, the national impact of the pandemic on routine lead testing remains unknown. Examination of national laboratory blood lead testing data from Quest Diagnostics has provided a foundational understanding of the prevalence of elevated lead levels in the United States. A 2016 retrospective study of over five million blood lead test results from a five-year period (2009–2015) showed that, although the prevalence of high blood lead levels (BLL) decreased over time, more than 100,000 children (2.9%) still had BLL above the level of concern (≥5.0 µg/dL). 7 A more recent study examining BLL from 2018 to 2020 revealed that over 50% of children in the United States who underwent testing had detectable BLL (≥1.0 µg/dL). 8 Further analysis showed that the burden was disproportionate; children residing in communities with higher poverty and older housing (pre-1950), and those living in areas with predominantly Black non-Hispanic populations have higher odds of having detectable BLL. 6 The objective of this study was to determine how the COVID-19 pandemic affected pediatric blood lead testing in the United States, and what demographic and neighborhood level factors may be associated with changes in blood lead testing.
Methods
Study design
We performed a retrospective, cross-sectional, observational analysis of clinical laboratory blood lead testing results for children aged less than 6 years. All BLL testing performed by Quest Diagnostics from January 1, 2019, through March 30, 2022, was included. The children were from all 50 states in the United States and the District of Columbia.
To evaluate the trends and impact of the COVID-19 pandemic, blood lead results were grouped by year, with the year 2019 representing “pre-pandemic.” The monthly test volumes per specimen type were analyzed. Only the first blood lead test results per child per calendar year were included. An exception to this was for scenarios where the initial blood lead test was an elevated capillary specimen, as these are mandated to have confirmatory venous specimens within 90 days to align with CDC guidelines for “confirmed elevated BLL.” 9 In these cases, only the results from the confirmatory specimens were used for analysis. Elevated capillary blood test results ≥5.0 µg/dL without confirmation were excluded because of the potential for false positive results from contamination. BLL of ≥3.5 µg/dL and ≥5.0 µg/dL were examined separately because the CDC lowered the threshold for public health action for BLL from 5.0 µg/dL to 3.5 µg/dL in October 2021. 1
Laboratory methods
The specimens were analyzed by either inductively coupled plasma mass spectrometry or Zeeman graphite furnace atomic absorption spectroscopy. The equipment used to conduct these analyses was calibrated using the National Institute of Standards and Technology Traceable Standard Reference Material 3128. The performance standard was aligned with CDC accuracy standards.
Definitions
Demographic factors of race and ethnicity, poverty, and pre-1950 housing were obtained from the 2018 5-year American Community Survey by ZIP codes and analyzed by linking patient residential ZIP codes to these estimates. 10 Paralleling methods from earlier literature, populations were classified into three primary categories (Black non-Hispanic, Hispanic, and White non-Hispanic) by grouping ZIP codes with proportions greater than 50% of the respective populations. 8 These three racial and ethnic groups are the largest in the United States. Of particular concern are minoritized populations who have been disproportionately impacted by lead toxicity owing to the legacy of structural racism. 11,12 Poverty-to-income ratios of <1.0, representing a community population below the poverty line, were used to define poverty and distinguish poverty quintiles. Pre-1950 housing was specifically examined as housing built before this period predated regional and national bans on lead-based paint.
Statistical analysis
Demographics, testing rates, and results were compared between the years 2019, 2020, and 2021. The Cochran–Armitage test was used to examine differences in BLL and testing trends in the study population for quintile groups (poverty and pre-1950 housing). The statistical significance between all other groups was analyzed utilizing χ2 testing. Analyses that compared groups between years contained a relatively small number of patients with BLL results in both comparative years, reflecting real-world testing patterns where follow-up levels may be obtained to monitor trends. Analyses excluding these patients with samples in both comparative years were also performed, confirming the P values provided in the text. The analysis was conducted using SAS Studio 3.6 on SAS, version 9.4 (SAS Institute Inc.). This Quest Diagnostics Health Trends® study was deemed exempt by the WIRB-Copernicus Group Institutional Review Board, given its presentation of aggregated, deidentified data.
Results
From January 2019 through March 2022, 2,862,092 BLL test results from 2,292,426 children were considered for evaluation. A total of 110,085 specimens that came from the same child in the same calendar year were excluded. In addition, 7,391 test results were excluded because these were capillary blood specimens with BLL ≥5.0 µg/dL that were not confirmed based on subsequent venous blood testing. After these exclusions, 2,744,616 BLL test results (95.9% of those considered) from 2,287,835 children (99.8% of those considered) were evaluated: 918,845 from the capillary specimens and 1,825,771 from the venous specimens. The included children were 51.4% male and had a mean age of 2.2 years (SD = 1.4 years). Nearly half (1,127,338, 49.3%) of the included children resided predominantly in White non-Hispanic ZIP codes. There were 394,290 (17.2%) and 206,270 (9.0%) children included in the predominantly Hispanic and Black non-Hispanic ZIP codes, respectively.
The monthly blood lead testing volume fell by a maximum of 70.2% in April 2020 compared to April 2019 (Fig. 1). Full recovery to the 2019 testing volume was not observed until September 2021. Testing increased dramatically through late 2021 and early 2022, mostly driven by an increase in the capillary specimen test volume (Fig. 2).
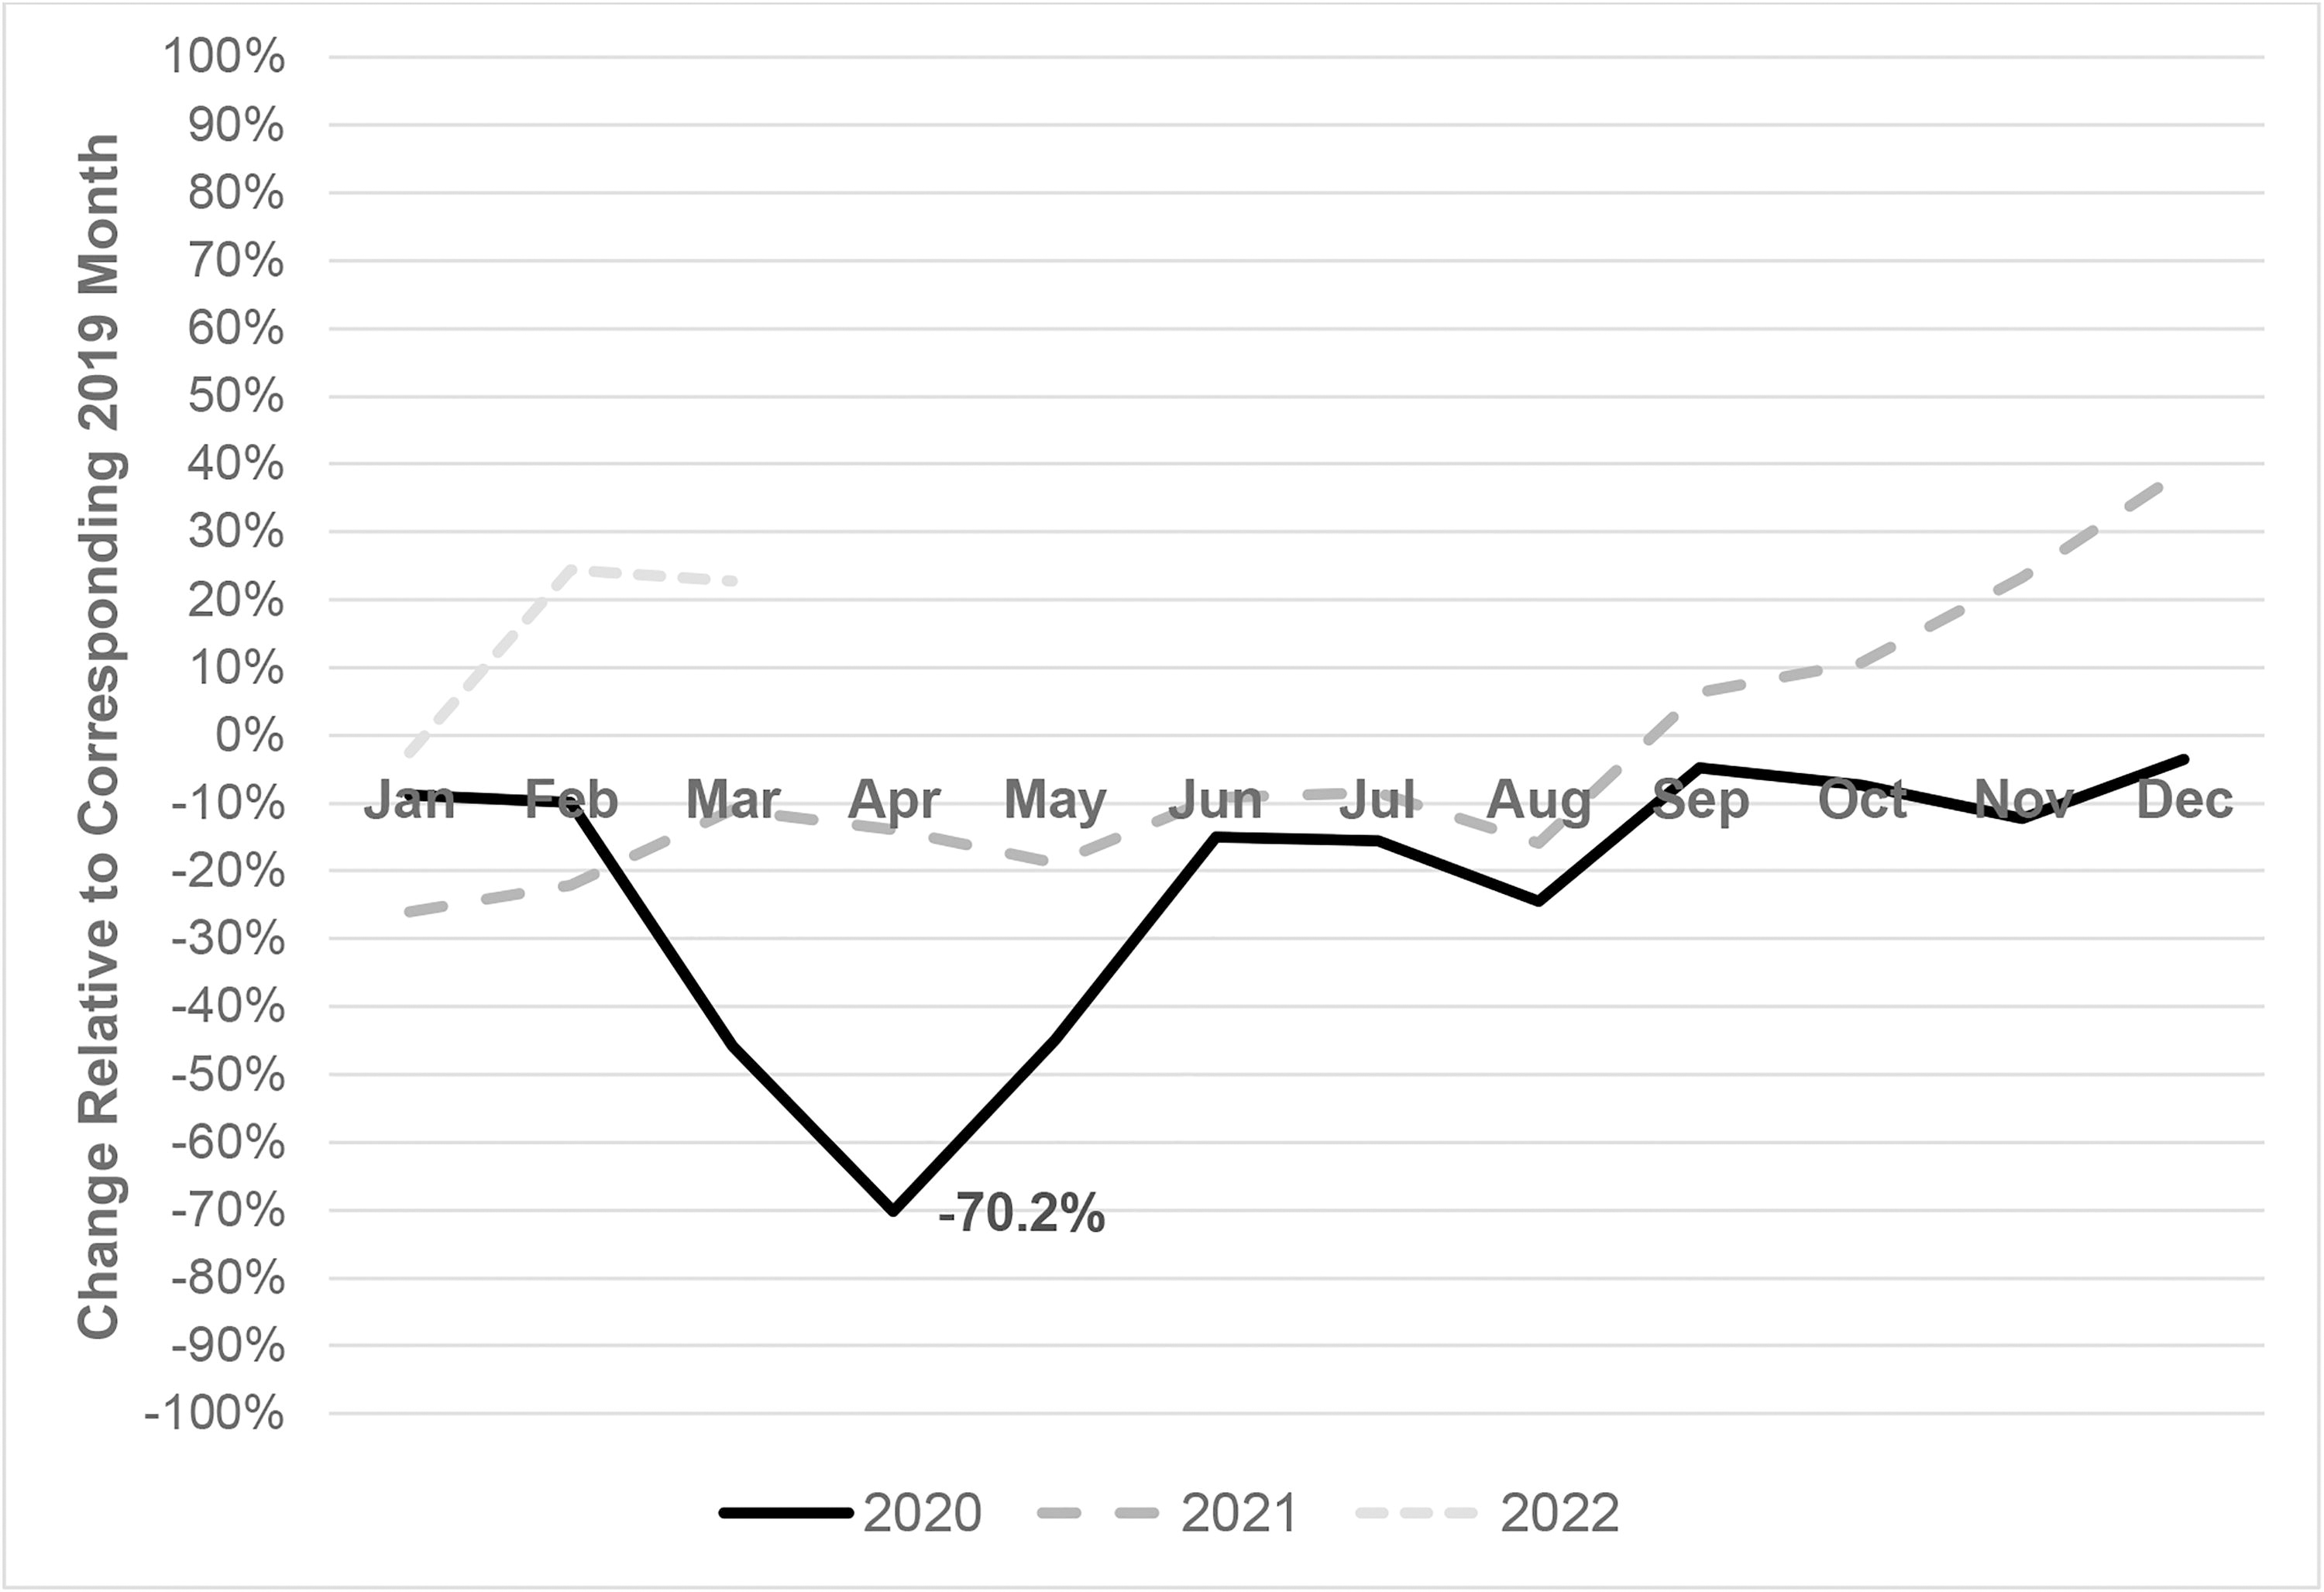
Change in monthly blood lead level test volume (percent) compared to 2019, January 2020 through March 2022.
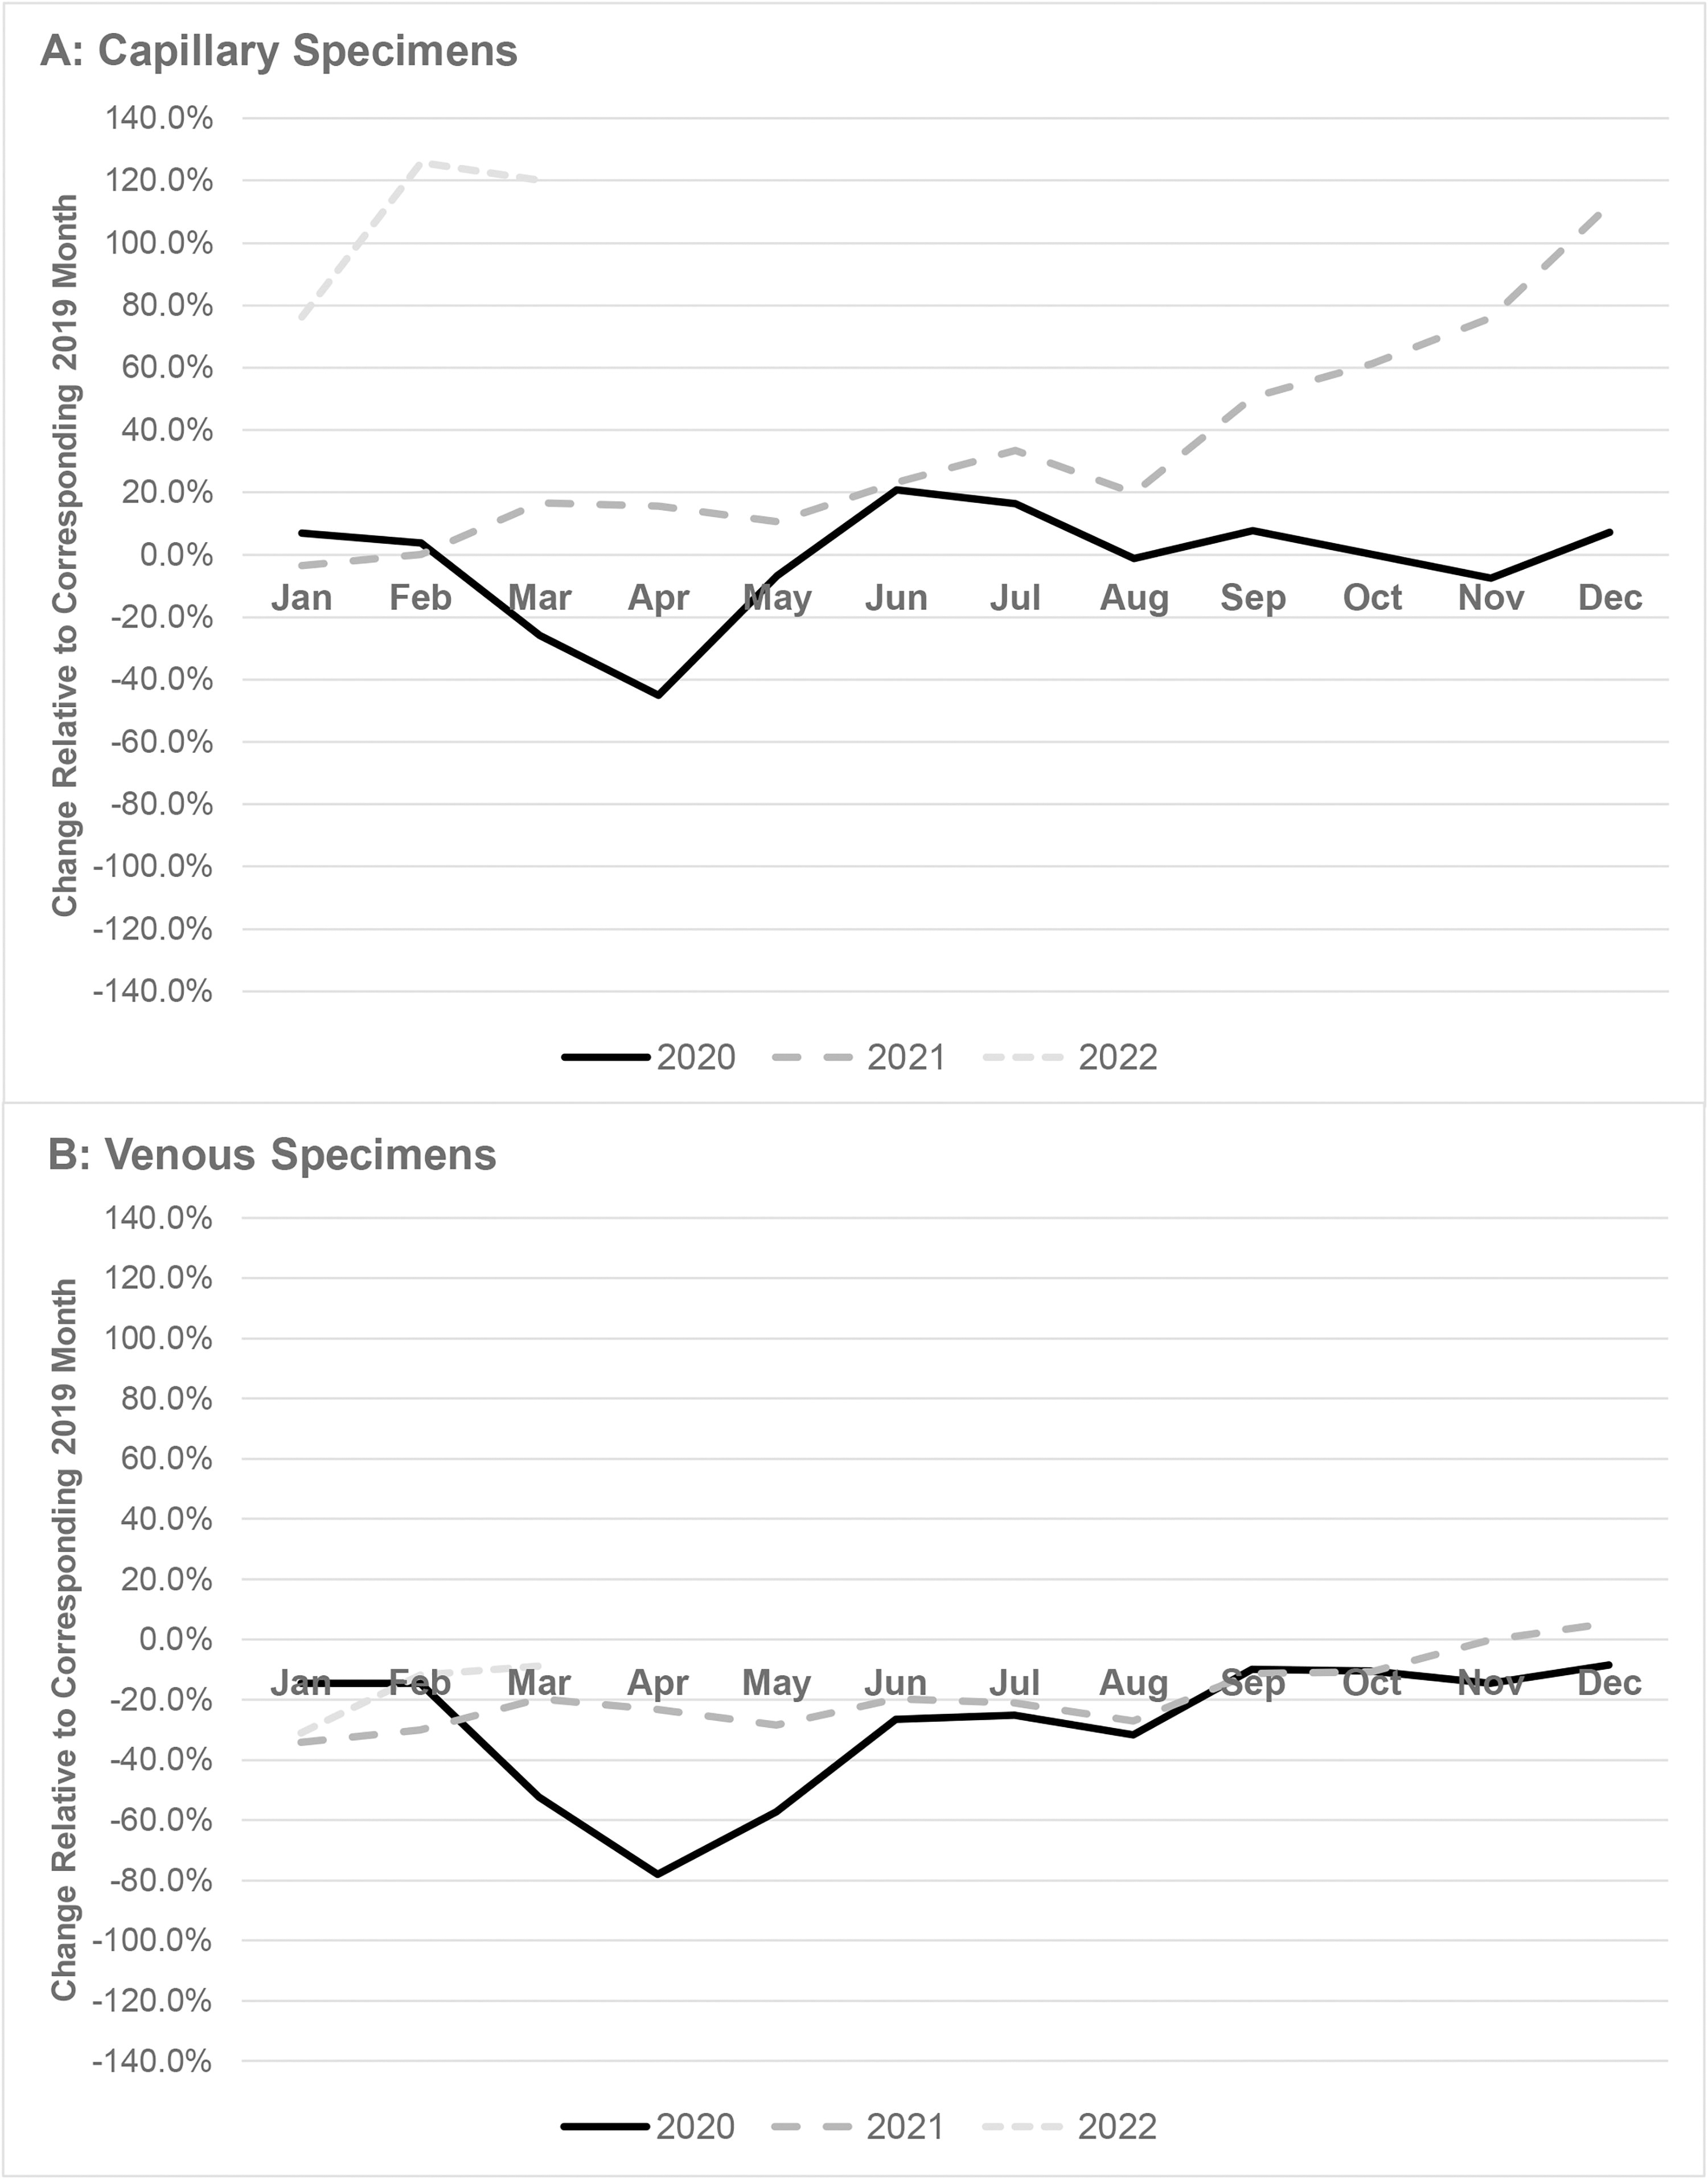
Monthly change in capillary (panel A) and venous (panel B) specimens for blood lead testing (compared to 2019), January 2020 through February 2022.
Demographic data for March through May 2019, 2020, and 2021 are shown in Table 1. The number of children tested for blood lead declined by 53.6% in 2020 compared to 2019. There were significant differences in testing declines from 2020 versus 2019 by many demographic factors, including age (46.5% for children <3 years and 70.5% for children 3 to <6 years) and predominant race/ethnicity ZIP codes (60.3% Black non-Hispanic, 57.7% Hispanic, versus 49.7% White non-Hispanic) (all, P < 0.01) (see Supplementary Table S1). There was also a statistically significant trend in testing the decline for quintiles of pre-1950 housing stock (from 44.1% in the lowest quintile that represents the least pre-1950 housing to 64.3% in the highest quintile, which represents the most pre-1950 housing [ie, oldest]; P < 0.01).
Demographic Changes in Blood Lead Level Test Volumes, March–May for 2019, 2020, and 2021
The number of children tested for blood lead declined by 14.6% in 2021 versus 2019 (P < 0.01). Significant differences in testing declines were observed in 2021 compared to 2019 for many demographic factors (Table 1), including age (9.5% for children aged <3 years and 26.5% for children aged 3 to <6 years) and predominant race/ethnicity ZIP codes (20.5% Black non-Hispanic, 22.6% Hispanic, versus 9.5% White non-Hispanic) (all, P < 0.01). There were also statistically significant trends in testing the decline for community quintiles of pre-1950 housing stock (from 6.0% in the lowest quintile [least pre-1950 housing] to 24.2% in the highest quintile [most pre-1950 housing]; P < 0.01) and community quintiles of poverty (from 6.2% [least poverty] to 22.6% [most poverty]; P < 0.01).
Figure 3 shows the decline in BLL results above the CDC thresholds for elevation from January 2019 to February 2022. The percent of BLL results ≥5.0 µg/dL fell from 2.0% in 2019 to 1.8% in 2020 and declined again to 1.5% by 2021 (24% total decline). The percent of BLL results ≥3.5 µg/dL fell from 3.5% in 2019 to 3.1% in 2020 and declined again to 2.8% in 2021 (19.3% total decline). There were notable intrayear monthly changes in both measurements throughout the study period (Fig. 3).
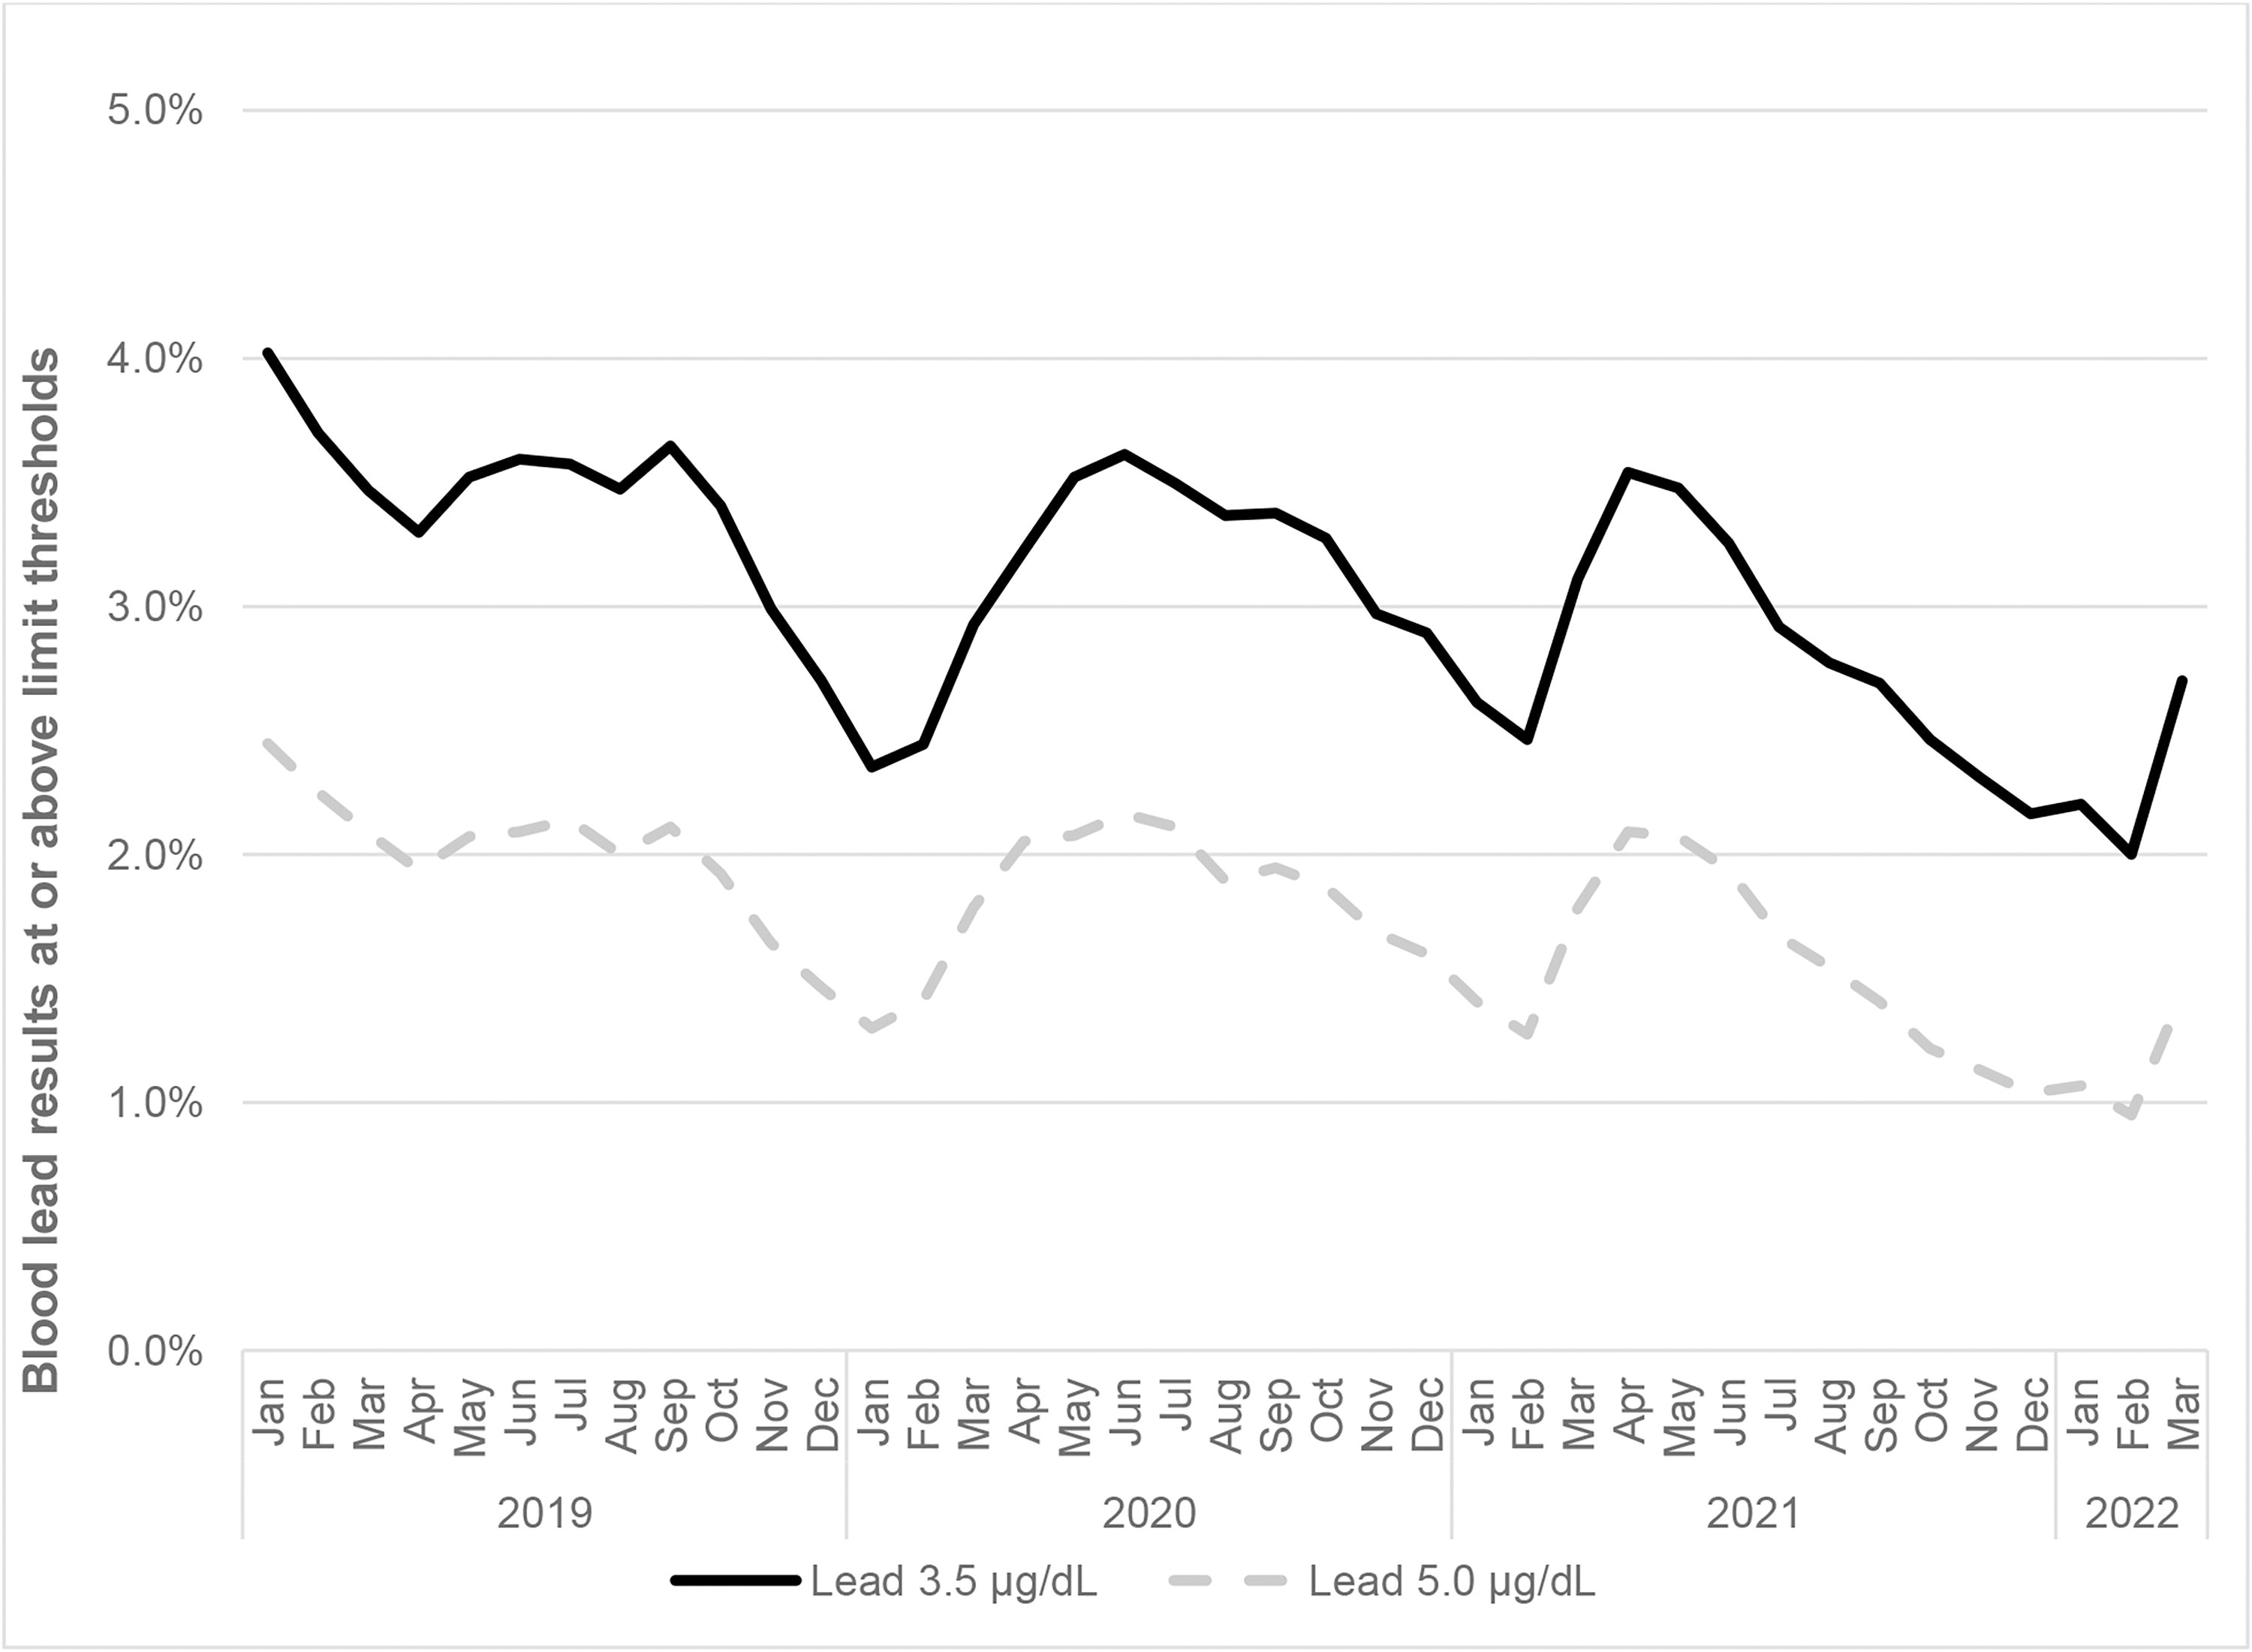
Percent of pediatric blood lead levels ≥3.5 and ≥5.0 µg/dL, January 2019 through February 2022.
Table 2 shows the percent of children with BLL ≥3.5 µg/dL and BLL ≥5.0 µg/dL for March through May 2019, 2020, and 2021. Results from these months were generally stable overall: BLL ≥3.5 µg/dL was 3.4% in 2019, 3.2% in 2020, and 3.4% in 2021. BLL ≥5.0 µg/dL was 2.0% each year. Significant differences in BLL ≥3.5 µg/dL and BLL ≥5.0 µg/dL were observed for some demographic groups during all three time periods. There were statistically significant trends in BLL ≥3.5 µg/dL for community quintiles of pre-1950 housing stock (from 1.9% in the lowest quintile [least pre-1950 housing] to 5.6% in the highest quintile [most pre-1950 housing] in 2019, 1.7% to 5.7% in 2020, and 1.3% to 6.0% in 2021; all P < 0.01). There were also statistically significant trends in BLL ≥5.0 µg/dL for community quintiles of pre-1950 housing stock (from 1.0% in the lowest quintile [least pre-1950 housing] to 3.5% in the highest quintile [most pre-1950 housing] in 2019, 1.0% to 3.7% in 2020, and 0.7% to 3.7% in 2021; all P < 0.01). The results for the community poverty quintiles demonstrated similar patterns, where those residing in areas with the most poverty had higher percentages of elevated BLL.
Blood Lead Level Test Results
Discussion
During the study period, the BLL test volume declined by 53.6% in 2020 versus 2019 (P < 0.01) and by 14.6% in 2021 versus 2019 (P < 0.01). The monthly blood lead testing decreased by a maximum of 70.2% in April 2020 relative to April 2019, reflecting the height of COVID-19-related routine health care limitations. Similar decreases were observed in other clinical laboratory tests. 3,4,13,14 Monthly blood lead testing in January–February 2020 and June–December 2020 were lower than the same periods in 2019. This pattern persisted through August 2021 and dramatically increased subsequently through early 2022. This increase may be attributable to an increase in capillary specimen collection submitted to Quest Diagnostics for testing when the Magellan Diagnostics capillary blood test kits were subject to FDA recall. 6 The increase in venous blood testing in late 2021 may reflect an increase in confirmatory testing subsequent to capillary blood screening. Our primary observation of a decline in BLL testing early in the pandemic and subsequent rebound in 2021 and 2022 was also seen in Chicago, Illinois. 15
The analysis by major race/ethnicity groups based upon predominance by ZIP code was included because prior analyses have identified differences in the distinctions of lead toxicity based on race and ethnicity. 8,16 We recognize that these differences are owing to structural racism, which contributed to differences in poverty, educational achievement, likelihood of living in pre-1950 housing, and other social determinants of health, and not to differences in biology. Declines in testing were most pronounced in older children (3–5 years of age) than in younger children (aged <3 years), in Black non-Hispanic and Hispanic children relative to White non-Hispanic children, in children living in the highest quintiles of ZIP codes with pre-1950 housing stock, and in children living in the highest quintiles of ZIP codes with the highest poverty. 11,12 Most lead exposure in the United States stems from old housing stocks contaminated with dust from lead-based paint. 17 Neighborhood differences may also be substantial. 16 Quintiles with the highest rates of pre-1950 housing stock and poverty are key factors associated with higher rates of elevated BLL (≥3.5 µg/dL) and historically elevated BLL (≥5.0 µg/dL). 7,17 The current study suggests that the greatest declines in testing based on these two factors likely contributed to a relatively steeper decline in the rate of elevated BLL than if there was no such imbalance. In other words, the gap in testing during the pandemic was the greatest for children who were at an increased risk of lead toxicity. This was particularly striking when comparing the number of children with BLL ≥3.5 µg/dL by ZIP code quintiles based on pre-1950 housing stock. The proportion of children within the top quintile of ZIP codes with pre-1950 housing stock (oldest housing) declined by 24.2% from March through May 2021, relative to the same period in 2019, whereas the proportion of children within the lowest quintile of ZIP codes with pre-1950 housing stock only declined by 6.0% from March through May 2021, relative to the same period in 2019. Similar to our observations, a study of the pandemic impact on BLL screening in Chicago, Illinois, found that community areas with the highest risk of BLL of concern had the greater declines in testing than in other communities. 15
Key factors that drive health inequities are the social determinants of health, such as income (or poverty), educational achievement, and housing. 11,18 Racial differences in home ownership and residency were driven by redlining and other segregation policies. 12,19 The COVID-19 pandemic has illuminated health inequities driven by social determinants of health. 20 Minoritized populations may have spent more time at home, especially during the early months of the COVID-19 pandemic, providing more time for young children to be exposed to lead in contaminated older homes. Minoritized populations have more limited trust in and access to health care institutions that can shape routine health care utilization. This study reinforces the inequality gap that was accentuated during the COVID-19 pandemic. We call attention to the need to better understand the associations with social determinants of health, so that we can address gaps in lead screening in a way that prioritizes the most vulnerable populations. 21
The strength of this study is that it represents over 2.8 million blood lead test results from nearly 2.3 million children residing in every state in the United States and the District of Columbia. Limitations include that children were tested in numerous other clinical laboratories that were not considered in this study, and differences in selected laboratories may be reflective of differences in accessibility owing to barriers presented by insurance type and coverage. This limitation could limit the generalizability of these results. Individual result assignment to community quintiles by ZIP code is subject to misclassification, inherent in our study design. The increase in capillary specimens following the end of a temporary recall of test lots on a select blood test system may have biased patient selection toward medical practices that had this system available. Such medical practices may be more representative of children at lower risk for detectable and elevated BLL than other children.
Conclusion
This national study of pediatric lead testing showed that BLL testing rebounded from steep declines in the early months of the pandemic. The overall testing volume in 2021 remains below the level of testing provided by Quest Diagnostics in 2019. Importantly, this study suggests that the rebound in testing accentuated health inequities in that a higher proportion of children at the lowest risk were tested and identified with lead toxicity relative to children at higher risk. Lead poisoning remains an important public health issue, especially for children at high risk, and increased lead screening among vulnerable populations is imperative for early detection and management. Efforts must be made to eliminate environmental lead, 20 especially for children in communities affected by the persistent legacy of structural racism exacerbated during the COVID-19 pandemic. Lead testing and remediation are public health priorities, especially among communities at high risk of lead poisoning.
Footnotes
Authors’ Contributions
H.W.K., J. K.N., and M.H. conceptualized and designed the study. H.W.K., J.K.N., M.H., R.C.L.B., K.A., and S.H.S. drafted the initial article, and critically reviewed and revised the article. All authors approved the final article as submitted and agree to be accountable for all aspects of the work.
Data Statement
Requests for data to researchers should be addressed to
Author Disclosure Statement
No competing financial interests exist.
Funding Information
H.W.K and J.K.N. are employees of Quest Diagnostics and own stock in Quest Diagnostics. M.H. and K.A. are supported (in part) by the National Institute of Environmental Health Sciences (NIEHS) of the National Institutes of Health (NIH) under award K23ES031663. M.H., S.H.S., and K.A, are supported (in part) by the cooperative agreement award number FAIN: NU61TS000296 from the Agency for Toxic Substances and Disease Registry (ATSDR). The U.S. EPA supports the Pediatric Environmental Health Specialty Units by providing partial funding to the ATSDR under Inter-Agency Agreement number DW-75-92301301. The content is solely the responsibility of the authors and does not necessarily represent the official views of the ATSDR, U.S. EPA, or NIH/NIEHS.
Supplementary Material
Supplementary Table S1
References
Supplementary Material
Please find the following supplemental material available below.
For Open Access articles published under a Creative Commons License, all supplemental material carries the same license as the article it is associated with.
For non-Open Access articles published, all supplemental material carries a non-exclusive license, and permission requests for re-use of supplemental material or any part of supplemental material shall be sent directly to the copyright owner as specified in the copyright notice associated with the article.