
Abstract
The rise in health care costs, caused by older and more complex patient populations, requires Population Health Management approaches including risk stratification. With risk stratification, patients are assigned individual risk scores based on medical records. These patient stratifications focus on future high costs and expensive care utilization such as hospitalization, for which different models exist. With this study, the research team validated the accuracy of risk prediction scores for future hospitalization and high health care costs, calculated by the Adjusted Clinical Group (ACG)'s risk stratification models, using Dutch primary health care data registries. In addition, they aimed to adjust the US-based predictive models for Dutch primary care. The statistical validity of the existing models was assessed. In addition, the underlying prediction models were trained on 95,262 patients' data from de Zoetermeer region and externally validated on data of 48,780 patients from Zeist, Nijkerk, and Urk. Information on age, sex, number of general practitioner visits, International Classification of Primary Care coded information on the diagnosis and Anatomical Therapeutic Chemical Classification coded information on the prescribed medications, were incorporated in the model. C-statistics were used to validate the discriminatory ability of the models. Calibrating ability was assessed by visual inspection of calibration plots. Adjustment of the hospitalization model based on Dutch data improved C-statistics from 0.69 to 0.75, whereas adjustment of the high-cost model improved C-statistics from 0.78 to 0.85, indicating good discrimination of the models. The models also showed good calibration. In conclusion, the local adjustments of the ACG prediction models show great potential for use in Dutch primary care.
Introduction
Multimorbidity is increasingly being recognized as the norm rather than the exception, since patient populations are becoming older and more complex, and patient information is becoming more complete. The increased complexity leads to increased health care utilization. In particular, there is a rise in expensive care such as hospital and emergency care, which has a major effect on health care costs. To manage these rising health costs, approaches that focus on complete patients' health profiles are needed. Population Health Management is focusing on the coordination of care delivery across specified subpopulations to improve the population's health and care utilization. 1,2
In addition, analysis of routine health registry data is increasingly being used to provide a basis for proactive care interventions, attempting to lower health care costs by reducing expensive and avoidable care such as hospital admissions. Risk stratification, the assignment of individual risk scores to patients based on registered health profiles, has proven to be an effective tool in the provision of proactive care. A study by Freund et al successfully selected high-risk patients for care management programs, using risk stratification. 3 Another study has shown that efficient care management approaches using risk stratification have led to reduced hospitalization rates. 4
A wide variety of risk stratification tools exist, with risk predictions for various health and health utilization outcomes, such as the risk for future hospitalization, high health care costs, emergency care utilization and even mortality. One of the most frequently used risk stratification tools in primary care is the Johns Hopkins Adjusted Clinical Groups (ACG) system, 5 with proven efficacy for prediction of not only health outcomes such as morbidity, but also of different types of future health care utilization, such as hospitalization and emergency department visits, and future health costs. 6
Most risk stratification tools predominantly use hospital data, with and without primary care data. However, patient's privacy protection in Europe is complicating the linkage of different health data sources. Performing risk stratification based on primary care routine registry data, extracted from only 1 source in which essential information from most other relevant sources is present, is a way to overcome the privacy challenge.
Evidence of the efficacy and accuracy of risk stratification approaches based on primary care data is still insufficient in The Netherlands. This study aimed to validate the accuracy of the ACG's risk prediction scores for future hospitalization and high health care costs, using Dutch primary care health data registries as input data, and to adjust the US-based predictive models for Dutch primary care.
Methods
Design
This study had 3 aims: (1) assessment of 2 existing prediction models within the ACG tool, which are based on US data, (2) adjustment of the prediction algorithms toward Dutch primary care data, and (3) assessment of the adjusted prediction models.
Assessment of ACG's fixed prediction models (based on US data)
The ACG system, developed by the Johns Hopkins University, includes many different risk prediction models. With this study, 2 of those existing prediction models were assessed: (1) the “hospitalization model,” estimating probabilities for becoming hospitalized at least once in the following 12 months and (2) the “high-cost model,” estimating probabilities for being in the top 5% of the population with the highest health care costs in the following 12 months.
The ACG models are existing models, based on years of research with US data. The authors applied these 2 ACG models to retrospective Dutch primary care data, available in general practitioners' (GPs) electronic medical records. Subsequently, the authors assessed model performances, using observed outcomes extracted from historic medical specialty data.
Adjustment of the models, based on Dutch primary care data
In addition to the application and assessment of the fixed prediction models of the ACG tool, the authors aimed to adjust the 2 prediction models to the Dutch situation. Therefore, they produced logistic regression models for hospitalization and high cost with the same predictors used by the ACG, using retrospective data from a Dutch primary care population, and adjusted the coefficients of those predictors.
Assessment of the adjusted models
To assess the performance of both the hospitalization and the high-cost model, the authors investigated the discriminating and calibrating ability. The discriminating ability relates to how well a prediction model can distinguish those with the outcome from those without, whereas the calibrating ability relates to the agreement between observed and predicted values. 7 The assessment was performed by externally validating the models with retrospective data from a second Dutch primary care population.
Data and study population
For this study, the authors used data from GP enlisted patient populations in The Netherlands. The authors used extractions of the GPs' electronic medical records as input data for the applied prediction models, and secondary care (hospital) data for the observed outcomes of the models.
Assessment of ACG's existing prediction models
To assess the ACG's existing prediction models, the models were applied to historic primary care data from 95,262 primary care patients within the Zoetermeer region in The Netherlands. Data from January to December 2014 were extracted from participating GPs' electronic health records and were used as input data for the prediction model. Information on age, sex, number of GP visits, International Classification of Primary Care version 1 (ICPC-1) coded information on the diagnosis and Anatomical Therapeutic Chemical Classification coded information on the prescribed medications were incorporated in the model.
The authors translated ICPC-1 codes, used in Dutch primary care, to the international ICPC-2 codes, required as input for the ACG System. As ICPC-1 codes are sometimes more specific than ICPC-2 codes, the authors have translated some ICPC-1 codes to International Classification of Diseases 10th revision codes, a coding system that can also be recognized by the ACG System, rather than to ICPC-2 codes. Translation was based on ICPC-1 and ICPC-2 differences described by Wonca International Classification Committee 8 with additional expert opinions (Supplementary Table S1).
The outcome variables for the prediction models were extracted from medical specialty care records, available as microdata from Statistics Netherlands, the Dutch Central Bureau for Statistics. Outcomes extracted from Statistics Netherlands' microdata included information on hospitalization and reimbursed health care costs from January to December 2015. In The Netherlands, health care costs are reimbursed by health insurers based on mandatory basic health insurance law and only the costs covered by the basic health insurance are included as health care costs for this study.
As GP data from 2014 were used, patients were included when registered with 1 of the participating GP practices for the complete year of 2014, but only when linkage with the Statistics Netherlands database was possible (91.7% of the patients).
Data from the GP's electronic health registries were linked to medical specialty data by encryption of both data sets. To each individual a unique Record Identification Number (RIN) was assigned, based on birth date, gender, and complete postal code. The RINs were the used to link the GP data to the Statistics Netherlands' microdata.
Adjustment of the models, based on Dutch primary care data
For the adjustment of the 2 US-based prediction models, the same data and study population were used as described in previous paragraphs.
Assessment of the adjusted models
To assess the adjusted prediction models, a second study population was used. The study population of 48,780 patients from Zeist, Nijkerk, and Urk was used to externally validate the prediction models. Similar retrospective primary and secondary care data were used as described previously.
Statistical analysis
First, the similarity between the 2 study populations was assessed. Continuous variables have been tested with t-tests. In case of violation of the normality assumption, a nonparametric test was used. For the categorical variables, chi-squared test was used.
Assessment of ACG's existing prediction models
The ACG System US-based hospitalization and high-cost models were assessed on model performance. Predicted values, generated by the ACG were compared with the observed outcomes (described in the next section “Adjustment of the models”) by calculation of C-statistics, a measure of concordance between model-based risk estimates and observed events. C-statistics <0.6 were taken to indicate poor model performance, C-statistics between 0.6 and 0.7 to indicate sufficient model performance, and C-statistics >0.7 indicate good model performance. 9
Adjustment of the models
To adjust the 2 prediction models to the Dutch primary care data, the authors used the underlying logistic regressions for hospitalization and high health care costs. The authors estimated the logistic regressions using the first primary care population to find new coefficients for the predictors, resulting in adjusted prediction models.
Dependent variables
The dependent variable for the first model was hospitalization in the second year. Hospitalization in the second year was defined as being at least on hospital admission in the period between January and December 2015 based on Statistics Netherlands microdata.
The dependent variable for the second prediction model was high health care costs in the next year. High health care costs in the next year was defined as being in the top 5% of highest health care costs within the population in the period between January and December 2015, again based on Statistics Netherlands microdata.
Independent variables
Independent variables concern all variables of the ACG's hospitalization and high-cost models, which were available in our Dutch data. Next to patients' characteristics such as age, sex, and GP care utilization, independent variables included specific diagnoses, types of diagnosis, burden of care categories and mutually exclusive multimorbidity categories, which are based on complete diagnosis and medication profiles of individual patients (Supplementary Table S2).
Assessment of the adjusted models
C-statistics were calculated to assess model performance regarding discrimination. First, C-statistics were calculated for the prediction model estimated in the first population, resulting in coefficients adjustments of the fixed AGC models. C-statistics for those adjusted prediction models were compared with those of the existing US-based ACG models. The adjusted models show improvement when C-statistics are higher than those of the US-based ACG models.
Second, the adjusted prediction models were externally validated in a second study population. Both discrimination and calibration were estimated. Calibration was assessed by dividing the validation data set population into deciles based on ascending predicted values for the different outcomes. For each group the mean observed and expected values were plotted in a calibration plot. Models with a 45° angle plot (mean observed value equals mean expected value) are considered perfectly calibrated. Models below this reference line are overestimating, whereas models above it are underestimating.
Privacy
Primary care patients were informed about the use of their data for research purposes. Patients were given the opportunity to opt out.
Patient data were encrypted by Statistics Netherlands under strict rules to secure individuals' privacy. Linkage and analyses of the data was performed within the secured environment of Statistics Netherlands.
Results
Population characteristics
The differences for various characteristics between the 2 study populations are presented (Table 1). The 2 populations are comparable with respect to the percentage of females within the population, the mean number of GP visits in 2014 and the percentage of people hospitalized in 2015. The mean age shows a difference of 1 year between the 2 populations.
Population Characteristics: Differences Between the Populations (Zoetermeer vs. Nijkerk + Urk + Zeist)
GP, general practitioner; SD, standard deviation.
Statistical assessment
Assessment of ACG's existing prediction models (based on US data)
To assess the performance of the existing ACG models, which are based on US data, the authors calculated C-statistics. The C-statistic for the ACG hospitalization model was 0.69, suggesting a modest performance of the model. With a C-statistic of 0.78, the discriminating ability of the high-cost model can be classified as good.
Adjustment of the models, based on Dutch primary care data
To adjust the models to the Dutch primary care setting, the authors first estimated and then validated the logistic regression models, producing new prediction models. Odds ratios, along with the 95% confidence intervals, for the variables included in, respectively, the hospitalization and high-cost prediction models, arranged from lowest (top) to highest (bottom), are presented (Figs. 1 and 2).
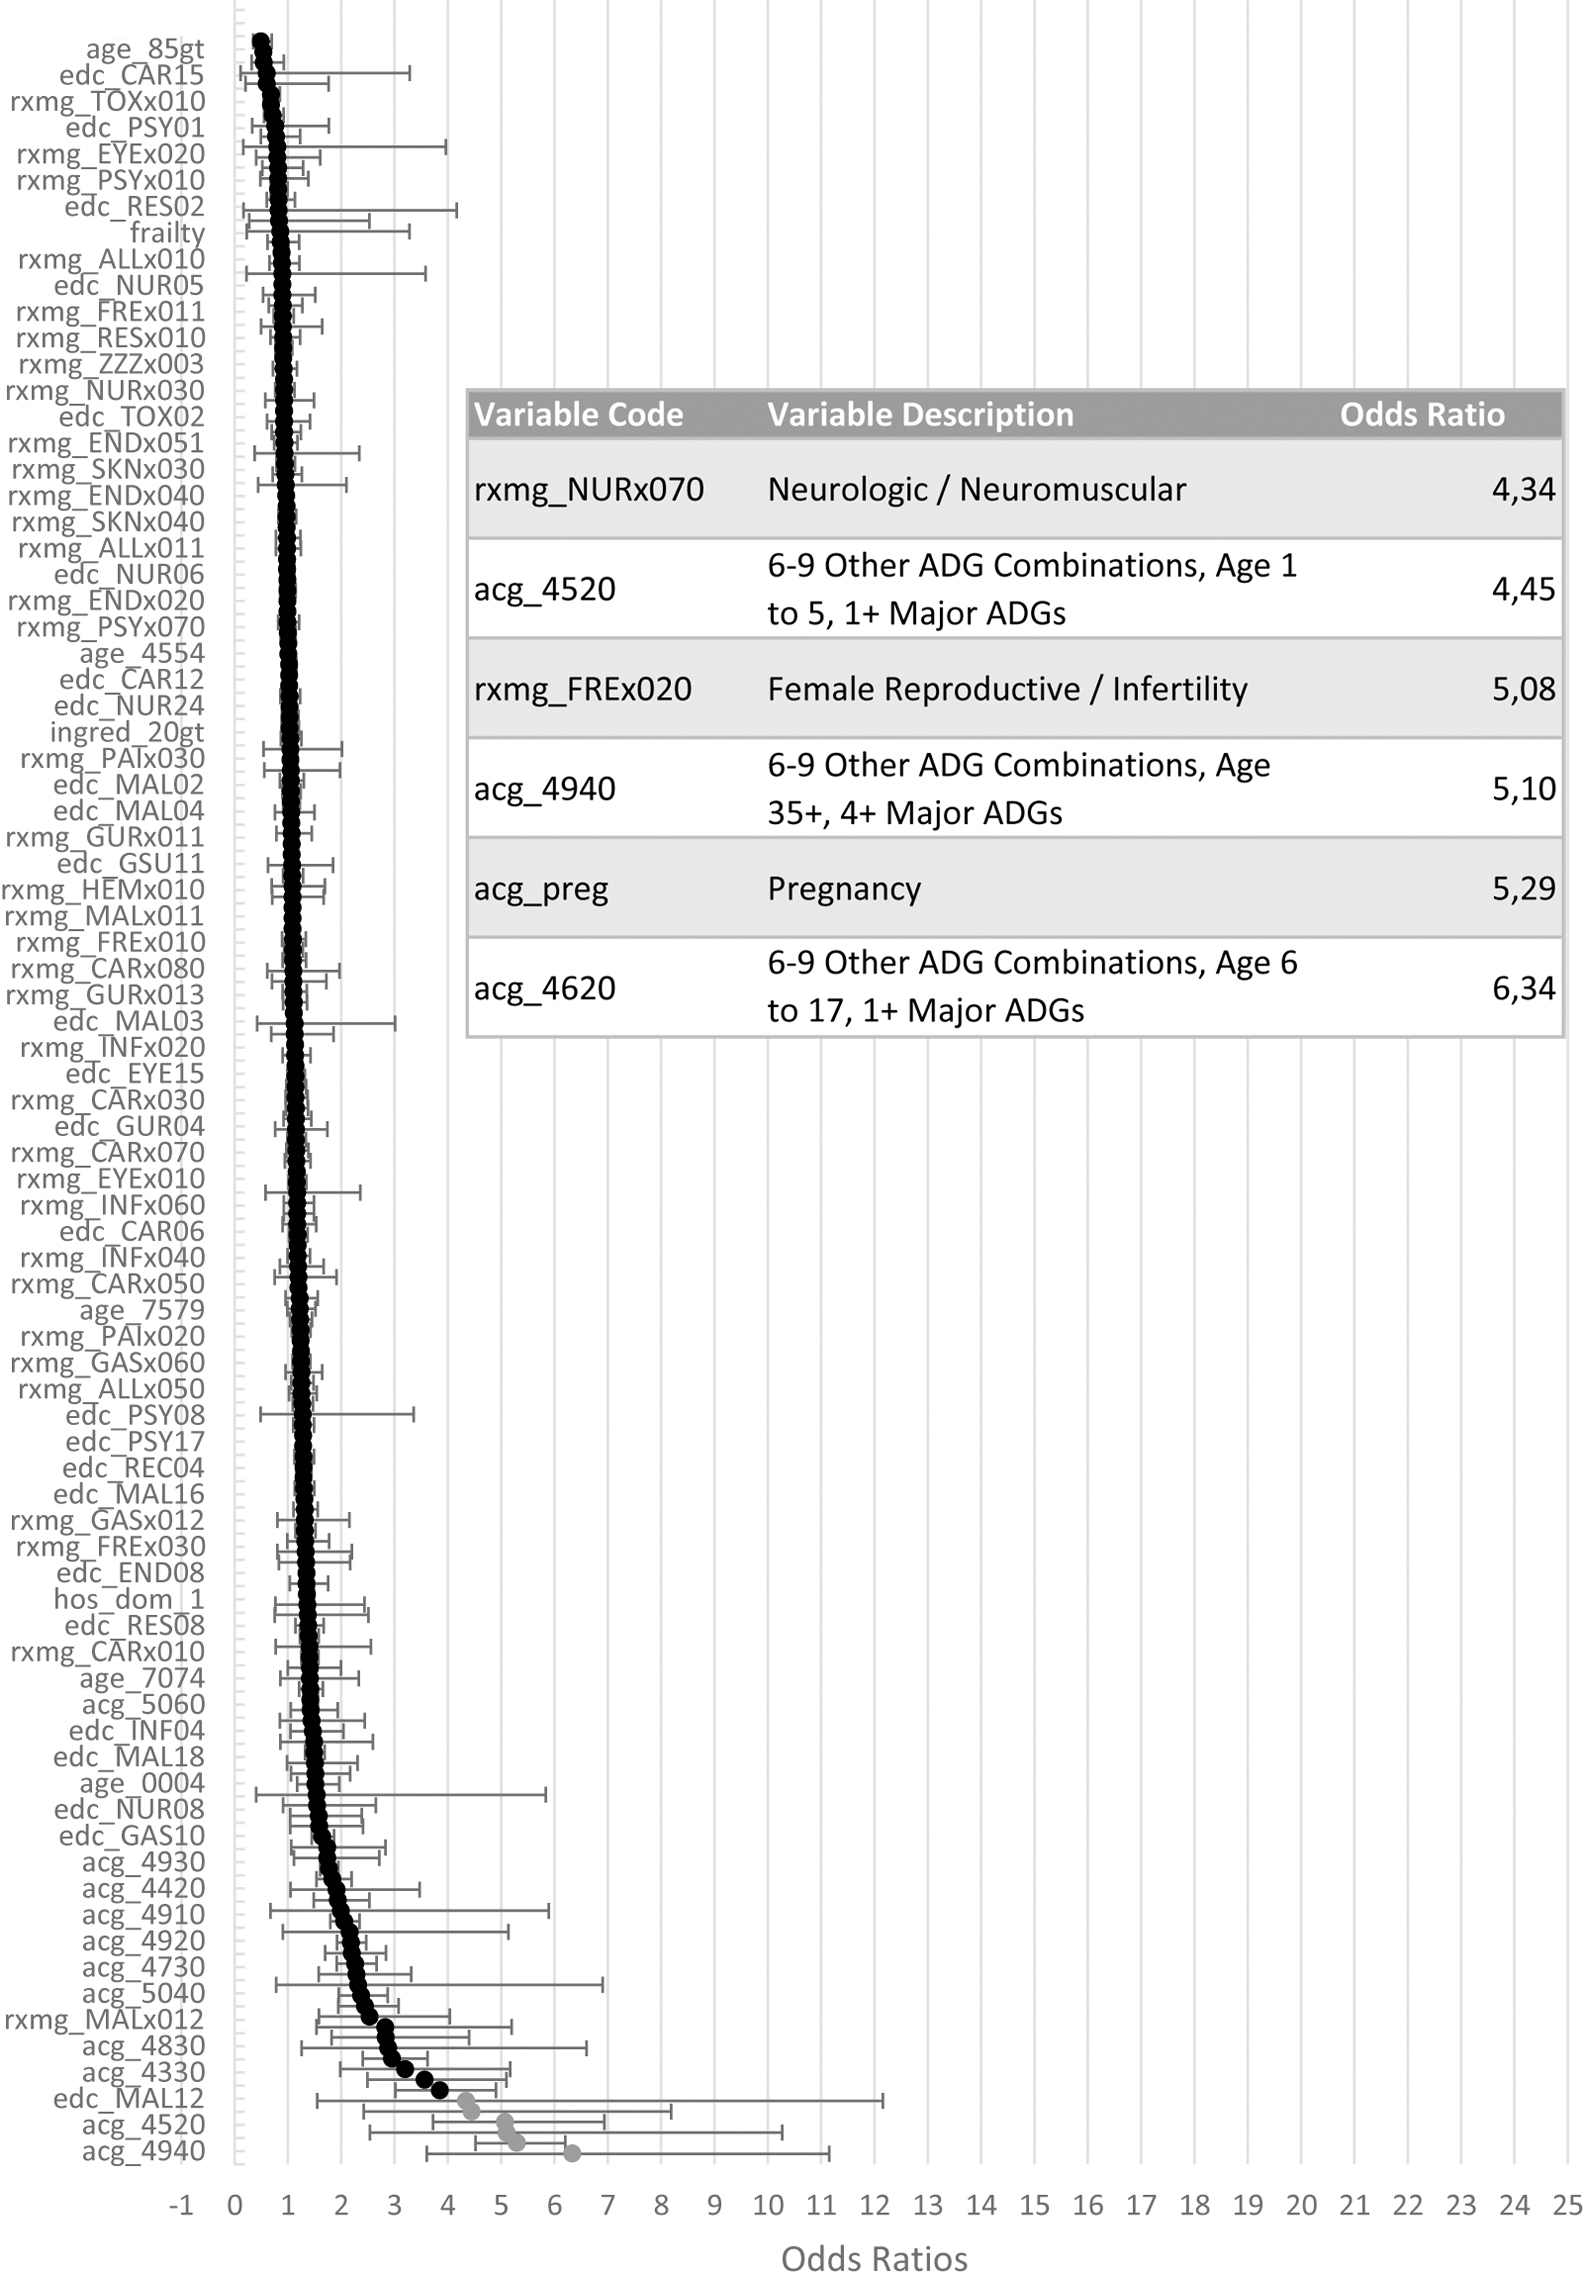
Left: S-curve of the odds ratios including confidence intervals for the variables included in the hospitalization model, arranged from highest (bottom) to lowest (top); right: table zoomed in on the odds ratios >4.
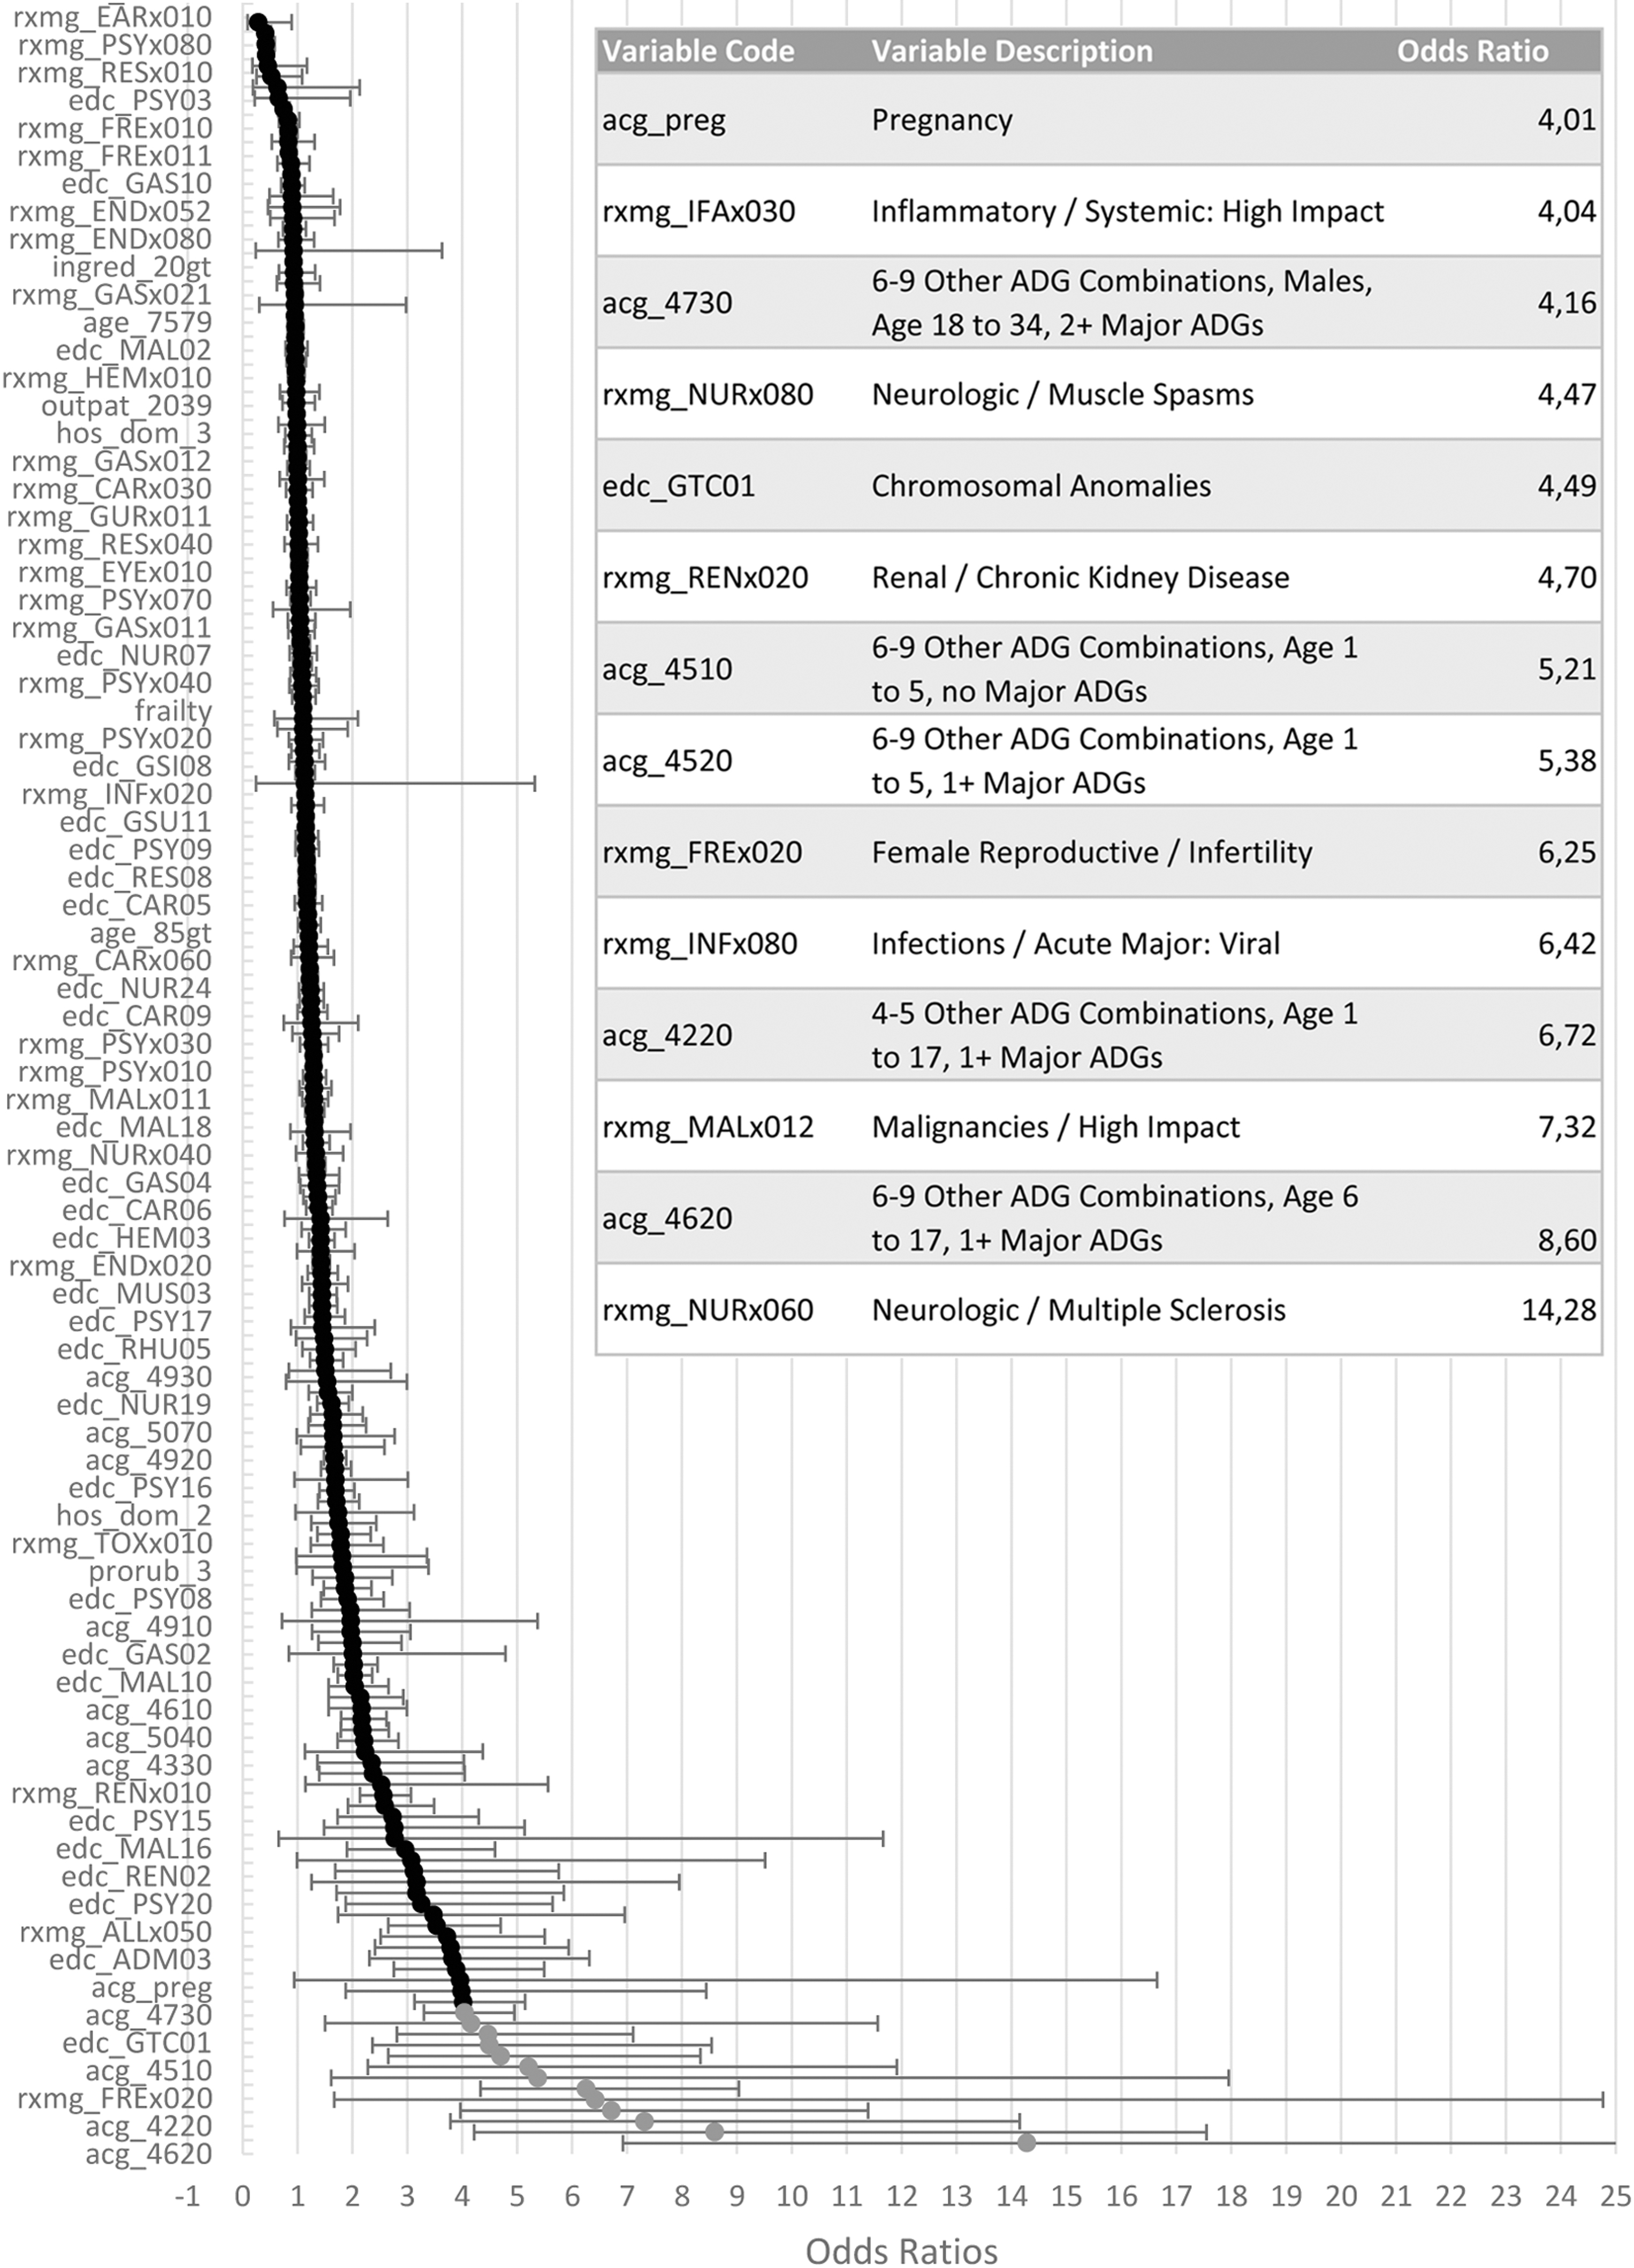
Left: S-curve of the odds ratios including confidence intervals for the variables included in the high-cost model, arranged from highest (bottom) to lowest (top); right: table zoomed in on the odds ratios >4.
For the hospitalization model the ACG categories for children <18 years old with 6–9 diagnoses types, among which at least 1 was assigned as a major diagnosis and the ACG category for adults >34 years old, with 6–9 diagnoses types, among which at least 4 were assigned as major diagnoses, along with neurological/neuromuscular problems, female infertility and pregnancy are the variables with the highest odds ratios (>4).
With odds ratios >5, ACG categories for children <18 years old with 4–9 diagnoses, with or without major diagnoses, along with conditions such as female infertility, acute major viral infections, malignancies with high impact and multiple sclerosis, all contribute highly to the high-cost model. In addition, pregnancy, systemic inflammation with high impact, muscle spasms, chromosomal anomalies, chronic kidney disease, and the ACG category for males between 18 and 34 years old with 6–9 diagnoses, among which 2 or more major ones, also contribute highly to the model with odds ratios >4.
Assessment of the adjusted models
Discriminatory ability
To assess the discriminatory ability of the adjusted models, the authors compared the C-statistics estimated for the model based on the Dutch data with those for the US-based models. This study shows fairly high C-statistics for the US hospitalization and high-cost models (0.69 [confidence interval {CI} 0.68–0.70] and 0.78 [CI 0.77–0.79]; Table 2). In addition, the Dutch models both show improvements of discriminatory ability with C-statistics raising to 0.75 (CI 0.74–0.75) for the hospitalization model and 0.85 (CI 0.84–0.85) for the high-cost 1. C-statistics for both Dutch adjusted models were similar for training and validating data sets, suggesting a similar discriminating performance of the adjusted models in an external study population.
C-Statistics for Hospitalization and High Health Care Costs (Top 5% Highest Health Care Costs) Models: Fixed US Model Versus Adjusted Model Based on Dutch Data
CI, confidence interval.
Calibrating ability
The calibration plots of both the adjusted hospitalization model (Fig. 3) and the high-cost model (Fig. 4) are located near the 45° reference line, indicating that the calibrating ability of both models is good; the persons with higher predicted values indeed have a higher chance of being hospitalized or generating higher health care costs.
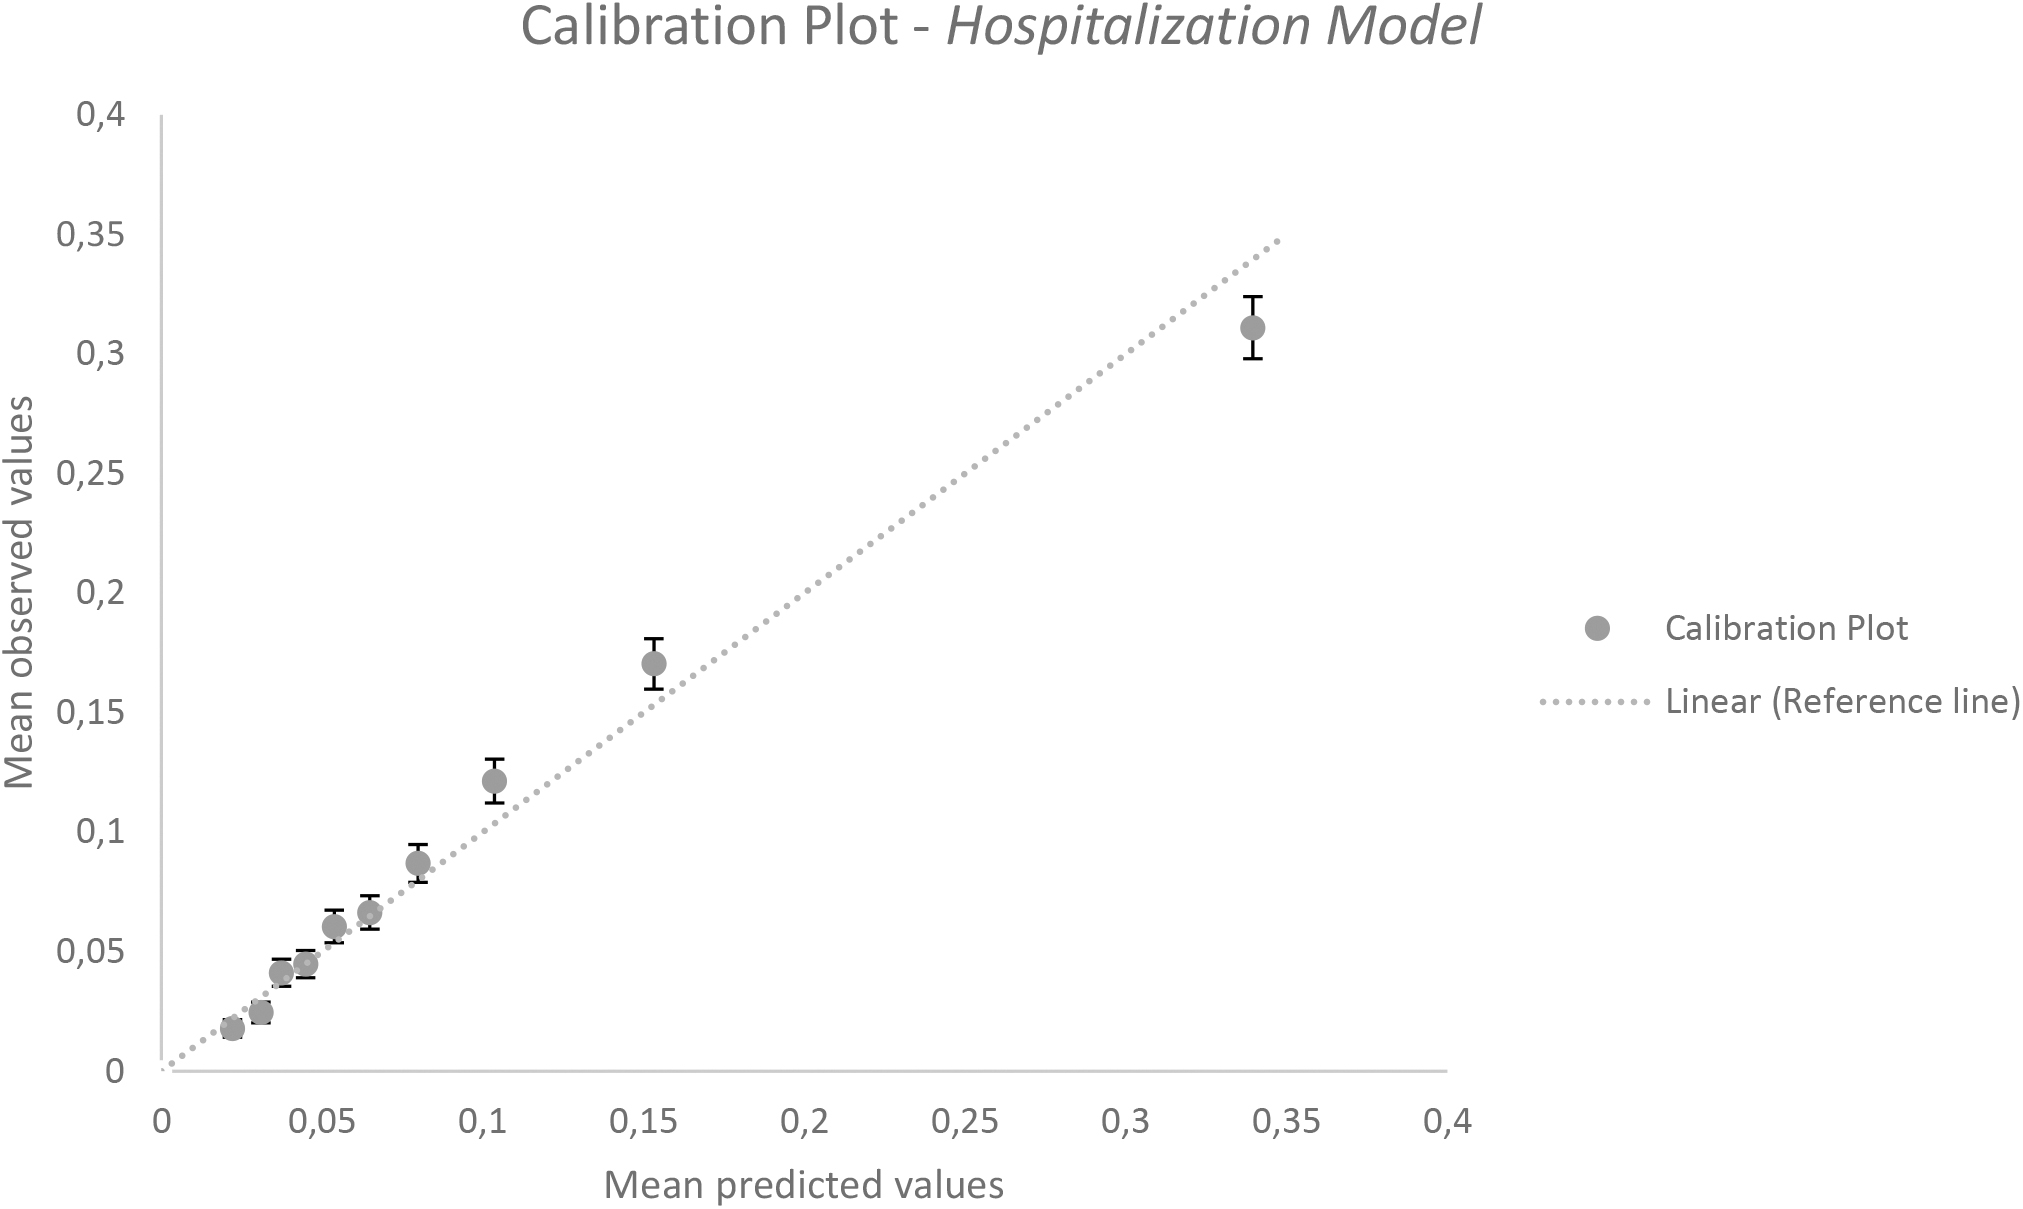
Calibration plot hospitalization model (external validation).
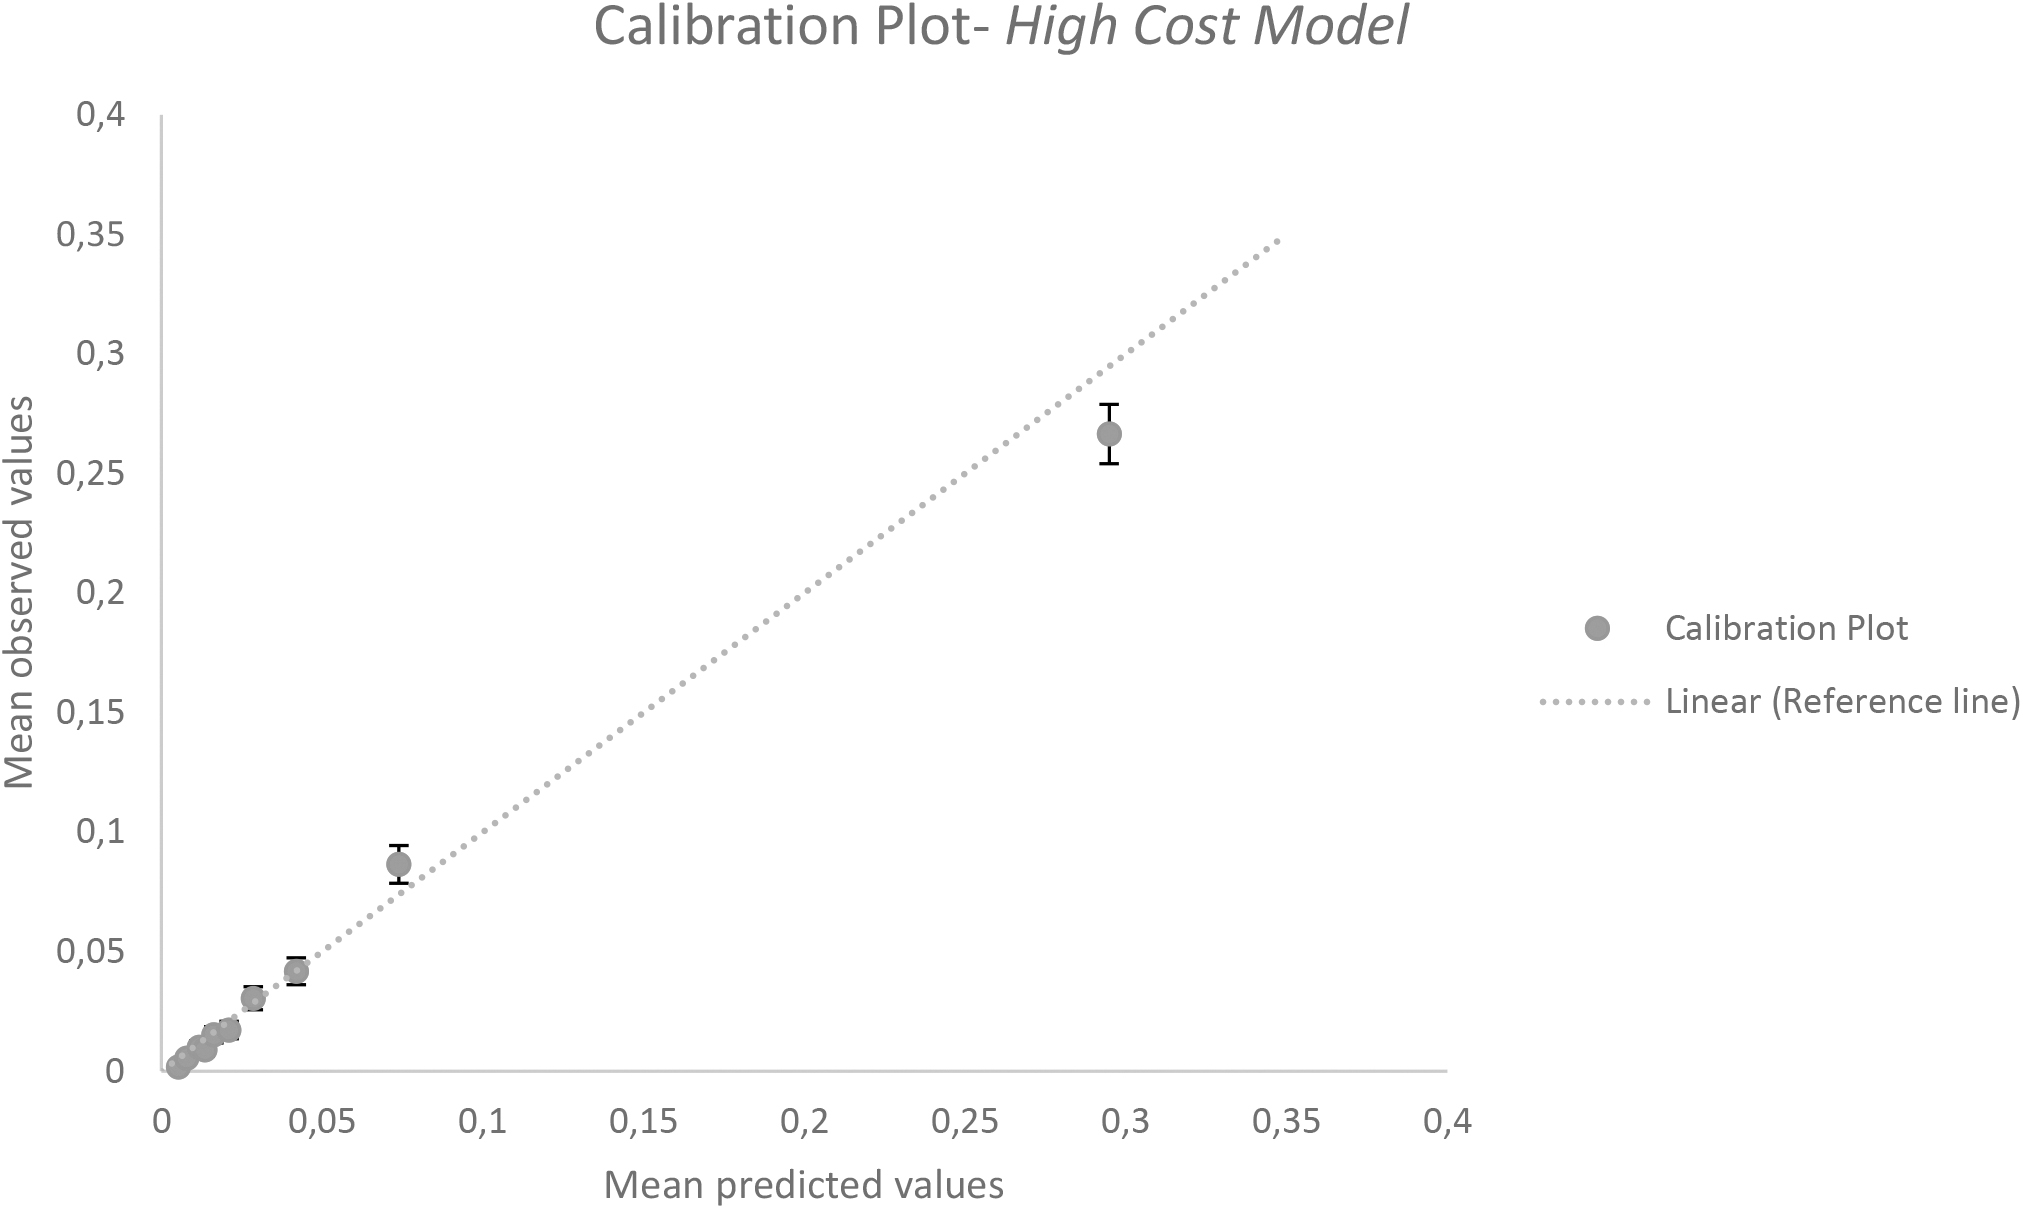
Calibration plot high health care costs/top 5% highest health care costs model (external validation).
Discussion
This study has identified promising risk stratification tools to be used in Dutch primary care. With the ACG tool applied on Dutch primary care data, model performances for the US-based models are 0.69 for the hospitalization model and 0.78 for the high-cost model. The ACG has already been proven to be an efficient risk stratification tool in different countries with C-statistics between 0.73 and 0.82 for hospitalization risk and C-statistics of 0.76 for prediction of high health care costs. 10 –12 This study suggests that the ACG's can also be used properly in The Netherlands, especially after adjustment of the model toward Dutch data.
Adjustment of the hospitalization model based on Dutch data improved C-statistics to 0.75, upgrading the model's performance. The high-cost model produced C-statistics of 0.85 after adjustment, which is regarded as “very good.” Next to good discriminatory ability, the models also showed good calibrating ability: the models can discriminate well between low- and high-risk individuals and the predicted values are in line with the observed ones. The models show excellent potential for predicting high-risk individuals within a Dutch primary care population.
Good prediction models to identify future risk of hospitalization or high costs can be of great value for planning and organizing effective health care provision. Applying such models in primary care enables identification of high-risk patients at an early stage, potentially resulting in proactive care and proper allocation of resources. As resources are getting scarce in most European countries, including The Netherlands, approaches focusing on effective and efficient resource allocation are highly valuable.
Different studies have already shown the success of selecting appropriate patients for specific interventions such as care management programs with the use of efficient risk stratification tools. 3 Subsequently, the effect of tailor-made approaches based on patients' individual risks has proven its value in reducing hospitalization and high health care costs. 4 Population Health Management approaches similar to those have the capacity to keep health care costs under control.
This study has shown the high potential of the ACG's adjusted risk models. However, this study only focused on the ACG's hospitalization and high-cost model. The many other risk models that are included in the ACG and other similar tools, all need to be validated in The Netherlands before being used in practice. However, with the validation of the hospitalization and high-cost models, the authors expect that the other ACG models will also perform well.
Second, to strengthen the models even more, the clinical validity of the predictors in the models, needs to be reassessed for a Dutch setting. A strong statistical association with a predictor and the outcome does not necessarily establish the clinical meaning of the predictor. Focus should be put on the association of the model predictors with avoidable hospitalization and high costs. Involvement of health professionals in this process is important.
In addition, as promising as the application of a risk stratification tool is, the strength of a prediction model only reaches as far as the quality of the health registries. The more primary care physicians realize the strengths of a registry of good quality, the better routinely collected data can be used for risk stratification approaches. Creating awareness among physicians is the first step in successful application of risk stratification tools.
Not only will awareness among health care professionals lead to better registration, but it is also important for an efficient practical use of risk stratification approaches in health care. To create awareness among professionals, more evidence is needed of the effectiveness of risk stratification models. Intervention studies in which patients are selected for specific interventions with the use of risk stratification models will contribute to this.
In conclusion, the Dutch health care system might truly benefit from the use of risk stratification models, especially when applied in an early stage of care provision such as primary care. The ACG system provides a solid basis to measure multimorbidity and local adjustments of the ACG's models improve results.
Footnotes
Acknowledgments
The authors acknowledge Stichting georganiseerde eerstelijnszorg Zoetermeer (SGZ), stichting gezondheidscentra Nijkerk, Unicum huisartsenzorg, and Urker Huisartsen Maatschap, and all involved physicians for providing the data for this research.
Authors' Contributions
Concept and design by S.A.M.G., S.P.S., M.F., and M.A.B.; acquisition of data and drafting of the article by S.A.M.G. and M.A.B.; analysis and interpretation of data, and statistical analysis by S.A.M.G., M.F., S.P.S., and M.A.B.; critical revision of the article for important intellectual content by M.F., S.P.S., M.E.N., and M.A.B.; provision of patients or study materials and obtaining funding by M.A.B.; administrative, technical, or logistic support by S.A.M.G. and M.E.N.; and supervision by M.F., M.E.N., and M.A.B.
Author Disclosure Statement
The authors declare that they have no competing interests.
Funding Information
This research was funded by Noaber Foundation (Lunteren, The Netherlands). Noaber Foundation did not play a role in the design of the study, the collection, analysis, and interpretation of data, and in writing the article.
Supplementary Material
Supplementary Table S1
Supplementary Table S2
References
Supplementary Material
Please find the following supplemental material available below.
For Open Access articles published under a Creative Commons License, all supplemental material carries the same license as the article it is associated with.
For non-Open Access articles published, all supplemental material carries a non-exclusive license, and permission requests for re-use of supplemental material or any part of supplemental material shall be sent directly to the copyright owner as specified in the copyright notice associated with the article.