
Abstract
The objective was to develop a propensity to succeed (PTS) process for prioritizing outreach to individuals with Medicare Supplement (ie, Medigap) plans who qualified for a high-risk case management (HRCM) program. Demographic, socioeconomic, health status, and local health care supply data from previous HRCM program participants and nonparticipants were obtained from Medigap membership and health care claims data and public data sources. Three logistic regression models were estimated to find members with higher probabilities of engaging in the HRCM program, receiving high quality of care once engaged, and incurring enough monetary savings related to program participation to more than offset program costs. The logistic regression model intercepts and coefficients yielded the information required to build predictive models that were then applied to generate predicted probabilities of program engagement, high quality of care, and cost savings a priori for different members who later qualified for the HRCM program. Predicted probabilities from the engagement and cost models were then standardized and combined to obtain an overall PTS score, which was sorted from highest to lowest and used to prioritize outreach efforts to those newly eligible for the HRCM program. The validity of the predictive models also was estimated. The PTS models for engagement and financial savings were statistically valid. The combined PTS score based on those 2 components helped prioritize outreach to individuals who qualified for the HRCM program. Using PTS models may help increase program engagement and financial success of care coordination programs. (Population Health Management 2015;18:402–411)
Introduction
T
Individuals who are age 65 and older have the highest mean health care expenditures among all age groups. 3 The vast majority of those who are age 65 and older use Medicare as their primary source of health insurance. Even within this age group, health care spending varies. For example, the 37% of these Medicare beneficiaries with 4 or more chronic conditions disproportionately account for 74% of all Medicare expenditures. 4 Thus, attempts made to improve the health, as well as the quality and efficiency of health care delivery among older individuals with multiple chronic conditions have significant potential to decrease Medicare spending.
Individuals with multiple chronic conditions often receive health care that is fragmented, of poor quality, and inefficient. 5 To help these individuals live healthier lives and to improve the quality and efficiency of their health care, a number of care coordination programs have been developed. Typically, these programs aim to engage those most at risk for severe illness or high health care utilization. Once these individuals are engaged, teams of care coordination professionals work with them via telephone, mail, or in-home consultations. During the consultations, the care coordinator will assess gaps in health care and develop a plan intended to meet the health care needs of the program participant. Care coordinators also may confer with medical providers, review the appropriateness of and compliance with prescription medications, accompany individuals to their medical appointments if needed, provide patient education, and refer program participants to community resources when appropriate.
However, the success of care coordination programs has been mixed. The Congressional Budget Office (CBO) recently reviewed several demonstration projects for fee-for-service Medicare disease management and care management that were sponsored by the Centers for Medicare & Medicaid Services (CMS). 6 Unfortunately, the CBO review reported that most of these programs had not reduced Medicare spending. The programs that were most likely to reduce Medicare spending included regular interactions with patients and their physicians.
Overall, the CMS demonstration programs did not result in sufficient savings to offset program costs. Exceptions included 1 program that became profitable by relying more on frequent phone and occasional in-person contact from care managers who concentrated on patients with the greatest risk of hospitalization. 7 Another organization also recently reported improvements in quality of life and a reduction in the costs to patients with complex health profiles by using an integrated care coordination program. 8 Similar to the more successful CMS demonstrations, the care coordination team had regular face-to-face contact with patients and medical staff.
Even though the benefits of care coordination programs have not been confirmed, the US Department of Health and Human Services must believe that care coordination programs hold promise because it included the further exploration of care coordination demonstrations as a part of the strategic framework to improve the health of individuals with multiple chronic conditions. 9
Intervention
More than 3.5 million Americans aged 65 and older are covered by an AARP Medicare Supplement (ie, Medigap) plan insured by UnitedHealthcare Insurance Company (or, for New York residents, UnitedHealthcare Insurance Company of New York). These Medigap plans are offered in all 50 states, Washington, DC, and various US territories. Together with AARP, UnitedHealthcare began offering free care coordination programs, including high-risk case management (HRCM), in December 2008 to members in these plans. The HRCM program was offered as a pilot program in parts of California, Florida, New York, North Carolina, and Ohio. This program was intended to identify and engage individuals with multiple chronic health conditions who may benefit from additional care coordination and ancillary support.
Referral to the HRCM program may come directly or indirectly. The direct referrals account for about 20% of members who qualify for the program. These referrals include those from several sources: the insured's doctor, a registered nurse working for the Optum Nurse HealthLine call-in advice program, patient caregivers, and those identified as being at high risk for poor health via the administration of a health risk questionnaire, which gauges general physical and mental health status. About 80% of qualified members are identified indirectly, through data-driven referrals. These members are found to be qualified for the HRCM program by algorithms that use claims data to assess the presence of chronic conditions and to find those who have high health risk scores.
Among the data-driven referrals, the current HRCM qualification process gives highest priority to those with the highest risk scores. Specifically, qualification for the HRCM program was based on having a prospective community Hierarchical Condition Category (HCC) risk score of greater than 3.74. The HCC is a standard risk adjustment score utilized by CMS; higher prospective HCC scores reflect expectations for poorer health and proportionally higher costs in the future based on the individual's current set of medical conditions. An HCC score of 3.74 or higher indicates those whose costs are expected to be that many or more times the average costs of all Medicare beneficiaries in the coming year. About 3% of the AARP Medigap insureds had HCC scores of 3.74 or higher.
People with high risk scores and many of the direct referrals had multiple chronic conditions, but they were difficult to engage and keep in the HRCM program. Therefore, a new method was developed to sort referrals according to their “propensity to succeed” (PTS) in the HRCM program. The PTS score for an individual is based on his or her probabilities of engaging in the HRCM program and doing well, as will be described.
Methods
Characteristics of program success
The HRCM is aligned with the AARP goal of better serving the older US population, with UnitedHealth Group's mission of helping people live healthier lives, and with Optum's mission of making the health care system work better for everyone. UnitedHealthcare (the AARP Medigap plan provider) and Optum (the HRCM program provider) are both UnitedHealth Group companies.
With these missions and goals in mind, the HRCM program has multiple criteria for success: 1. Engagement (ie, participation) in the program must be high to maximize its success. 2. Health will be better among those who participate in the HRCM program if the quality of their medical care is higher because of that engagement. 3. High engagement and better quality of care should save money on health care expenditures for Medigap insureds, the Federal Medicare program, and the insurance company, suggesting that HRCM participants have made more coordinated and more efficient use of the medical care system. A higher degree of success will be attained if savings in medical expenditures exceed the cost of providing the HRCM program.
Arguably, there also are other attributes that enable older people to live healthier lives, better utilize the medical care system, and receive better health care service. Examples include higher satisfaction with health care providers and services, healthier lifestyles, and better self-rated health status and quality of life, but the 3 attributes enumerated are the only ones for which the research team currently has data for all who qualify for the HRCM program. Therefore, the team began by operationalizing a notion of program success focusing on those 3 areas.
If success is related to high engagement, better quality of care, and savings in medical expenditures, then one can improve the likelihood of program success by improving the probabilities that those who qualify for the HRCM program will participate in it, receive better quality of care as a result of participation, and save enough in medical expenditures to more than offset the cost of providing the HRCM program. Improving these probabilities first requires measuring them, and measurement requires clear understanding of the factors that drive these probabilities.
The PTS approach that the research team has developed and tested is based on efforts to estimate these 3 probabilities for everyone who qualified for the HRCM program during the December 2008–December 2011 study time frame. Any or all of these probabilities can then be standardized and combined to create a single PTS score for each qualified member. Sorting those who qualified for the HRCM program from highest to lowest based on their PTS scores provided a list of whom to contact first, second, third, and so on, to discuss the attributes of the program. Prioritizing outreach in this way should help maximize success in the HRCM program while also reducing program administration costs. The analyses that will be described show how the PTS process was operationalized and tested.
Sample selection
The PTS approach is based on predictive models, which were developed and tested using available data. The data were obtained from a study sample consisting of AARP Medigap insureds who were qualified for the HRCM pilot program in the 5 states mentioned earlier. Included were those who qualified for the HRCM program sometime during the period from December 2008 through December 2011. Members were divided into those who were qualified to participate in the program and did participate (ie, they engaged in the program) and those who were qualified to participate but did not participate in the program (ie, the non-engaged comparison group). The non-engaged individuals either could not be contacted or declined to participate in the program.
Data sources
The statistical models used to derive the PTS score were based on Medigap plan membership and medical and pharmacy claims data obtained for all referrals to the program. The plan membership data included contact information for insureds and information about which of the 10 standard Medigap plans each individual chose. These plans differed in terms of the coverage offered for Medicare fee-for-service deductibles and coinsurance and other types of services not covered entirely by the Medicare program.
The medical claims and pharmacy claims data, which are from separate sources, included records for each Medicare fee-for-service claim that was submitted for payment by physicians and other providers of service to Medigap insureds. In addition to the Medicare and Medigap payment information for the services used in the treatment process, these records also included dates and locations of service; indicators of the types of services, drugs, and procedures provided; and the International Classification of Diseases, 9th Revision, Clinical Modification diagnostic codes assigned to indicate the health problems of HRCM program qualified members.
Other data sources were used as well. Specifically, the AmeriLINK Data Sourcing system generated by the KBM Group, which was used to find information about socioeconomic status for each qualified member. The KBM Group generates this information by collecting data from public records, purchase transactions, US Census data, and consumer surveys. 10 In addition, information about the local supply of health care services in areas where qualified members lived was derived from the Dartmouth Atlas of Healthcare. 11
Outcome variables used for PTS analysis
Logistic regression analyses were used to estimate the 3 predicted probabilities associated with success in the HRCM program. The first element of program success relates to engagement in the program. Engagement was coded as Yes or No based on whether qualified individuals agreed to participate in the program and were actively working with nurses via telephone or face-to-face visits to close gaps in medical care, to better prepare for conversations with their doctors about the care they needed, or to better care for themselves at home.
Higher quality of care was coded as Yes or No based on whether the individual met 70% or more of the relevant clinical care guidelines that were pertinent to his or her medical problems. The metrics used to generate the quality of care percentages and hence the binary indicator for the receipt of higher quality of care for each individual were based on improvements in metrics related to hospital readmissions and evidence-based medicine (EBM) 17 guidelines for recurring office visits to manage health conditions. The EBM metrics also addressed compliance with recommended laboratory testing and pharmacotherapy regimens.
For example, someone who satisfied only 5 of 10 relevant quality of care metrics was assigned a quality score of 50%. Those who met at least 70% of their quality metrics were defined as receiving higher quality of care in this study. Seventy percent was chosen because the commercial software used to create the quality metrics uses 70% as the cutoff for labeling insureds as highly adherent to quality of care guidelines. Given the wide range of medical problems that sample members had, all of the 515 EBM metrics that can be measured by Version 7.6 of the EBM tool were considered when quality scores were generated. However, fewer than 20 of these metrics were relevant for most individuals because the EBM quality of care metrics are based on the particular medical conditions each person has. The EBM rules this study focused on were those that had at least 100 members in the denominators.
Finally, savings associated with the HRCM program occurred if medical expenditures per month decreased after engaging in the HRCM program, and if these reductions were greater than reductions in expenditures per month observed for similar nonparticipants. Savings also were recognized if medical expenditures increased less over time among program participants than among nonparticipants. Anyone whose expenditure patterns differed from these 2 patterns had losses in medical expenditures.
Program success pertaining to savings in medical expenditures was measured more conservatively than just denoting whether savings or losses occurred. The PTS process was developed to identify those who likely would save more in medical expenditures than it cost to provide the program to them. For these analyses, those whose savings exceeded the cost of the program were differentiated from those whose savings did not exceed the cost of the program, and from those who had program-related losses in medical expenditures. Program savings were coded as Yes or No, depending on whether savings were high enough to exceed the cost of the HRCM program.
Independent variables for PTS analyses
Using the data sources described, several demographic, Medigap plan type, socioeconomic, health status, and health care supply measures were constructed and used to generate the predicted probabilities of program success related to engagement, quality of care, and savings (Table 1). Demographics included age, sex, state of residence, and whether or not the HRCM-qualified individual lived alone. Individuals also were categorized by whether or not they had Medigap plan type C, F, or J, which are commonly associated with better first-dollar coverage because they offer more complete coverage for Medicare deductibles and coinsurance. People with such plans may face lower out-of-pocket expenditures and therefore be more willing to participate in programs that help coordinate their care.
HCC, Hierarchical Condition Category.
Calculated per 1000 residents.
Calculated per 100,000 residents.
The PTS analyses also accounted for differences in the supply of health care services in the individual's hospital service area of residence. 11 Supply factors are well known to influence health care utilization and expenditures. 12 Therefore, the research team included measures based on the number of primary care physicians and hospital beds in the individual's zip code of residence; each of these was calculated based on the individual's hospital service area. 13
Socioeconomic variables included race and income. Because race and income were not known for each individual, proxies for these variables were coded from US Census data, based on the zip code where the individual lived. Such data have been used successfully in other statistical modeling endeavors, so using imperfect data in the initial approach was preferable to overlooking adjustment for the influence of socioeconomic factors. 28
Race was categorized as likely to be high, medium, or low, depending on the percent of minority residents in the individual's zip code. The minority percentage was calculated as the ratio of nonwhite population/total population, where a resulting value of 0 to 15% was categorized as a low minority area, 15% to 60% was categorized as a medium minority area, and ≥60% was categorized as a high minority area. Income was coded as likely to be high, medium-high, medium-low, or low based on whether the median income in the individual's zip code was in the highest, second-highest, third-highest, or lowest quartile in 2010, according to US Census records.
Health status was accounted for by including each individual's HCC score in the analysis and by measuring the number of emergency room visits and hospitalizations during the 6 months prior to HRCM program qualification. People with recent hospitalizations may be more amenable to changing either health behaviors or health care treatment options, 15 which can be facilitated via engagement in the HRCM program.
Statistical analysis
The PTS approach is a form of predictive modeling that utilized information about previous HRCM program participants and nonparticipants to generate models that were then used with information about later referrals to the program, identifying which of the more recent referrals to approach first. First, the research team used data from previous program participants and nonparticipants to learn which of the independent variables (Table 1) influenced their decisions to engage in the program, as well as to determine the relative quality of care associated with engagement and whether engagement was likely to save enough health care expenditures to offset the cost of providing the program. Logistic regression analyses were used to determine what the influential independent variables were.
Then, the team used the results of the logistic regression analyses to build predictive models that were applied to independent variable data obtained from more recent program referrals to estimate each new referral's probabilities of: engaging in the program, receiving higher quality of care because of that engagement, and saving enough health care expenditures to offset the cost of providing the HRCM program.
For example, with regard to engagement, a newly referred member's predicted probability of engaging in HRCM was based on the intercept obtained from the logistic regression model on engagement, plus the sum of several factors related to each of his or her independent variable values. Suppose that the newly referred member was male, had purchased Medigap plan type C, F, or J, and lived in a high-minority area with many medical specialists per thousand population. His independent variable values would be coded as 1.0 and then multiplied by the respective logistic regression coefficients for these variables (see the footnote to Table 2 for a method to calculate these coefficients). These multiplicative products would then be added together to account for his predictors of engagement in the HRCM.
CI, confidence interval; HCC, Hierarchical Condition Category; OR, odds ratio.
Reference category
Per 1000 residents
Per 100,000 residents
Note: Regression coefficients can be obtained for each variable by taking the antilog of the reported odds ratio. For example, the logistic regression coefficient for the 65–74 age group in the Engagement model equals the natural log of 0.87, which is −0.13926. The intercepts for engagement, financial savings, and higher quality of care were −2.4538, −0.00347 and −0.66, respectively.
The processes for estimating predicted probabilities of receiving high-quality care and for saving enough money in health care expenditures to offset program costs worked in the same way, but used intercept and variable coefficients from the quality of care and savings regressions, respectively.
PTS model validation
The purpose of conducting validity analyses for the PTS approach was to understand its predictive power in the applications, which may help the reader understand its potential predictive utility in other applications. Several measures were used to evaluate the validity of the PTS models, including calculating likelihood ratio tests and goodness of fit statistics 18 to determine how well the logistic regression approach fit the data used.
An area under the curve (AUC) analysis 19 was conducted for each PTS model. The AUC c-statistic was used to assess the association of the predicted probabilities with observed responses, which corresponds to a lift in the receiver operating curve (ROC) used in the AUC analysis. This analysis provides a measure of accuracy, based on the specificity and sensitivity of each of the PTS component scores. Specifically, a ROC curve is a plot of sensitivity on the y axis against (1-specificity) on the x axis. 20 Generally, AUC statistics are interpreted as excellent if their values range from 0.90 to 1.0, good if their values range from 0.80 to 0.90, fair if their values range from 0.70 to 0.80, poor if their values range from 0.60 to 0.70, and failure for values lower than 0.60. 21
Next, the research team conducted bootstrapping analyses that produced 95% confidence intervals around the PTS model estimates and AUC values. For the bootstrapping procedure, 1000 simulations were performed, resampling the original data to generate 1000 new data sets. The team then tested if the model estimates and the AUC values produced via the logistic regressions of the original data fit within the 95% confidence intervals produced in the bootstrapping simulations.
Finally, the research team used a K-fold cross-validation technique based on K replicate samples of the data to help assess the validity of the PTS process. 22,23 This technique was based on K replicate samples of the data, each replicate using (K-1)/K of the data to build a PTS model and the remaining 1/K of the data to test the PTS model. Thus, every data point was used in a PTS model test set K-1 times and was used in a training set K times. Parameter estimates from each of the K-1 models were used to predict the values for the remaining 1/K subsets of data. K-fold cross-validation indicates how well the PTS models can be used to predict the probabilities of engagement, higher quality of care, and medical expenditure savings for the Medigap population of interest in the study.
PTS summary scores
After conducting the validity tests, only the engagement and financial savings models were found to be valid predictors of program success. Therefore, only the 2 predicted probabilities for these PTS components were combined into a summary score that was used by the HRCM program managers to enhance the prioritization process that occurs prior to outreach efforts. Because the predicted probabilities varied in magnitude across these 2 components, they were standardized to allow each predicted probability to contribute equally to the summary PTS score for each individual. In the monthly outreach process for the HRCM program, managers had the ability to adjust the weighting so that more or less emphasis was given to either of the 2 components in any given month as appropriate.
Results
The PTS modeling process for the HRCM program included data from 2018 engaged individuals and 7671 non-engaged comparison group members (Table 1). Among the more notable differences, the engaged were predominantly female, from zip codes with medium income, had HCC scores <2.8, or resided in an area with the highest density of primary care physicians. The research team also compared the demographics for the engaged and non-engaged HRCM sample members to those published in the 2011 CMS Medicare Current Beneficiary Survey. 24 The HRCM sample was older, slightly more female, probably included a higher percentage of minorities, probably included more individuals with higher incomes, and had a higher percentage living in metropolitan areas.
Significant predictor variables
Logistic regression models for engagement, higher quality of care, and financial success identified several statistically significant predictor variables (Table 2). Women and those who resided in Florida, North Carolina, or a zip code with a large number of primary care physicians, who chose Medigap Plans C, F, or J, who had HCC scores of 3.74 or less, or were hospitalized in the pre period were more likely to engage in the HRCM program. Although the qualification for the HRCM program was based on HCC scores of 3.75 or higher using claims data to find program members, those who were referred directly to the program by other means could and often did have lower HCC scores, which explains this finding.
Conversely, members who were 85 years of age or older, resided in California or in zip codes with a small number of hospital beds, or whose living alone status was unknown, were less likely to engage.
Two characteristics were positively associated with saving enough money via program participation to more than offset the cost of the HRCM program. These included living in an area where the population density was lower than the 25th centile and being hospitalized in the pre period. Conversely, there were several characteristics negatively associated with saving enough money via program participation to more than offset the cost of the HRCM program. These characteristics included being at least 85 years of age or older, living in North Carolina, having an HCC score of 4.26 or less, or having an unknown living alone status.
With regard to higher quality of care, 31.6% of the sample members had quality of care scores above 70%. Members who lived in Ohio or were hospitalized in the pre-period were less likely to have quality of care scores above 70%, while those with an HCC score between 2.80 and 4.26 were more likely to have quality of care scores that high.
Although the primary goal of the PTS analysis was to calculate each individual's overall PTS score, the results relating to the HCC score as a predictor of that score are noteworthy. Previously, individuals were prioritized for the HRCM program first by whether they were directly referred to it, then according to their HCC scores. However, the logistic models used for the PTS analyses indicated that HCC scores were not a significant predictor of positive program savings. Moreover, the odds of engagement in the HRCM program decreased with increasing HCC scores. Thus, to the extent that previous outreach methods relied on the HCC score, it was not prioritizing members as effectively as it could have been.
Predicted probabilities for the PTS components
The distributions of the members' predicted probabilities of engagement and financial savings are shown in Figures 1a–b. In addition, Figure 1c shows the overall distribution for the summed probabilities for engagement and financial success. In all 3 figures, there is a wide distribution of scores, indicating that some members are far more likely than others to engage and succeed in this program. This is very important because if there were very little dispersion in the distribution of scores, prioritization would not help much. For example, when the engagement and financial success scores are combined, those with the highest score (1.15) are more than 3 times as likely to succeed in the program as those with the lowest score (0.34).
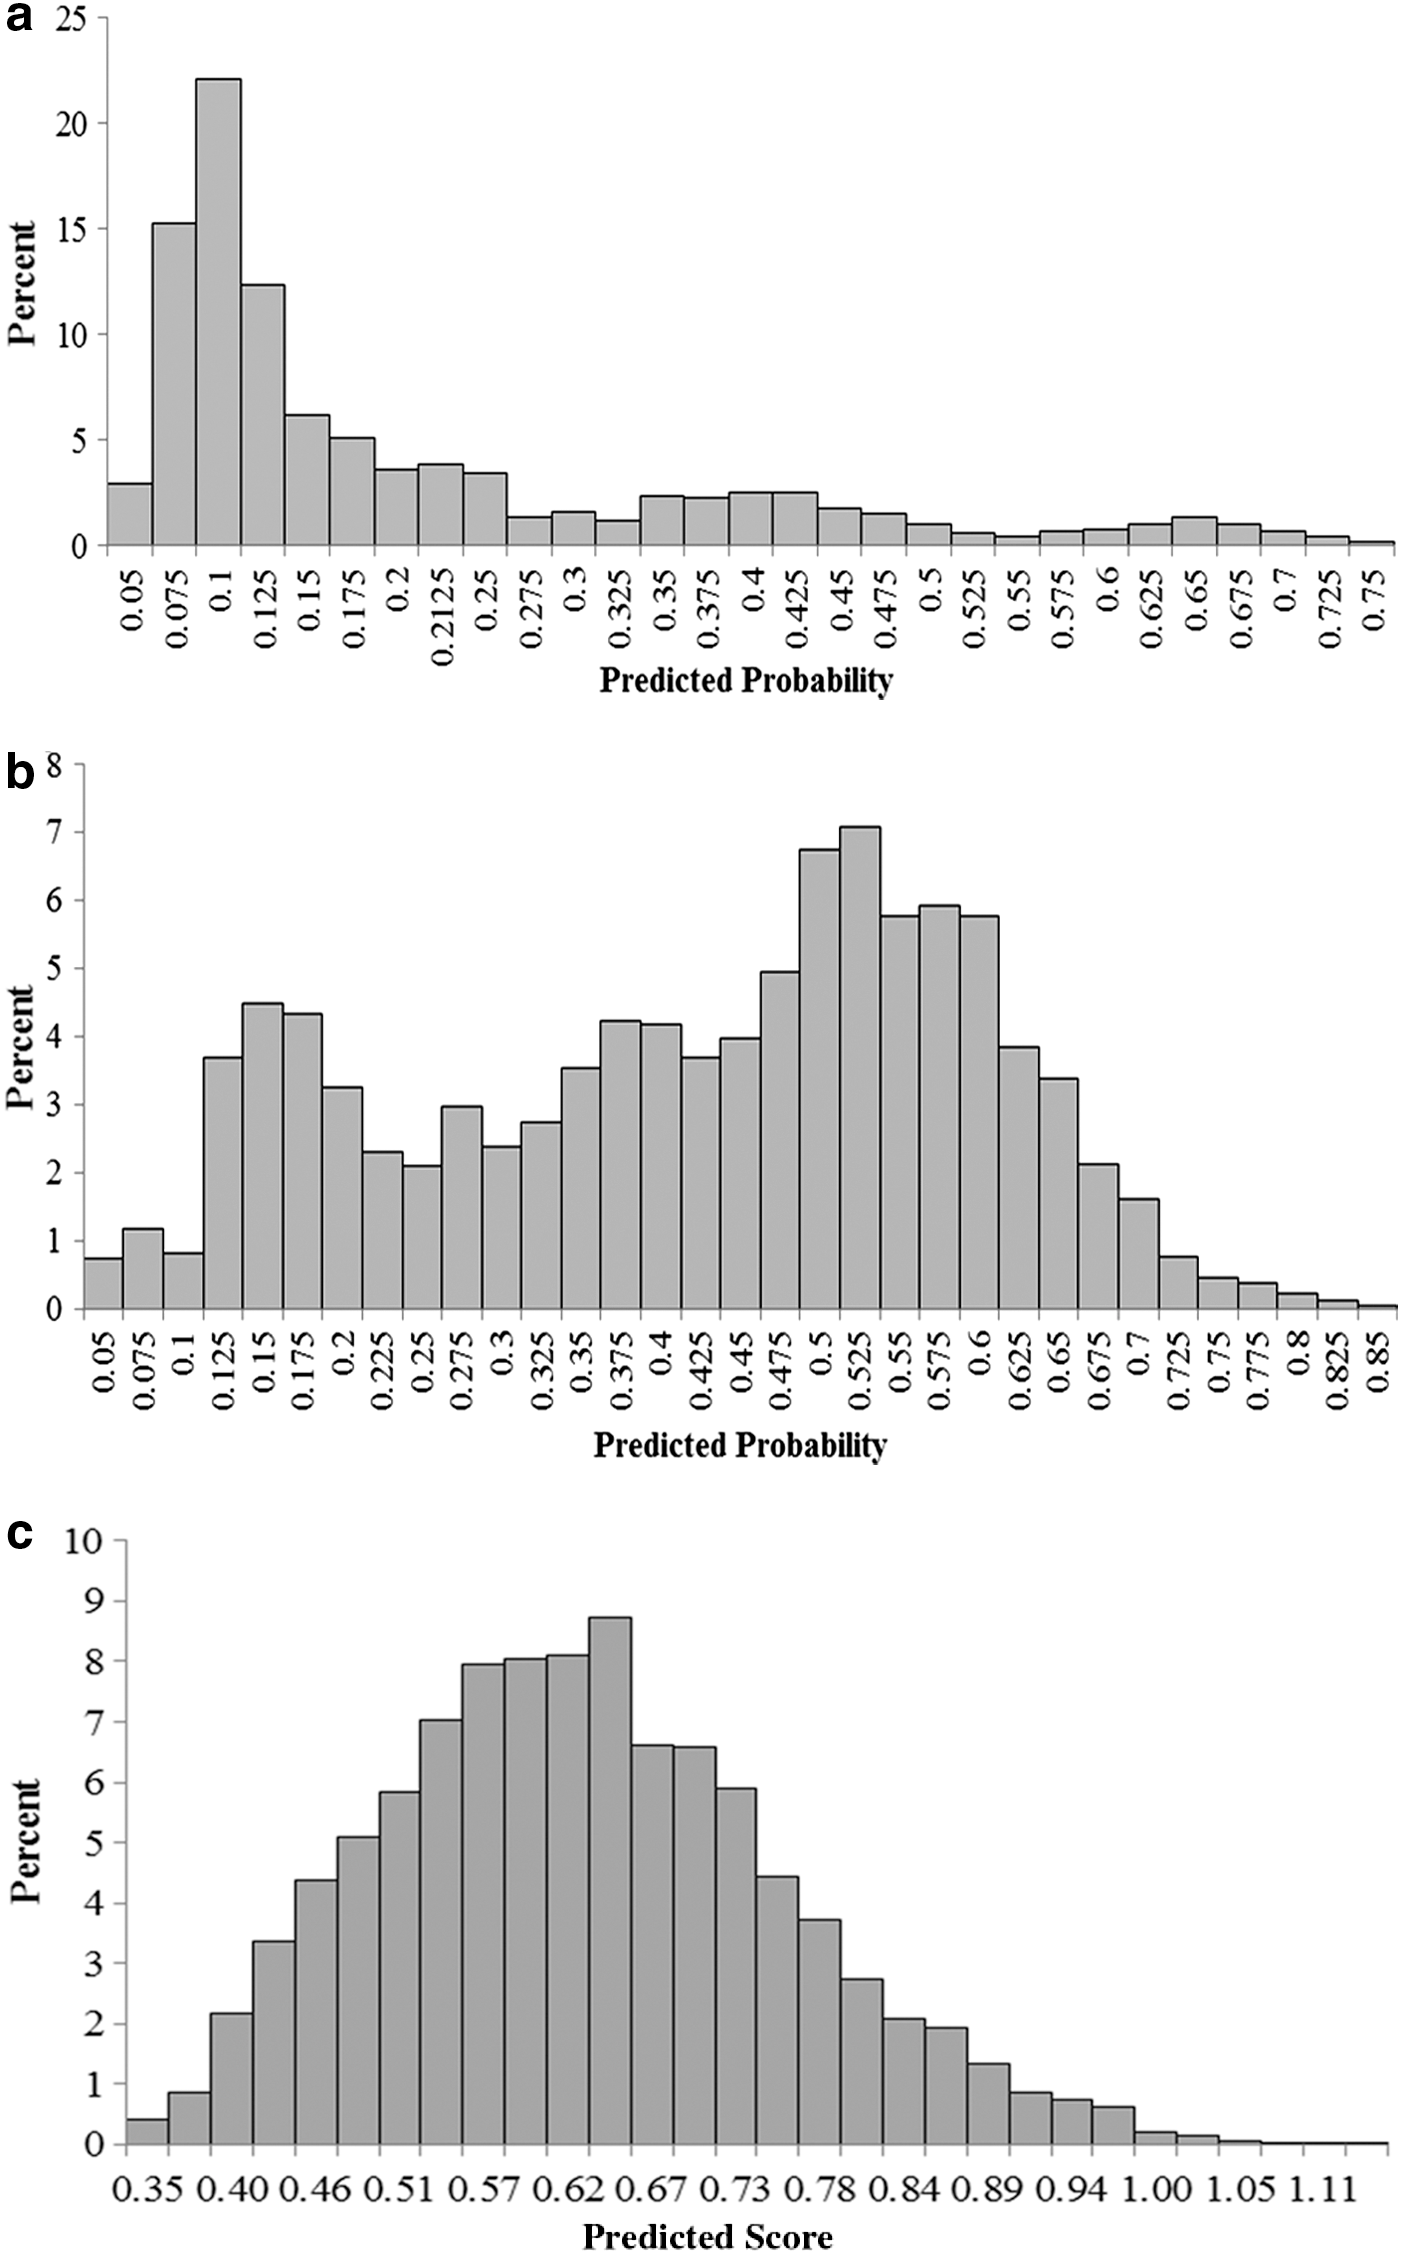
These figures show predicted probability scores associated with the likelihood to engage in the high-risk case management program and have financial success.
As the HRCM program continues to operate, the results from the PTS predictive modeling can be used to reprioritize the list of individuals who qualify, so that those who are more likely to engage and save money are approached earlier to assess their willingness to participate. Program staff members prefer that direct referrals from other programs still remain the highest priority for engagement, followed by those claims-based referrals with the highest PTS scores.
Validity testing results
The tests of logistic regression model fit using the likelihood ratio were significant in each of these models, indicating good model fit (engagement: χ2=1396.74, P<0.001; financial success: χ2=337.67, P<0.001; higher quality of care: χ2=46.07, P=0.004, with 24 degrees of freedom in each model). In addition, the Hosmer and Lemeshow goodness-of-fit statistics were nonsignificant, indicating good model fit as well (engagement: χ2=15.31, P=0.054; financial success: χ2=9.60, P=0.294; higher quality of care: χ2=4.23, P=0.836).
Next, the AUC analysis assessed how well the 3 different PTS models were likely to find those who had high probabilities of engagement, higher quality of care, and savings that were high enough to offset the costs of the HRCM program. The AUC estimates and 95% confidence intervals (CIs) for engagement (AUC=0.745, 95% CI=0.734, 0.762), financial success (AUC=0.746, 95% CI=0.731, 0.776), and higher quality of care (AUC=0.594, 95% CI=0.593, 0.644) suggest that the PTS models for engagement and financial success had fair accuracy, while the PTS model for higher quality of care failed the accuracy test.
Finally, an analysis of classification table was produced using the K-fold cross-validation process described (for K=10). Overall predicted success rates were calculated using the single full data model and 95% CIs were calculated from the 10 sets of hold-out data. Favorable outcomes were observed for the engagement model (predicted success rate=0.761; 95% CI=0.754, 0.764) and financial savings model (predicted success rate=0.697; 95% CI=0.665, 0.707). The quality of care predictions fell outside of the 95% CIs (predicted success rate=0.517; 95% CI=0.464, 0.510), indicating again that the quality of care model had low predictive ability.
Discussion
The goal of this study was to generate a way to find individuals with higher probabilities of success in the HRCM program. Success was determined based on program engagement, receiving higher quality of care while engaged, and generating enough savings in medical expenditures to more than offset the cost of the HRCM program. This was done by incorporating a PTS modeling approach using data-driven analytics to enhance the utility of the HRCM program. Given the low predictive ability of the quality of care model, the current HRCM program PTS prioritization process employs only the engagement and financial success probabilities, which were summed into a combined PTS score.
Although predictive modeling has been used in many health care settings, 25 to the research team's knowledge, the HRCM program is the first of its kind to prioritize outreach efforts based on PTS models related to program engagement and savings. To date, most predictive modeling has been used to identify individuals who likely will have significant future health care needs and high health care utilization. This information is then used to target individuals for engagement in care coordination programs. At least 6 of these need- or utilization-based models are described in the literature. 26
There is currently much interest in personalized medicine, implying that some treatments work better for people with certain characteristics. 27 The research team believes the same is true for care coordination, in that a one-size-fits-all approach to engagement and care coordination is not likely to be as successful as a more personalized approach, such as PTS. Understanding which personal characteristics are associated with program success is beneficial for the individual and the care coordination program. A PTS approach may help save money for the health care system as well.
An obvious limitation of the current PTS approach pertains to the quality of care dimension. So far, the research team has not developed a satisfactory predictive model for those more likely to adhere to EBM guidelines for treatment. Work on this dimension continues, and might also involve the use of continuous, rather than binary, measures of higher quality of care.
Other dimensions of quality also may be important to explore. For example, higher quality of care is best indicated when there are measurable biological, clinical, and/or functional improvements as well. These dimensions cannot be easily measured with claims data. As electronic medical records, laboratory results data, and other data become available, the PTS modeling may improve.
Another limitation of the PTS modeling and prioritization process relates to quality of life measurement. There may be people who qualify for the HRCM program and whose participation in that program would substantially enhance their perceived quality of life, but the data needed to adequately measure quality of life are still being developed. Research to find those whose quality of life would increase is arguably just as important as that which finds those who are highly likely to engage in the program and save money via that engagement. As such, the research team recommends work in this area as care coordination programs continue to evolve.
With regard to the 3 PTS dimensions investigated, care coordination program vendors are often evaluated specifically on their abilities to demonstrate high levels of program engagement, higher quality of care, and financial savings, with financial penalties when desired levels are not met. Thus, it is useful and appropriate to consider these dimensions in program case-finding efforts. When enhanced by PTS, those efforts help patients and providers by finding individuals more likely to participate and succeed in care coordination programs. At the same time, however, the research team has the obligation to refine their programs to the best of their abilities for individuals who are not expected to succeed given current program design and operations, so that maximum benefit can be realized by all who qualify.
The adequate but still less than optimal findings from the validation analyses were not surprising, because this was the first effort to investigate the probabilities of success in these 3 PTS areas. As efforts evolve, PTS models will perform better.
The PTS modeling process has been in use for less than a year and its success and ability to improve will become better over time. Based upon the small number of variables identified that were predictive of engagement, higher quality of care, and financial savings, the research team believes the predictive power of the model has room for improvement. Future model iterations will include additional variables to account for the use of other care coordination programs, health literacy among those who qualify for care coordination programs, and other characteristics. However, keep in mind that program managers have only a limited number of days to incorporate PTS scoring into their outreach processes; therefore, only predictor variables and modeling processes that are readily available and executable can be included in the HRCM prioritization and case-finding processes.
In addition to improving data assets, estimation processes also may be able to be improved. Future modeling processes may incorporate the use of neural networks or other learning models that might enhance the validity of the PTS process over what is possible with a logistic regression-based approach.
In the past, program engagement processes were heavily weighted toward targeting members based on illness severity, with the most severely ill being the first to receive outreach, regardless of their probabilities of success in the program. Changing this procedure to focus more on those most likely to engage and succeed is quite innovative and likely to enhance the utility of a care coordination program.
Footnotes
Author Disclosure Statement
The authors declared the following potential conflicts of interest with respect to the research, authorship, and/or publication of this article: Drs. Ozminkowski, Hawkins, Wells, Bhattarai, Huang, Migliori, Mr. Mujahid, and Ms. Wang are all employed by and hold stock in UnitedHealth Group. Ms. Hommer was employed by UnitedHealth Group during the early stages of this research project. Dr. Yeh is employed by AARP Services, Inc. These authors' compensation was not dependent upon the results obtained in this research, and the investigators retained full independence in the conduct of this research.
The authors received the following financial support for this article: This research work was funded by the Medicare Supplement Health Insurance Program. The investigators retained full independence in the conduct of this research.
Acknowledgment
The authors thank Stephanie MacLeod, MS, for her editorial assistance and critical review of this manuscript.