
Abstract
Between 2002 and 2007, the nonmedical use of prescription pain relievers grew from 11.0 million to 12.5 million people in the United States. Societal costs attributable to prescription opioid abuse were estimated at $55.7 billion in 2007. The purpose of this study was to comprehensively review the recent clinical and economic evaluations of prescription opioid abuse. A comprehensive literature search was conducted for studies published from 2002 to 2012. Articles were included if they were original research studies in English that reported the clinical and economic burden associated with prescription opioid abuse. A total of 23 studies (183 unique citations identified, 54 articles subjected to full text review) were included in this review and analysis. Findings from the review demonstrated that rates of opioid overdose-related deaths ranged from 5528 deaths in 2002 to 14,800 in 2008. Furthermore, overdose reportedly results in 830,652 years of potential life lost before age 65. Opioid abusers were generally more likely to utilize medical services, such as emergency department, physician outpatient visits, and inpatient hospital stays, relative to non-abusers. When compared to a matched control group (non-abusers), mean annual excess health care costs for opioid abusers with private insurance ranged from $14,054 to $20,546. Similarly, the mean annual excess health care costs for opioid abusers with Medicaid ranged from $5874 to $15,183. The issue of opioid abuse has significant clinical and economic consequences for patients, health care providers, commercial and government payers, and society as a whole. (Population Health Management 2014;17:372–387)
I
A similar increasing trend in treatment admission rates for prescription opioid abuse has been observed. According to the Treatment Episode Data Set, the treatment admission rate for individuals abusing opiates other than heroin increased from 7 per 100,000 population in 1997 to 36 per 100,000 population in 2007 (an increase of 414%). 4 Results from a survey conducted by Batten et al 5 showed prescription drugs as the principal drug of abuse for nearly 10% of US patients in treatment. The most commonly reported abused drugs in the SAMHSA survey included oxycodone, hydrocodone, hydromorphone, methadone, morphine, and codeine. 1
Over the past 7 years, prescription opioid abuse has gained nationwide attention. In 2005, Congress stated its concern about the diversion of controlled pharmaceuticals and approved the spending of $60 million from fiscal years 2006 to 2010 to help establish or improve prescription monitoring programs. 1 Consequently, multiple congressional committees have been formed to address the misuse and abuse of controlled substances. 1 A report based on testimony before the Subcommittee on Criminal Justice, Drug Policy, and Human Resources in 2006 described the epidemic of prescription drug abuse as “steadily, but sharply rising.” 1
The increasing number of unintentional opioid overdose deaths in the United States has largely contributed to the growing clinical burden associated with prescription opioid abuse. An increase of 124% in the rate of unintentional overdose deaths was reported between 1999 and 2007, with a majority of this increase attributed to prescription opioid overdose deaths. 6 From 1999 to 2009, the Centers for Disease Control and Prevention reported that the number of opioid-related poisoning deaths has more than tripled. 2 Furthermore, in 2012, the National Center for Health Statistics reported that opioid analgesic pain relievers were involved in more drug poisoning deaths than other specified drugs, including heroin and cocaine. 7
From an economic perspective, prescription opioid abuse creates a substantial cost to society. Rice et al reported total losses to the economy related to drug abuse to be approximately $58.3 billion in 1985. 8 A study conducted by Birnbaum et al provided a lower bound estimate of prescription opioid abuse of $8.6 billion in 2006. Contributing factors included health care costs ($2.6 billion), criminal justice costs ($1.4 billion), and workplace costs ($4.6 billion). 9 More recently, Birnbaum et al conducted another study that estimated the societal costs of prescription opioid abuse to be $55.7 billion in 2007. 2
In the existing literature, there are several estimates of the overall burden of illicit drug use. However, prior literature reviews focused specifically on the clinical and economic burden of prescription opioid abuse are limited. The objective of this study was to perform a comprehensive review of the literature to synthesize the current findings and understanding of the clinical and economic burden of prescription opioid abuse.
Methods
Literature search
The study team conducted a comprehensive literature search of MEDLINE through PubMed. The search strategy combined concepts related to prescription opioids, opioid-related disorders, burden of illness, economics, quality of life, and complications of prescription opioids or opioid-related disorders. The search was limited to articles published in English from October 2002 to October 2012. In addition to the MEDLINE search, a review of the bibliographies/reference lists of review articles was conducted to identify additional publications that were relevant for this review.
The search identified 183 unique citations. Articles were excluded (n=134) if they were of the following publication types: editorial, letter, case report, comment, news, or portrait, the title/abstract was focused on illicit drug use (ie, heroin, cocaine), or the article was an older version of another article captured in the search that studied identical outcomes. Articles were included (n=49) if they described the clinical (including overdose deaths and quality of life) and/or economic (including health care/resource utilization and cost) burden of prescription opioid abuse or the clinical and/or economic burden of prescription opioid abuse treatment. An additional 5 articles were identified in the review of bibliographies/reference lists. These 54 articles were subjected to full-text review; of these, 31 articles were excluded because they did not focus specifically on prescription opioid abuse. At the conclusion of the full-text review, a total of 23 articles were included in the data abstraction and analysis (Figure 1).
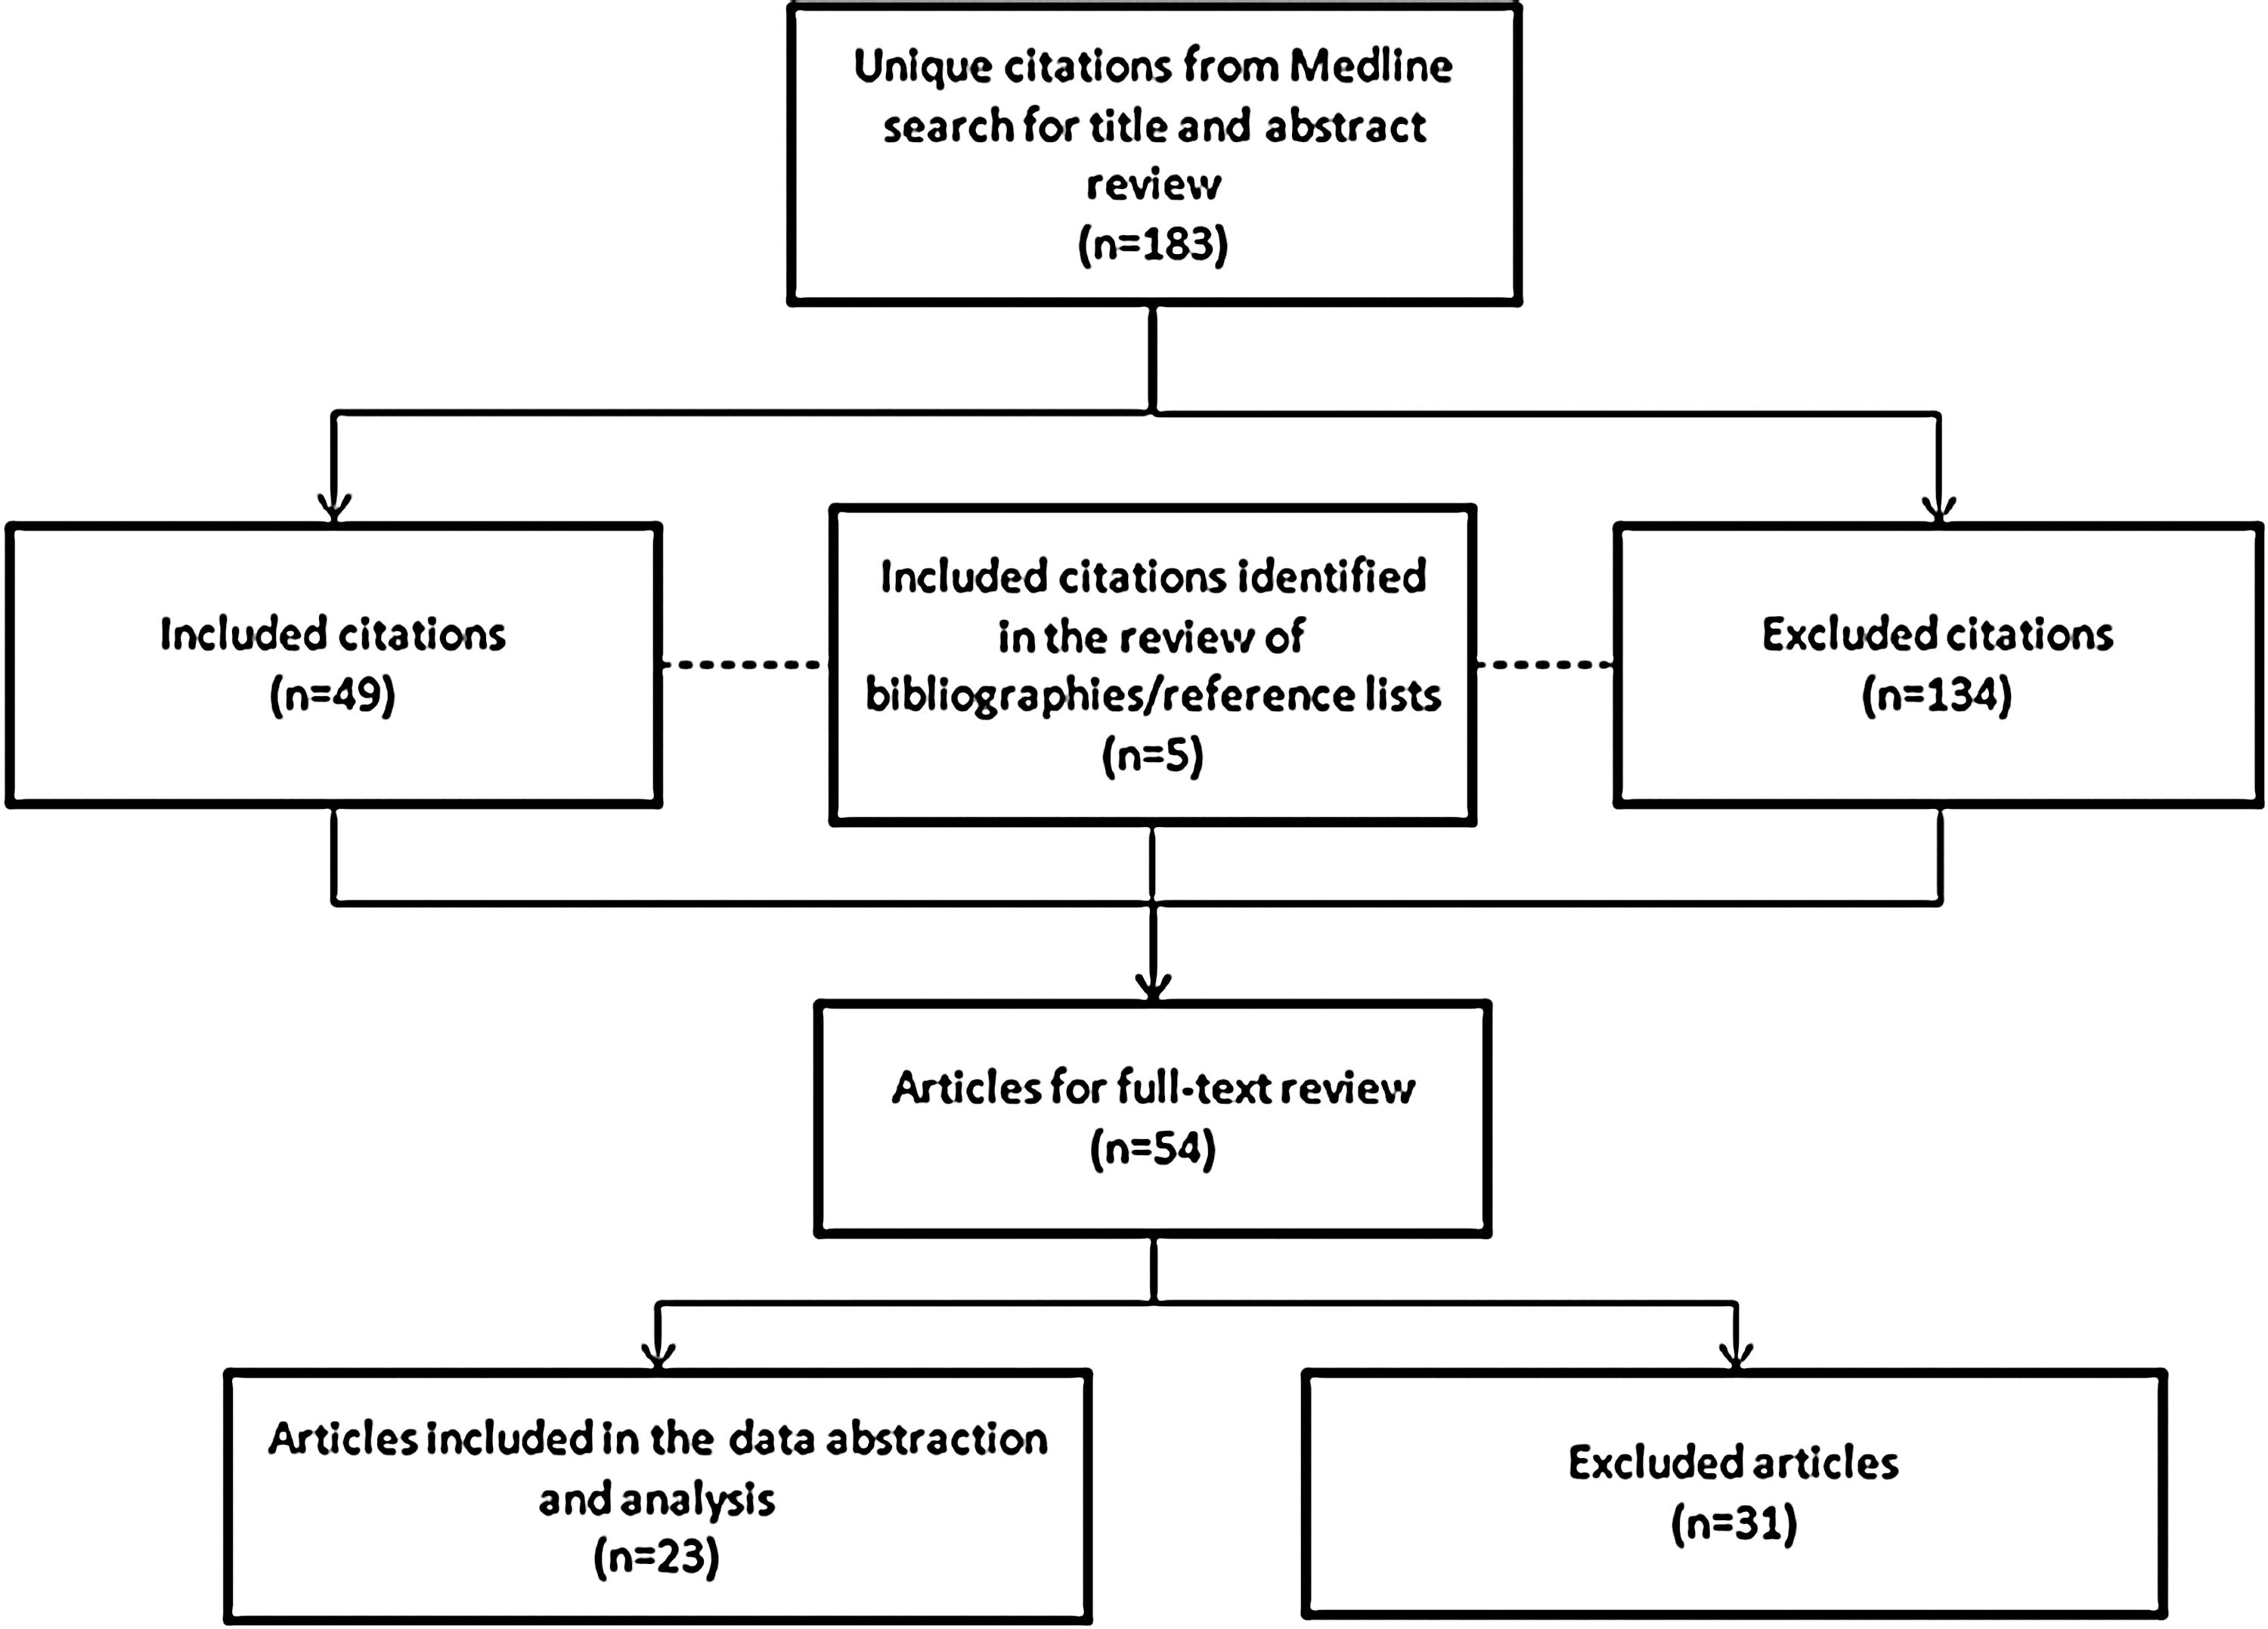
Overview of citation evaluation.
Data abstraction
Data abstraction focused on relevant study data including study design, population, and clinical and economic burden outcomes. Characteristics are outlined in Table 1.
Results
Of the 23 studies included in this review, 7 discussed the clinical burden of prescription opioid abuse, 5 discussed the economic burden, 9 discussed both clinical and economic burden, and 2 discussed the treatment of prescription opioid abuse. There were 4 reports, 5 retrospective studies, 1 observational study, 1 trend analysis, 4 claims analyses, 1 literature review, 1 longitudinal study, 1 historical case control study, 4 cost studies, and 1 cost and utilization study (Table 2).
Not applicable for treatment studies.
CDC, Centers for Disease Control and Prevention; NSDUH, National Surveys on Drug Use and Health; TEDS, Treatment Episodes Data Set; VONA, Vector One: National; WV, West Virginia; OOA, other opioid analgesics; KPNC, Kaiser Permanente of Northern California; GH, Group Health Cooperative; WA, Washington; DAWN, Drug Abuse Warning Network; NA, not applicable; MAX, Medicaid Analytic eXtract; GAO, Government Accountability Office; HMO, health maintenance organization; CA, California; IL, Illinois; NY, New York; NC, North Carolina; TX, Texas.
Clinical burden of prescription opioid abuse
Opioid overdose-related deaths
Deaths related to opioid overdose were examined in 7 studies (Table 3). The number of opioid overdose-related deaths ranged from 5528 of the total 15,125 drug overdose deaths in 2002 (37%) to 14,800 of the 36,450 drug overdose deaths in 2008 (41%). 9,15 From 1999 to 2002, a 129.2% increase in the number of deaths attributed to unintentional opioid analgesic overdose was observed. A majority of the individuals who died of an unintentional opioid overdose were male smokers with a mean age of 40 years. 16 Overdose reportedly results in 830,652 years of potential life lost before age 65 years, which is comparable to the years of potential life lost from motor vehicle crashes. 10
Sales of other opioid type (codeine, oxycodone, hydrocodone, morphine and hydromorphone).
CDC, Centers for Disease Control and Prevention; WV, West Virginia; UT, Utah; OH, Ohio; NR, not reported; OPR, opioid pain relievers; OOA, other opioid analgesics.
Patients receiving prescriptions for higher opioid doses have been shown to have an increased risk of opioid overdose death. 20 A study by Paulozzi et al reported that although only 10% of patients are prescribed high doses of opioids by a single prescriber, these patients account for approximately 40% of overdose deaths. 20 Studies also have found that a significant proportion of individuals who have died of unintentional opioid overdose did not have a prescription for the opioid that caused their death. Substance abuse indicators were identified in almost all deaths and multiple contributory substances were reported in almost 80% of deaths. 14
Prescription trends
A total of 7 studies assessed opioid prescription trends (Table 4). From 1997 to 2005, there was a 933% increase in methadone prescriptions, a 588% increase in oxycodone prescriptions, and a 198% increase in hydrocodone prescriptions. 22 In 2009, there were a reported 79.5 million prescriptions for opioid analgesics in the United States. Of these, hydrocodone- and oxycodone-containing products accounted for almost 85% (67.5 million) of the total prescriptions. 11 In a study of 61 Medicaid patients who received 3 or more prescriptions from 2 or more providers in a 6-month period for January through June 2003, the number of prescriptions per patient ranged from 3 to 28 (mean=8.4; standard deviation [SD]=5.5) and 64% had more than 6 prescriptions. 25 The proportion of prescriptions dispensed increased with age, with 11.7% of prescriptions for patients 10–29 years of age, and 45.7% for those 40–59 years of age. 11 The US Government Accountability Office (GAO) reported that approximately 65,000 Medicaid beneficiaries from selected states (California, Illinois, New York, North Carolina, and Texas) visited 6 or more doctors to acquire prescriptions for the same type of controlled substances during fiscal years 2006 and 2007. Furthermore, an analysis of Medicaid claims within these states found that at least 400 beneficiaries visited up to 112 medical practitioners and 46 different pharmacies for the same controlled substance. 27
SAOs, short-acting opioids; LAOs, long-acting opioids; NR, not reported; SD, standard deviation; GAO, Government Accountability Office; KPNC, Kaiser Permanente of Northern California; GH, Group Health Cooperative.
The prevalence of long-term opioid use has been reported to be as high as 18.6% in 2005 among patients with substance use disorders in a Washington State health care plan (n=3900). 13 These patients received higher dosage levels, were more likely to use Schedule II and long-acting opioids, 13,16 and frequently used sedative-hypnotic medications in addition to opioids. 13
Comorbid conditions
Comorbid conditions were assessed in 4 studies (Table 5). Among individuals with opioid abuse/dependence or chronic use, approximately 50% reported a pain-related comorbidity. The percentage of individuals with a comorbid psychiatric disorder ranged from 11.4–71.1%. 28,31 Among the 4 studies, comorbidities were reported to occur at a higher rate in individuals who chronically use or abuse opioids compared to those who do not use opioids. 24,26,28,31
CVD, cardiovascular disease; HIV/AIDS, human immunodeficiency virus/acquired immunodeficiency syndrome.
Economic burden of prescription opioid abuse
Resource utilization
Eight studies examined resource utilization among the prescription opioid abuse population (Table 6). These studies found that when compared to non-abusers, opioid abusers were generally more likely to utilize medical services, such as the emergency department (ED), physician or mental health outpatient visits, and inpatient hospital stays. 18,19,21 –23,25,26,28 Compared to non-abusers, opioid abusers were found to be 4 times as likely to visit the ED, 11 times as likely to have had a mental health outpatient visit, and 12 times as likely to have had an inpatient hospital day. 22
ED, emergency department; SD, standard deviation; UCC, urgent care center; PCP, primary care physician; OB-GYN, obstetrician-gynecologist; NR, not reported; PA, physician assistant; NP, nurse practitioner; HCP, health care professional; DAWN, Drug Abuse Warning Network; OR, odds ratio; CI, confidence interval.
In a study assessing a privately insured population and opioid use measured in days of supply (DOS), defined as the number of therapy days, study subjects were divided into 3 groups: acute opioid, chronic opioid, and non-opioid use. The acute opioid use group was defined as individuals who received 1 prescription for less than 10 DOS of opioid analgesics in the calendar year, whereas chronic opioid use consisted of individuals who received 180 DOS or more per year. The non-opioid group comprised individuals who filed 1 or more non-opioid insurance claims in the calendar year and did not file an opioid insurance claim. Results found that the chronic opioid group on average had 0.62 ED visits, compared with 0.31 and 0.11 ED visits in the acute opioid and non-opioid groups, respectively. In addition, the chronic opioid group had, on average, 16.91 physician office visits, compared with 8.67 and 5.06 office visits in the acute opioid and non-opioid groups, respectively. Similarly, the chronic opioid group had 1.66 inpatient hospital days, whereas the acute opioid and non-opioid groups had 0.56 and 0.22 inpatient days, respectively. 26
Opioid abuse or dependence is strongly related to ED utilization. 18 The Drug Abuse Warning Network (DAWN) estimated that the number of ED visits involving nonmedical use of opioids increased 111% from 2004 (144,644 visits) to 2008 (305,885 visits). 19 Furthermore, studies showed that the proportion of patients with 1 or more ED visit claims ranged from 17.4%–80.8% within a 12-month study period. 21,28
Cost of prescription opioid abuse
The cost of prescription opioid abuse in the United States was examined in 8 studies (Table 7). In 2006, reported total costs of nonmedical use for individual opioids ranged from $30 million for fentanyl to $12.7 billion for hydrocodone. 17 Total annual costs ranged from $8.6 billion in 2001 (or $9.5 billion in 2005 US dollars [USD]) to $55.7 billion in 2007 (in 2009 USD). 2,22 Workplace costs accounted for a majority of total costs, followed by health care costs, and criminal justice costs. 2,17,22 When compared to a matched control group (non-abusers), mean annual excess health care costs for opioid abusers with private insurance ranged from $14,054 to $20,546. 21,22,24,28 White and colleagues 21 assessed opioid abuse patients and demographically matched controls using privately insured (Ingenix Employer Solutions Data) and Florida Medicaid administrative claims data from 2003 to 2007. Privately insured opioid abuse patients (n=4474) incurred $24,193 in total direct health care costs per patient; in contrast, privately insured non-opioid abuse controls (n=4474) incurred only $3647 in total direct health care costs per patient, amounting to a mean annual excess of $20,546 in health care costs for opioid abusers. The privately insured population in this analysis was obtained from a database covering 9 million lives during 1999 to 2007 and comprised information from 40 self-insured companies operating nationwide in a myriad of industries. For the Medicaid study population, opioid abuse patients (n=4667) incurred $26,724 in total direct health care costs per patient, compared to $11,541 for matched controls (n=4667). Studies in this review showed that the mean annual excess health care costs for opioid abusers with Medicaid ranged from $5874 to $15,183. 21,22,24,28
Selected costs >$6 billion are presented in this table.
HIV/AIDS, human immunodeficiency virus/acquired immunodeficiency syndrome; SD, standard deviation; LTC, long-term care; GAO, Government Accountability Office.
Treatment of prescription opioid abuse
Cost of treatment
Two studies examined the cost of prescription opioid abuse treatment (Table 8). An analysis conducted in 2009 29 found that the mean cost of care for the 6 months after treatment initiation was $11,597 for buprenorphine treatment and $14,921 for methadone treatment (P<0.001). Findings in this study showed that there was an average of 67 to 157 ambulatory visits and 9 to 12 hospitalization days for patients receiving methadone, buprenorphine, or both treatments. Average ambulatory care costs for patients ranged from $1203 (methadone) to $1287 (buprenorphine). When neither treatment was given, the average cost of ambulatory care was $984. 29 Another study conducted by Ettner et al 30 reported that substance abuse treatment costs over the 9 months post baseline averaged $1583.
FY=fiscal year.
Discussion
In a recent study assessing trends in visits for noncancer pain and strong opioid (morphine-related) medication from 2000 to 2010, researchers utilized the National Ambulatory Medical Care Survey (NAMCS), a nationally representative database of US physician office visits, and found that there was no significant change in the proportion of pain-related physician visits. 32 Throughout the 10-year period, pain was consistently reported and diagnosed by physicians at approximately one fifth of all visits. Although non-opioid pain-relieving drugs remained stable between 26%–29% throughout the decade, the rate of opioid prescriptions significantly increased from 11.3% in 2000 to 19.6% in 2010. After adjustment of covariates, few patient, physician, or practice characteristics were related to higher or lower rates of opioid use; hence, findings showed that increases in opioid prescribing occurred non-selectively. The authors concluded that non-opioid prescribing decreased despite a lack of clear evidence demonstrating that opioids are safer and more effective in treating noncancer pain. 32
A growing awareness of the increasing prevalence and ramifications of pain within the health care community has driven efforts to improve both the identification and management of the condition. The inadvertent impact of these well-meaning efforts may have led to an increase in opioid use and abuse as well as a high economic burden in terms of health care costs and lost productivity. The staggering increase observed in prescription methadone (933%), oxycodone (588%), and hydrocodone (198%) 22 reflects these efforts and also suggests several phenomena and trends in expanded pain guidelines, which in part have led to inappropriate utilization. Many researchers have asserted that drug therapy with opioid analgesics maintains an important role in pain management and should be available when needed. 33 –35 The Drug Enforcement Agency (DEA) reinforced this notion, stating that clinicians should not hesitate to prescribe opioids when they are the best choice of treatment and clinicians should be knowledgeable about using opioids to treat pain. 36 Moreover, the perception that pain is often undertreated and is a major public health problem has catalyzed a movement of patient advocacy groups, and legislature-enacted pain treatment acts to ensure immunity for physicians who prescribe opioids within the statute requirements. 1 Because of perceived undertreatment for pain, advocacy groups and professional organizations also have been formed to develop guidelines to improve pain management. 37 However, some guidelines have not been developed from evidence-based medicine, and physicians often are not adequately trained in pain management, leading to unparalleled demand and subsequent growth in opioid prescriptions to manage pain. Since 2001, California physicians have been required to complete 12 hours of continuing education training for pain management. 38 Unfortunately, not all states have this minimal requirement of management and physicians appear to provide prescriptions for opioids without the appropriate training. Hence, this may contribute to the ease of “doctor shopping,” whereby an individual visits several physicians complaining of a range of symptoms as a means to obtain prescriptions. The DEA has stated that the diversion and abuse of legitimately produced controlled pharmaceuticals comprises a worldwide multibillion dollar illicit market. 39,40 There are various modes of diversion in which drugs are diverted from their lawful purpose to illicit use; these are usually attributed to doctor shopping, theft, illegal Internet pharmacies, prescription forgeries, and illicit prescriptions by physicians. Doctor shopping is the most common method of obtaining prescriptions 33 –35,41,42 as evidenced by the GAO report of 65,000 Medicaid beneficiaries visiting 6 or more doctors to acquire prescriptions for the same type of controlled substances during fiscal years 2006 and 2007. 27 Furthermore, an analysis of Medicaid claims found that at least 400 beneficiaries visited up to 112 medical practitioners and 46 different pharmacies for the same controlled substance. 27 In addition, sales of prescription drugs over the Internet are a major business and present many challenges in preventing drug abuse. 43
Drug abuse poses a substantial impact to society in terms of clinical and economic burden. Overdose reportedly results in 830,652 years of potential life lost before age 65, which is comparable to the years of potential life lost from motor vehicle crashes. 10 The increase of 129.2% in deaths attributable to unintentional opioid analgesic overdose from the period of 1999 to 2002 in the Paulozzi study 15 not only suggests the widespread prevalence of opioid abuse, but also the potential misunderstanding of the risks of opioid use. As previously described, one study found that approximately 50% of patients who misuse opioids report a pain-related comorbidity. 28
From an economic perspective, pain prescription drug spending has skyrocketed in the United States. Currently, more than $9 billion is spent on opioids in a year. 44 In addition, the White House Budget Office has estimated that drug abuse costs the US government nearly $300 billion a year. 1 Furthermore, prevalence rates for inpatient hospital visits were more than 12 times higher for opioid abusers compared with non-abusers (P<0.01), demonstrating that opioid abusers are more likely to have higher levels of medical and prescription drug utilization. 28 Mean annual direct health care costs for opioid abusers ($15,884) were more than 8 times higher than for non-abusers ($1830). 28 Similarly, mean annual excess health care costs for opioid abusers with Medicaid ranged from $5874 to $15,183. 22 Direct costs and increased resource utilization related to nonmedical opioid use are considerable, with treatment for opioid abuse bearing significant costs. A study by Barnett showed mean 6-month costs of $11,597 and $14,921 for buprenorphine and methadone treatment, respectively. 29 Another study reported that substance abuse treatment costs over the 9 months post baseline averaged $1583. 30 This cost was associated with a monetary benefit to society of $11,487, which translated to a greater than 7:1 ratio of benefits to costs. 29 Reduced costs for crime and an increase in employment earnings primarily contributed to these benefits. Although the treatment of opioid abuse has an overall beneficial net effect to society, the costs inflicted upon payers in both the public and private sectors are significant.
The Food and Drug Administration and the DEA are working to minimize abuse, misuse, and diversion of controlled substances. 1 Monitoring programs like Researched Abuse, Diversion, and Addiction-Related Surveillance System (RADARS) and prescription drug monitoring programs (PDMPs) provide insight into the trends of opioid abuse as well as help curtail prescription fraud and doctor shopping. In addition, payers may be able to monitor the number of pharmacies and physicians utilized by patients who are prescribed opioids as a proxy for potential misuse. Finally, tamper-resistant formulations as well as medications that have multiple mechanisms of action to alleviate pain may help to decrease the likelihood for opioid abuse.
In a similar effort to monitor opioid utilization and potentially minimize opioid abuse, the Centers for Medicare & Medicaid Services recently introduced the Medicare Part D Overutilization Monitoring System (OMS). The OMS uses 3 types of outlier metrics to identify patients with potential overutilization issues: (1) opioid outliers (noncancer patients whose daily morphine equivalent dose is greater than 120mg for at least 90 consecutive days, and who used more than 3 prescribers and more than 3 pharmacies; (2) acetaminophen outliers (patients who may be taking more than 4g of acetaminophen per day for more than 30 days); and (3) referral outliers (beneficiaries referred by the Medicare Center for Program Integrity for review of possible utilization issues). 45
Pharmacies also are making efforts to help prevent and minimize opioid abuse. A major US retail pharmacy has instituted a “Good Faith Dispensing” policy that requires pharmacists to contact the prescribing physician and ensure that the diagnosis, billing code, previous medications tried and failed, and expected length of therapy are correct in order to verify prescriptions for controlled substances. This new policy is speculated to be related to the DEA's concentrated effort on the company in their scandal regarding “pill mills.” These “pill mills” were elaborate schemes where “patients” and physicians diverted massive quantities of prescription pain relievers through fake clinics. 46 Monitoring programs such as OMS, RADARS, and PDMP, and retail pharmacies have developed specific initiatives with the objective of assisting with identifying overutilization of prescribed medications, which in turn may also help prevent opioid abuse, misuse, and diversion.
Limitations
There are several limitations to this study. First, the study team did not assess the quality of the studies and included studies and reports varying in quality. Although every effort was made to include only studies that clearly described the methodologies and results, studies also were included that discussed the topic of opioid abuse to be comprehensive in this review. Second, the study team was unable to differentiate studies of abuse, misuse, or diversion because studies often did not report the difference between the 3. In fact, abuse, misuse or diversion may result in different clinical and economic burdens. Presently, definitions between these 3 phenomena are unclear. Therefore, this review of opioid abuse also encompasses misuse and diversion. Future research is warranted to disentangle the effects of these 3 separate but intertwined topics. In addition, because International Classification of Diseases, Ninth Revision (ICD-9) codes for opioid abuse often are not utilized, there is likely an underreporting of opioid abuse in published claims-based studies. Therefore, the rates of diagnosed opioid abuse reported herein are expected to be much lower than the actual rate of opioid abuse in a given population. In addition, because the cost estimates from these studies were frequently obtained from claims databases, the true economic impact may be underreported. Many patients also pay with cash to avoid detection by managed care and, as such, any likely opioid abuse would be underreported. Lastly, the study team did not adjust reported costs to current year because of the varied methodologies and currency years used by studies to arrive at cost estimates, which introduces uncertainty when drawing comparisons between study results. However, cost findings from this review provide the relative range and magnitude of the economic impact of opioid abuse.
Implications
Findings from this review highlight the significant clinical and economic burden of opioid abuse on the health care system and, in particular, payers from both the government and private sectors. According to results from the 2002 National Survey on Drug Use and Health, 45,47,48 Medicare, Medicaid, the military, and other government health care paid or supplemented payments for opioid abuse treatment in at least 80% of the population, whereas private health insurance supplemented 30% of the population. Although more than 1 source of payment was reported by survey subjects for these estimates, this survey provides an overview of the magnitude of social costs and impact sustained by payers to treat opioid abuse. In light of limited resources, these additional costs borne by payers could be minimized and funneled toward more critical public health and disease areas that need to be addressed.
Conclusion
The issue of opioid abuse has significant clinical and economic consequences for patients, health care providers, commercial and government payers, and society as a whole. Future quality improvements to prevent and minimize abuse, misuse, and diversion must focus on better utilizing clearly defined International Classification of Diseases, Tenth Revision (ICD-10) codes to report this problem and to better characterize what abuse entails. The recent need for health care providers to transition from the use of ICD-9 to ICD-10 diagnosis and procedure codes may provide an opportunity to increase awareness regarding the appropriate use of codes for these patients. Educational programs for both health care providers and the community, along with PDMPs, also may play an important role. 49
Additional research is needed to further study the effects and differences between abuse, misuse, and diversion. More importantly, there is a clear need to assess and develop technology for opioids, such as tamper-resistant formulations, to lower and minimize the risk of abuse.
Footnotes
Author disclosure statement
Drs. Meyer, Quock, and Mody, Ms. Patel, and Ms. Rattana declared the following conflicts of interest with respect to the research, authorship, and/or publication of this article: Dr. Meyer is an employee of Janssen Scientific Affairs and stockholders of Johnson & Johnson; Ms. Patel was a fellow at Janssen Scientific Affairs during manuscript development; Ms. Rattana and Dr. Quock are consultants to Janssen; and Dr. Mody was an employee of Janssen Scientific Affairs during manuscript development and a stockholder of Johnson & Johnson.
Funding for this study was provided by Janssen Scientific Affairs.