
Abstract
The objective of this study was to determine the sustained economic impact of a health promotion/disease prevention program delivered through a large regional health plan. This was a retrospective analysis of health risk, health claims, and cost using a mixed model factorial design for the years 2002–2009 that compared program participants to nonparticipants. All analyses were adjusted for age, sex, morbidity, and baseline health care costs as appropriate. The findings presented herein indicate a positive return on investment (ROI) for each program year with ratios ranging from a low of 1.16:1 to a high of 2.83:1. The average ROI collapsed across all 8 years was 2.02:1. The 2009 ROI approximated over $6 million in total savings. This study demonstrates the sustained economic value of a comprehensive health promotion program. (Population Health Management 2014;17:90–99)
Introduction
T
The escalating costs associated with health are currently being assumed in large part by employers and insurers (with increasing costs shifting to the consumer and practitioners). This pressure has fostered the growth of the health and wellness industry as an increasingly ubiquitous strategy to improve the health of large populations and concurrently slow the increasing rate of associated costs. In fact, health and wellness programs have become a central business strategy for many progressive employers and health plans. Program elements range widely from community-based efforts 20 to disease-specific models, 21,22 and comprehensive continuum of health approaches, 23 all delivered through various technological and interpersonal channels.
In the current literature, the economic value of individual programs is usually ascertained retrospectively after a period of 4 years or less. 10,12,13,24 This is typically because of the difficulties of maintaining a longitudinal database on a population cohort, cohort attrition, ongoing changes in programming characteristics, and the limits of the randomized trial design, including but not limited to the complexities of creating comparative groups. This begs the question—although a wide range of organizations and the general public may benefit from health and wellness programming clinically and financially 25 —of whether the benefit is sustainable and for how long.
This study reports on a longitudinal set of wellness and disease prevention program evaluations focusing on economic sustainability. The program is an established health and disease prevention program provided through a large insurer over an 8-year period. The current paper specifically addresses the longitudinal economic value of such a program with a specific emphasis on the following longitudinal questions: • Who are program participants? How do they differ from nonparticipants? • What are the estimated economic/cost benefits and ROI of the program over time? How does participant utilization and cost compare with that of nonparticipants? • Is there a relationship between cost, utilization, and degree of program engagement?
Methods
The program
The health and wellness program evaluated was a comprehensive health promotion and disease prevention program. The program was provided by an independent health plan to its members as part of a variety of programs, services, and support to improve the health and well-being of its members. This health plan includes health maintenance organization, preferred provider organization, and consumer-directed health plan products. Health risk assessments (HRAs) were completed by participants, and followed by biometric screening (ie, blood pressure, total cholesterol, lipid subfractions, glucose, body composition indices of height, weight, body mass index [BMI], waist circumference, percentage of body fat) and lifestyle intervention components. Other screenings may have been recommended based on sex, age, and risk profile (eg, pap smear, bone density, sigmoidoscopy).
Participants also underwent a counseling session with a health care professional to review their biometric values, identify their particular risks, discuss wellness goals, and develop a behavior change action plan. Counseling sessions were offered in several formats including individual, group, face-to-face, and telephonic. Tailored, online digital health coaching intervention programs were provided to participants that focused on weight management, nutrition management, smoking cessation, and stress management. These digital health coaching programs were designed as behavioral health interventions to aid participants to create and reach health-promoting goals for the purpose of changing lifestyle-related behaviors. These online programs were not available to participants during the first 2 years of the program as evaluated here.
The sample
Data presented in Table 1 show the sample sizes for all eligible plan members and program participants by year over the 8-year evaluation period. The relative trend shows a steady increase in the number of plan members from 2002 to 2009. There was a concomitant decline in the rate of participation (8.1% to 3.9%) when considered as the percent of eligible. A total of 2124 unique participants used the online digital health coaching programs from 2004 to 2009. Of those who utilized these programs, about 44% of participants used the weight management program, followed by 35% who used the nutrition management program, 18% who used the stress management program, and 3% who used the smoking cessation program. The actual gross number of participants over the 8-year term fluctuated with no clear trends. Incentives may have been used with some plan customers in some years but the details of such program elements were unavailable for consideration in any analyses.
Notes:
(1) In 2004 the organization changed health risk assessments (HRAs). Differences in constructs and scales are noted where relevant. There is an overlap of 299 people between the 2 versions of the HRA.
(2) Yearly Wellness Program represents the total and percentage of individuals who participated in all 8 years evaluated within this manuscript.
(3) In some cases the constructs in the 2 different HRA instruments are incompatible or absent, which limits some comparisons from one year to another.
(4) This table reflects the total sample of the participation in the study. The number does not reconcile with most of the analyses in the manuscript because of filtrations and subpopulations that were studied in each section.
Because there is an inherent self-selection bias with nonrandomized participation in wellness programs, interpretation of program outcomes relative to nonparticipants must take this biasing into account. For all between-cohort analyses a subset of nonparticipants were matched to participants using the propensity score matching method, followed by chi-square and t tests, which assured no significant differences in the characteristics of participants and matched nonparticipants. The propensity score matching method is a widely used statistical matching method in observed studies. It generates the predicted probability that an individual receives the treatment of interest from 1 or many confounding variables. For each participant the procedure seeks a nonparticipant with the same or nearly the same estimated probability of inclusion in the treatment, in order to minimize the distance between matched cases on those confounding variables. 26 –29 Each year a subsample of nonparticipants was one-to-one matched to participants on sex, age, morbidity score, and total health care costs in the pre-participation year(s); no significant difference was found between participants and nonparticipants after matching (P>.05). These matching variables also were set as covariates in the cost comparisons to better reveal the impact of the program.
Demographic data on sex and age of participants and nonparticipants are included in Table 2. These data suggest that women were more likely to participate in the program relative to men in 2009, but this was consistent with the gender distribution in the eligible membership as a whole. This trend was consistent in years 2006–2009 but somewhat reversed from the more even gender split in years 2002–2005. This change may be related, in part, to worksite recruitment efforts or change in benefits structure initiated between 2005 and 2006. Program participants also were significantly older than their 2009 nonparticipating counterparts (a finding consistent over all 8 years of data). The mean ages for participation across all years ranged from 51.6 to 53.8 years old.
Comorbidity scores
All subjects (participants and nonparticipants) were assessed using the Johns Hopkins Adjusted Clinical Groups Case-Mix System. 30 The scale measures aggregate morbidity levels ranging from 0–5 where a score of 0 indicates no illness or morbidity and a score of 5 indicates severe illness burden or maximum level of morbidity. For every year of the program, participants received higher morbidity scores relative to nonparticipants, suggesting that the program was used by individuals with significant disease burden. For all age ranges there were 42 instances of unadjusted statistical significance, which showed that program participants had higher levels of morbidity (Table 3).
Note: Morbidity levels are calculated for program participants and nonparticipants based on their status in the given year. Italicized text indicates a statistically significant difference between morbidity levels for each age group and overall for participants and nonparticipants for each year, P<0.05.
Measures
Program participants were required to complete an HRA at program entry. Biometric measures were collected by various members of the staff, and included cholesterol and related subfractions (ie, high-density lipoprotein cholesterol, low-density lipoprotein cholesterol, triglycerides), fasting blood glucose, systolic and diastolic blood pressure, BMI, and waist circumference using standard clinical protocols.
Utilization and cost measures consisted of total health care expenditures, and expenditures were categorized by inpatient costs, number of inpatient admissions, length of stay (LOS) per admission, outpatient cost/claims, medical services, and pharmacy. Data are expressed in unadjusted dollars and utilization counts except where noted.
Results
Health care claims and costs
Table 4 examines 2009 health care costs and utilization among program participants versus nonparticipants. The data indicate that 2009 program participants had significantly lower total health care costs and costs by category with the exception of medical costs relative to nonparticipants. These medical costs include professional services (eg, office visits), laboratory, radiology, surgery/anesthesia, and other facility outpatient and miscellaneous services. Outpatient costs include outpatient surgeries, emergency room, mental health partial-day services, and diagnostic and treatment services. The outpatient costs reflect the facility portion of the encounter exclusive of professional services (ie, medical costs). The proportion of program participants having made any claim in 2009 was higher in total and within the medical claim category. However, nonparticipants were more likely to have made more claims in the cost categories of inpatient and pharmacy claims relative to participants. The average number of hospital admissions, total inpatient days, and average LOS per admission also were significantly higher for nonparticipants relative to participants.
Note: The comparison of 2009 total health care costs is derived from the data on those with and without claims; nonparticipants in 2009 have not participated in the wellness program in any of the 8 years.
Return on investment
Net savings were calculated by determining the difference between total health care costs for the nonparticipating cohort and the participating cohort after subtracting the program expenses from the actual health care cost savings by year for participants. Program expenses included staff salaries, employee benefits, employer taxes, state general excise taxes, medical supplies, office supplies and printing, postage and freight, utilities and telephone, furniture and equipment expense, occupancy expenses, professional services, advertising and promotions, insurance, travel, depreciation and amortization, data processing and software purchases, and general administrative expenses (human resources, legal, accounting, and administrative services). These expenses are displayed by year in Table 5.
Table 6 presents an ROI estimate for 2009 by analyzing the costs of wellness program members who did not use the program initially (2002–2008), but who then became participants in 2009, relative to matched nonparticipants who never used the program during the 8 years. A subsample of nonparticipants was matched to participants on sex, age, morbidity score, and total health care costs in the previous 3 years (2006–2008) and no significant difference was found between participants and nonparticipants after matching (P>.20). These matching variables also were set as covariates in the cost comparisons to better reveal the impact of the program. After matching and adjusting, the total costs in 2009 were estimated to be $3422 for nonparticipants and $2870 for participants, which generated a projected savings of $522 per participant. The net savings per participant was $264 after excluding the program cost. Total 2009 net savings based on this estimate was calculated at over $6 million.
2009 ROI=$Savings/$Costs=$552/$288=$1.92:$1. The estimated net savings in 2002–2008 years are not presented here but are available from the author by request. HP, health plan; ROI, return on investment.
Figure 1 displays the ROI by program year after statistically matching and adjusting for sex, age, baseline morbidity level, and baseline health care costs. 1 Matching variables included sex, age, morbidity score, and total health care costs in the previous 3 years prior to the index year (ie, a rolling 3-year matching window). The years 2002–2004 were matched by previous years that had available data. The figure indicates a positive ROI for each program year ranging from a low of 1.16:1 to a high of 2.83:1 with an average ROI across all 8 years of data of 2.02:1.
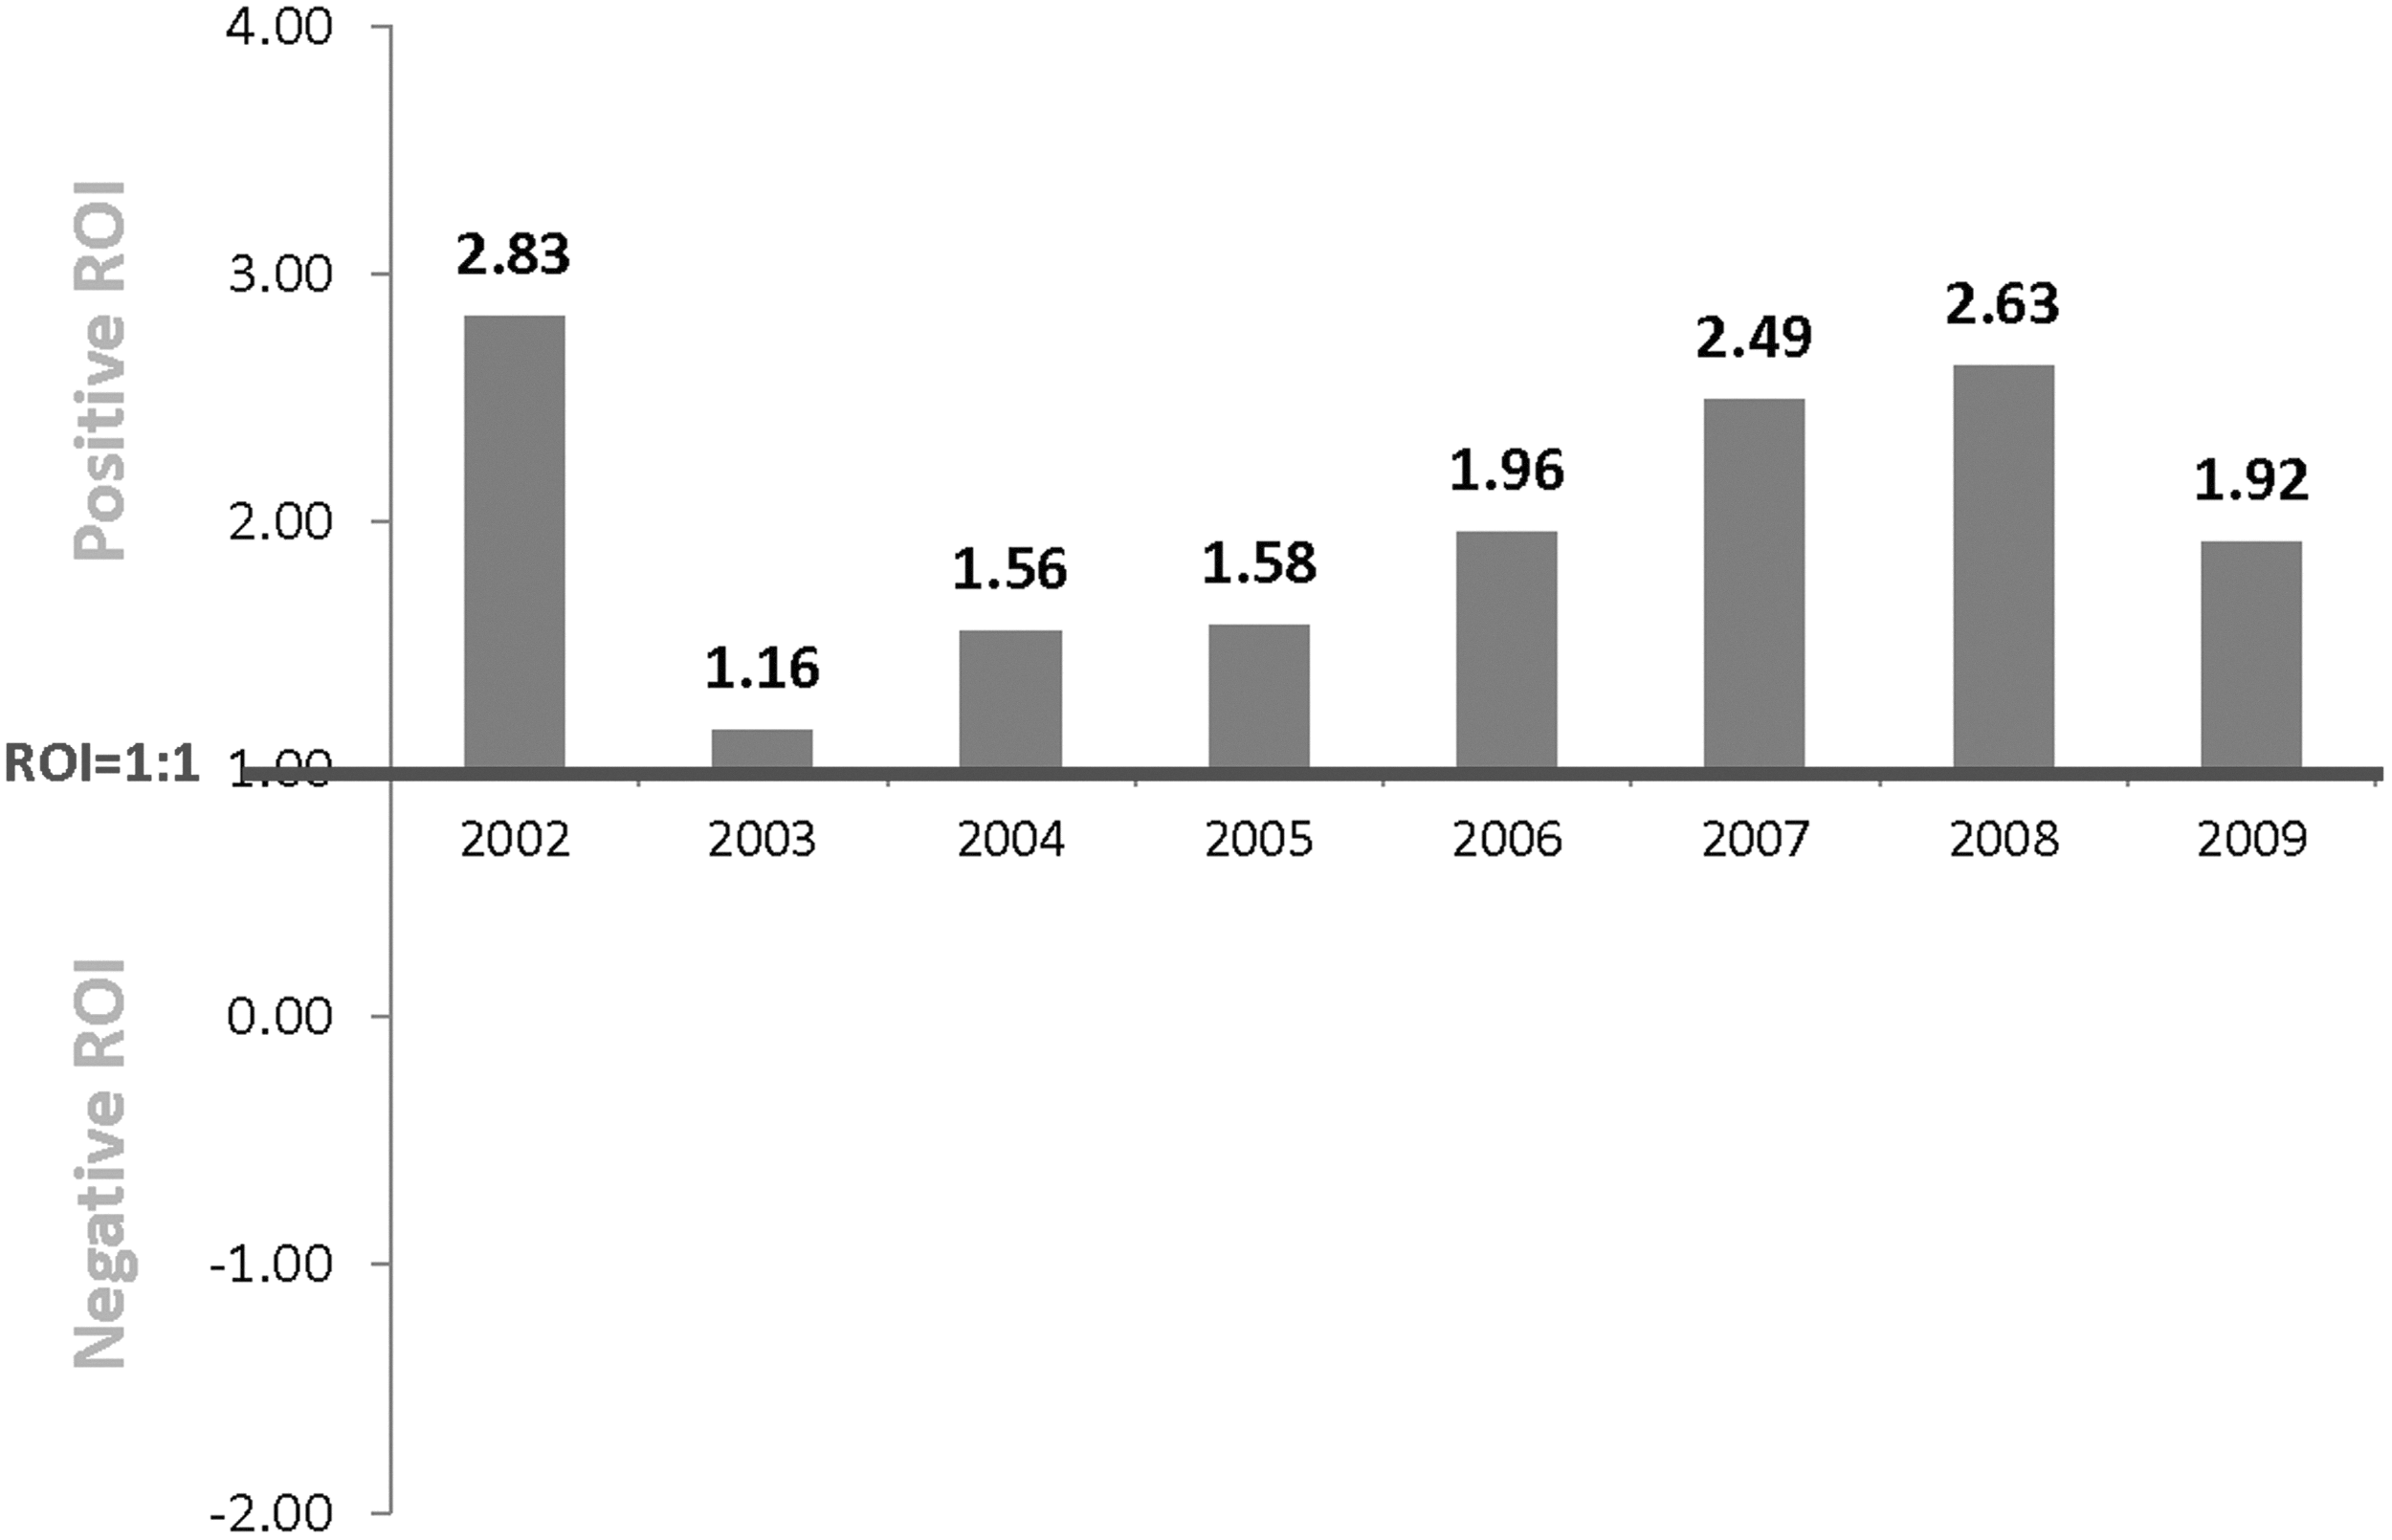
Return on investment (ROI) by program year.
Cost and participation
The research team also examined the association between program participation and health care costs before and after utilizing the program within the same cohort. This was done by analyzing the claims trend for program members who initially did not use the program services in 2002 through 2007 (a 6-year cost “run-in” period) and then began participating in the index year of 2008 relative to a propensity score matched cohort of nonparticipants (matched one-to-one on sex, age, morbidity in 2006, and total health care cost in 2006) who never participated in the program from 2002 to 2009. The matching strategy yielded successful matches (ie, nonsignificant group differences for these variables, P>.40). Sex, age, and morbidity in 2006 also were used as covariates in the model to better equate the 2 groups. The trajectory depicted in Figure 2 suggests participants maintained an essentially flat cost trend (Zero Trend) 31 following program participation in 2008 while nonparticipants showed a significant and escalating increase on total costs year over year.
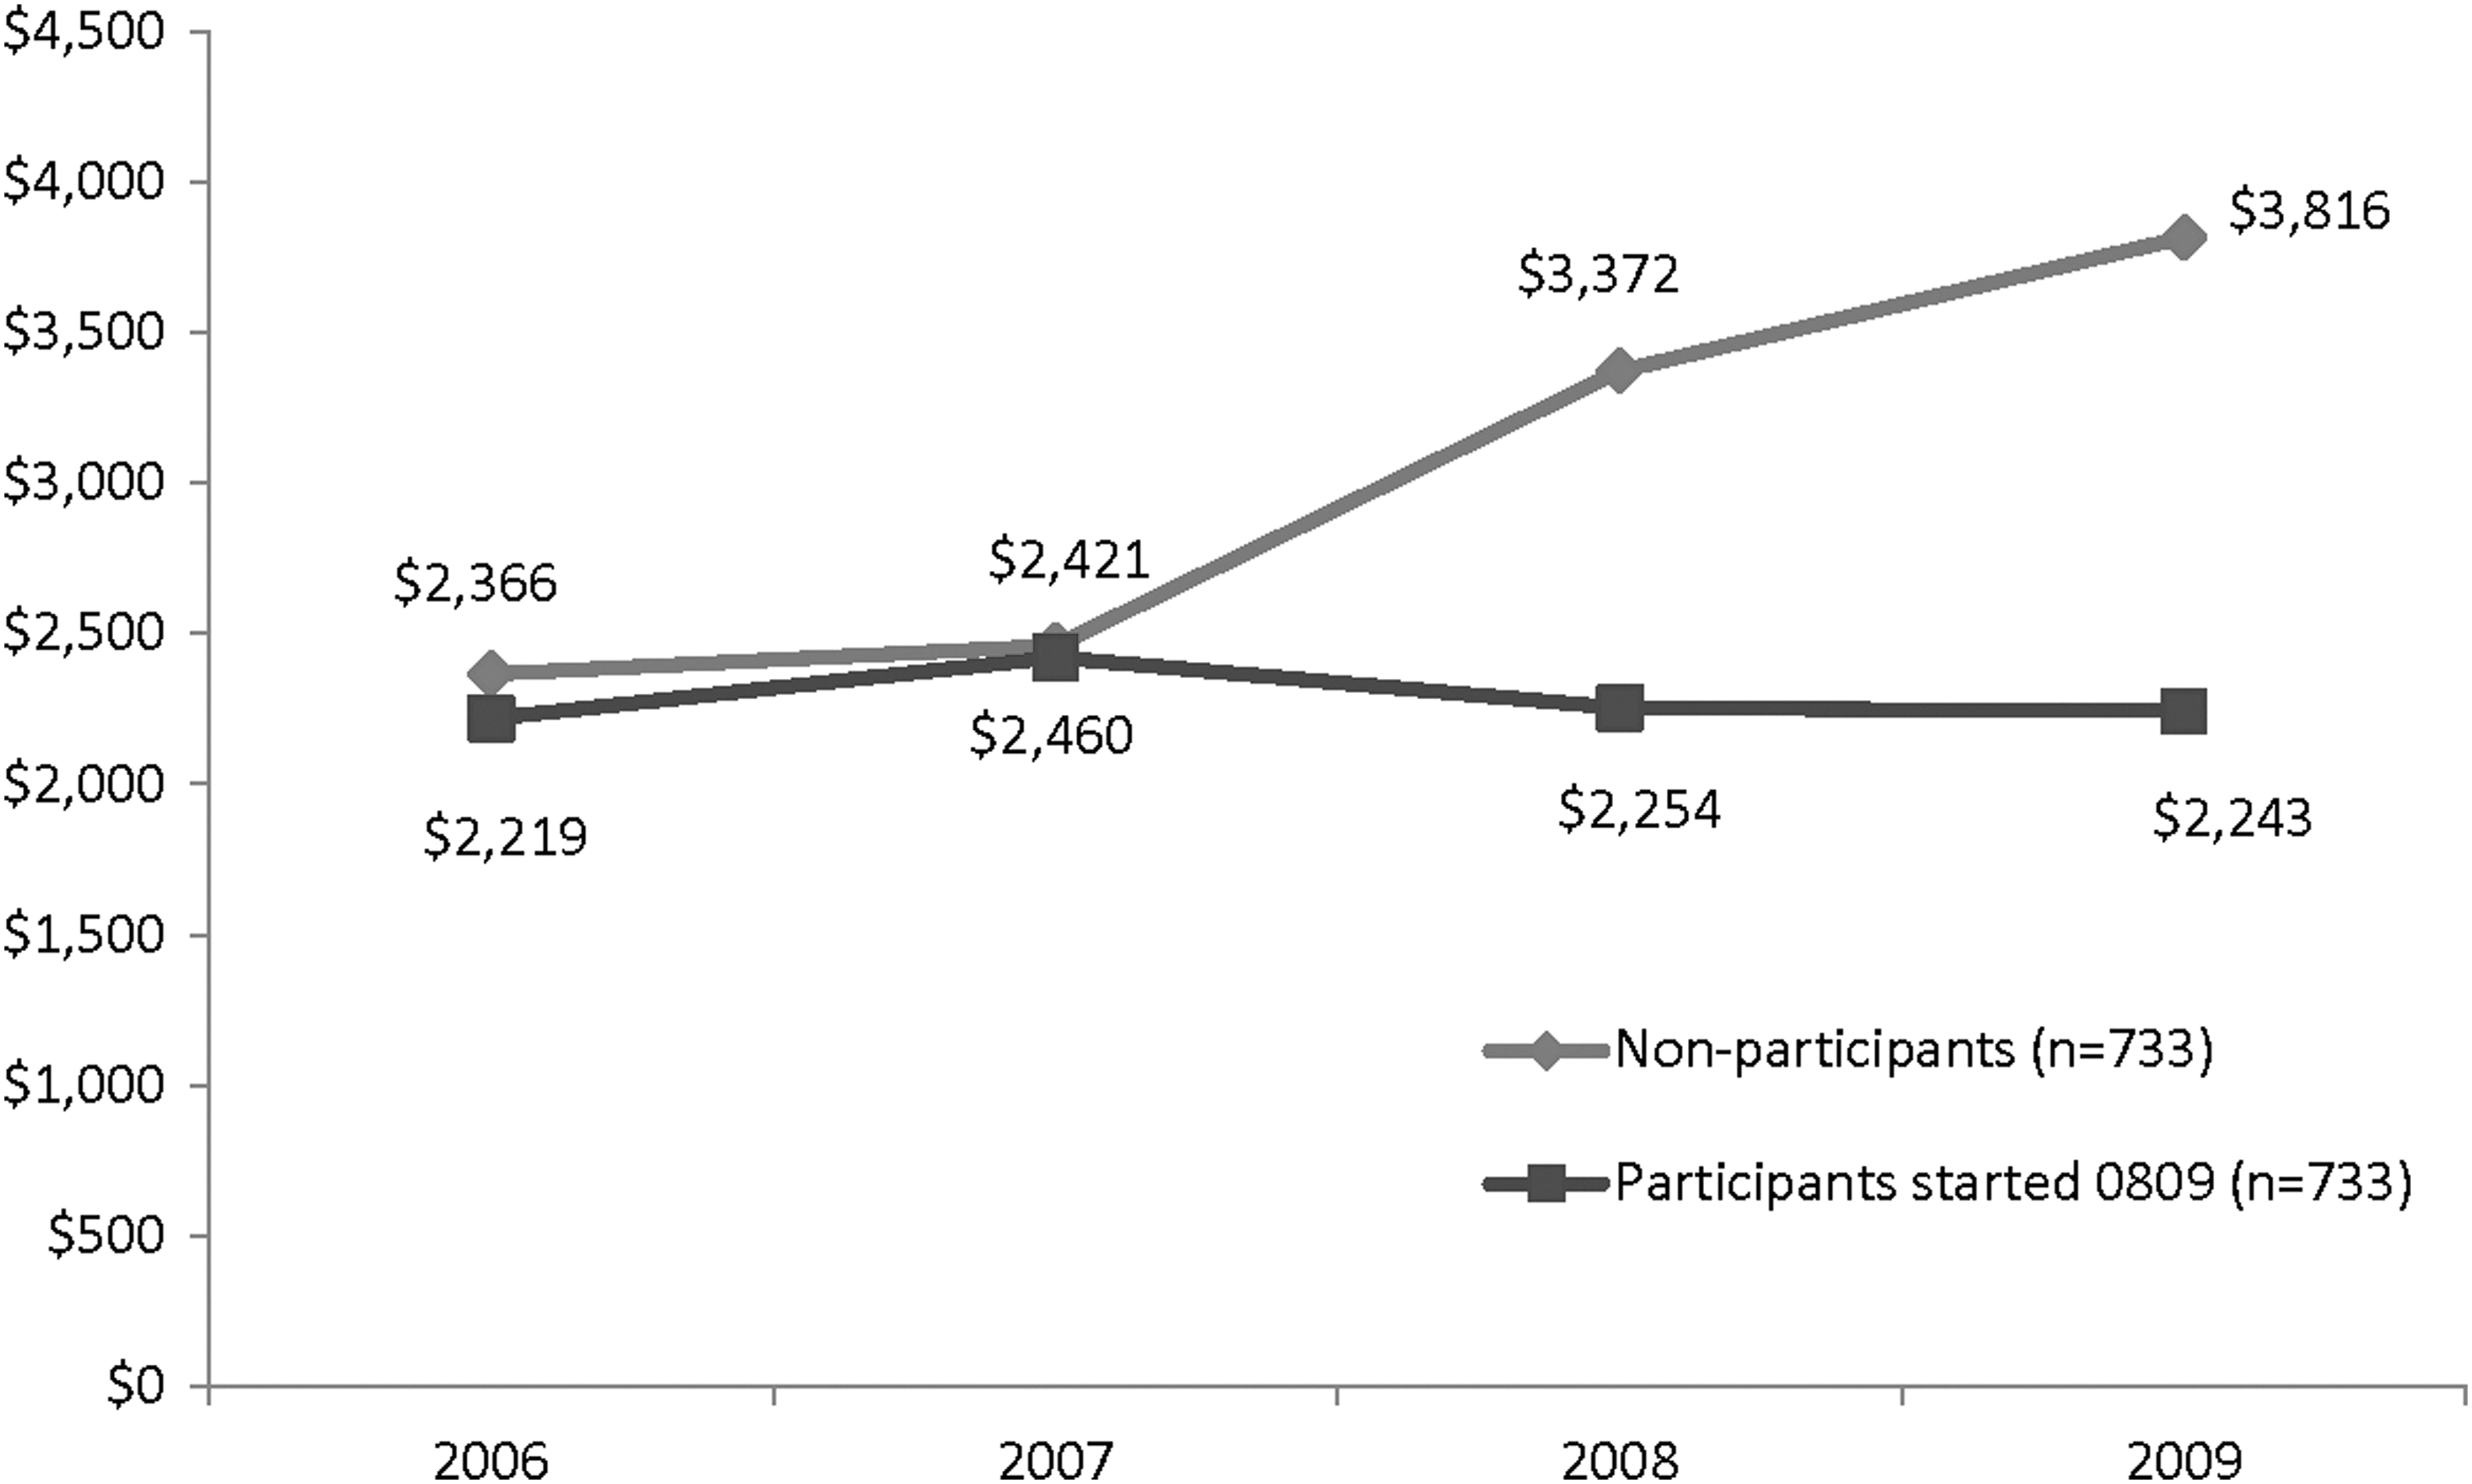
Total costs comparison between those who never participated in the program and those who started the program in 2008 and continued it in 2009. Note: Total health care costs include inpatient, outpatient, medical, and pharmacy costs. Members who had conflicting sex in multiple data sets, who reported being pregnant, or more than 365 total inpatient days in any 1 year were excluded. Participants and nonparticipants were matched on sex, age, morbidity in 2006, and total health care cost in 2006. Savings also were adjusted for sex, age, and morbidity in 2006. Cost differences between groups were nonsignificant in 2006–2007, P>.50; cost differences between groups in 2008 and 2009 were significant, P<.02, as tested by general linear model.
In order to further examine the program's cost impact based on level of engagement, the following analyses were based on the consistency of program participation operationalized as the total number of years a plan member participated in the program relative to total 2009 costs. Figures 3 and 4 present these data for all 2002–2009 members and for members who made 1 or more claims in 2009, respectively. In both cases the analyses demonstrate a strong linear association between the number of program participation years and lower total health care costs in 2009.
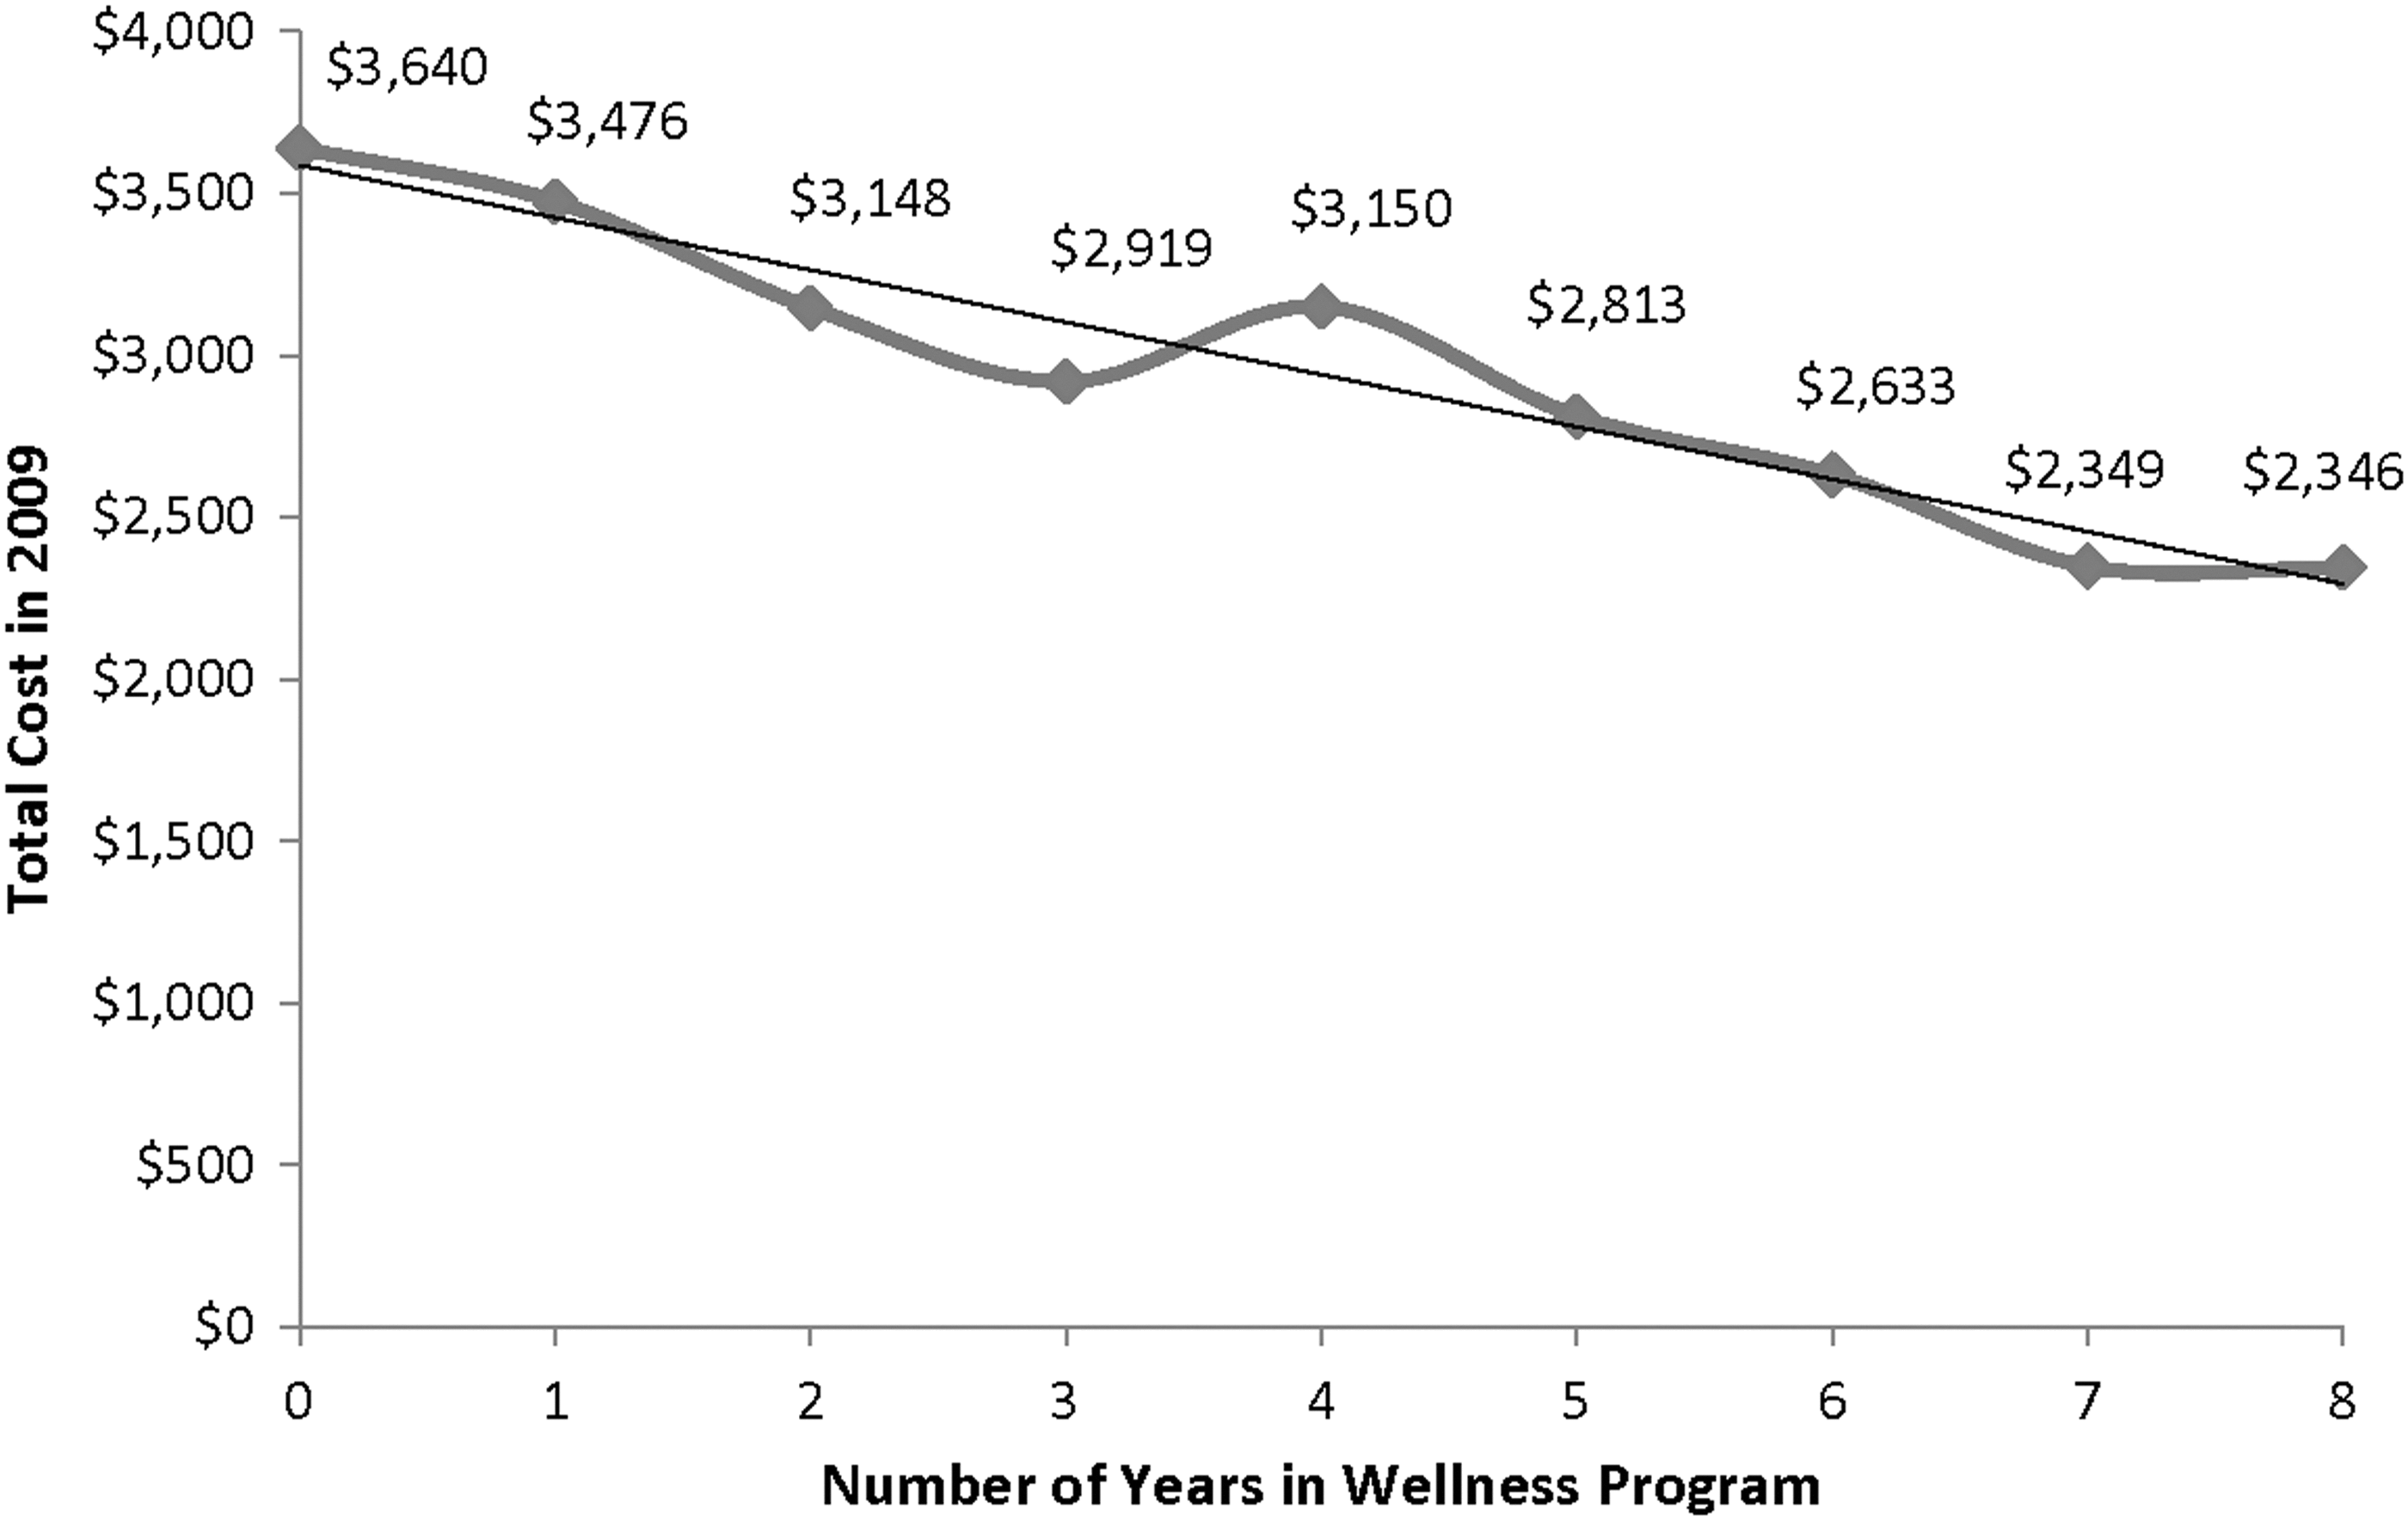
2009 total member care costs by number of years using the program. Note: Health care costs include inpatient, outpatient, medical, and pharmacy costs. Members who had conflicting sex in multiple data sets, who reported being pregnant, or more than 365 total inpatient days in any 1 year were excluded. Savings were adjusted for sex, age, and morbidity in 2002, and total health care cost in 2002. The 2009 health care costs were significantly different by number of participation year, F(8, 172903)=8.92, P<.0001.
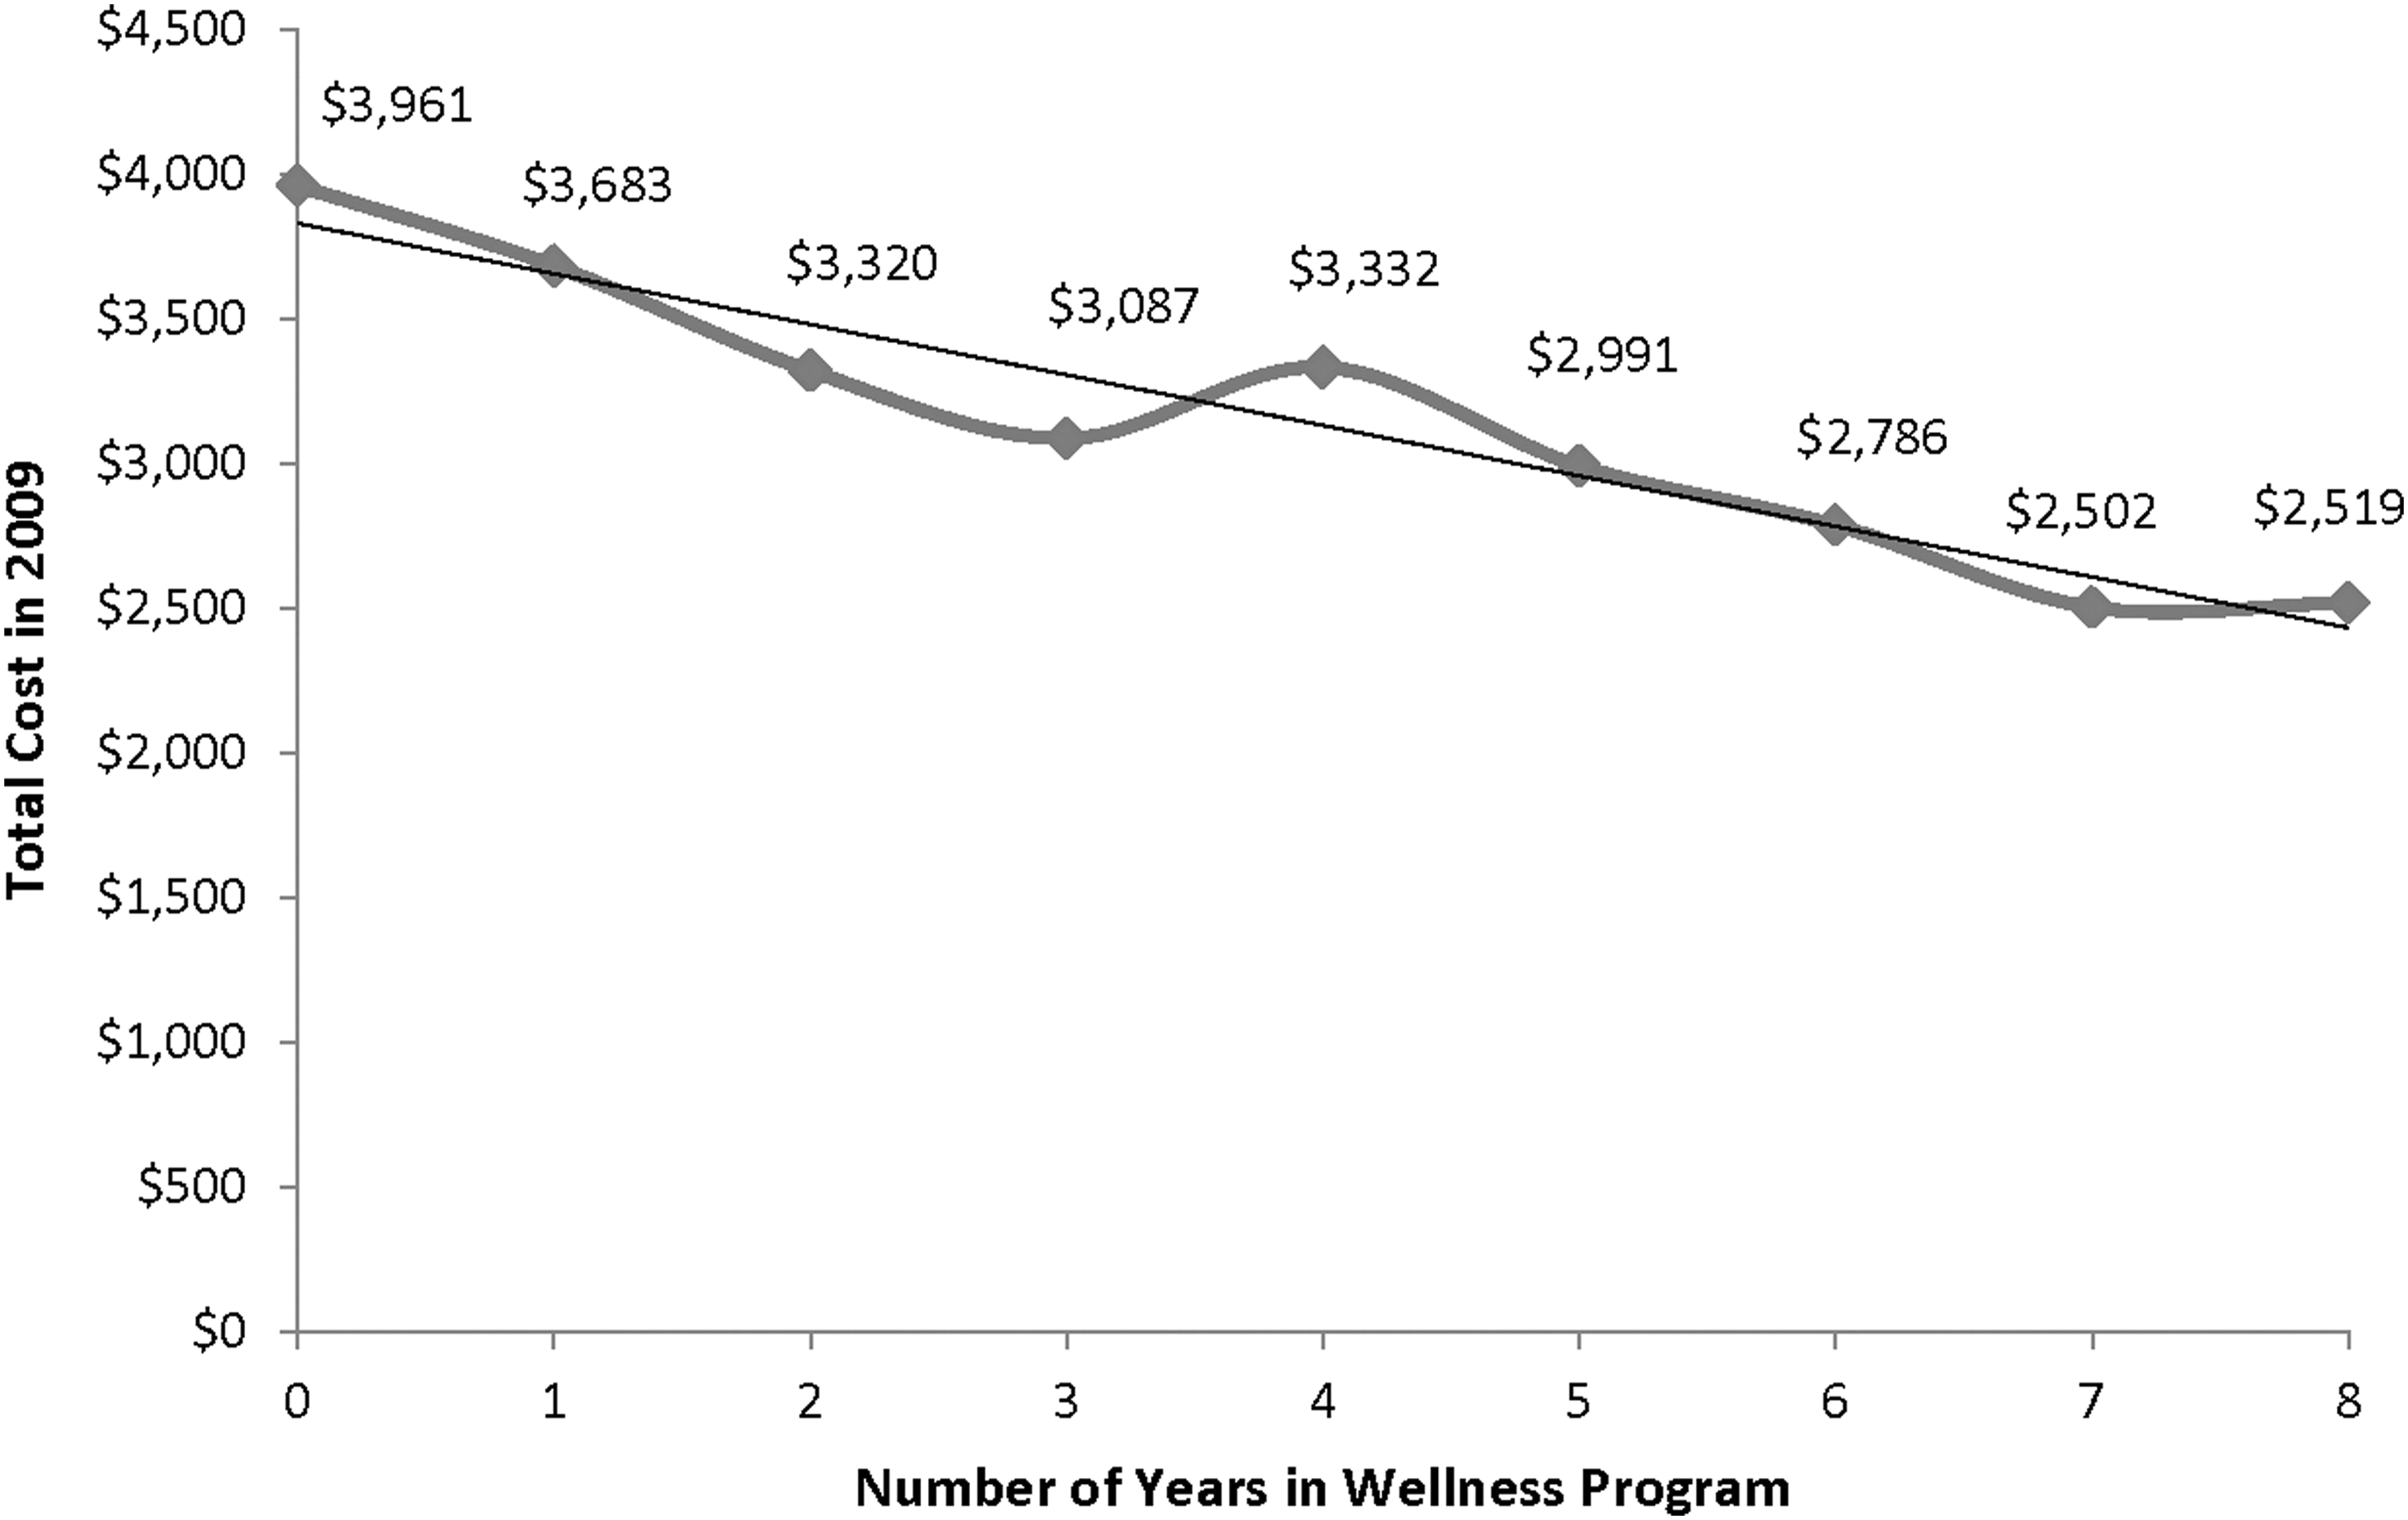
2009 total member care costs by number of years using the program, among members with 2009 costs>$0. Note: Health care costs include inpatient, outpatient, medical, and pharmacy costs. Data were derived from members with 2009 total health care costs>0. Members who had conflicting sex in multiple data sets, who reported being pregnant, or more than 365 total inpatient days in any 1 year were excluded. Savings were adjusted for sex, age, morbidity in 2002, and total health care cost in 2002. The 2009 health care costs were significantly different by number of participation year, F(8, 159993)=11.52, P<.0001.
Finally, the research team decided to examine the relative value of engagement (ie, number of years of program participation) relative to morbidity values as measured by the Johns Hopkins Adjusted Clinical Groups Case-Mix System. Figure 5 plots average 2009 costs by morbidity values. The graph indicates greater spread with increased morbidity suggesting greater direct ROI as an interaction between baseline morbidity and degree of long-term engagement. The actual dollar values are presented in Table 7.
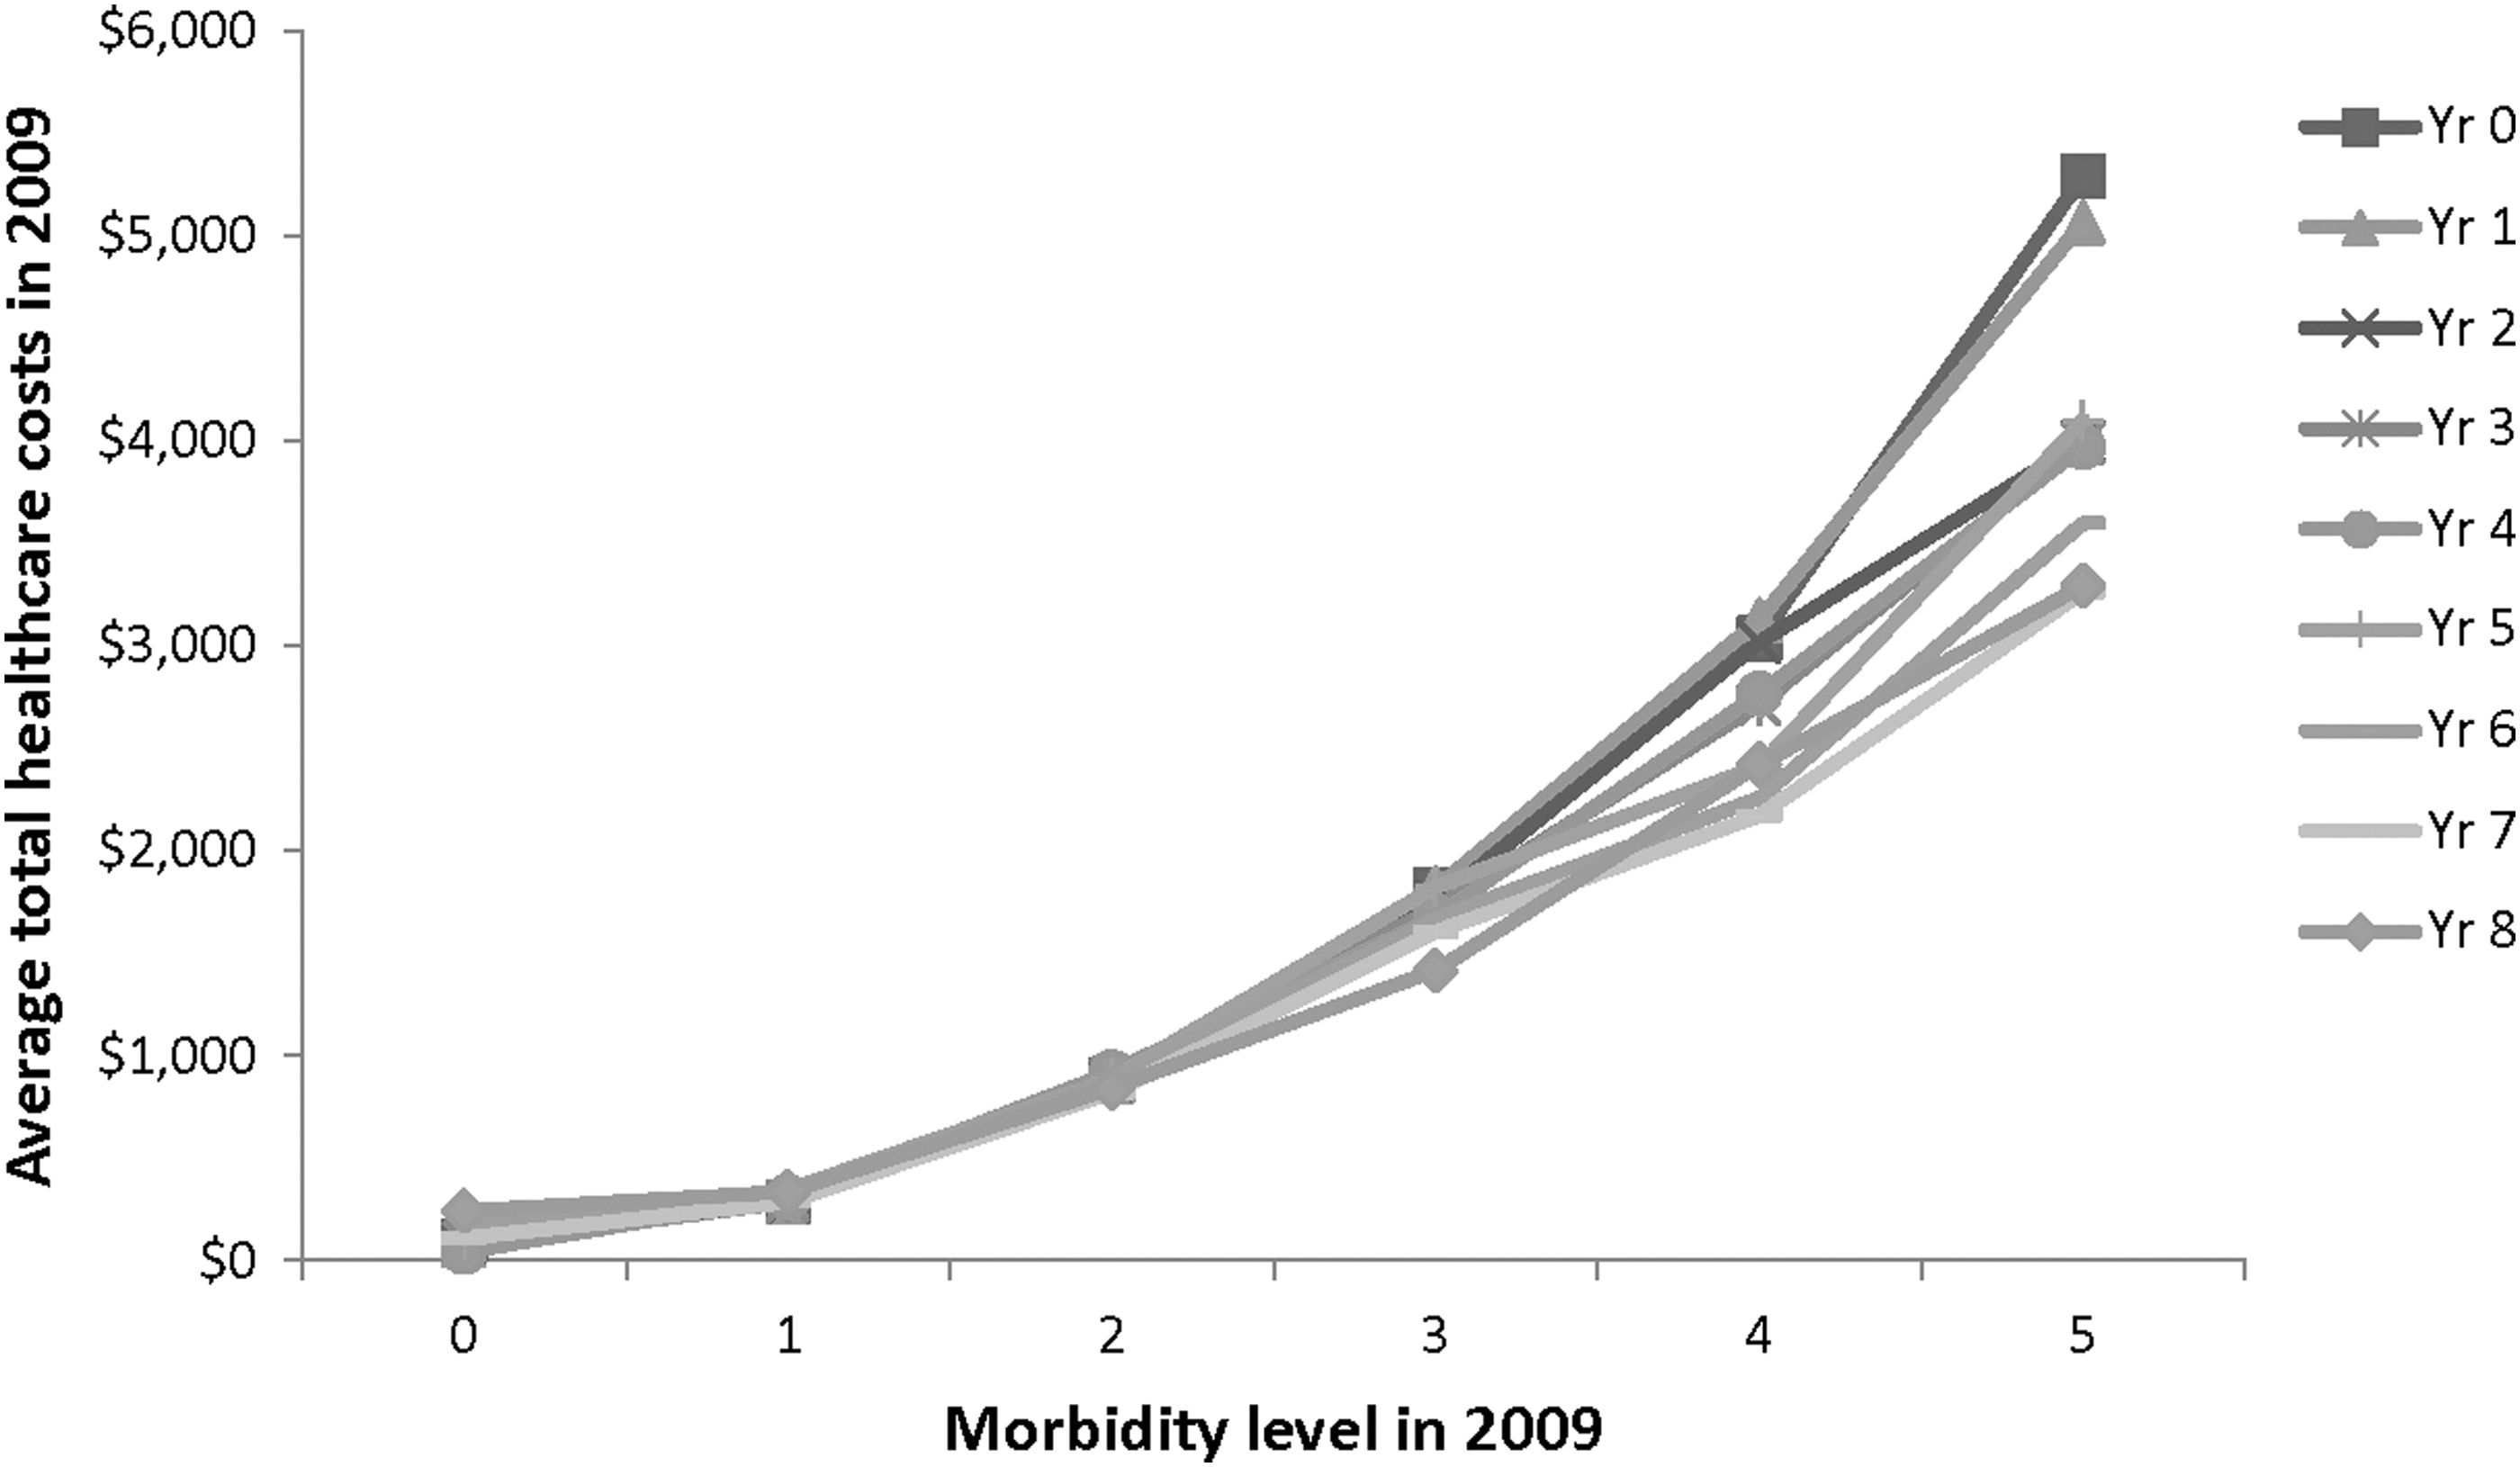
2009 health care costs (among members with 2009 costs>$0) on 2009 morbidity and number of years of wellness program participation. Note: Health care costs include inpatient, outpatient, medical, and pharmacy costs. Data were derived from members with 2009 total health care costs>0. Members who had conflicting sex in multiple data sets, who reported being pregnant, or more than 365 total inpatient days in any 1 year were excluded. Savings were adjusted for sex, age, morbidity in 2002, and total health care cost in 2002. The 2009 health care costs were significantly different by number of participation year (F(8, 159912)=2.67, P=.006), by 2009 morbidity levels (F(5, 159912)=1411.36, P<.0001), and by the interaction of number of participation year and 2009 morbidity levels (F(40, 159912)=3.41, P<.0001).
Discussion
The traditional medical establishment, with its effective emphasis on acute care, cannot be expected to solve the health care crisis alone. Nor will the evidence base for population health programming be built through the conduct of traditional randomized clinical trials. 32 However, an evidence base must be built nonetheless and such evidence certainly should include real-world demonstration of the sustainability of population health programming. As part of a logic map (Figure 6) that guides the development of a leading and lagging indicator framework, such evidence should address participation, behavior change, risk modification and economic outcomes. This study sought to contribute to building that evidence base by examining 8 years of economic and utilization data in a cohort of program participants and a matched set of nonparticipants. The findings here do not and are not intended to provide a comprehensive evaluation of each proof point in the map but rather to begin to fill in puzzle pieces of and support for portions of this logic map.
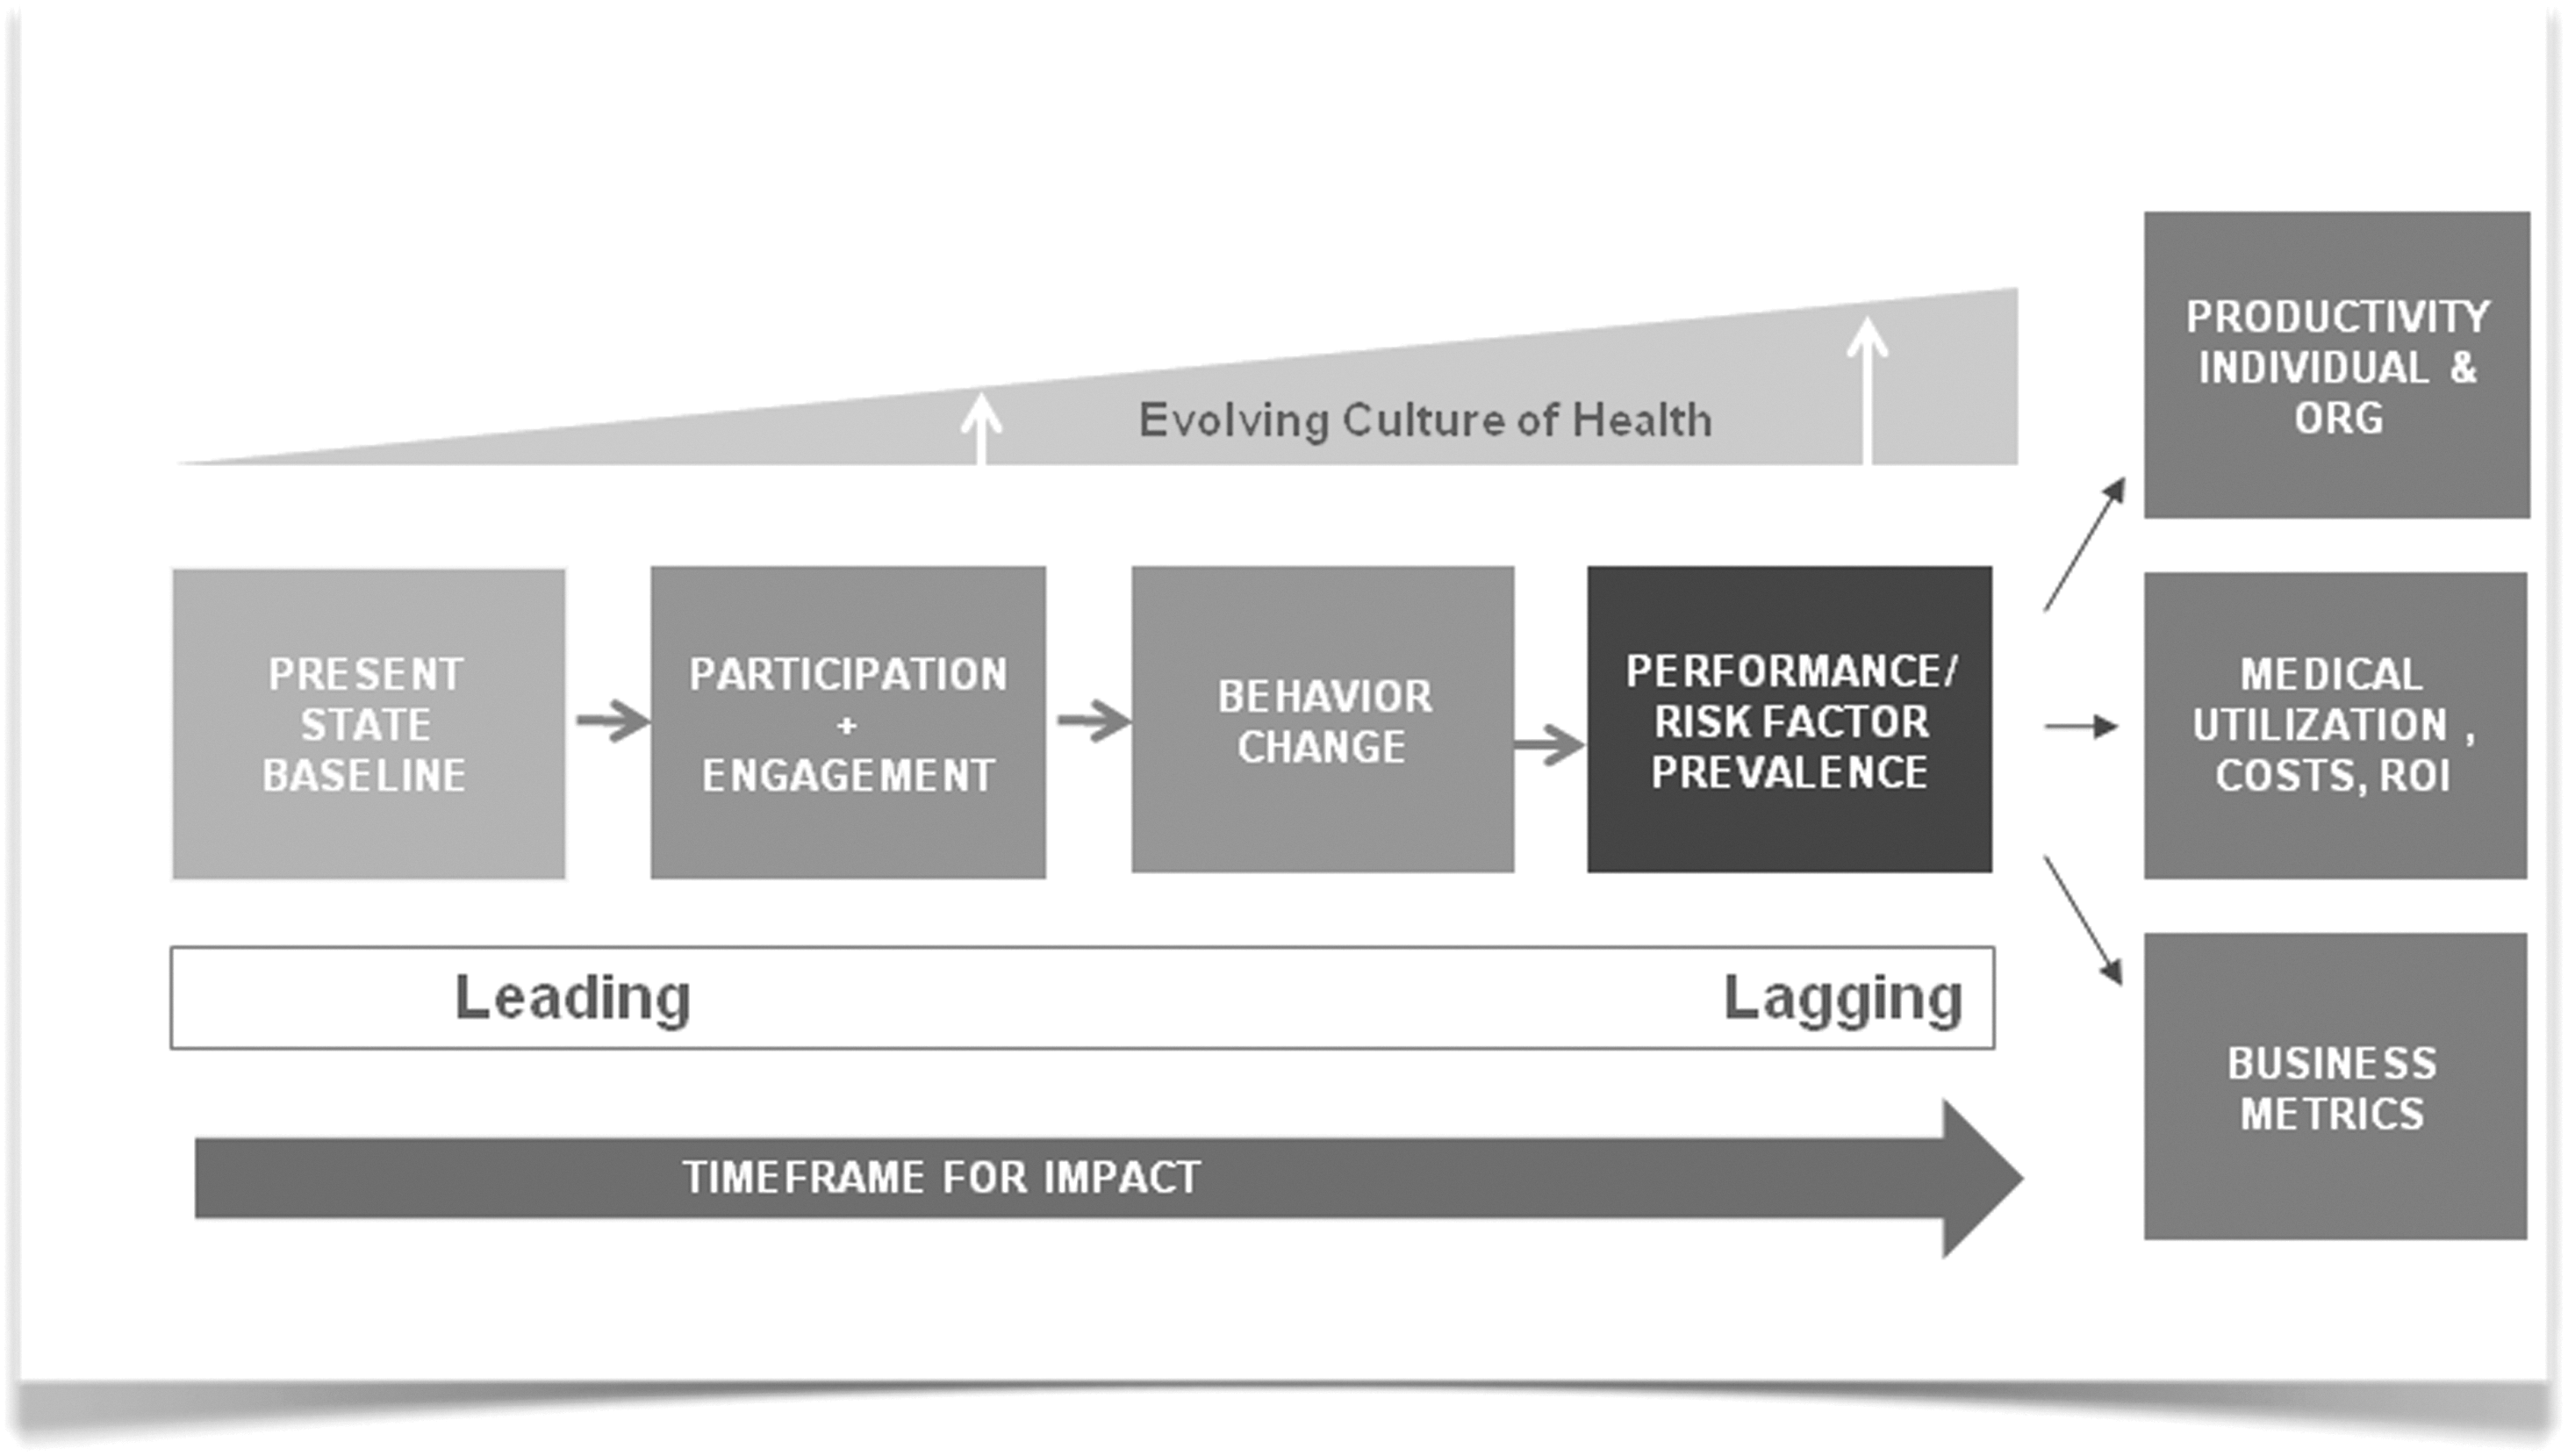
Logic map.
This study posed several questions of these data. Who are program participants? How do they differ from nonparticipants? Participants tended to be female; a finding consistent with a robust literature that supports the notion that women are more active consumers of health information. 33 Importantly, there are reasons to believe that gender-specific messaging may help with the participation of both sexes. Participants also tended to be older. However, given the power of the test in large samples such as those used here and the small mean arc differences, it is unlikely that this finding has meaningful implications for how one might develop and/or implement program elements.
For every evaluation year of the program, participants received higher morbidity scores relative to nonparticipants, suggesting that the program was used by individuals with significant need. This runs contrary to the common argument that the “worried well” are overrepresented as participants in wellness programs. However, this finding is consistent with what is known about illness behavior 34 and the health belief model. 35 In other words, signs, symptoms, and reduced functionality often serve as motivators for seeking information, skills, treatment, and, ultimately, relief from the consequences of reduced health.
The research team also wanted to ask a couple of related questions such as What are the estimated economic/cost benefits and ROI of the program over time? How does participant utilization and cost compare with that of nonparticipants?
The findings presented here indicate a positive ROI for each program year with ratios ranging from a low of 1.16:1 to a high of 2.83:1. The average ROI collapsed across all 8 years was 2.02:1. The 2009 ROI approximated over $6 million in total savings. Further, data indicated that for a secondary cohort there was a strong positive change in health care expenditures (ie, bending the trend) 30 associated with the index year of participation relative to a “never participated” matched comparison cohort. The pattern of utilization also was different for the 2 cohorts. Participants were more likely to make a claim in any given year but nonparticipants had a disproportionate pattern of utilization in the cost categories of hospital admissions, average LOS, total annual inpatient days, and pharmacy. When one considers the overhead program costs that were included in the program cost adjustments (ie, salaries, benefits, employer taxes, state excise taxes, medical supplies, office supplies, printing, postage and freight, utilities and telephone, furniture and equipment expense, occupancy expenses, professional services, advertising/promotion, insurance, travel, depreciation and amortization, data processing, software purchases, general administrative expenses that include human resources, legal, accounting, and administrative services) this constitutes a fully burdened (conservative) ROI analysis.
In order to test whether or not participants dropped out when they became sick, 2 cohorts with 5 years of claims data were compared. The first 3 years were used as baseline data for matching purposes. Year 4 was the participation year. Year 5 was the year that differentiated the 2 groups into participants who dropped out after taking the program, and participants who were still in the program in Year 5.
Propensity score matching was used to match the 2 groups on sex, age, morbidity in the previous 3 years (Year 1–Year 3), and total cost in the previous 3 years (Year 1–Year 3). Sex, age, and morbidity in the previous 3 years also were used as covariates in the model. When 2005 was the participation year, there was not a significant difference in medical costs between the 2 groups in 2006 (P=.367). This same nonsignificant difference was found when the participation year was 2006 (P=.807), 2007 (P=.260), and 2008 (P=.930). These findings suggest there was no significant difference between participants who dropped out versus those who remained in the wellness program.
In addition to health care claim costs, health-related productivity cost savings is well established 36–37 as an important component of ROI analyses. Although information on productivity was obtained from program participants, this information was not available for nonparticipants and comparative analyses could not be performed on health-related productivity cost savings. The health plan-focused nature of this project directed attention more closely to claims-related costs.
Finally, one last question posed was whether there was a relationship between cost, utilization, and degree of program engagement. There was a strong linear association between the number of program participation years and total health care costs, regardless of whether total costs across all members or total costs for a subcohort who had incurred 2009 costs were used in the analyses. The ROI value becomes more pronounced with higher levels of baseline morbidity.
This study, like all studies, has some notable limitations. First, the study was a retrospective cohort analysis without the benefit of random assignment to the treatment/comparison groups or even an a priori set of questions or hypotheses from the outset of data collection. As such, selection bias remains a primary potential threat to internal validity. Participants and nonparticipants did differ significantly on several key demographic variables that are worthy of methodological control, but these same constructs also may have implications for future program development and recruitment. However, in order to better equate groups, the research team matched cohorts statistically using propensity score matching 25 –28 and further controlled group differences with covariate statistical adjustment. Because this analysis is taking into account the inherent self-selection bias in nonrandomized participation in wellness programs, the research team believes that it represents a rigorous, albeit imperfect test of ROI given the limitations of this retrospective methodology.
Another limitation is a lack of specific health plan product data for each individual throughout the 8-year time period. Therefore, analyses regarding the impact of shifting among plan designs, differences in plan payments, and members' out-of-pocket payments for the different health plan types could not be performed. There is also a relative paucity of non-claims-related data (ie, behavioral, psychographic) for the nonparticipants. In particular, the lack of psychographic and behavioral data limits the ability to detail how the 2 samples may have differed in terms of psychological, attitudinal, or behavioral constructs that are known to mediate health behavior, risk profiles, utilization, and claims patterns. In addition, biometric data were not collected from nonparticipants, so it was not possible to analyze the impact of program participation on potential biometric changes.
Finally, this study suffers from the “black box” problem in that one cannot attribute change to any specific program element, nor can one assure that the program was consistently applied within or across the years represented in this article. There are ways to address these problems in prospective studies where methodological approaches such as dismantling or statistical approaches such as structural equation modeling can tease apart the relative strength of the program's “active ingredients.” However, these methods likely would provide little information on sustainability. Traditional randomized controlled trial methods are expensive and impractical for comprehensive outcomes study. Program evaluation methods 38 that start with functional logic maps, such as the one used here, coupled with sophisticated model building analytical tools are perhaps better suited to this task.
Despite these challenges and the documented variability in methodologies and analytical approaches in the literature, an evidence base continues to build with the general trend suggesting that when properly promoted and implemented, such population health-focused programming can result in both clinical and economic value. However, several significant and related challenges face population health management programming. The first is the magnitude of the problem. Health care faces an aging population, followed by a youth increasingly at risk for morbid obesity and all that entails, both biologically and behaviorally. Second is the relevance of behavior and behavior change technologies for optimizing health and well-being. Much of the developing risk is driven by modifiable psychological and behavioral habits that center largely on activity, diet, and varying forms of psychological distress. Unfortunately, traditional approaches to providing intervention to modify behavior and lifestyle do not scale sufficiently (there is a paucity of available expertise and resources at all levels of care to meet the demand). The challenge of scalability is the delivery of high-quality services to address the range of behavioral habits, problems, and attitudes in the service of health and well-being. Face-to-face and telephonic services will always have a place in the continuum of care but, given the growing demand, new and novel methods of service delivery must be developed that are economically sustainable and that address the needs of the most people possible.
High technologies in the form of Web interventions, telemedicine, mobile messaging, online health information, and mobile telemetry among others, have been cited as potential solutions to the challenges of both scale and sustainability. 39 They are occasionally offered as freestanding interventions but more often coupled with other services (eg, face-to-face counseling, home visits, telephonic support) and are part of a continuum of care approach. Such technology, thoughtfully applied, can foster greater participation in self-care across the health spectrum as the industry moves toward a patient-centered model of care. What remains to be seen is how best to use these mediums to deliver content that represents a true intervention as opposed to simply providing, via a novel medium, the same old health information and content that has been demonstrated to be necessary but insufficient to change health behavior.
Footnotes
Author Disclosure Statement
Drs. Schwartz and Mason, Ms. Wang, Ms. Pomana, Ms. Hyde-Nolan, and Mr. Carter are/were employees of Wellness & Prevention Inc. during the preparation of manuscript. They declared no conflicts of interest with respect to the research, authorship, and/or publication of this article.